Abstract
Examining the ecology quality of the Pan-Third Pole region has implications for global environmental change and sustainable development. However, spatio-temporal evolution of ecological quality in this region is still lacking. In this study, 65 countries of the Pan-Third Pole region were selected. A comprehensive evaluation index system of ecological quality was constructed using a dataset containing remote sensing, ecological environment and socio-economic data to spatially quantify the ecological quality, as well as its change from 2000 to 2020. The results displayed that the average ecological quality of the Pan-Third Pole region was at a moderate level of 0.53. Spatially, the excellent ecological quality regions were mainly concentrated in East Asian countries, while the severe quality regions were located in the Middle East. From 2000–2020, areas with improved ecological changes accounted for 38.48% of the total area, and 10.66% of the total area experienced a decline; specifically, European countries had a large proportion of improved ecological quality areas, while East Asian countries had a significantly larger proportion of declining ecological quality areas. We also found that ecosystem changes and human activities had an influence on ecological quality in the Pan-Third Pole region. This study provides an important empirical study on ecosystem services in the region.
1. Introduction
Ecological quality has implications not only for the conservation of biodiversity, but also for human survival and human well being [1,2,3]. Along with global climate change and increased intensity of human activities, environmental problems, such as biodiversity decay, vegetation degradation, and extreme weather, occur frequently due to the deterioration of ecological quality, which severely impact people’s normal lives [4,5,6,7]. The Pan-Third Pole region is one of the most ecologically vulnerable areas on Earth due to its unique geographical features, such as wide area coverage, altitude, and topography [8]. This area is sensitive to human activities, and excessive human activities can cause irreversible changes to the environment [9,10,11]. Since China proposed the Belt and Road Initiative in 2013, exchanges among countries in the Pan-Third Pole region have become increasingly frequent, and the flow of population and the intensity of human activities have increased. Therefore, the changes in its ecology are of worldwide concern [8,12,13]. Studies have shown that with global warming, the Pan-Third Pole region is warming at a rate more than double the global average, resulting in the retreat of glaciers, frequent floods, and aggravated desertification, which seriously threatens the environment of the region [12,14,15,16,17,18].
The Pan-Third Pole region is the area with the fastest growth in urban population and accelerated urbanization in the world [19,20]. Stronger human activities, such as air pollution, greenhouse effect, and land use change, have had an impact on the region. [19,21]. In 2016, the international community passed the New Urban Agenda to use the power of sustainable urbanization to realize the global goal of building peaceful, prosperous societies on a healthy planet [22]. Building resilient cities is at the heart of sustainable urbanization [22]. Therefore, measures to maintain the balance between humans and nature, ensure ecological well being, and create livable environments for humans in the process of urban development are worthy of deep thought.
The earliest studies on ecological quality began in the 1960s [23,24]. The United Nations Statistical Office then developed a general framework for environment statistics in the 1970s [25]. In the following decade, the Organization for Economic Cooperation and Development (OECD) established a system of urban ecosystem indicators based on the Pressure–State–Response (PSR) model to measure the interaction between humans and environmental quality [26,27]. The United Nations Commission on Sustainable Development (UNCSD) and the United Nations Department for Policy Coordination and Sustainable Development (DPCSD) jointly proposed the Driving Force–State–Response (DSR) model in the middle of the 1990s, emphasizing the relationship between environmental degradation and ecological stress [27,28,29,30]. The PSR model and the DSR model were then combined into the Driving Force–Pressure–State–Impact–Response Framework to describe the relationship between human activities and the ecological environment [25]. Domestic studies on ecological quality have been conducted more recently than foreign studies. At present, the remote sensing ecological index model (RSEI) [31,32], ecological index model (EI) [33], and ecological quality index model (EQI) [34] established by using GIS and RS technology are often used in ecological quality evaluation. After the differences between the methods were compared, and the characteristics of the study area were considered, we then decided to combine GIS and RS technology to build an evaluation index system of ecological quality to calculate the ecological quality index (EQI).
Currently, studies on the Pan-Third Pole region are focused on two main areas. On the one hand, since the Pan-Third Pole region overlaps highly with the core area of the Belt and Road Initiative, most studies have used the Belt and Road region as the study area to investigate land cover change [35,36], ecosystem health [37], human activities [38] and sustainable development [39,40] of the whole region or individual countries. On the other hand, the impacts of climate change [12,41,42] and urbanization changes [19,21] in the Pan-Third Pole region were also studied by some scholars. Nevertheless, the existing studies were still inadequate. On the one hand, in terms of natural conditions, the Pan-Third Pole region not only contains many mountain ranges, such as the Tibetan Plateau, the Pamir Plateau, and the Iranian Plateau, but also has various ecosystem types, such as deserts, forests, grasslands, and glaciers [8]. On the other hand, from the social conditions, the Pan-Third Pole region not only has large population countries, such as China and India, but also includes developed, developing, and less developed countries. In spite of these factors, few studies have considered the differences between countries, or taken both natural and social conditions into account when analyzing ecological quality. Therefore, this study hopes to fill the gap in this area and provide a reference for subsequent studies.
The objective of this study is to analyze the spatial and temporal characteristics of ecological quality in the Pan-Third Pole region, hoping to serve the sustainable development of the region. In this study, remote sensing data were used for information extraction and inversion, and ecosystem patterns, vegetation cover, night lighting, atmospheric environment, and socio-economic indicators were used to construct the evaluation index system of ecological quality. The analytic hierarchy process and Delphi method were combined to determine the weights of each criterion layer and index layer. Changes in ecological quality in the Pan-Third Pole region from 2000 to 2020 were analyzed and evaluated at regional and national scales. The changes in ecological quality level and dynamic trends of the Pan-Third Pole region were described, and the influencing factors of ecological quality changes were examined.
2. Materials and Methods
2.1. Study Area and Data Source
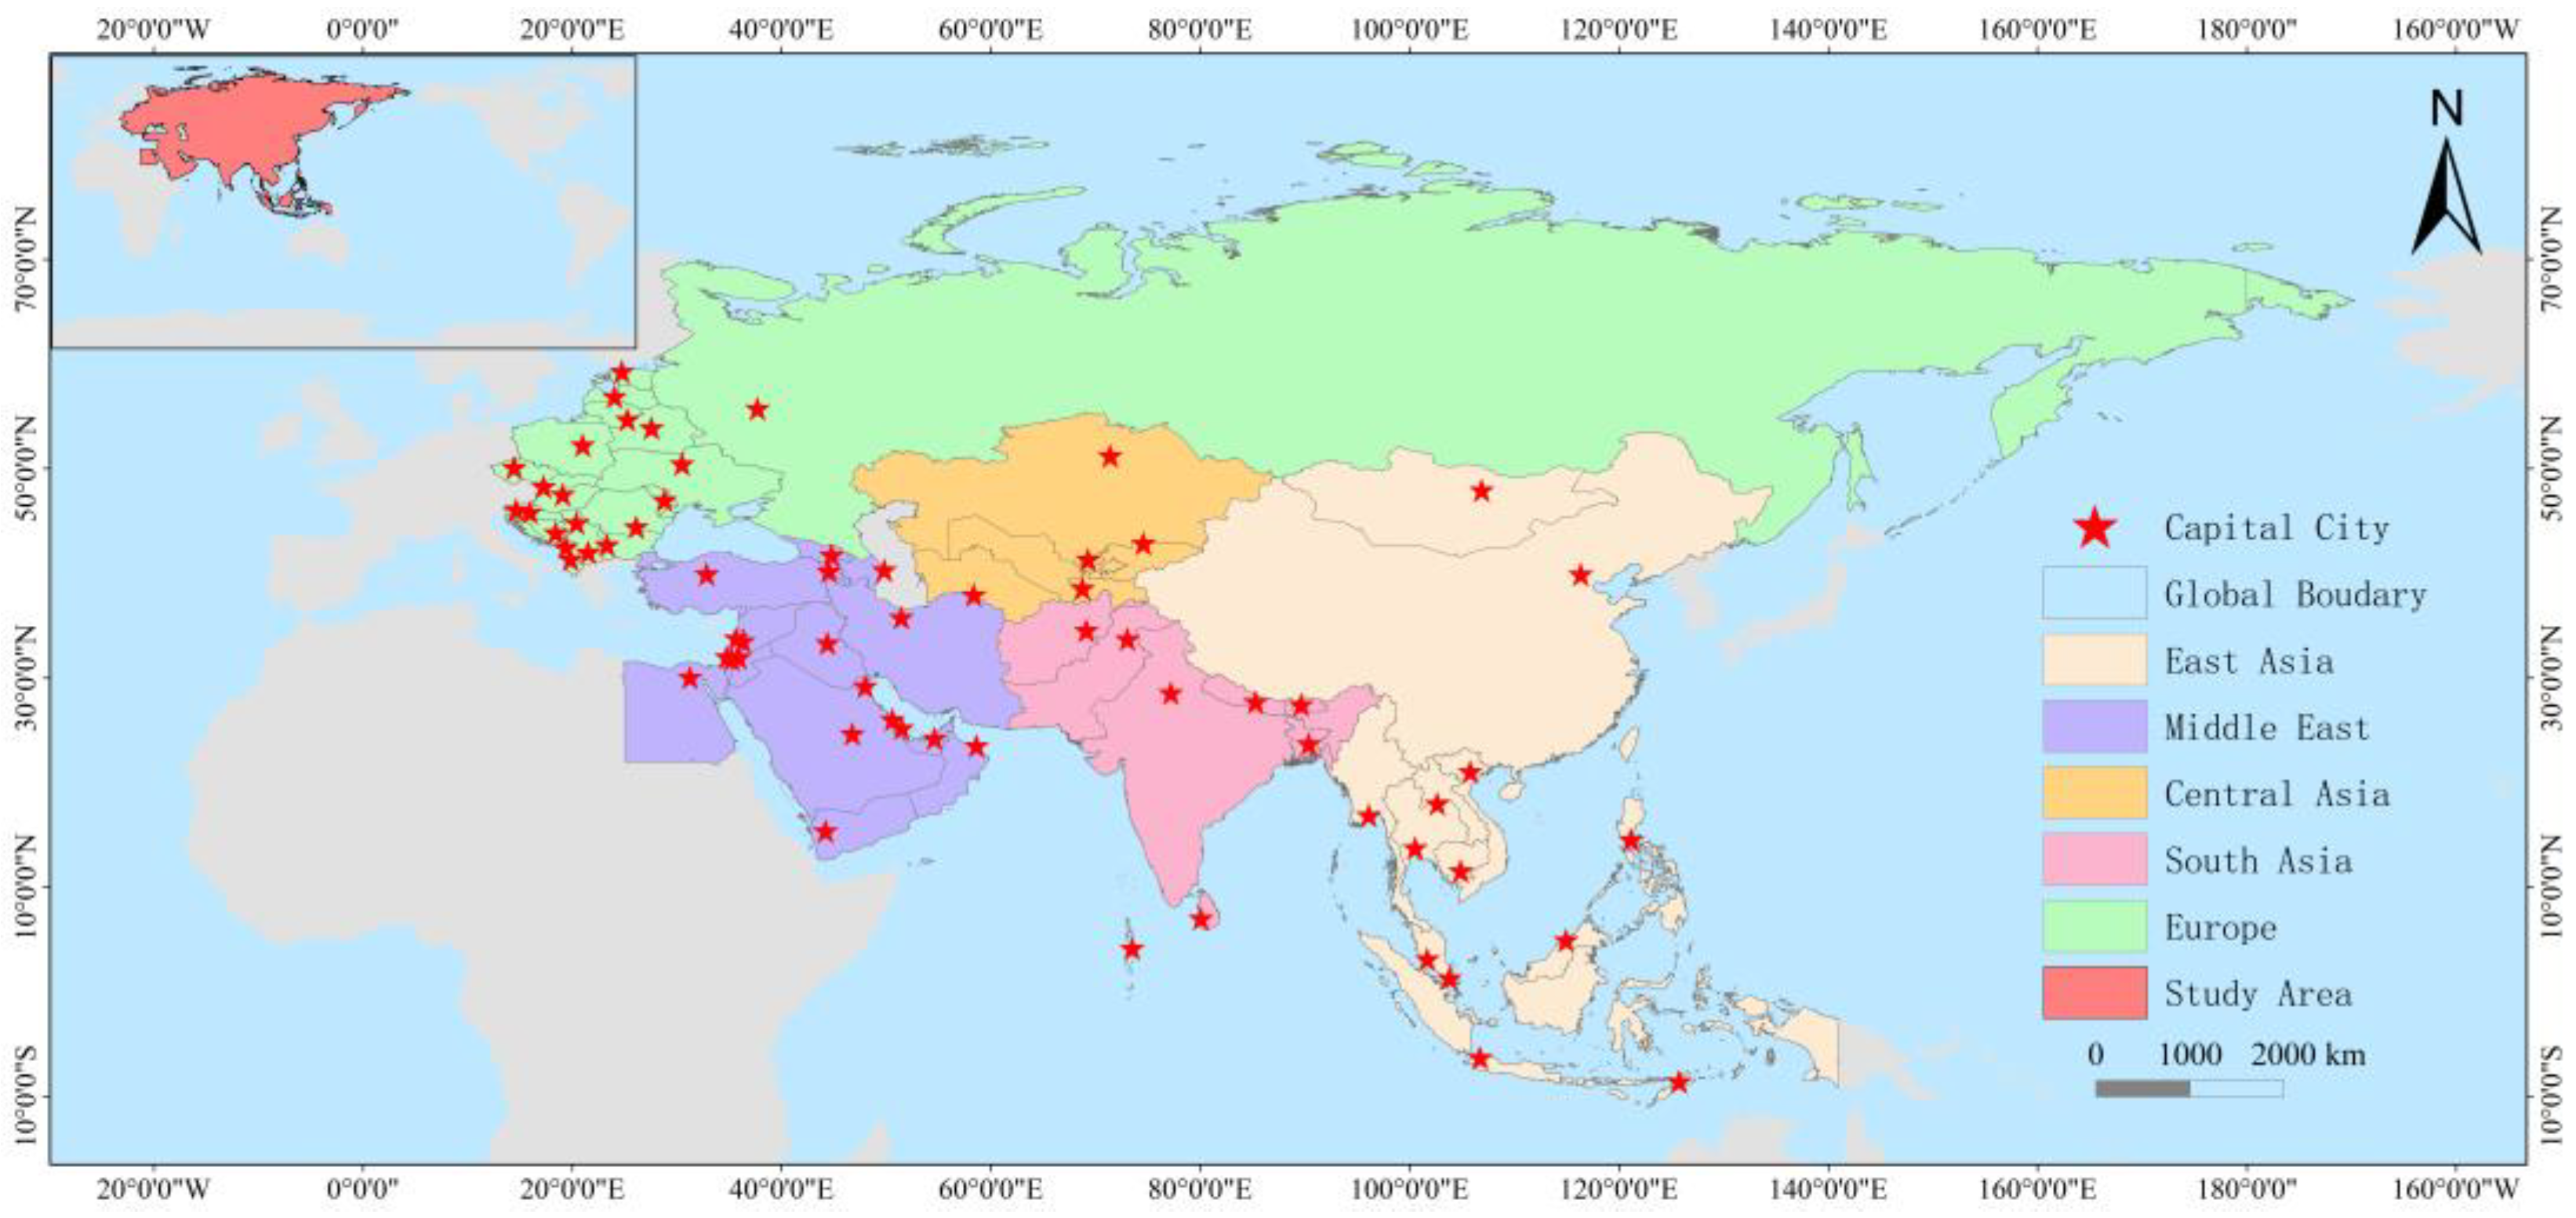
The Pan-Third Pole region is located in the hinterland of the Eurasian continent, with the third pole of the Earth, the Qinghai–Tibet Plateau, as the core, spreading in all directions, including Europe, East Asia, Central Asia, South Asia, and the Middle East [8,19,21,42]. The landforms in the region are complex, including plateaus, plains, mountains, hills, glaciers, and deserts. The Pan-Third Pole region comprises 65 countries, most of which are economies in transition and developing countries. The total land area of the region is about 49.46 million km2, the total population is about 4.7 billion people, and the economic aggregate is about 3 billion dollars. Limited by the level of development, the per capita GDP of many Pan-Third Pole countries is lower than the world average [13]. 65 countries in the Pan-Third Pole region were used as the objects of the study, and were analyzed at both the regional and national scales. The location of the Pan-Third Pole region and the countries in different geographical zones throughout the Pan-Third Pole region are shown in Figure 1 and Table 1.
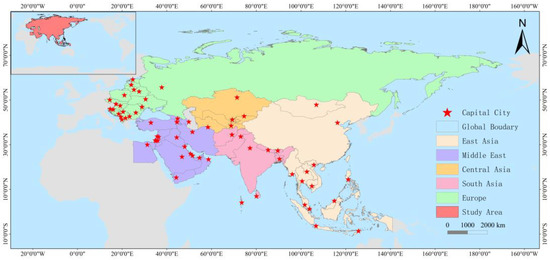
Figure 1.
Location of the Pan-Third Pole region.

Table 1.
The countries in different geographical zones throughout the Pan-Third Pole region.
The data used in this study mainly included remote sensing data, ecological and environmental data, basic geographic data, and socio-economic data. Remote sensing data were obtained from DMSP/OLS and MODIS data. Ecological and environmental data included ESA global land cover data, air pollution data, and water pollution data. The basic geographic data included administrative boundaries, urban distribution, and urban impervious surface area of the Pan-Third Pole region. Socio-economic data included population data and road data for the Pan-Third Pole region. The details of the above data are shown in Table 2.

Table 2.
Detail of the data used in this study.
2.2. Construction of the Index System
Based on the literature analysis and expert opinions, a comprehensive evaluation index system of Pan-Third-Pole ecological quality was constructed from four dimensions, including ecosystem structure, ecological health status, comprehensive environmental impact, and social and economic vitality. The principles of scientificity, representativeness, accessibility, measurability, and independence were followed in the selection of indicators. The ecosystem structure was measured in terms of the proportion of natural ecosystem area [43] and the proportion of urban impervious surface area; the ecological health was gauged in terms of net primary productivity [44] and vegetation cover [45]; the integrated environmental impact consisted of atmospheric and water pollution [46]; and the socioeconomic vitality was expressed through road density [47] and night lights [48,49]. Finally, a comprehensive evaluation index system of the Pan-Third Pole ecological environment was formed, which consisted of 4 primary indicators and 8 secondary indicators, and the weight of each indicator was determined by the comprehensive index method and the expert scoring method [19,39,48,50]. The index system is shown in the Table 3.

Table 3.
Comprehensive evaluation index system of ecological quality in the Pan-Third Pole region.
2.3. Calculation Method of Ecological Index
2.3.1. Standardization of Indicators
Due to the dimensional and unit differences among the evaluation indexes, the original value could not be used directly for calculations. Therefore, it was necessary to standardize the data according to the positive and negative effects of the original indicators, using the maximum and minimum standardization method [10,51]. The calculation equation is as follows.
Positive indicator:
Negative indicator:
where, is the normalized value of the indicator , which is taken as 0~1; X is the original value of the indicator ; is the minimum value of the indicator ; is the maximum value of the indicator .
2.3.2. Calculation of the Ecological Quality Index
After the indicators were normalized to 0~1, the ecological quality index (EQI) was calculated using Equation (3). The equation is as follows.
where is the ecological quality index; is the combined weight of the indicator ; is the normalized value of the indicator .
Based on the practical significance and score characteristics of indicators in the Pan-Third Pole region, the classification ranges of the EQI were determined through the calculation and analysis, and are shown in Table 4.

Table 4.
Classification ranges of EQI.
2.3.3. Calculation of the Ecological Change Index
Through the difference analysis of the 2000 ecological quality index and the 2020 ecological quality index of the Pan-Third Pole region, the ecological change index (ECI) of the Pan-Third Pole region was obtained by using Equation (4). The equation is as follows.
where is the ecological change index; is the ecological quality index of 2020; is the ecological quality index of 2000.
According to the changing characteristics of ecological quality in the Pan-Third Pole region, the classification range of ECI was determined by calculation and analysis, as shown in Table 5.

Table 5.
Classification ranges of ECI.
3. Results
3.1. Analysis of Ecological Quality Level Changes in the Pan-Third Pole Region
The ecological quality of the Pan-Third Pole region is mainly of “good”, “moderate”, and “worse” quality. There has been no significant change in the spatial distribution over the past 20 years. As shown in Figure 2 (the spatial distribution), the “good” quality regions were mostly distributed in comfortable climatic areas and coastal areas in southern East Asia and central and western Europe; the “moderate” quality regions were mainly located in northeastern Europe, central East Asia and most parts of Central Asia and South Asia, where plains and grasslands were predominant; while the “worse” quality regions were concentrated in desert areas with harsh climatic conditions in the Middle East, southwestern Central Asia and northwestern East Asia. The remaining quality regions were scattered (Figure 2).

Figure 2.
Spatial distribution of ecological quality levels in the Pan-Third Pole region (a) in 2000; (b) in 2020.
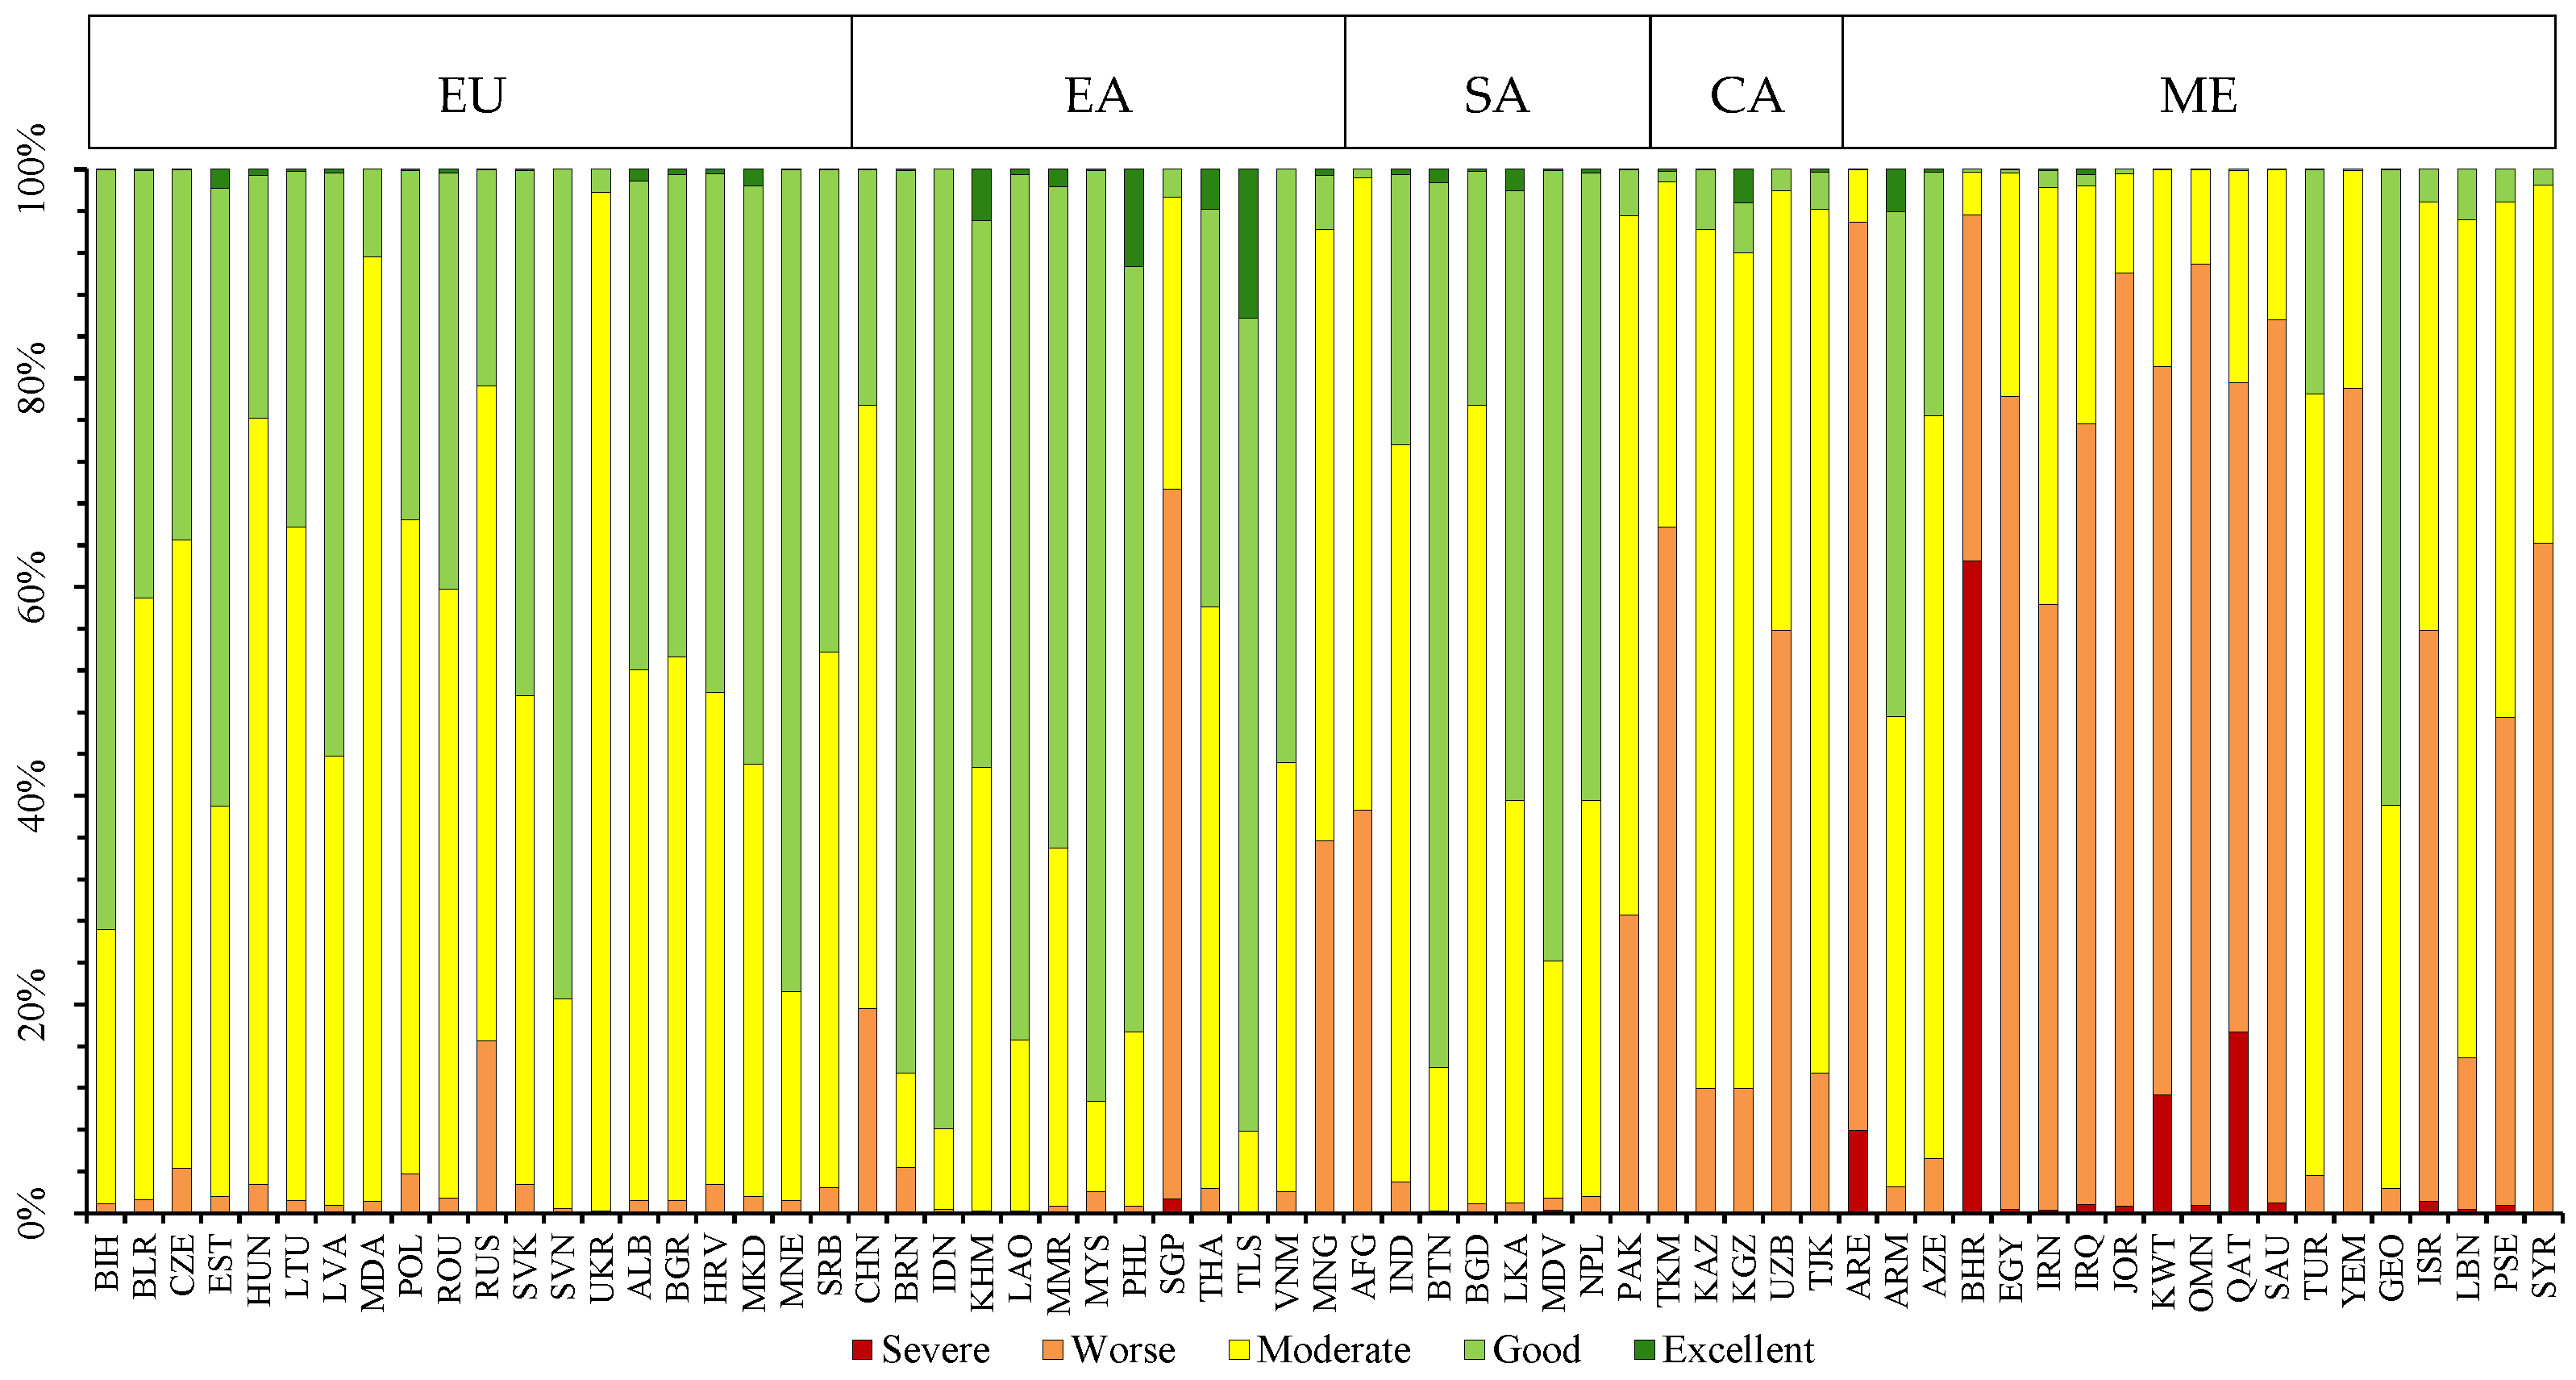
In 2020, the average EQI of 65 countries in the Pan-Third Pole region was 0.53, which is generally in the medium range. The “excellent” level of ecological quality was concentrated in East Asian countries, and the “good” and “moderate” ecological quality was relatively large in European, East Asian, and South Asian countries. Ecological quality in Central Asian and Middle Eastern countries was mostly “moderate” and “worse”, and the “severe” ecological quality was mainly distributed in Middle Eastern countries. It could be concluded that East Asia’s Timor-Leste, Philippines, and Cambodia had significantly larger shares of “excellent” quality areas than other countries, and accounted for 14.29%, 9.32%, and 4.89% of their total areas, respectively (Figure 3). The countries with the highest percentage of “good” ecological quality were Indonesia, Malaysia, and Brunei in East Asia, with 91.95%, 89.11%, and 86.43%, respectively. In the European region, most of Ukraine and Moldova were of the “moderate” quality level, with 97.63% and 90.51%, respectively. In the Middle East, Oman, Jordan, and the United Arab Emirates accounted for 90.23%, 89.42%, and 86.96% of the “worse” ecological quality, respectively. Among the 65 countries in the Pan-Third Pole region, Bahrain had the largest proportion of “severe” ecological quality, at 62.61% (Figure 3).
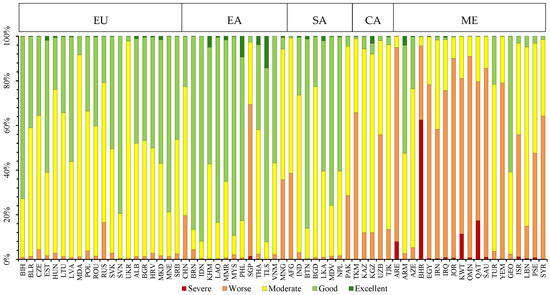
Figure 3.
The proportion of ecological quality of 65 countries in the Pan-Third Pole region in 2020.
The total area of ecological quality level change in the Pan-Third Pole region from 2000 to 2020 was 5.81 million km2, accounting for 11.76% of the total land area, of which the area of positive change was 3.46 million km2, accounting for 59.55% of the total change area. It was found that over the past 20 years, the area of “excellent” quality decreased by 0.03 million km2, the area of “good” quality increased by a net of 0.98 million km2, the area of “moderate” level decreased by 0.79 million km2, the net decrease of the area of “worse” level was 0.12 million km2, and the net decrease of the area of “severe” quality was 0.03 million km2 (Table 6). In general, the changes of ecological quality in the Pan-Third Pole region were dominated by bidirectional changes between “worse” and “moderate” quality and between “moderate” and “good” quality over the past 20 years.

Table 6.
Transfer matrix of different ecological quality level areas in the Pan-Third Pole region from 2000 to 2020 (Unit: million km2).
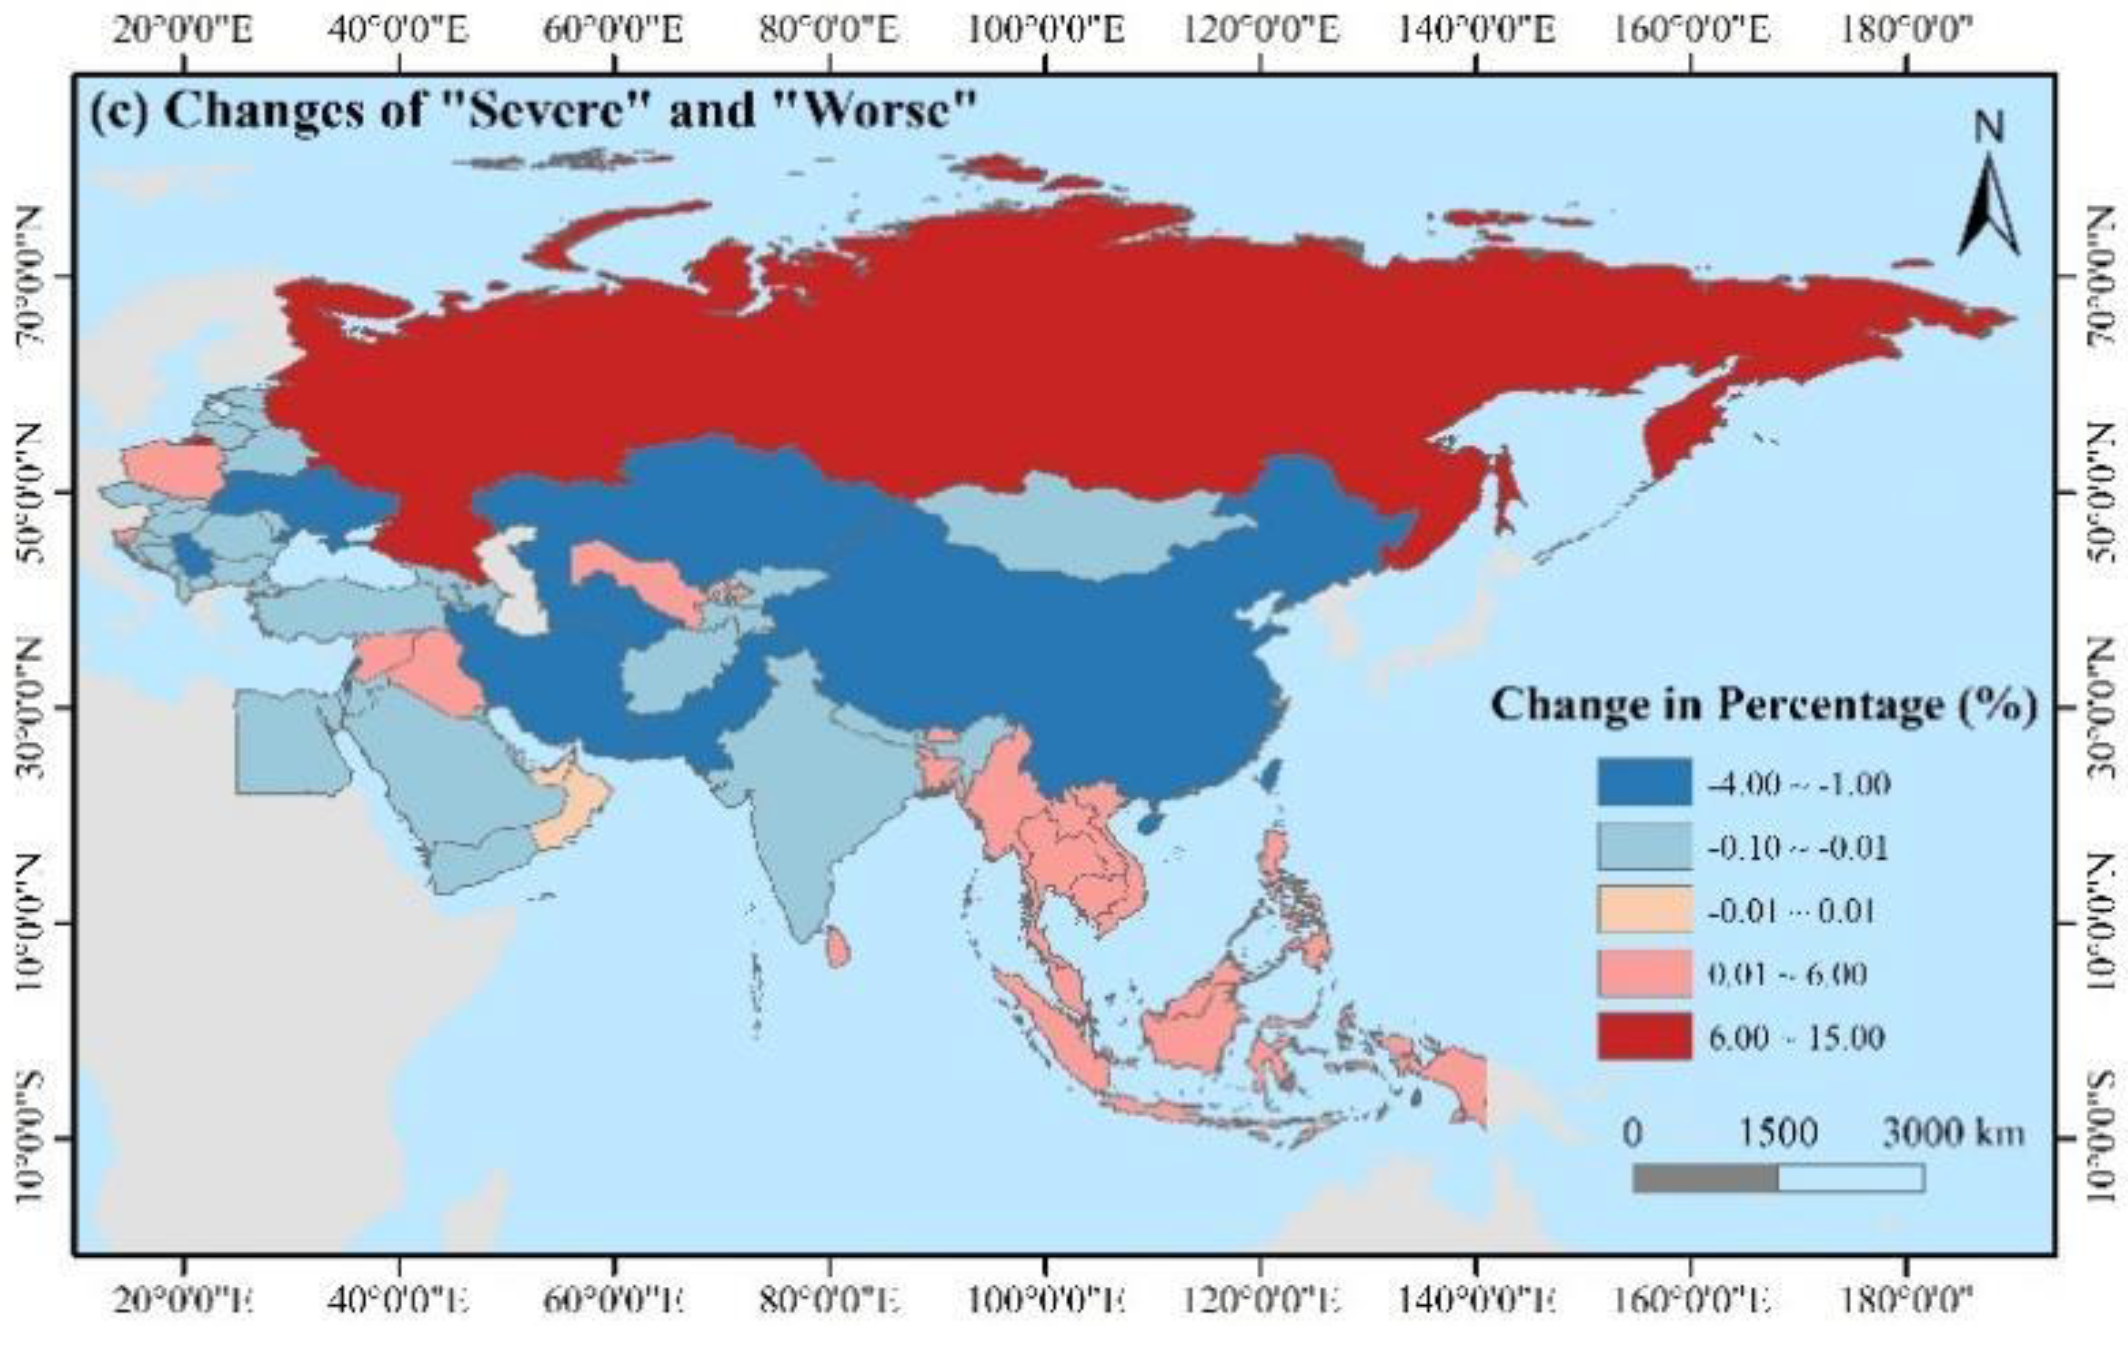
The share of “good” quality and above increased in countries of western Europe, South Asia, Central Asia and most of East Asia, and the most significant increases were seen in Armenia, Timor–Leste, and Bosnia–Herzegovina over the past two decades (Figure 4). In contrast, the share of countries in southern East Asia and central-eastern Europe decreased, with Ukraine having the most significant decrease (Figure 4a). Countries with an increased share of “moderate” quality were mainly located in Central Asia, the Middle East, Western South Asia, and Southern East Asia, while the rest of the countries showed a decreased share from 2000 to 2020. In contrast to the changes in the “good” and “excellent” quality, the share of “moderate” quality decreased significantly in Armenia, Timor–Leste, and Bosnia–Herzegovina, while the share of Ukraine increased significantly. It was noted that the share of “moderate” quality in Russia also decreased significantly (Figure 4b). As shown in Figure 4c, the southern East Asian countries and Russia were the countries where the share of “worse” quality and below increased more over the past 20 years. In contrast, Central Asia, Eastern Middle East countries, and China showed a larger reduction of the share, with Pakistan, Lebanon, and Iran seeing the largest reduction (Figure 4c).

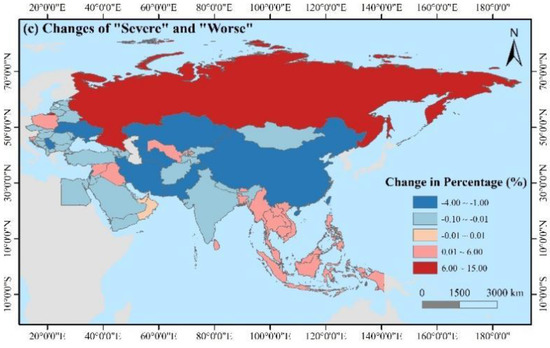
Figure 4.
(a) Changes of “good” and above ecological quality in 65 countries in the Pan-Third Pole region from 2000 to 2020; (b) Changes of “moderate” ecological quality in 65 countries in the Pan-Third Pole region from 2000 to 2020; (c) Changes of “severe” and “worse” ecological quality in 65 countries in the Pan-Third Pole region from 2000 to 2020.
3.2. Analysis of Ecological Changes in the Pan-Third Pole Regions
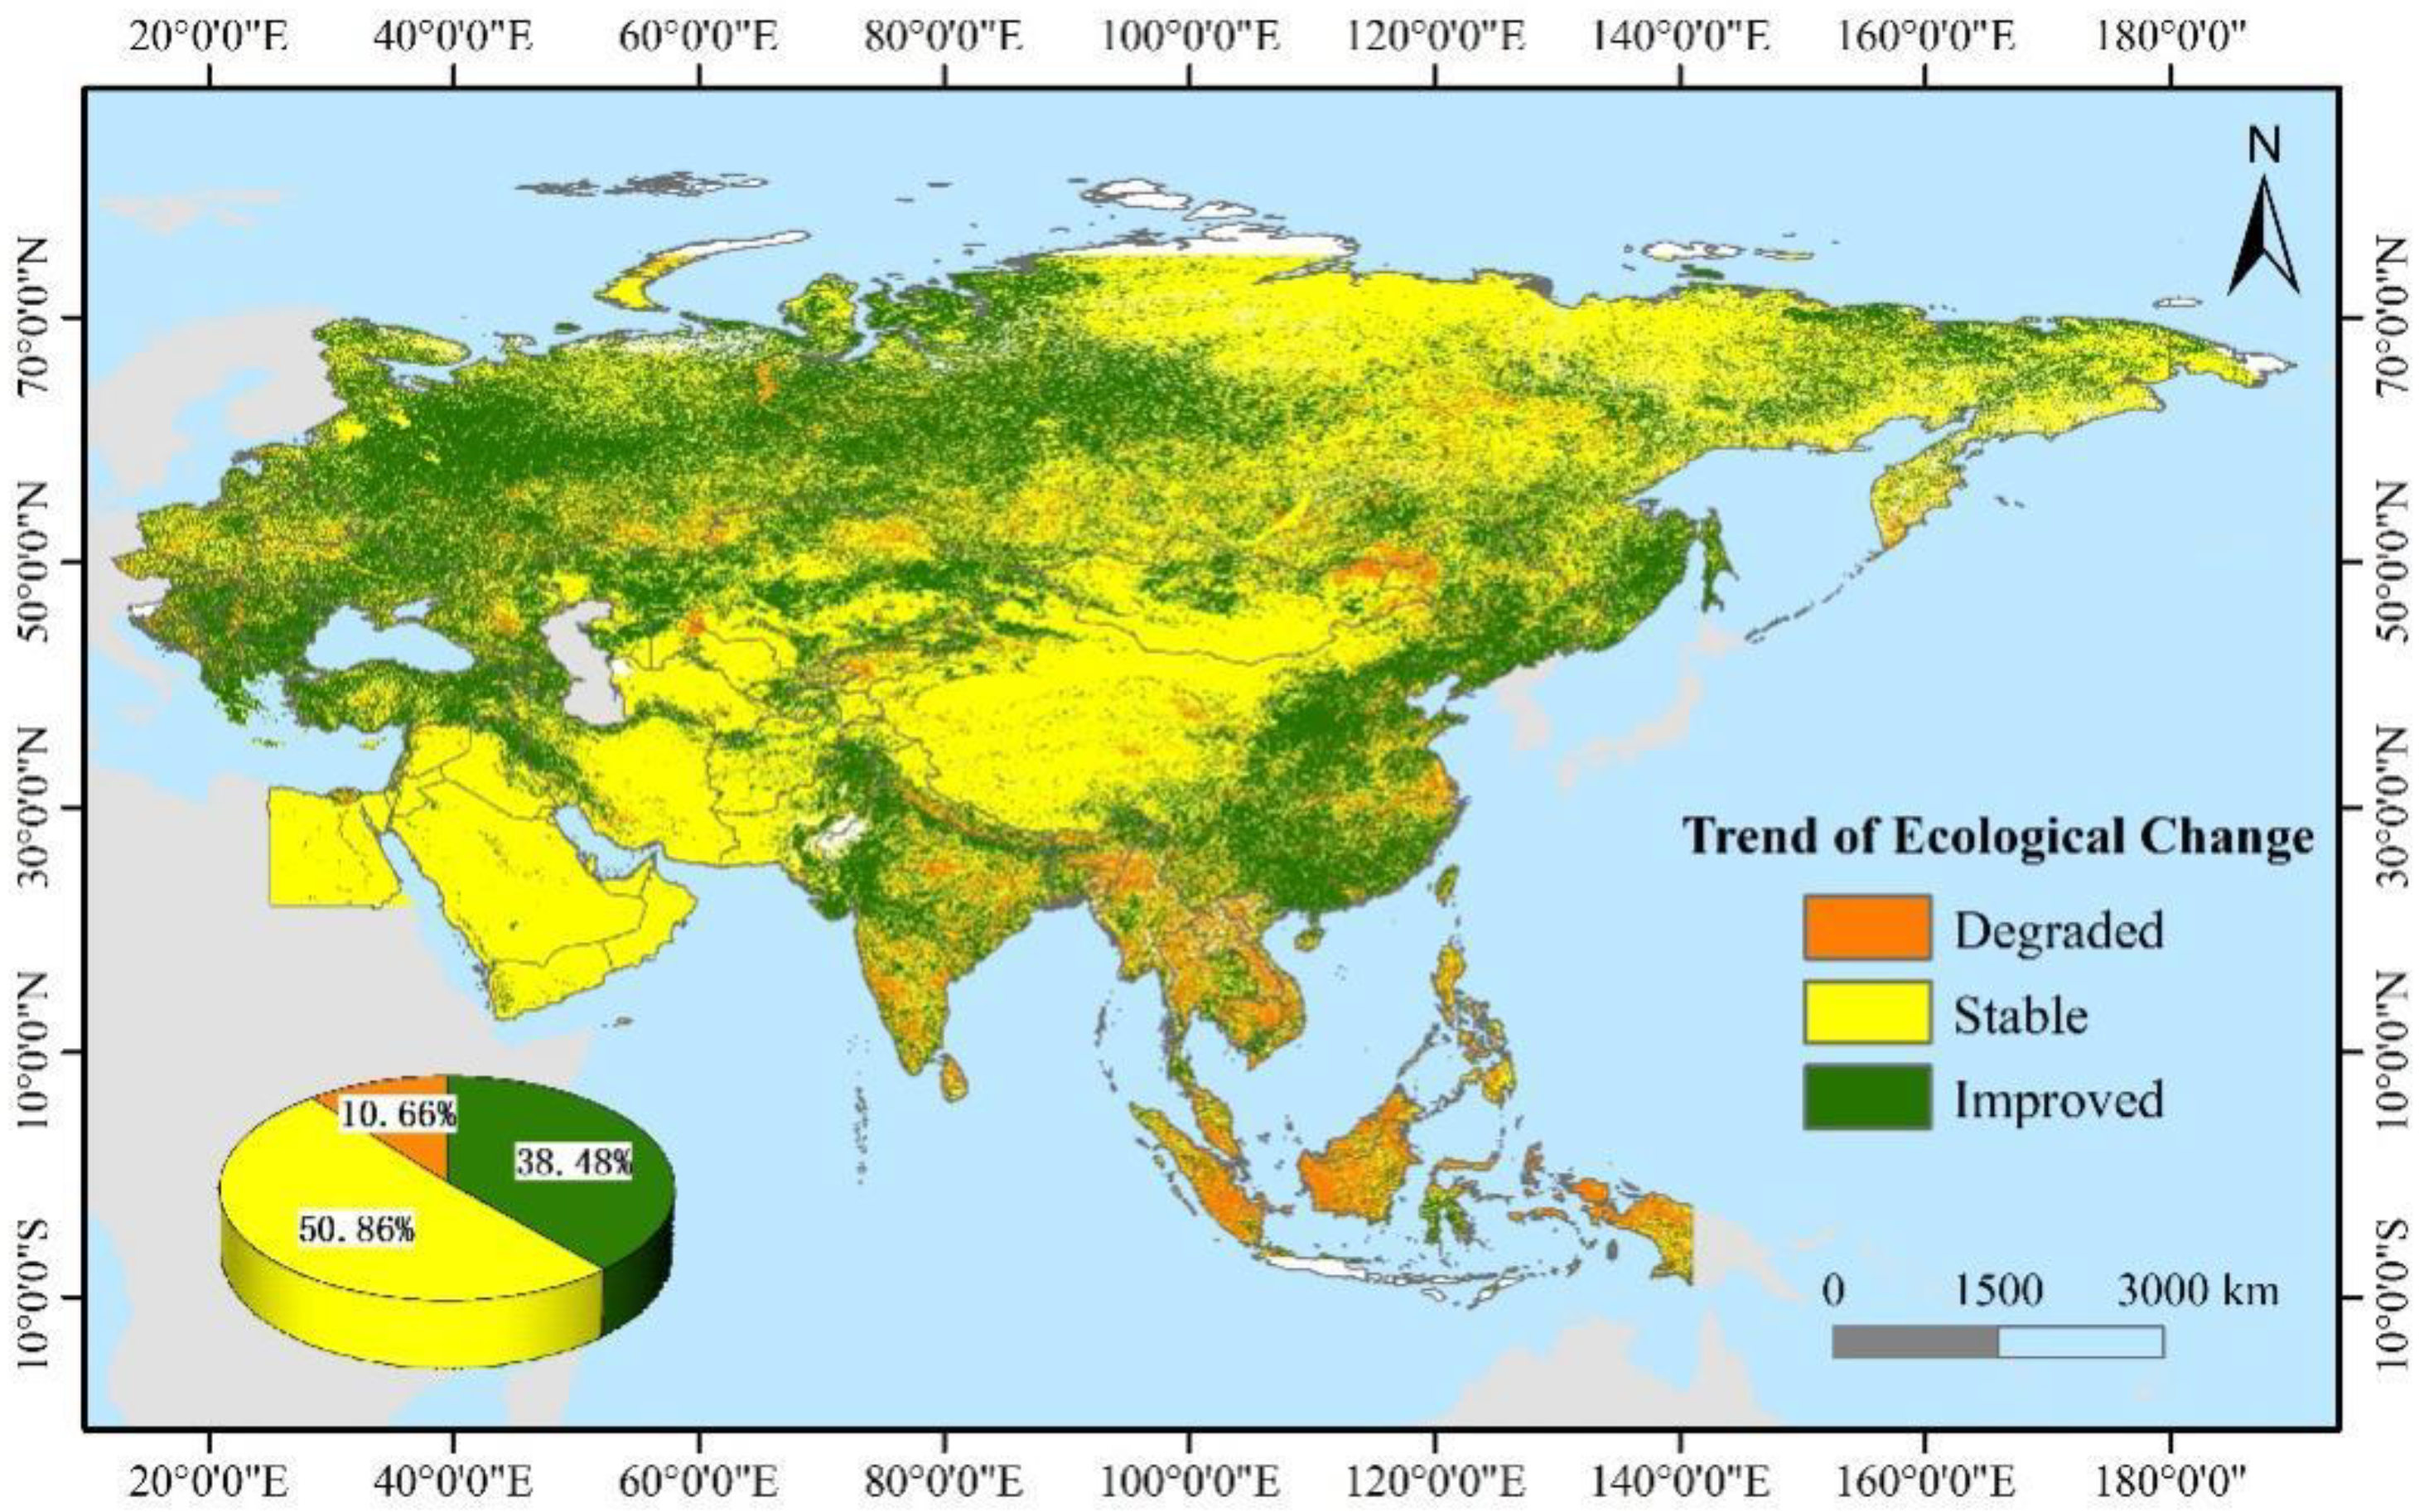
On the basis of the ecological change index of the Pan-Third Pole region, the improved ecological area was 38.48% of the total land area, mainly distributed in western and central Europe, northern Central Asia, north-western Middle East, eastern East Asia, and central-western South Asia from 2000 to 2020. The area of degraded ecological environment accounted for 10.66% of the total area, concentrated in South Asia and southern East Asia. The ecological environment of the other areas tended to be stable, which accounted for 50.86 of the total area of the region, which was mostly located in the Middle East, southern Central Asia, the desert areas of northwestern East Asia, and northeastern Europe (Figure 5).
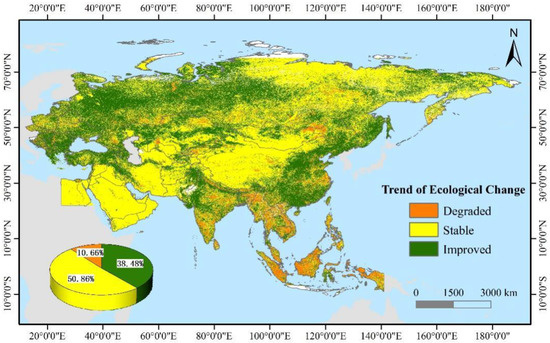
Figure 5.
Spatial distribution of ecological changes in the Pan-Third Pole region from 2000 to 2020.
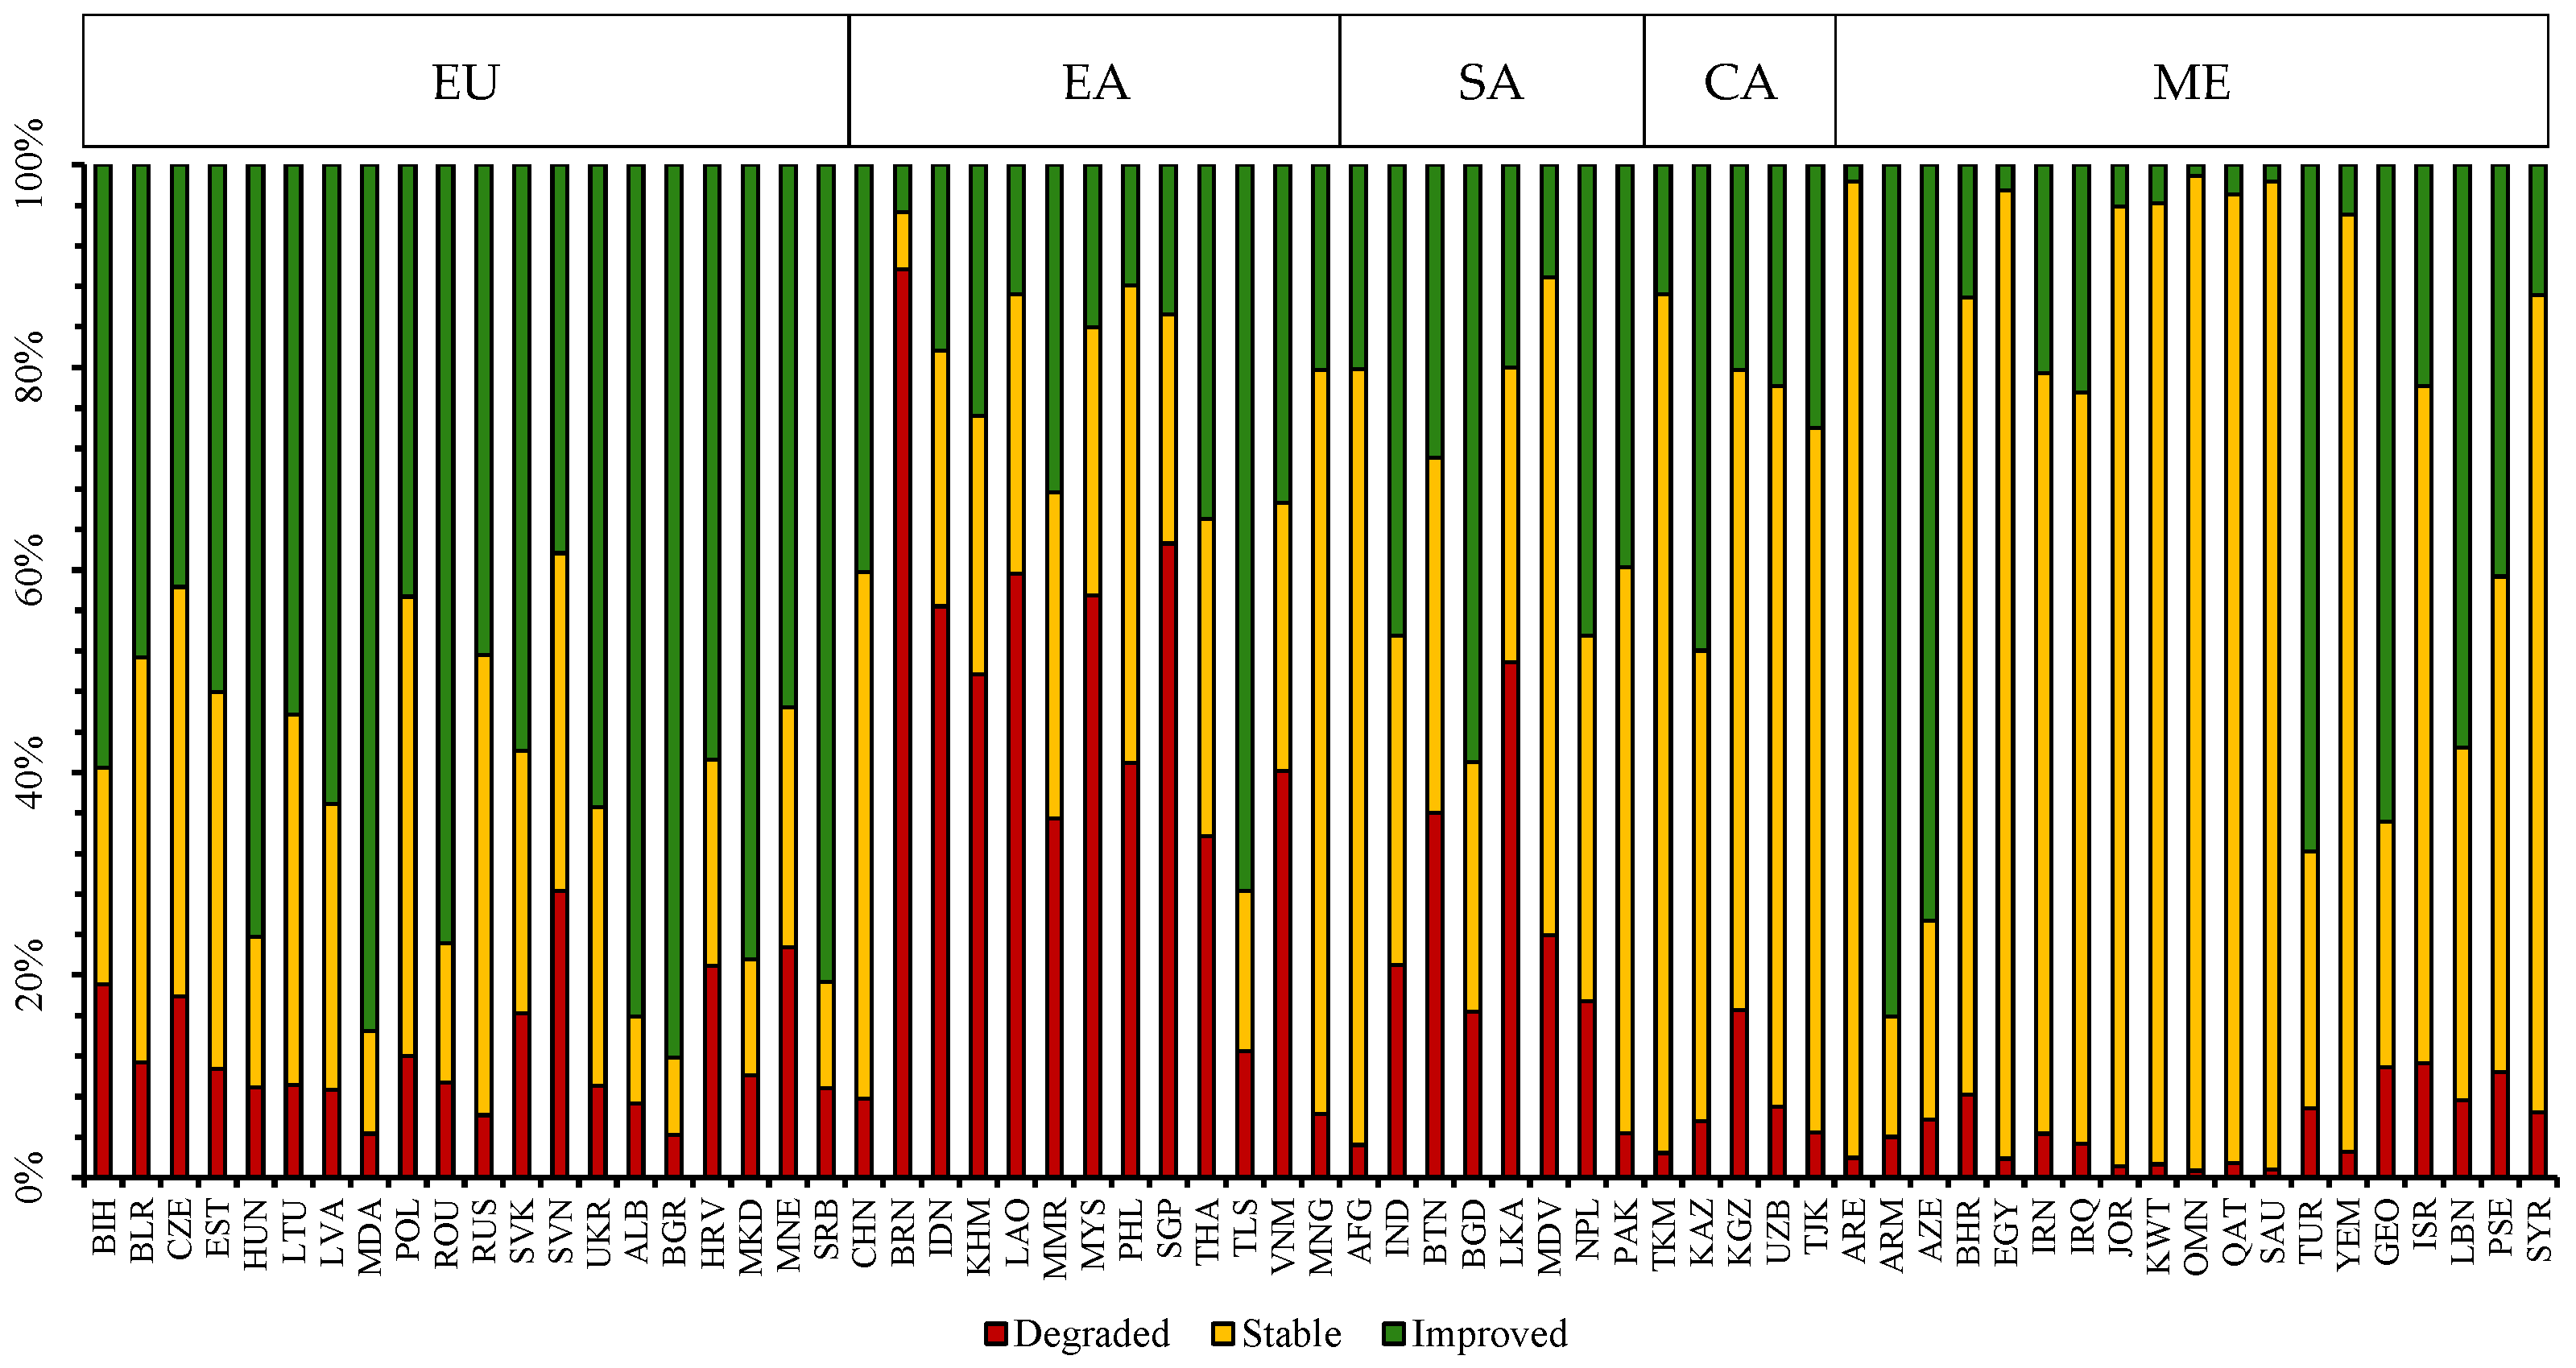
The trends of ecological changes in the Pan-Third Pole region varied widely among different countries, but with some regularities. European countries generally had a larger share of ecologically improved areas, which indicated a clear trend toward better ecological conditions in the European region over the past 20 years. The percentages of the degraded ecological areas in East Asian and South Asian countries were relatively large. Especially, the percentage of the countries in the coastal area of southern East Asia was significantly larger than that of other countries, which showed that the ecological environment in the coastal countries of southern East Asia had been seriously damaged in recent years. The changes in the ecological quality of Central Asian and Middle Eastern countries had a smaller percentage, and the percentage of ecological degradation regions was also smaller, which indicated that the ecological quality of several Central Asian and Middle Eastern countries had a trend of steady improvement. The improved ecological environments of Armenia, Azerbaijan, and Turkey, which were in the southern part of the Middle East, had a significantly larger proportion of areas than other countries in the Middle East (Figure 6). In addition, Bulgaria and Moldova in Europe and Armenia in Middle East had the highest proportion of ecological improvement areas, accounting for 88.18%, 85.55%, and 84.12% of their total area, respectively. The ecological quality of Oman, Saudi Arabia, and the United Arab Emirates in the Middle East were basically stabilized, with 98.24%, 97.57%, and 96.40%, respectively. The most obvious was that the country with severe ecological degradation was Brunei in East Asia, with 89.68%, which was far more than other countries in the Pan-Third Pole region (Figure 6).
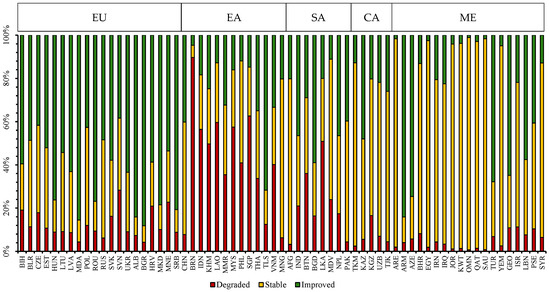
Figure 6.
Percentage of ecological change trends in 65 countries in the Pan-Third Pole region from 2000 to 2020.
3.3. Analysis of Influencing Factors of Ecological Quality Changes in the Pan-Third Pole Regions
3.3.1. Impact of Ecosystem Changes on Ecological Quality Changes
The area of Woodland ecosystem in the Pan-Third Pole region was the largest in 2020, which was 19.02 million km2, accounting for 38.46% of the total area, mainly distributed in Europe and southern East Asia. The second was the cropland ecosystem, with an area of 10.58 million km2, accounting for 21.39%, distributed in southwestern Europe, northeastern East Asia, and most of South Asia. And the third was the grassland ecosystem, with an area of 9.50 million km2, accounting for 19.21% of the total area, mainly in central East Asia, northern Europe, and northern Central Asia. Desert ecosystems covered an area of 7.52 million km2, accounting for 15.21%, and were concentrated in the Middle East and northwestern East Asia. The area and share of the water body ecosystem were 2.53 million km2 and 5.11%, respectively, which were mainly concentrated in the west-central part of Europe. And the settlement ecosystem was scattered throughout the region and had the smallest area of 0.31 million km2, accounting for 0.62% of the total area (Figure 7).

Figure 7.
Spatial distribution of ecosystem patterns in the Pan-Third Pole region (a) in 2000; (b) in 2020.
There were significant differences in the ecological quality among different ecosystems. The ecological quality of the areas covered by woodland and water body ecosystems were mostly “moderate” and above; while the areas covered by desert ecosystems were highly consistent with the areas with “worse” ecological quality and below; the areas covered by cropland and grassland ecosystems were dominated by “moderate” ecological quality. These patterns were found by comparing Figure 2 and Figure 7. It could be seen that areas with better ecosystems had more suitable climatic environment and were conducive to vegetation growth and human activities, thus, the quality of the ecological environment was relatively good; while areas with severe ecosystem structure had worse environment, sparse vegetation and severe living conditions.
The total area of ecosystem changes in the Pan-Third Pole region from 2000 to 2020 was 6.044 million km2, accounting for 12.21% of the total land area. During this period, the cropland ecosystem decreased by 0.027 million km2, the woodland ecosystem increased by 0.078 million km2, the grassland ecosystem decreased by 0.027 million km2, the water body ecosystem decreased by 0.004 million km2, the settlement ecosystems increased by 0.173 million km2, and the desert ecosystem decreased by 0.153 million km2, which could be found in Table 7. In the process of dynamic change, the major transitions were between cropland and woodland ecosystems, cropland and grassland ecosystems, woodland and grassland ecosystems, woodland and water body ecosystems, and grassland and desert ecosystems. This pattern could also be found in Table 7.

Table 7.
Transfer matrix of different ecosystem areas in the Pan-Third Pole region from 2000 to 2020 (Unit: million km2).
3.3.2. Impact of Human Activity Changes on Ecological Quality Changes
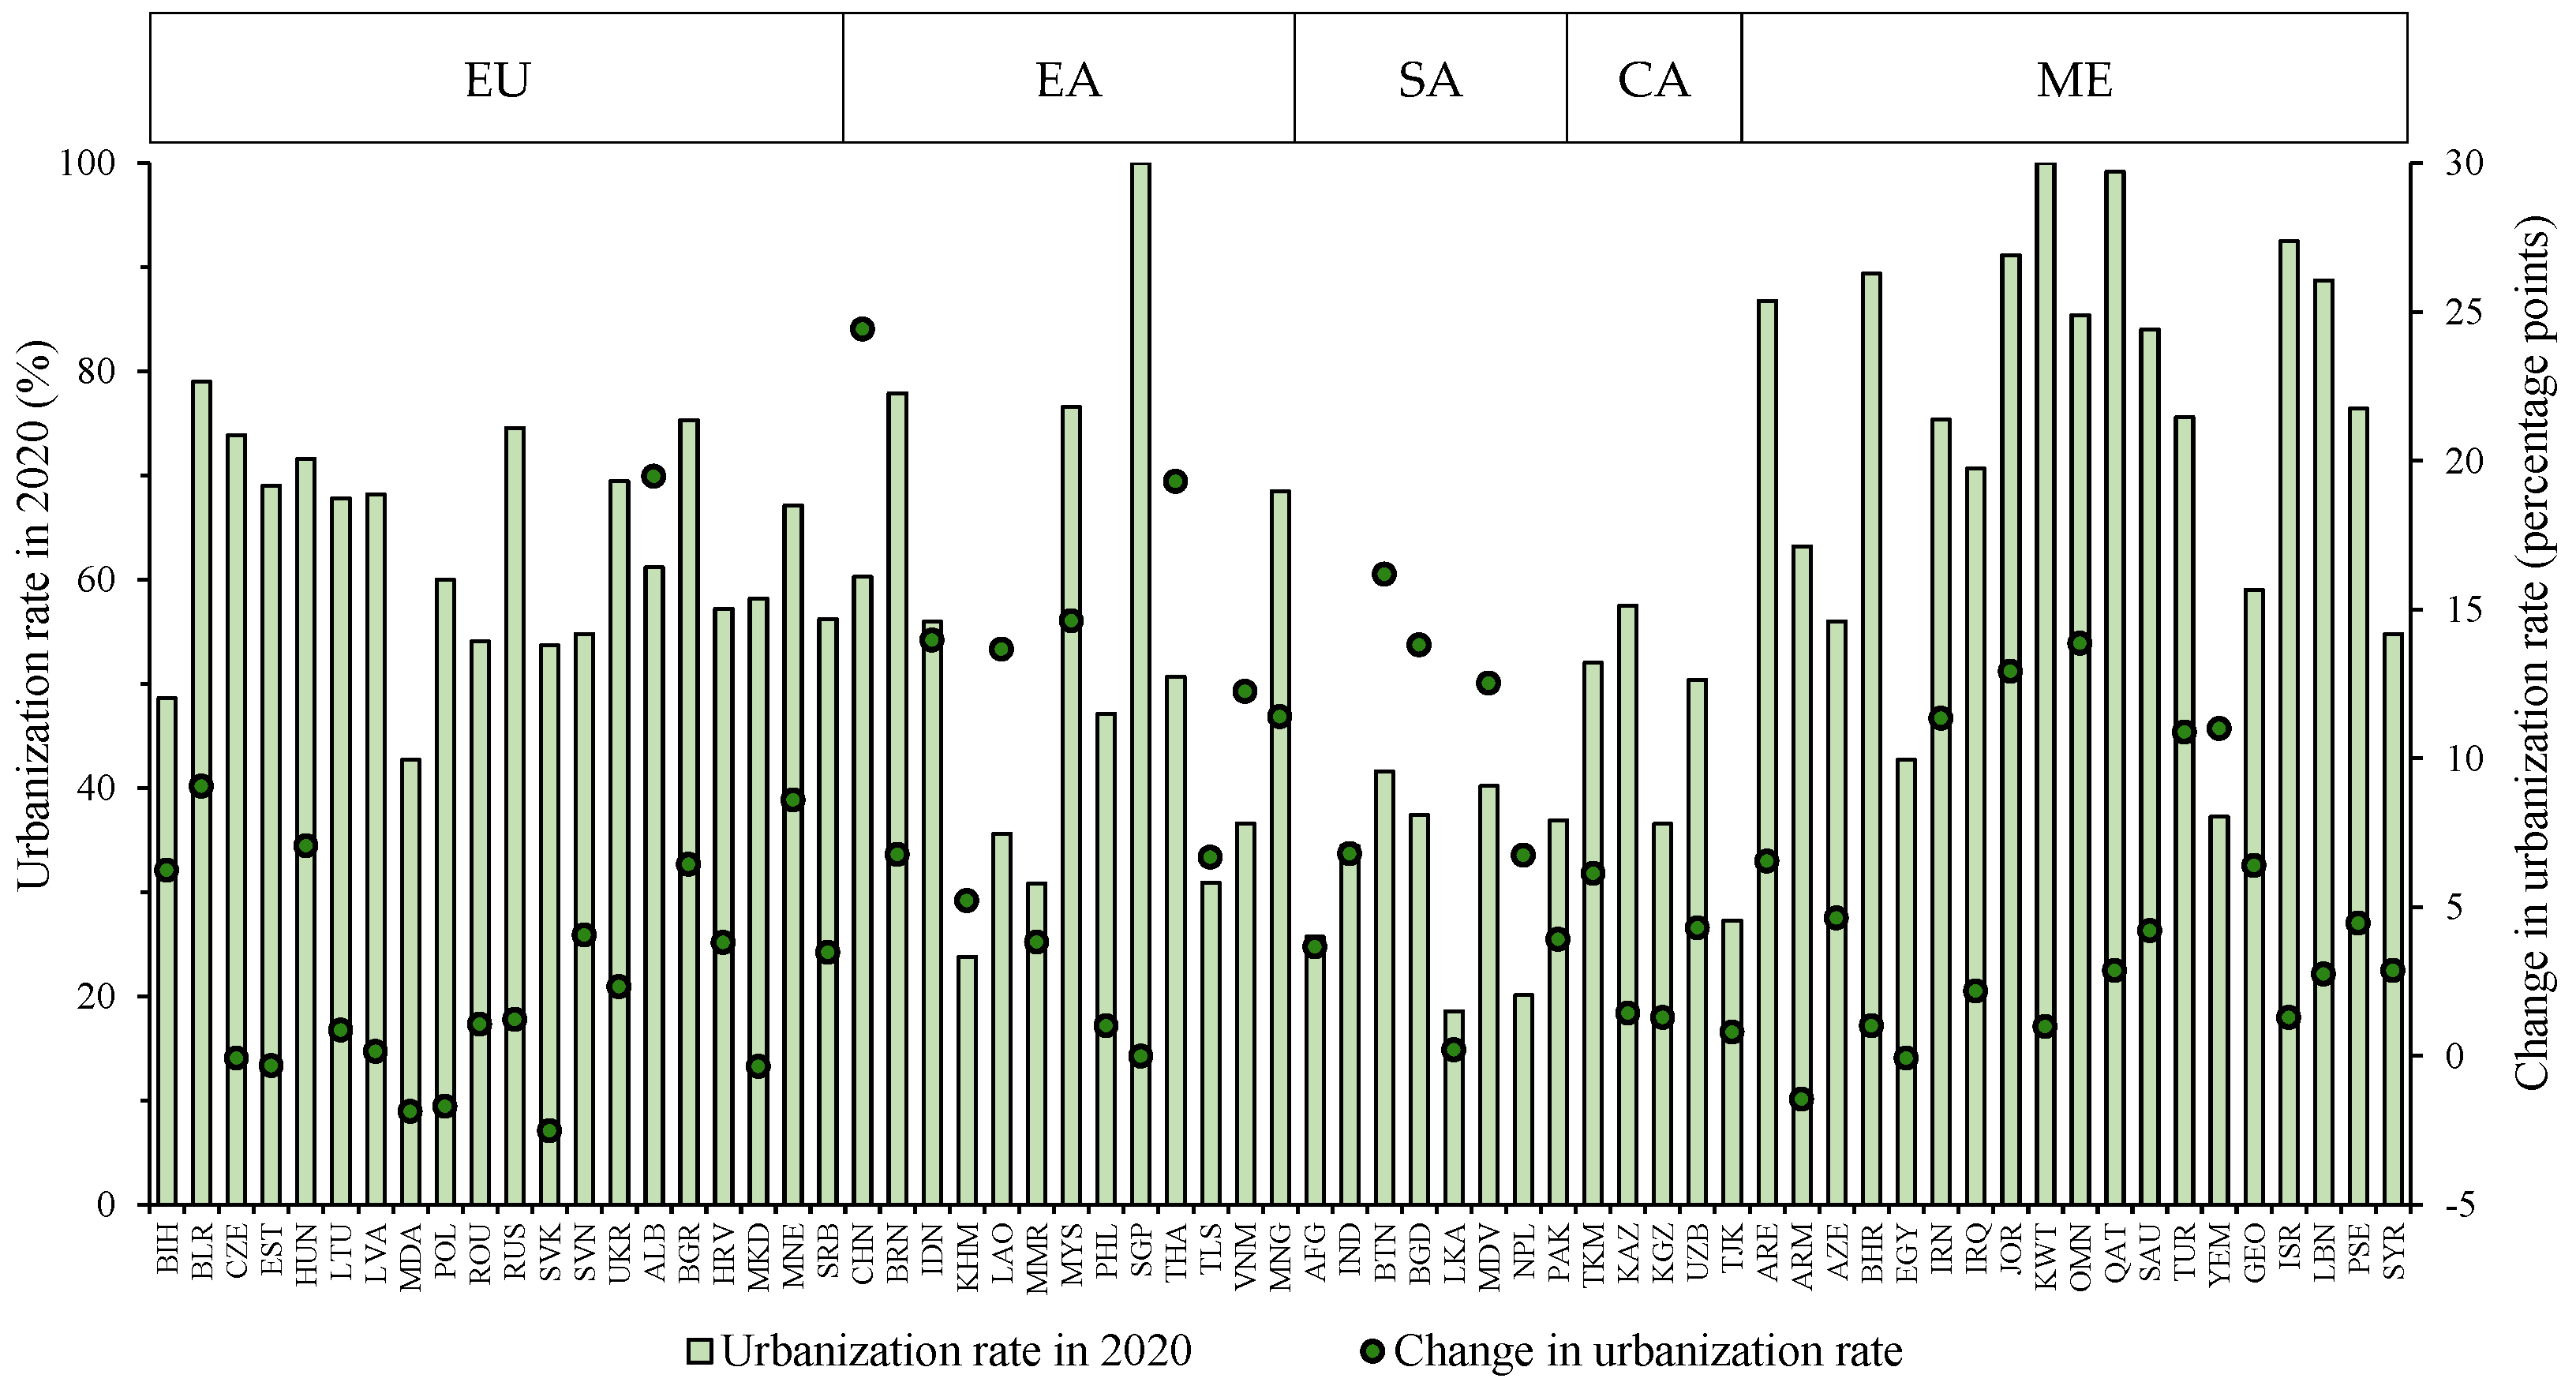
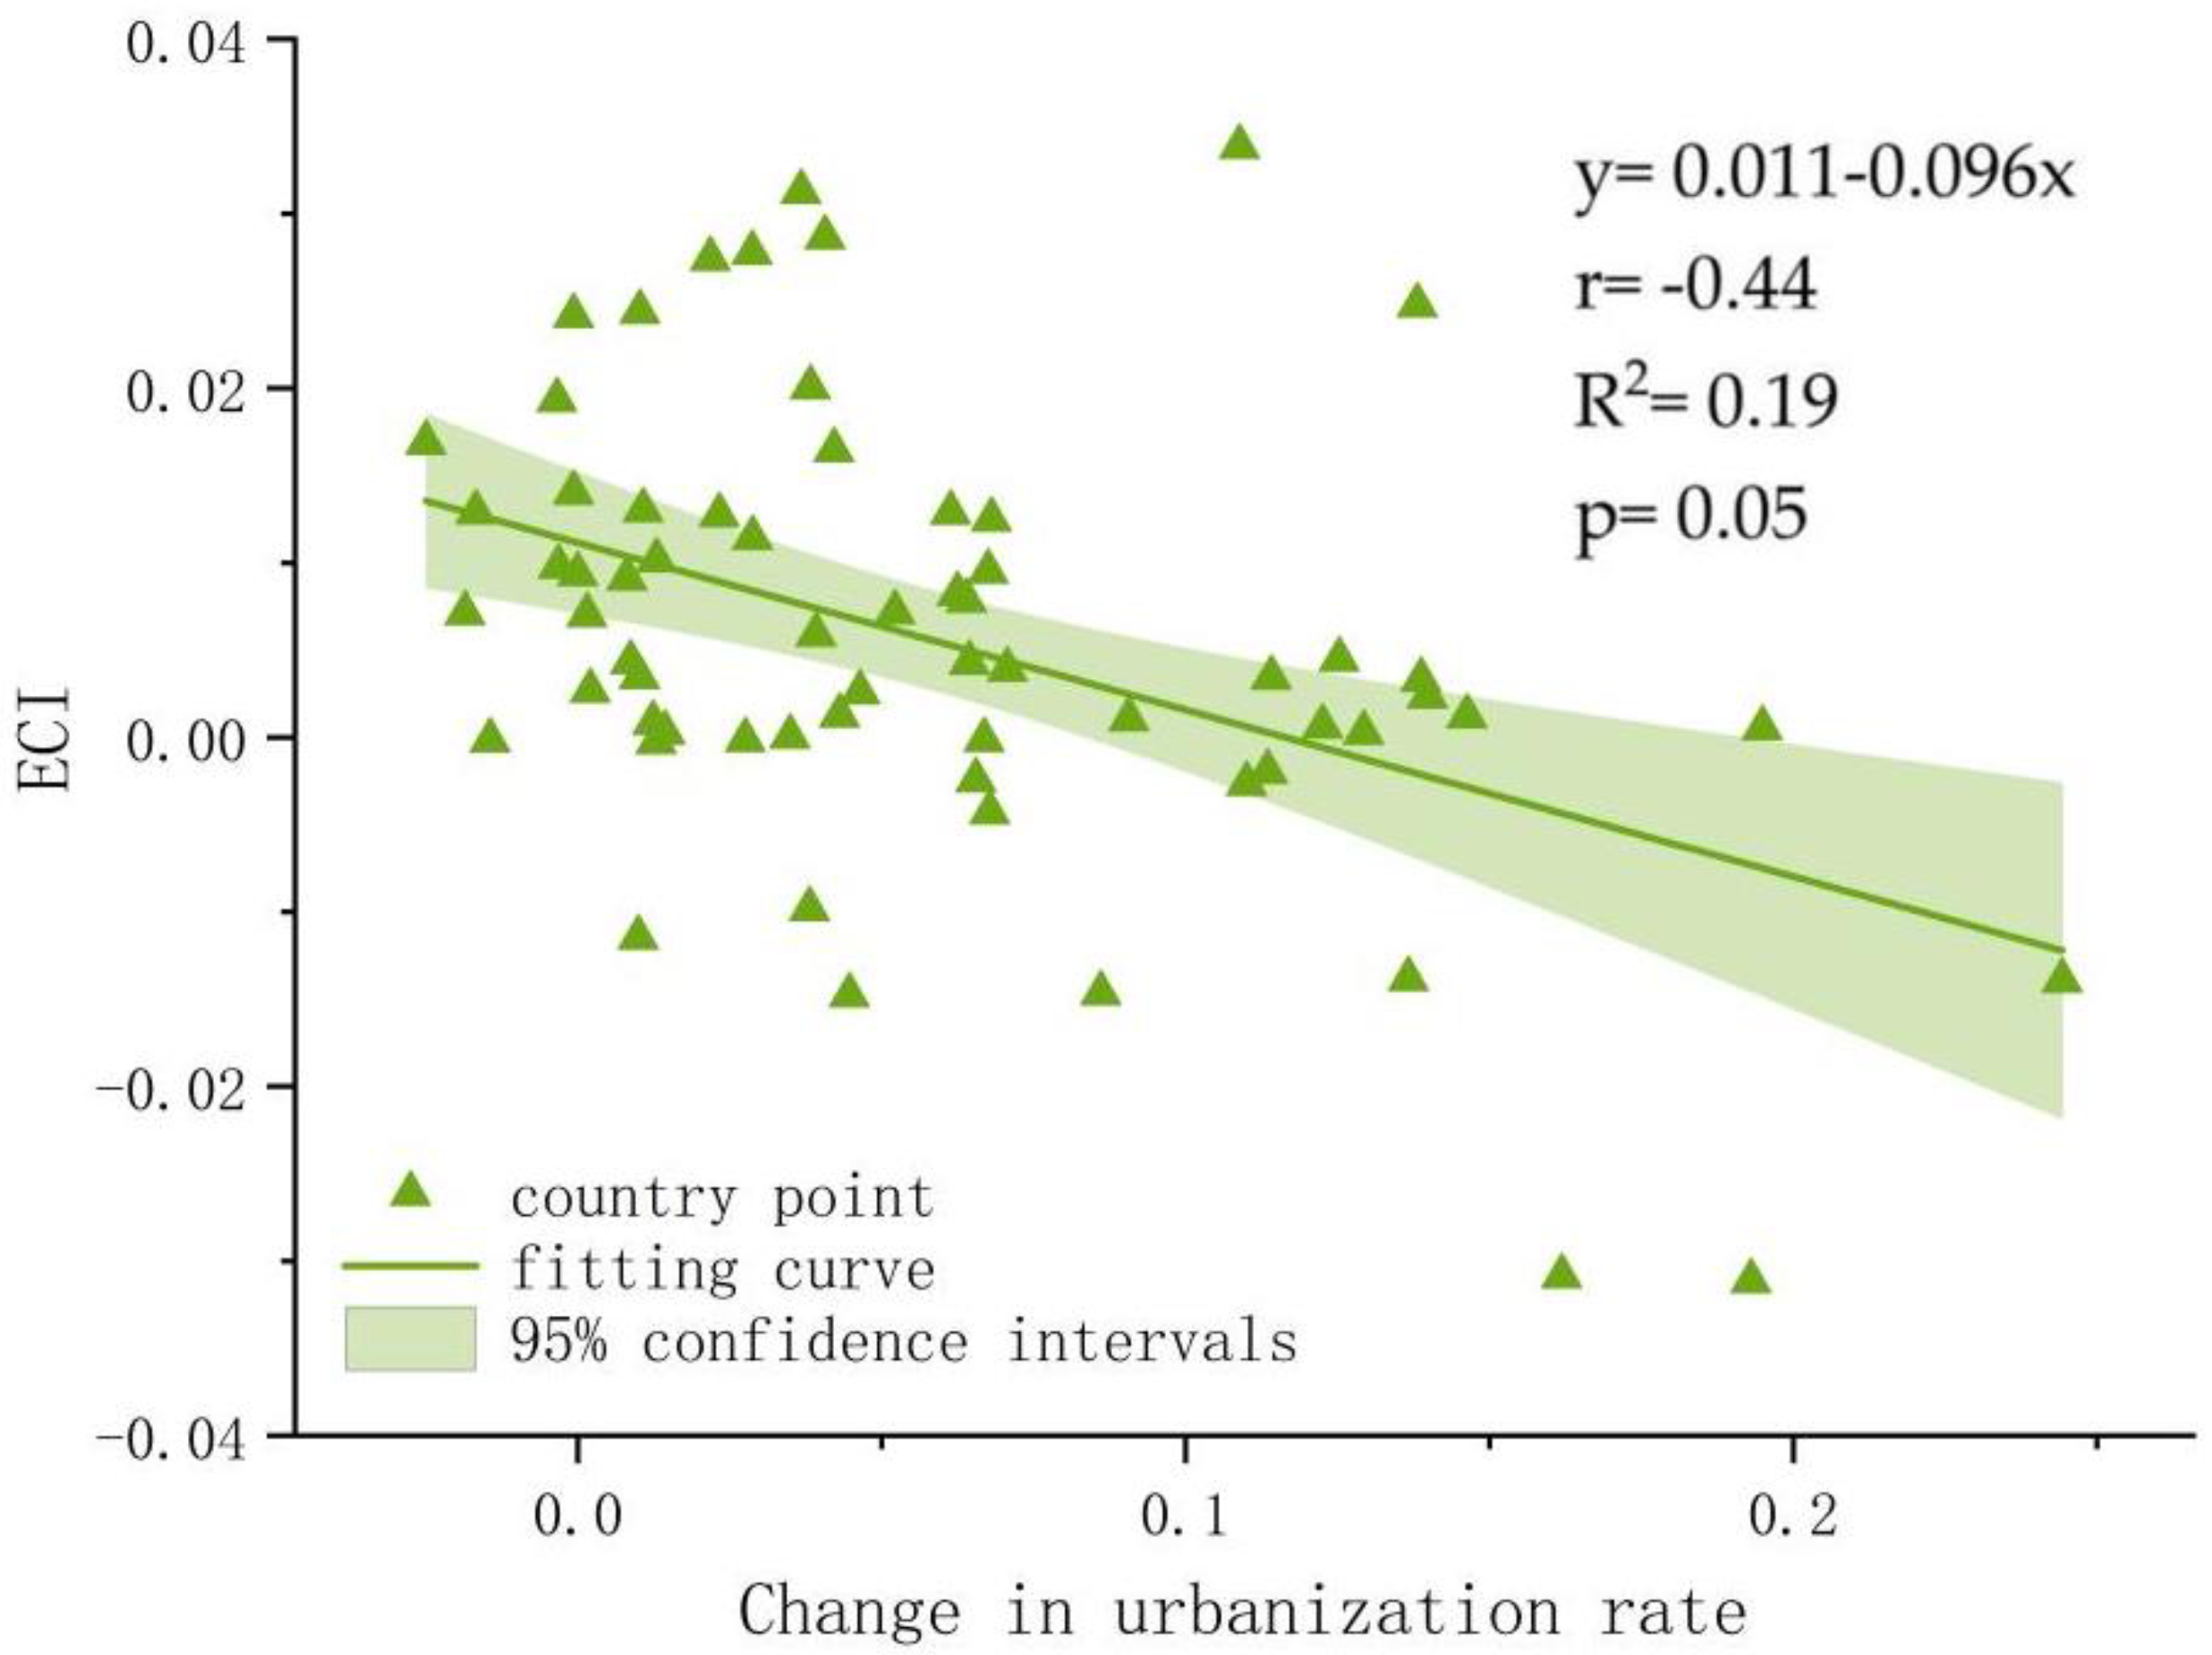
A comparison of urbanization rates of countries in the Pan-Third Pole region in 2020 showed that Middle Eastern countries had relatively high urbanization rates, followed by Europe, while countries in East Asia and Central Asia were in the middle, and South Asian countries had low urbanization rates (Figure 8). The change in urbanization rates in European and Central Asian countries showed negative or slow growth over the past 20 years, followed by Middle Eastern countries, and countries in East Asia and South Asia showed faster growth in terms of urbanization rate (Figure 8). The relationship between the ECI and the change in urbanization rate for each country in the Pan-Third Pole region was analyzed, and it was found that there was an inverse relationship between the two variables (R = −0.44) (Figure 9). In other words, countries with rapid growth in urbanization rate had a negative impact on the ecological quality, which made the ecological quality decline, while countries with slower or stable changes in urbanization rate had a gradual improvement in ecological quality while maintaining the status quo.
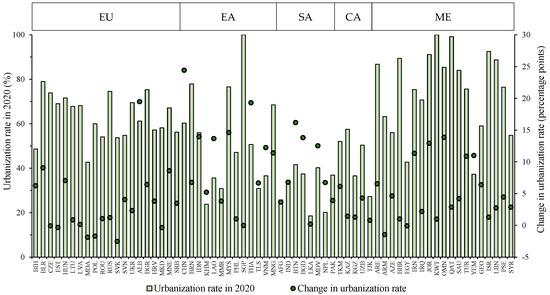
Figure 8.
Urbanization rates in countries of the Pan-Third Pole region.
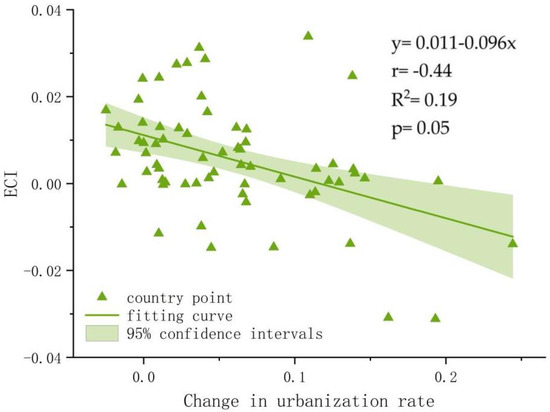
Figure 9.
Correlation between ECI and urbanization rate changes.
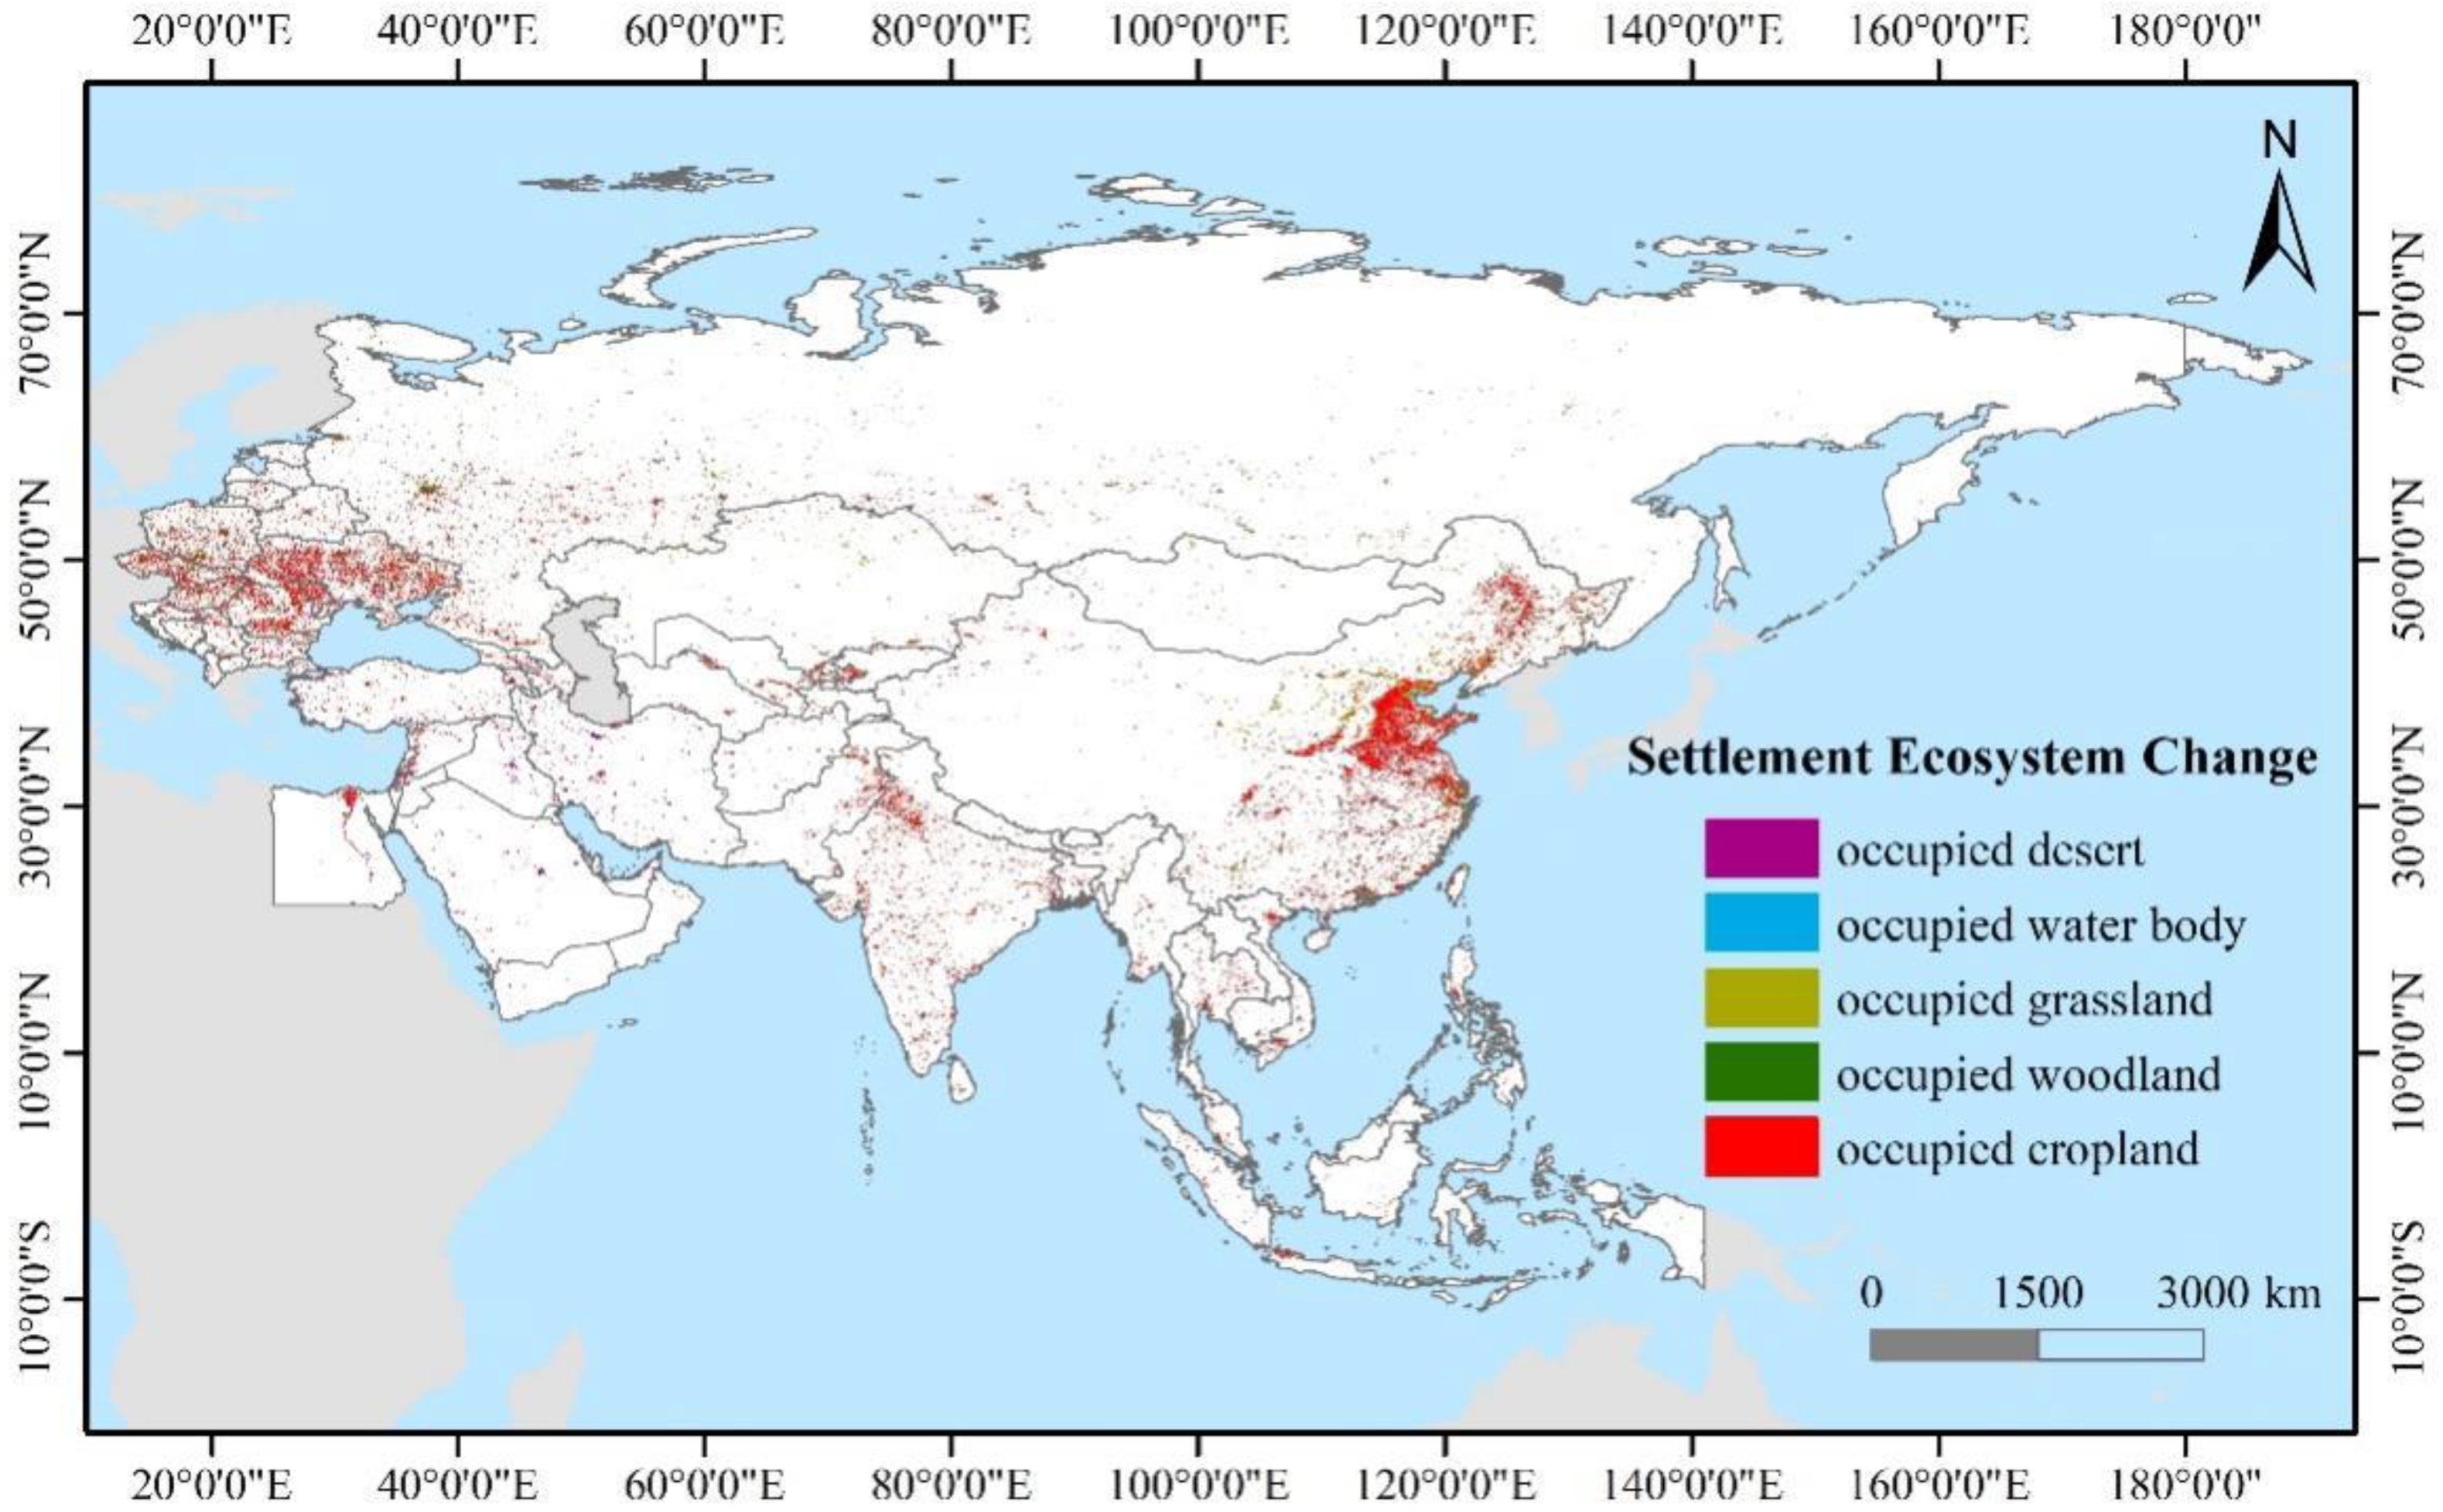
Urbanization has led to large population movements from rural to urban areas, which has increased the demand for urban land. The rapid urban expansion has significantly increased the disturbance to the ecosystem [19,35]. It is easy to see that in East Asia and Western Europe, especially in developing countries such as China, which are experiencing a rapid urbanization phase (Figure 10). The area of the Pan-Third Pole region’s settlement ecosystems increased by a total of 0.206 million km2, and the expansion was mainly caused by cropland ecosystem over the past 20 years. About 78.48% of the new settlement ecosystems came from cropland, and 9.62% and 5.00% were related to the conversion of grassland and woodland ecosystems, respectively. From the above, it was clear that the ecosystems in regions with declining ecological quality were more disturbed by human factors. In the process of urbanization development and urban expansion, agricultural land reclamation, deforestation, shrinking watershed, and artificial surface occupation of agricultural land were caused by human activities and excessively consumed the ecological environment.
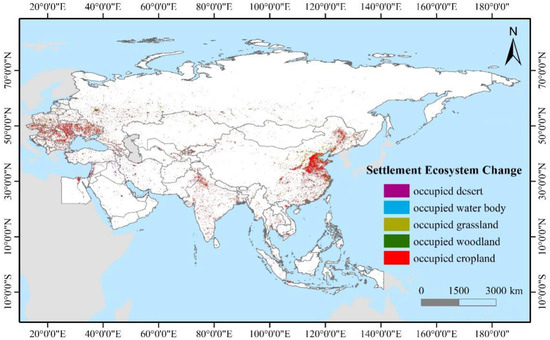
Figure 10.
Spatial distribution of settlement ecosystem changes in the Pan-Third Pole region from 2000 to 2020.
4. Discussion
4.1. Natural Background Was the Basis for Ecological Quality Changes
Areas with better natural endowments had a more suitable climate, which was conducive to vegetation growth and human activities, while areas with severe natural endowments had fewer traces of human activities due to their harsher climate and severe human living conditions. Due to the arid climatic background, the surface of the Middle East was mostly desert, and the ecological environment and natural background conditions were relatively fragile, so the ecological environment quality showed severe universal characteristics. On the contrary, the humid climate and the unique environment resulted in a better ecological environment in Europe, and the concept of livable urban living and resilient urban development made the whole European region show the characteristics of good ecological quality. Similarly, due to its coastal location and humid climate, the ecological quality of the region was also in good condition in southern East Asia. Therefore, areas with good natural conditions could act as a buffer against external influences, while areas with severe natural conditions would tend to magnify external influences due to their more fragile ecologies and weak self-recovery.
4.2. Increased Human Activity Was an Important Cause of Ecological Quality Changes
Human activities affected the ecological environment in two ways, one was the increased pressure on the environment and energy demand due to the increased level of urbanization, which had a direct impact on the ecological environment; the other was the change in land use due to economic development and urban expansion, which had a certain impact on the environment. Increasing population and urban expansion occupying cropland seriously affect food security and ecological safety [52]. However, the impact of human activities on the environment has not been entirely negative. Given continuous population growth and rapid economic development, countries around the world are constantly exploring the path towards sustainable development, in which people and nature live in harmony, and hope that a three-dimensional harmony between society, economy, and environment can be achieved [53,54,55,56]. Nearly 200 countries signed the 2030 Agenda for Sustainable Development, which set out 17 Sustainable Development Goals (SDGs) in 2015 [20,57,58,59,60,61,62]. At the same time, China has also put forward the sustainable cooperative development concept of “building a green Belt and Road”, hoping to actively participate in global environmental governance together with countries in the Pan-Third Pole region [18,63,64]. However, due to the different levels of development and ecological environment in the Pan-Third Pole region, countries need to develop their human–social–environmental synergistic development strategies according to their individual development situations. Such as, Europe needs to maintain a harmonious relationship between humans and nature, East Asia and South Asia need to develop their economies rapidly while protecting the environment, and the Middle East needs to further improve the balance between humans and nature, as well as explore the path of dual sustainable development of economy and ecological quality.
5. Conclusions
In this study, the Pan-Third Pole region was selected as the study area, and a comprehensive evaluation index system of ecological quality in the Pan-Third Pole region was constructed to study the characteristics of regional differentiation and temporal changes of ecological quality in this region from 2000 to 2020. The trends and influencing factors of the ecological quality of this region were explored. The results showed: (1) The spatial pattern of ecological quality in the Pan-Third Pole region showed no significant changes over the past 20 years, and the ecological quality was mostly “good”, “moderate”, or “worse”. (2) In terms of changes in ecological quality, the area of positive changes was larger than the negative changes, and the area of “good” quality increased, meanwhile the area of “severe” quality decreased. (3) From 2000 to 2020, the proportion of ecological quality levels in the 65 countries of the Pan-Third Pole region showed large differences, and the percentage of ecological change trends among countries also differed more significantly. (4) Over the past 20 years, ecological changes were influenced by ecosystem changes and human activity changes.
In this study, the state of change and spatial and temporal characteristics of the ecological quality of the Pan-Third Pole region were analyzed. The study results provided significant information on the ecological sustainability of the Pan-Third Pole region and provided important knowledge on the resilience, livability, and ecological security of cities. However, the ecological quality assessment involves a wide range of complex contents, and is not only affected by natural background conditions and human activities; natural factors such as climate, soil, and hydrology should be taken into account. Since the data on natural factors in the study area have not been collected comprehensively, it is necessary to consider the influence of human factors and natural factors on the ecological environment quality in future studies, and to further supplement and improve the relevant studies.
Author Contributions
Conceptualization, G.H. and W.K.; methodology, G.H. and W.C.; validation, W.K.; data curation, G.H. and W.C.; writing—original draft preparation, G.H.; writing—review and editing, T.P., Y.D., C.G., W.K., R.H. and Y.B.; supervision, W.K., R.H. and Y.B. All authors have read and agreed to the published version of the manuscript.
Funding
The study was supported by the Strategic Priority Research Program of Chinese Academy of Sciences, Pan-Third Pole Environment Study for a Green Silk Road (Pan-TPE) (NO: XDA20040403).
Data Availability Statement
Not applicable.
Acknowledgments
The authors would like to thank the anonymous reviewers for their crucial comments, which improved the quality of this paper.
Conflicts of Interest
The authors declare no conflict of interest. The funders had no role in the design of the study; in the collection, analyses, or interpretation of data; in the writing of the manuscript; or in the decision to publish the results.
References
- Maity, S.; Das, S.; Pattanayak, J.M.; Bera, B.; Shit, P.K. Assessment of ecological environment quality in Kolkata urban agglomeration, India. Urban Ecosyst. 2022, 25, 1137–1154. [Google Scholar] [CrossRef]
- Foley, J.A.; Defries, R.; Asner, G.P.; Barford, C.; Bonan, G.; Carpenter, S.R.; Chapin, F.S.; Coe, M.T.; Daily, G.C.; Gibbs, H.K.; et al. Global consequences of land use. Science 2005, 309, 570–574. [Google Scholar] [CrossRef]
- Lindenmayer, D.; Hobbs, R.J.; Montague-Drake, R.; Alexandra, J.; Bennett, A.; Burgman, M.; Cale, P.; Calhoun, A.; Cramer, V.; Cullen, P.; et al. A checklist for ecological management of landscapes for conservation. Ecol. Lett. 2008, 11, 78–91. [Google Scholar] [CrossRef]
- Khan, A.; Chatterjee, S. Numerical simulation of urban heat island intensity under urban–suburban surface and reference site in Kolkata, India. Model. Earth Syst. Environ. 2016, 2, 71. [Google Scholar] [CrossRef]
- Huang, G.; Cadenasso, M.L. People, landscape, and urban heat island: Dynamics among neighborhood social conditions, land cover and surface temperatures. Landsc. Ecol. 2016, 31, 2507–2515. [Google Scholar] [CrossRef]
- Gazi, A.A.; Mondal, I. Urban heat island and its effect on dweller of Kolkata metropolitan area using geospatial techniques. Int. J. Comput. Sci. Eng. 2018, 6, 741–753. [Google Scholar] [CrossRef]
- Talebmorad, H.; Koupai, J.A.; Eslamian, S.; Mousavi, S.F.; Akhavan, S.; Askari, K.O.A.; Singh, V.P. Evaluation of the impact of climate change on reference crop evapotranspiration in Hamedan-Bahar plain. Int. J. Hydrol. Sci. Technol. 2021, 11, 333–347. [Google Scholar] [CrossRef]
- Yao, T.; Chen, F.; Cui, P.; Ma, Y.; Xu, B.; Zhu, L.; Zhang, F.; Wang, W.; Ai, L.; Yang, X. From Tibetan Plateau to Third Pole and Pan-Third Pole. Bull. Chin. Acad. Sci. 2017, 32, 924–931. [Google Scholar] [CrossRef]
- Xie, H.; He, Y.; Choi, Y.; Chen, Q.; Cheng, H. Warning of negative effects of land-use changes on ecological security based on GIS. Sci. Total Environ. 2020, 704, 135427. [Google Scholar] [CrossRef]
- Airiken, M.; Zhang, F.; Chan, N.W.; Kung, H.T. Assessment of spatial and temporal ecological environment quality under land use change of urban agglomeration in the North Slope of Tianshan, China. Environ. Sci. Pollut. Res. Int. 2022, 29, 12282–12299. [Google Scholar] [CrossRef]
- Wang, J.; Ding, Y.; Wang, S.; Watson, A.E.; He, H.; Ye, H.; Ouyang, X.; Li, Y. Pixel-scale historical-baseline-based ecological quality: Measuring impacts from climate change and human activities from 2000 to 2018 in China. J. Environ. Manag. 2022, 313, 114944. [Google Scholar] [CrossRef]
- Wang, T.; Chen, Y.; Gan, Z.; Han, Y.; Li, J.; Huang, J. Assessment of dominating aerosol properties and their long-term trend in the Pan-Third Pole region: A study with 10-year multi-sensor measurements. Atmos. Environ. 2020, 239, 117738. [Google Scholar] [CrossRef]
- Fang, K.; Xu, A.; He, J.; Fang, C.; Liu, Q. Integrated assessment and division management of sustainable development in the Belt and Road countries. Chin. Sci. B Chin. 2020, 66, 2441–2454. [Google Scholar] [CrossRef]
- Gao, J.; Yao, T.D.; Masson-Delmotte, V.; Steen-Larsen, H.C.; Wang, W.C. Collapsing glaciers threaten Asia’s water supplies. Nature 2019, 565, 19–21. [Google Scholar] [CrossRef]
- NRC (National Research Council). Himalayan Glaciers: Climate Change, Water Resources, and Water Security; The National Academies Press: Washington, DC, USA, 2012; p. 156. ISBN 978-0-309-26098-5.
- Cui, X.F.; Graf, H.F. Recent land cover changes on the Tibetan Plateau: A review. Clim. Chang. 2009, 94, 47–61. [Google Scholar] [CrossRef]
- Bhardwaj, A.; Kumar, R.; Sam, L. Analysing Geospatial Techniques for Land Degradation Studies in Hindu Kush-Himalaya. In Environmental Change in the Himalayan Region, 1st ed.; Saikia, A., Thapa, P., Eds.; Springer International Publishing AG: Berlin/Heidelberg, Germany, 2019; pp. 117–135. ISBN 978-3-030-03361-3. [Google Scholar]
- Lei, J.; Ge, Y.; Gao, X.; Yang, Y. Ecologic problems and hazards risks: Challenges and countermeasure for promoting green belt and road. Bull. Chin. Acad. Sci. 2021, 36, 125–129. [Google Scholar] [CrossRef]
- Feng, Y.; He, S.; Li, G. Interaction between urbanization and the eco-environment in the Pan-Third Pole region. Sci. Total Environ. 2021, 789, 148011. [Google Scholar] [CrossRef]
- UN (United Nations). Transforming our World: The 2030 Agenda for Sustainable Development; UN (United Nations): New York, NY, USA, 2015. [Google Scholar]
- Luan, W.; Li, X. Rapid urbanization and its driving mechanism in the Pan-Third Pole region. Sci. Total Environ. 2021, 750, 141270. [Google Scholar] [CrossRef]
- UN-Habitat (Ed.) World Cities Report 2022: Envisaging the Future of Cities; UN-Habitat: Nairobi, Kenya, 2022; p. 422. ISBN 978-92-1-132894-3. [Google Scholar]
- Yang, S.; Lu, Y.; Weng, Y.; Wei, L. Dynamic monitoring of ecological and environmental quality of the Nanliu River basin, supported by Google Earth Engine. J. Agric. Resour. Environ. 2021, 38, 1112–1121. [Google Scholar] [CrossRef]
- Strobel, C.J.; Buffum, H.W.; Benyi, S.J.; Paul, J.F. Environmental monitoring and assessment program: Current status of Virginian Province (US) estuaries. Environ. Monit. Assess. 1999, 56, 1–25. [Google Scholar] [CrossRef]
- OECD (Organization for Economic Cooperation and Development). OECD Environmental Indicators; OECD Publications: Paris, France, 2001; ISBN 92-64-18718-9. [Google Scholar]
- OECD (Organization for Economic Cooperation and Development). Towards Sustainable Development; OECD Publications: Paris, France, 1998; ISBN 92-64-16080-9. [Google Scholar]
- OECD (Organization for Economic Cooperation and Development). Environmental Indicators for Agriculture; OECD Publications: Paris, France, 1999; ISBN 92-64-17134-7. [Google Scholar]
- Hammond, A.; Adriaanse, A.H.; Rodenburg, E.; Bryant, D.; Woodward, R. Environmental Indicators: A Systematic Approach to Measuring and Reporting on Environmental Policy Performance in the Context of Sustainable Development; World Resources Institute: Washington, DC, USA, 1995; p. 43. ISBN 1-56973-026-1. [Google Scholar]
- Wang, Q.; Yuan, X.; Ma, C.; Zhang, Z.; Zuo, J. Research on the impact assessment of urbanization on air environment with urban environmental entropy model: A case study. Stoch. Environ. Res. Risk A 2011, 26, 443–450. [Google Scholar] [CrossRef]
- Wolfslehner, B.; Vacik, H. Evaluating sustainable forest management strategies with the Analytic Network Process in a Pressure-State-Response framework. J. Environ. Manag. 2008, 88, 1–10. [Google Scholar] [CrossRef]
- Xu, H. A remote sensing index for assessment of regional ecological changes. China Environ. Sci. 2013, 33, 889–897. [Google Scholar]
- Ning, L.; Wang, J.; Fen, Q. The improvement of ecological environment index model RSEI. Arab. J. Geosci. 2020, 13, 14. [Google Scholar] [CrossRef]
- SEPA (State Environmental Protection Administration). Technical Criterion for Eco-Environmental Status Evaluation; SEPA (State Environmental Protection Administration): Beijing, China, 2015.
- Wang, H.; Zhang, X.; Qiao, M.; Miao, Y. Assessment and dynamic analysis of the eco-environmental quality in the Ili River Basin based on GIS. Arid. Land Geogr. 2008, 31, 215–221. [Google Scholar] [CrossRef]
- Pan, T.; Kuang, W.; Hamdi, R.; Zhang, C.; Zhang, S.; Li, Z.; Chen, X. City-level comparison of urban land-cover configurations from 2000–2015 across 65 countries within the global belt and road. Remote Sens. 2019, 11, 1515. [Google Scholar] [CrossRef]
- Sun, Z.; Yu, S.; Guo, H.; Wang, C.; Zhang, Z.; Xu, R. Assessing 40 years of spatial dynamics and patterns in megacities along the Belt and Road region using satellite imagery. Int. J. Digit. Earth 2021, 14, 71–87. [Google Scholar] [CrossRef]
- Huang, C.; Qin, Y.; Du, X.; He, J.; Fan, X. Ecosystem health and environmental geography in the belt and road regions. Int. J. Environ. Res. Public Health 2022, 19, 5843. [Google Scholar] [CrossRef]
- Xu, J.; Chen, J.; Liu, Y. Partitioned responses of ecosystem services and their tradeoffs to human activities in the Belt and Road region. J. Clean. Prod. 2020, 276, 123205. [Google Scholar] [CrossRef]
- Wang, L.; He, Y.; Zhang, Y.; Wang, L.; Jia, H.; Zhou, Q.; Yu, B.; Zhang, M.; Lin, Z.; Chen, F. Disaster assessment for the “Belt and Road” region based on SDG landmarks. Big Earth Data 2022, 6, 3–17. [Google Scholar] [CrossRef]
- Jing, C.; Tao, H.; Jiang, T.; Wang, Y.; Zhai, J.; Cao, L.; Su, B. Population, urbanization and economic scenarios over the Belt and Road region under the shared socioeconomic pathways. J. Geogr. Sci. 2020, 30, 68–84. [Google Scholar] [CrossRef]
- Du, Z.; Xiao, C.; Wang, Y.; Liu, S.; Li, S. Dust provenance in Pan-third pole modern glacierized regions: What is the regional source? Environ. Pollut. 2019, 250, 762–772. [Google Scholar] [CrossRef]
- Yang, Q.; Zhu, M.; Wang, C.; Zhang, X.; Liu, B.; Wei, X.; Pang, G.; Du, C.; Yang, L. Study on a soil erosion sampling survey in the Pan-Third Pole region based on higher-resolution images. Int. Soil. Water Conse. 2020, 8, 440–451. [Google Scholar] [CrossRef]
- Xie, R.; Zhao, C. Spatio-temporal differentiation of ecological environment vulnerability in Karst trough region based on grid scale. J. Yangtze River Sci. Res. Inst. 2018, 35, 48–53. [Google Scholar]
- Guo, B.; Kong, W.; Jiang, L.; Fan, Y. Analysis of spatial and temporal changes and its driving mechanism of ecological vulnerability of alpine ecosystem in Qinghai Tibet Plateau. Ecol. Sci. 2018, 37, 96–106. [Google Scholar] [CrossRef]
- Wang, T.; Zhao, L.; Zhang, X. Discussion on the method of ecotope comprehensive evaluation for Tibet Plateau ecological shelter zone. Bull. Surv. Mapp. 2018, 9, 112–116. [Google Scholar] [CrossRef]
- Liu, Z.; Xie, Z.; Shen, W. A new method that can improve regional eco-environmental evaluation-combining GIS with AHP. Resour. Environ. Yangtza Basin 2003, 12, 163–168. [Google Scholar]
- Li, S.; Wu, J.; Gong, J.; Li, S. Human footprint in Tibet: Assessing the spatial layout and effectiveness of nature reserves. Sci. Total Environ. 2018, 621, 18–29. [Google Scholar] [CrossRef]
- Jones, K.R.; Venter, O.; Fuller, R.A.; Allan, J.R.; Maxwell, S.L.; Negret, P.J.; Watson, J.E.M. One-third of global protected land is under intense human pressure. Science 2018, 360, 788–791. [Google Scholar] [CrossRef]
- Kennedy, C.M.; Oakleaf, J.R.; Theobald, D.M.; Baruch-Mordo, S.; Kiesecker, J. Managing the middle: A shift in conservation priorities based on the global human modification gradient. Glob. Chang. Biol. 2019, 25, 811–826. [Google Scholar] [CrossRef]
- Cai, W.; Han, B.; Lu, F.; Ouyang, Z. Comprehensive evalution of the eco-environment in the four global bay areas. Acta. Ecologica. Sinica. 2020, 40, 8392–8402. [Google Scholar] [CrossRef]
- Wei, W.; Guo, Z.; Xie, B.; Zhou, J.; Li, C. Spatiotemporal evolution of environment based on integrated remote sensing indexes in arid inland river basin in Northwest China. Environ. Sci. Pollut. Res. Int. 2019, 26, 13062–13084. [Google Scholar] [CrossRef]
- Kuang, W.; Liu, J.; Tian, H.; Shi, H.; Dong, J.; Song, C.; Li, X.; Du, G.; Hou, Y.; Lu, D.; et al. Cropland redistribution to marginal lands undermines environmental sustainability. Natl. Sci. Rev. 2022, 9, nwab091. [Google Scholar] [CrossRef]
- Giddings, B.; Hopwood, B.; O’Brien, G. Environment, economy and society: Fitting them together into sustainable development. Sustain. Dev. 2002, 10, 187–196. [Google Scholar] [CrossRef]
- Fan, Y.; Fang, C.; Zhang, Q. Coupling coordinated development between social economy and ecological environment in Chinese provincial capital cities-assessment and policy implications. J. Clean. Prod. 2019, 229, 289–298. [Google Scholar] [CrossRef]
- Wang, J.; Han, Q.; Du, Y. Coordinated development of the economy, society and environment in urban China: A case study of 285 cities. Environ. Dev. Sustain. 2022, 24, 12917–12935. [Google Scholar] [CrossRef]
- Strange, T.; Bayley, A. Sustainable Development; OECD Publication: Paris, France, 2008; ISBN 978-92-64-04778-5. [Google Scholar]
- Li, Y.; Zhu, X. The 2030 agenda for sustainable development and China’s belt and road initiative in Latin America and the Caribbean. Sustainability 2019, 11, 2297. [Google Scholar] [CrossRef]
- Dousa, M. European level of 2030 agenda for sustainable development. In Proceedings of the 10th International Conference on Sustainable Development, Ceske Budejovice, Czech Republic, 14–15 March 2019; pp. 24–33. [Google Scholar]
- Sun, X. China’s strategy to participating in the 2030 agenda for sustainable development. China Popul. Resour. Environ. 2016, 26, 1–7. [Google Scholar]
- Firoiu, D.; Ionescu, G.H.; Băndoi, A.; Florea, N.M.; Jianu, E. Achieving sustainable development goals (SDG): Implementation of the 2030 agenda in Romania. Sustainability 2019, 11, 2156. [Google Scholar] [CrossRef]
- Galli, A.; Đurović, G.; Hanscom, L.; Knežević, J. Think globally, act locally: Implementing the sustainable development goals in Montenegro. Environ. Sci. Policy 2018, 84, 159–169. [Google Scholar] [CrossRef]
- Lesakova, P.; Bata, R.; Provaznikova, R. Implementation of the SDGs under Czech conditions and measuring selected indicators. In Proceedings of the 29th International Business Information Management Association Conference, Vienna, Austria, 3–4 May 2017; pp. 1076–1084. [Google Scholar]
- Xue, H.; Lan, X.; Zhang, Q.; Liang, H.; He, Z. Assessment of the green development level for participating countries in the Belt and Road initiative. Ann. Oper. Res. 2021, 307, 1–21. [Google Scholar] [CrossRef] [PubMed]
- Zhai, T. Environmental challenges, opportunities, and policy implications to materialize China’s green belt and road initiative. Sustainability 2021, 13, 10428. [Google Scholar] [CrossRef]
Publisher’s Note: MDPI stays neutral with regard to jurisdictional claims in published maps and institutional affiliations. |
© 2022 by the authors. Licensee MDPI, Basel, Switzerland. This article is an open access article distributed under the terms and conditions of the Creative Commons Attribution (CC BY) license (https://creativecommons.org/licenses/by/4.0/).

