Abstract
Vegetation dynamics are often affected by climate variability, but the past state of vegetation has a non-negligible impact on current vegetation growth. However, seasonal differences in the effects of these drivers on vegetation growth remain unclear, particularly in ecologically fragile areas. We used the normalized difference vegetation index (NDVI), gross primary productivity (GPP), and leaf area index (LAI) to describe the vegetation dynamic in the upper and middle reaches of the Yellow River basin (YRB). Three active vegetation growing seasons (early, peak, and late) were defined based on phenological metrics. In light of three vegetation indicators and the climatic data, we identified the correlation between the inter-annual variation of vegetation growth in the three sub-seasons. Then, we quantified the contributions of climate variability and the vegetation growth carryover (VGC) effect on seasonal vegetation greening between 2000–2019. Results showed that both the vegetation coverage and productivity in the study area increased over a 20-year period. The VGC effect dominated vegetation growth during the three active growing seasons, and the effect increased from early to late growing season. Vegetation in drought regions was found to generally have a stronger vegetation carryover ability, implying that negative disturbances might have severer effects on vegetation in these areas. The concurrent seasonal precipitation was another positive driving factor of vegetation greening. However, sunshine duration, including its immediate and lagged impacts, had a negative effect on vegetation growth. In addition, the VGC effect can sustain into the second year. The VGC effect showed that initial ecological restoration and sustainable conservation would promote vegetation growth and increase vegetation productivity. This study provides a comprehensive perspective on understanding the climate–vegetation interactions on a seasonal scale, which helps to accurately predict future vegetation dynamics over time in ecologically fragile areas.
1. Introduction
In terrestrial ecosystems, vegetation controls the cycling of water and energy between the soil and the atmosphere and provides ecosystem services on which humans depend [1]. The structure and function of vegetation are influenced by climate factors (e.g., temperature, precipitation, and sunshine) and non-climate factors (vegetation itself and land use changes) [2,3,4]. To maintain the health and function of the ecosystem, we need to determine what factors affect vegetation growth [5,6].
Many studies have focused on the vegetation dynamics, resulting from climate variation [7,8]. For instance, temperature controls the high-latitude vegetation growth in the northern hemisphere [9]. Vegetation greening is primarily affected by solar radiation in tropical rainforest areas [10], while in arid and semiarid areas, the limiting factor of vegetation growth is precipitation [11,12]. However, the response of vegetation to climate factors is complex and delayed [13]. For example, there is about a 3-month lag between temperature change and vegetation activity in China [14]. The lag effect of the same type of vegetation to different climate factors is different, and the lag effect of different types of vegetation to the same climate factors is also different [15]. In drought areas, the vegetation dynamic is most sensitive to climate factors in the current and previous month [16]. These observations suggest that vegetation dynamics may be influenced not only by the current climate conditions but also by earlier climate conditions. Therefore, the time-lag effects of climate should be considered when exploring the mechanism of vegetation–climate interaction.
Besides climate factors, vegetation dynamics are also influenced by its past states [17,18]. The biological cycles of vegetation consist of many successive growth periods that are tightly connected to the past and present [19], implying that the present growth state of plants will influence subsequent growth. This phenomenon has been defined as vegetation growth carryover [17]. For example, vegetation carryover has an important impact on the daily net carbon exchange in dry-land ecosystems [20], which allows plants to send greening signals by increasing carbon uptake, resulting in more substantial leaves and roots [1]. Such structural changes in vegetation may enhance its resistance to external disturbance unless the change in external environmental conditions exceeds the tolerance of plant growth [17]. The key question is how substantial the role of the carryover effect is, especially when compared with the immediate and lagged impacts of climate factors. Previous researchers analyzed the VGC effect on vegetation growth at hemispheric or global scales [17,18]. However, processes that dominate at large scales are not necessarily dominant at small scales. Another important question to answer is how does the VGC affect the vegetation growth in ecologically fragile areas?
Here, we focus on the Yellow River basin (YRB). The YRB spans the arid, semiarid, and semi-humid areas in China [4]. Droughts occur frequently in the YRB with increasing duration and intensity [21]. Moreover, problems, such as soil erosion and reduced biodiversity, are also prominent in the basin [22], which makes the YRB vulnerable to environmental change [23]. The upper and middle reaches of the YRB account for 91% of the total area of the YRB [4]. There are a large number of tributaries flowing into the main stream in the upper reaches of the Yellow River, which is the main source of runoff in the basin [24]. The loss of the soil and water is serious in the middle reaches, which is the main source area of sediment in the basin [25]. Therefore, our research area is the upper and middle reaches of the YRB, which is very important to the development of the lower reaches and the whole basin. Previous studies on vegetation dynamics in the upper and middle reaches of the YRB have focused on the growing season or annual time scale [4,6,21]. However, the long-term climate changes often differ between seasons, so the vegetation responses to climate also vary significantly between seasons. In recent years, some studies have explored the characteristic patterns and driving factors of vegetation growth from the perspective of seasonal dynamics. For example, a study has shown that the seasonal change of temperature can regulate the spatial heterogeneity of deciduous broadleaf forests greening [26]. A previous study reported that the decrease in vegetation greenness in the Northern hemisphere after 1997 was mainly due to the decrease in vegetation cover in the early parts of the growing season and the slowdown increase in vegetation cover in the peak of the growing season [27]. Since the seasonal dynamics of vegetation in different regions and ecosystems are different, it is not accurate to study the seasonal changes of vegetation in a certain region by simply using meteorological seasons based on a constant calendar (for example, spring is defined as March–May). Therefore, it is more universal to define seasonality based on local vegetation phenology information. Analyzing the interseasonal relationship of vegetation growth will help to better understand the climate-vegetation interaction.
In this study, we first assessed the vegetation indexes change from three different datasets to detect and characterize vegetation growth trends in the upper and middle of the YRB from 2000–2019. The satellite-derived NDVI, GPP, and LAI were regarded as indicators to reflect vegetation dynamics and productivity. Secondly, we divided the growing season into three active seasons based on phenological metrics [17,28]. Then, we assessed the effect of vegetation carryover on vegetation growth across the phenology-based season using partial correlation analysis and compared the size of this effect against that of the immediate and lagged impacts of climate factors. Temperature (TEM), precipitation (PRE), and sunshine duration (SSD) were used to represent the climate conditions. Finally, the individual contributions of climate variability and the vegetation carryover on vegetation greening were calculated. Our research is expected to increase understanding of vegetation–climate interactions at the seasonal scale and provide insight on how to better manage vegetation under global climate change in the future.
2. Materials and Methods
2.1. Study Area
The Yellow River is the second-longest river in China. It has a watershed area of 79.5 km2, 91% of which (72.3 × 10⁴ km2) is considered the upper and middle reaches [4]. Our study area covered the upper and middle reaches of the YRB, and its undulating terrain varies in elevation between 84 and 6119 m (Figure 1a). The upper and middle reaches of the YRB span many climatic zones (Figure 1b). The upper reaches of the YRB are dominated by polar climate (ET and EF). The Ningxia Plain and the western part of Hetao Plain have cold desert climate (BWk). The eastern part of Hetao Plain and Ordos Plain have cold steppe climate (BSk). The southern part of the study area is dominated by hot, warm-summer continental climate (Dwa and Dwb) [29]. The main land-cover types (>104 km) are grasslands, croplands, deciduous broadleaf forests, barrens, savannas, urban and built-up lands, and mixed forests (Figure 1d and Table 1). The quality of the ecological environment in the upper and middle reaches directly determines the environmental conditions in the lower reaches of the YRB, so this area has crucial strategic significance in terms of geographical location and ecological protection [4].
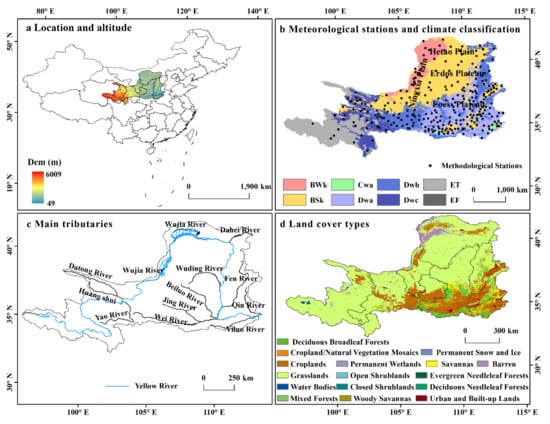
Figure 1.
Location and altitude (a), stations and climate classification (BWk: cold desert; BSk: cold steppe climate; Cwa: dry-winter humid subtropical climate; Dwa: hot-summer continental climate; Dwb: warm-summer continental climate; Dwc: boreal climate; ET: tundra climate; EF: ice-cap climate) (b), main tributaries (c), and land cover types in 2019 (d) of the upper and middle reaches of the Yellow River Basin.

Table 1.
The main land cover types (>104 km) and proportion of the upper and middle reaches of the YRB in 2019.
2.2. Data Sources and Processing
Normalized difference vegetation index (NDVI) reflects vegetation growth trend and is widely used to describe the physiological condition of vegetation [17]. Here, NDVI data were provided by the Moderate Resolution Imaging Spectroradiometer (MODIS) products (https://lpdaac.usgs.gov/) at a spatial resolution of 500 m × 500 m and temporal resolution of 16 days. The time-series data covers 2000–2019. We selected MOD13A1 NDVI data of four imagery data sets, including h25v05, h26v04, h26v05, and h27v05. NASA’s MRT (MODIS Reprojection Tools) software was used for data processing, including image mosaic, projection, format transformation, and resampling. Then, vector boundaries of the upper and middle reaches of the YLB were used to extract the study area in ArcMap 10.2.2. The synthetic NDVI data may have outliers or missing values. Therefore, the MODIS NDVI datasets were smoothed and denoised by the Savitzky–Golay (S-G) filter [30,31]. The basic idea is first to filter the data after reprojection, and then the pixels with good quality remain unchanged, while those with poor quality are filtered to form a new NDVI sequence. Considering that NDVI is easily saturated in dense vegetation areas, we also introduced two data products, leaf area index (LAI) and gross primary productivity (GPP) to independently verify the robustness of the NDVI results. LAI and GPP data (MOD15A2H) are also derived from the MODIS products (https://lpdaac.usgs.gov/). The LAI and GPP dataset are available at a spatial resolution of 500 m × 500m and 8-day temporal resolution. All pretreatments were the same as for NDVI.
Temperature affects many plant processes, such as photosynthesis, respiration, and transpiration [26]. In arid and semi-arid areas, vegetation is very sensitive to precipitation [21]. Sunshine is the source of energy for plant growth [32]. Therefore, precipitation, temperature and sunshine duration were selected as meteorological indicators in this study. Monthly mean temperature and monthly total precipitation with a spatial resolution of 0.00833° were obtained from the Institute of Tibetan Plateau Research, Chinese Academy of Sciences (https://data.tpdc.ac.cn/). Daily sunshine duration (meteorological station data) was acquired from the Chinese National Bureau (https://data.cma.cn/) (Figure 1b). The period for time-series meteorological data is 2000–2019. To maintain the same spatial resolution, vegetation indexes and shine duration were resampled or interpolated into a grid cell with a spatial resolution of 0.00833°.
We obtained the land cover data (MCD12Q1) from the United States Geological Survey (USGS) platform (https://lpdaac.usgs.gov/). The MCD12Q1 supplies global maps of land cover at annual time steps and 500 m spatial resolution since 2001 and was classified according to the International Geosphere-Biosphere Program (IGBP) land use classification scheme. The spatial distribution of the altitude (DEM) data was obtained from the Resources and Environment Science and Data Center, Chinese Academy of Sciences (https://www.resdc.cn/Default.aspx).
Details of data used in this research are shown in Table 2.
Table 2.
Main data used in this study.
2.3. Trend Analysis and Significance Test
Linear regression analysis was done to simulate the trend of vegetation index variation on the pixel scale from 2000 to 2019. The formula is as follows:
where the slope is the inter-annual variation rate of relevant variables i, Vari the value of the relevant variable in the ith year (season), and n represents the length of the dataset (n = 20). Slope > 0 indicates an increasing trend of the Vari during the study period, and slope < 0 indicates a negative trend of the Vari during the study period.
At the same time, the Mann–Kendall test by Equations. (2)–(5) was used to check the significance level of the vegetation trend.
2.4. Identifying Phenology-based Seasons
The length and period of the growing season for each grid cell are not directly defined by a constant calendar-based meteorological season, for example, the growing season is April–October [33] or the spring season is April–May [34,35]. Instead, we defined growth seasons based on vegetation phenology [17,18,36]. We extracted the start of the growing season (SOS) and the end of the growing season (EOS) based on phenological events [17,28], and then divided the growing season into three active seasons: early growing season (EGS), peak growing season (PGS), and late growing season (LGS). The specific extraction process was as follows. The 16-day NDVI time series datasets were input into TIMESAT 3.3 software [32] to extract SOS and EOS for determining the length of the growing season. Dynamic thresholds of vegetation SOS and vegetation EOS were set at 20% and 80%, respectively [37]. Since the TIMESAT 3.3 software can only extract phenological parameters of n-1 year from n-year data, we obtained 2001–2019 phenological parameters based on 20 years of NDVI data. SOS and EOS are the 19-year averages. The two consecutive months with the largest NDVI value were defined as PGS (not before April or after October). EGS is defined as the intermediate month from the month of SOS to the month of PGS, and LGS is defined as the intermediate month from the month of PGS to the month of EOS. The preceding-season NDVI for EGS is the NDVI of the last year’s LGS [17].
2.5. Correlation between the Vegetation Indicators and Their Driving Factors
Partial correlation analysis was applied to assess the relationship between seasonal vegetation growth and productivity (NDVI, GPP, and LAI) and their driving factors between 2000–2019. We considered the concurrent climate factors (temperature, TEM, precipitation, PRE, and sunshine duration, SSD) and climate factors (TEMps, PREps, and SSDps) and NDVI (NDVIps) of the preceding season as driving factors of seasonal NDVI (GPP and LAI) variations.
2.6. Contribution of Climate Variability and the VGC Effect on Vegetation Greening
We quantified the individual contributions of climate factors (TEM, PRE, and SSD of the present and preceding season) and VGC effect (preceding-season NDVI) to the observed NDVI trend of each season during 2000–2019, so as to decompose the linear trend of NDVI (dNDVI/dt) for each season over a 20-year period into the additive contribution of eight components:
where ΔNDVIps, Δclimateps, ΔTEMps, ΔPREps, ΔSSDps, Δclimate, ΔTEM, ΔPRE, and ΔSSD represent the individual contributions to the interannual NDVI changes, respectively. Δclimateps (preceding-season climate) is the sum of ΔTEMps, ΔPREps, and ΔSSDps. Δclimate is the sum of ΔTEM, ΔPRE, and ΔSSD. Moreover, ∂NDVI/∂NDVIps is equal to the partial correlation coefficient between NDVI and NDVIps when removing the disturbances of the concurrent and preceding season for temperature, precipitation, and sunshine duration; dNDVIps/dt is the inter-annual variation rate (slope) of NDVIps; ΔNDVIps is calculated as the product of ∂NDVI/∂NDVIps and dNDVIps/dt. A similar method is also suitable for other variables. Before quantification analysis, we detrended all variables to transform the time series to Z-score standardized anomalies:
where x and ω are the mean and standard deviation of study variables in each active season, respectively. x is the value of the study variable.
3. Results
3.1. Spatiotemporal Variations of Vegetation Growth
We obtained the vegetation coverage levels of the upper and middle reaches of the YRB during the growing season from 2000 to 2019 (Table 3). The medium vegetation cover areas were the largest (33.54%), followed by medium-high vegetation cover areas (30.92%, Table 3). Overall, the spatial distribution of mean NDVI during the growing season declined trend from southeast to northwest (Figure 2a), which was consistent with the spatial pattern of precipitation (Figure S1a) but opposite to the spatial distribution of sunshine duration (Figure S1c). NDVI had no obvious relationship with the spatial pattern of temperature (Figure S1b). The NDVI of the forests and savannas is high, while the grasslands have a low NDVI. Although the upper reach is primarily occupied by grasslands (Figure 1d), rivers are widely distributed (Figure 1c), which is conducive to vegetation growth, showing a high NDVI value. Compared with other study areas, the southeast has more precipitation and has extensive forests, croplands, and savannas (Figure 1d), so the NDVI is relatively high.
Table 3.
Vegetation coverage levels in the upper and middle reaches of the YRB during the growing season from 2000–2019.
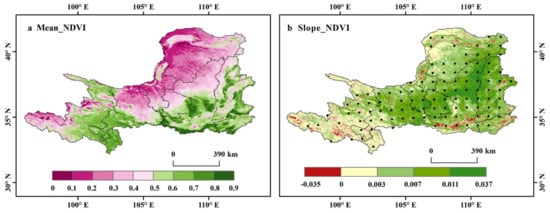
Figure 2.
Spatial distribution of the mean NDVI (a) and inter-annual variation rate (slope) (b) during the growing season in the upper and middle reaches of the Yellow River basin from 2000 to 2019. Black dots indicate statistically significant correlations at the 95% confidence level. Same below.
From 2000 to 2019, the mean NDVI during the growing season of the upper and middle reaches of the YRB exhibited a significant growth trend with a rate of 0.0056 per year (p < 0.001) (Figure 2b). Similarly, the mean GPP and LAI also showed a positive and significant trend (p < 0.001) at rates of 0.3718 per year and 0.0231 per year (Figure S2), respectively. The inter-annual variation of these vegetation indicators suggested that the vegetation coverage and productivity significantly increased in the study area over the two decades. In addition, we calculated the inter-annual variation rates of vegetation NDVI in each active season over the study period (Figure S3). The spatial distribution of inter-annual variation rates of NDVI in the early, peak, and late growing season (EGS, PGS, and LGS) was similar, with the rates equal to 0.0062 per year (p < 0.001), 0.0059 per year (p < 0.001), and 0.0046 per year (p < 0.001), respectively. EGS showed the strongest trend of vegetation greening, followed by PGS, although PGS showed a higher vegetation degradation trend than the other two sub-seasons (Figure S3b). Only LGS had a lower vegetation variation trend than the 20-year growing season mean trend (0.0056 per year). For climate variables, the precipitation in the growing season in the upper and middle reaches of the YRB increased significantly over the 20-year period, at a rate of 2.467 mm/year (p < 0.05) (Figure S1d). However, the interannual variation rate of sunshine duration decreased significantly, by –6.0620 h/year (p < 0.05) (Figure S1f). We found that the temperature increased at a rate of 0.012 ℃/year (p > 0.05), which did not pass the significance test (Figure S1e).
3.2. Inter-Seasonal VGC Dominates Seasonal Vegetation Growth
At the seasonal scale, the relationships among the three vegetation indicators (NDVI, GPP, and LAI) and each driving factor were analyzed from 2000–2019. The results showed that the preceding-season NDVI significantly (p < 0.05) controls the current season vegetation NDVI in the three active seasons (Figure 3). The VGC effect was also positive for seasonal vegetation growth across the majority (91%, 93%, and 95% for EGS, PGS, and LGS, respectively) of the upper and middle reaches of the YRB (Figure 4). The partial correlation coefficients between the concurrent seasonal NDVI and the preceding-season NDVI in EGS, PGS, and LGS were 0.5168, 0.5743, and 0.6146, respectively (Figure 3), indicating that the strength of the VGC effect on vegetation growth increased from early to late growing season. In addition, the positive effect of VGC controlling vegetation growth in the three active seasons was also verified by examining the other vegetation growth and productivity indicators GPP and LAI (Figures S4 and S5). The matrix diagram and spatial distribution diagram of partial correlation coefficients of NDVI, GPP, and LAI showed a strong similarity. The vegetation growth and productivity of the preceding season were the dominant factors predicting vegetation greenness in each active growing season, implying that our results are reliable and the VGC cannot be ignored in the research of vegetation dynamics.
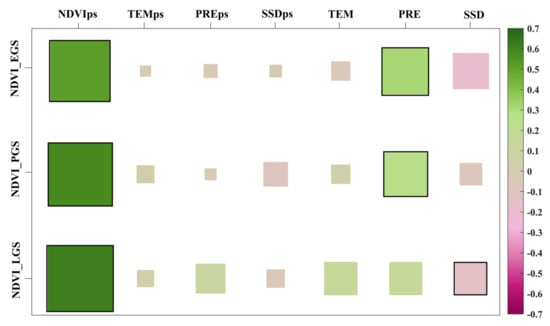
Figure 3.
Partial correlation coefficients between 20-year seasonal NDVI time series and concurrent climate factors (temperature, TEM, precipitation, PRE, and sunshine duration, SSD), and climate factors (TEMps, PREps, and SSDps) and NDVI (NDVIps) of the preceding season. The color block size represents the element value size. Squares with black outlines show statistically significant correlations at the 95% confidence level.
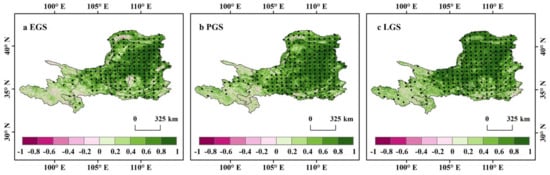
Figure 4.
Spatial distribution of the partial correlations between NDVI of each season and that of the preceding season. Correlationpatterns are shown for EGS (a), PGS (b), and LGS (c).
Compared with the positive effect of the VGC, the intensity and direction of climate factors, including the immediate and lagged impacts of climate, determining the interannual variation of seasonal NDVI (GPP and LAI) varied greatly between seasons and across regions (Figure 5, Figure 6, and Figures S6–S9). The concurrent precipitation is the primary climate factor determining the inter-annual variation of EGS and PGS NDVI of the upper and middle reaches of the YRB over the 20-year period (partial correlation: 0.3122, p < 0.05; 0.2686, p < 0.05, respectively) (Figure 3 and Figure 5d–e). The positive impact of concurrent precipitation on vegetation growth in EGS and PGS was also consistent in the analyses of other vegetation indicators GPP (Figures S4 and S6d–e) and LAI (Figures S4 and S8d–e). However, the concurrent precipitation had a much weaker impact on LGS vegetation, in comparison to that of EGS and PGS (Figure 3 and Figure 5f). The immediate impact of precipitation diminished over the season (Figure 3 and Figure 5d–f), contrary to the VGC effect. The precipitation of the preceding season had no obvious positive effect on vegetation growth in EGS and PGS, yet the positive effect in LGS increased (Figure 6d–f, Figures S7d–f, and S9d–f). The temperature of the current and preceding season on vegetation growth was very weak and statistically insignificant during the three active seasons. The weak temperature influence may be due to a spatial canceling-out of the positive effects and the negative effects (Figure 5a–c and Figure 6a–c). Both the current- and preceding-season sunshine duration had negative effects on vegetation growth (Figure 5, Figure 6 and Figures S6–S9). The same results were also observed for GPP and LAI (Figures S6–S9).
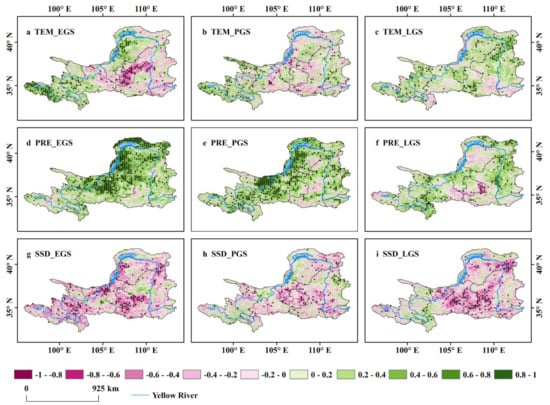
Figure 5.
Spatial distribution of the partial correlations between NDVI of each season and the concurrent climate factors. Correlation patterns are shown for EGS (a,d,g), PGS (b,e,h), and LGS (c,f,i), and for correlation with concurrent TEM (a–c), PRE (d–f), and SSD (g–i).
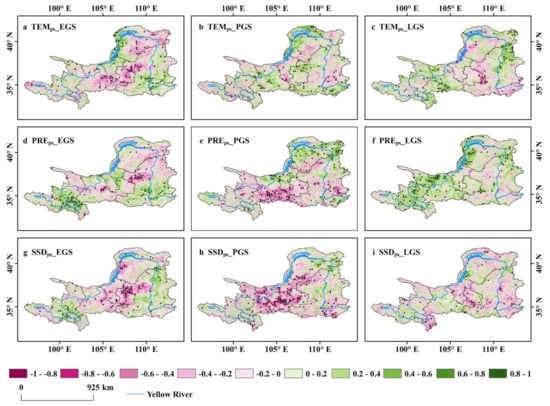
Figure 6.
Spatial distribution of the partial correlations between NDVI of each season and climate factors of the preceding season. Correlation patterns are shown for EGS (a,d,g), PGS (b,e,h), and LGS (c,f,i), and for correlation with TEMps (a–c), PREps (d–f), and SSDps (g–i).
3.3. The Persistence of the Vegetation Carryover into the Next Year
At the annual scale, we performed a partial correlation analysis between the current-year NDVI and the NDVI of the lag years. For a time lag of one year, 90.7% of study areas showed positive lagged correlations (Figure 7a). Among them, 52.5% passed the significance test (p < 0.05). The positive inter-annual vegetation carryover was most significant in eastern areas, particularly over the Shaanxi and Shanxi provinces. By contrast, only a few areas, including the upper reaches of the YRB and the northern desert, had a negative but generally insignificant (p > 0.05) vegetation carryover effect. This positive inter-annual VGC effect indicates that the vegetation productivity of the current year can carry over to the next year. If time lags are two years, 80.5% of study areas showed a positive relationship between the current-year NDVI and the NDVI of two years earlier (Figure 7b), but only 30.0% of the areas passed the significance test (p < 0.05). Compared to a one-year time lag, the area of positive correlation passing the significance test is significantly reduced (22.5%). If time lags are three and four years, the positive lagged correlation areas are 73.4% and 67.6%, respectively (Figure 7c–d), among which 29.5% and 23.1% passed the significance test (p < 0.05), respectively. From the third year of time lags, the positive VGC effect areas that passed the significance test remained at about 30%, indicating that the VGC effect can be carried over to the subsequent year yet weakly to years after that.
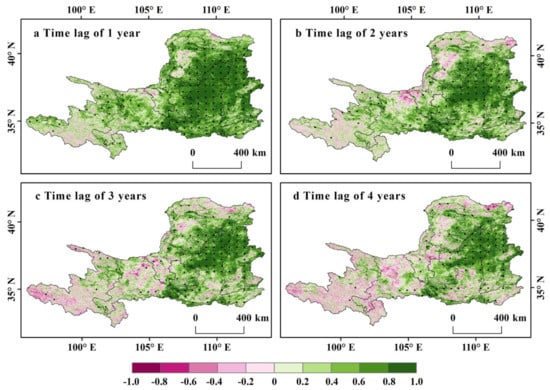
Figure 7.
Spatial distribution of the partial correlations between NDVI of each year and that of the lag time, after controlling for the climate variable of both years.
3.4. The Individual Contributions of Climate Effects and the VGC Effect
For each active season, we further quantified the individual contributions of the VGC effect, climate effects of the concurrent season, and climate effects of the preceding season on the 20-year vegetation growth (Figure 8). We combined the impacts of temperature, precipitation, and sunshine duration into the single variable of climate effects. The results showed that the greening trends in the three active growing seasons were predominantly attributed to the VGC (the contributions are 50%, 67%, and 58%, respectively) (Figure 8), confirming the positive carryover effect of vegetation seasonal growth. It is interesting to note that the VGC effect had the strongest correlation with NDVI during the LGS (Figure 3) but the VGC effect contributed the most to vegetation growth in PGS (Figure 8). We also found that PGS was the season whose inter-annual variation trend (slope) of vegetation growth was most similar to that of the growing-season mean (gray dashed line, Figure 8). Concurrent seasonal climate factors also played a positive role in the three active growing seasons of vegetation growth (the contributions are 14.24% (EGS), 19.38% (PGS), and 13.80% (LGS), Figure 8). In comparison, the climate of the preceding season played a much smaller role in the vegetation greening for the three active growing seasons (the contributions are 0.64% (EGS), 5.58% (PGS), and 10.03% (LGS), Figure 8). Residuals is the contributions of other driving factors, including human activities and natural disturbances, that could influence vegetation growth but were not analyzed in our research. However, the residuals had a positive impact on vegetation greening, especially in the EGS (Figure 8). From Figure 3, VGC- and humid-induced vegetation greening from the early growth season sustained to the late growing season (ignoring residuals), which was the primary factor dominating vegetation growth in the upper and middle reaches of the Yellow River in the 20 years period.
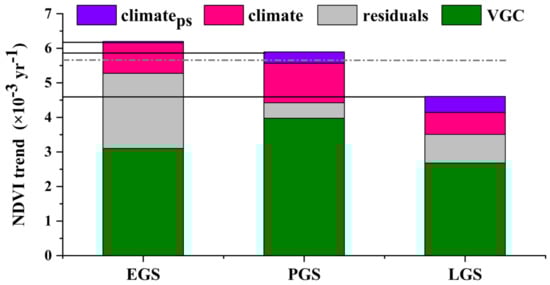
Figure 8.
Individual contributions of the vegetation growth carryover (VGC) and the immediate (climate) and lagged (climateps) climate effects to seasonal NDVI trends over a 20-year period (2000–2019). The gray dashed line indicates the 20-year growing-season mean NDVI trend. The black solid lines indicate the observed NDVI trends of each season.
4. Discussion
4.1. The Effects of Climate Variability on Vegetation Growth
Regarding climate variability, vegetation growth in dry-land ecosystems is more sensitive to external precipitation changes (Figure 3, Figure 5 and Figure 6). The concurrent seasonal precipitation in the EGS and PGS had a significant positive effect on vegetation growth in the upper and middle reaches of the YRB, which was consistent with prior work [38]. The main reason for this sensitivity to precipitation may be that our study area is dominated by arid and semiarid areas [39]. Another possible explanation involves the widely distributed grasslands in the area (Figure 1d). Because herbs absorb the water from the upper part of the soil, they respond quickly to changes in precipitation [40]. Compared with the EGS and PGS seasons, the effect of concurrent precipitation on vegetation growth was weak in the LGS season. This phenomenon may be attributed to vegetation growth needing more moisture during green-up and maturity (EGS and PGS) than in senescence (LGS) [41]. The preceding-season precipitation in EGS and PGS had a weak effect on concurrent vegetation seasonal growth, indicating that the lagged effect of precipitation is not significant in the area with grassland as the main vegetation type [21]. This result is reasonable because the xylem in the stem of herbaceous plants is underdeveloped, so their water storage capacity is low [42]. In addition, the root system of plants matures in the late growing season, and the roots deeper in the soil dry out more slowly, so the precipitation of the preceding season has a positive effect on vegetation growth in LGS [21]. The sensitivity of precipitation clearly states that water availability is very important for vegetation growth in water-controlled ecosystems [43]. The immediate and lagged impacts of temperature had strong spatial heterogeneity and did not exhibit significant temporal effects on vegetation growth, which may be because the positive and negative effects cancel each other out. Especially in the EGS, the concurrent season temperature had a positive effect on vegetation growth in the western and northern parts of the study area, while it had a negative effect on vegetation growth in the central part of the study area (Figure 5a). This stemmed from the melting of snow and ice in early spring in the western alpine region, which promoted vegetation growth and improved vegetation productivity [44]. The upper and middle reaches of the YRB have plenty of sunshine, with an average annual sunshine duration of 2605 h in the past 30 years [4]. The sunshine duration, including the immediate and lagged impacts, was negatively correlated with seasonal vegetation growth. This may be because high sunshine duration increases evapotranspiration and thus drought, further inhibiting vegetation growth [41].
4.2. The Effects of Vegetation Growth Carryover on Vegetation Growth
Most people believe that vegetation growth depends mainly on external climate factors and human activity [1,45,46]. Our findings suggest that vegetation carryover has a significant positive impact on vegetation growth (Figure 3 and Figure 4). That is to say, the VGC effect is the primary positive factor controlling the seasonal vegetation growth, also shown by others [17,18]. The positive effect of VGC in the three active growth seasons makes it easier to carry over the vegetation state in each season, and then affects vegetation growth in subsequent seasons. For instance, although sunshine duration had a negative effect on seasonal vegetation growth by increasing evapotranspiration [41,47], the positive and strong VGC effect can override this adverse effect. The same phenomenon was observed previously for high temperature [17,18]. In addition, the VGC effect in the central and northern part of our study area was stronger than in other regions, confirming that vegetation in drought regions may have a stronger VGC effect [10,18]. This strong vegetation carryover effect in drought regions implies that disturbances might have severer effects on vegetation in these areas. Initial ecological restoration and sustainable conservation would promote vegetation growth and increase vegetation productivity, which is of great significance to arid areas. Our results also exhibited that the persistence of the vegetation carryover can be sustained to the next year. So, a year with better vegetation growth is often followed by another year with better vegetation growth. Prior work has reported that drought legacies mostly last for one year, with significantly fewer legacies in the second and third years [48], as did our study of the VGC effect (Figure 7). Correspondingly, if vegetation does not overcome the influence of negative disturbances (e.g., wildfires, insect pests, and extreme climate) in time, the vegetation will slow growth in the coming years [18]. All the above evidence confirms the importance of the VGC effect on seasonal vegetation growth. Vegetation carryover is a critical pathway that should not be ignored.
4.3. Contributions of Climate Variability and Vegetation Carryover to Vegetation Greening
This study revealed that the strong observed greening trend of vegetation in each active season was mainly contributed by the VGC effect (Figure 8). Although the VGC effect was weaker during the early growing season, it increased from early to late growing season. High-quality vegetation growth in the early growing season determines vegetation growth in the subsequent seasons. The current-season climate factor, especially precipitation, is another important contributor, followed by the climate of the preceding season. Concerning the effect of current-season precipitation, vegetation was more sensitive in the early growing season. These phenomena may be attributed to the characteristics of vegetation—a low tolerance for lack of water during the early growth stage [18,49]. From this perspective, it is most effective to intervene in the vegetation to promote vegetation growth in spring through implementing ecological conservation and improving water conditions. There is still a proportion of unexplained variance (residuals) in vegetation growth in the three active seasons. These unexplained variances reflected the contributions of other drivers of vegetation growth, such as carbon dioxide fertilization and nitrogen deposition [1,50,51], human activities, [24,52,53], natural disturbances [7,15,54], and precipitation pattern shift [55]. The higher growth rate (black solid line) observed in the early parts of the growing season was primarily inherited from the vegetation carryover and residuals. However, this study focused on the impacts of climate factors and VGC effects at a seasonal scale and, therefore, did not quantitatively analyze other factors. As climate change is a continuous process, it may accumulate over time and then affect vegetation growth. Studies have shown that vegetation is significantly correlated with 2–6 months of cumulative precipitation [7], and precipitation on the Loess Plateau has a positive cumulative effect, especially in April and May [52]. This means that early spring precipitation may affect vegetation greening. Thus, the residuals in EGS may be contributed by the cumulative effect of precipitation. In addition, the melting of alpine snow and ice in early spring also provides moisture for vegetation growth in EGS [52]. The large-scale ecological restoration project, Grain to Green Project (GTGP), which was implemented to improve the ecological environment and maintain the ecological balance in the study area, has reduced arable land and increased forest and grassland. A prior study demonstrated that vegetation restoration is faster for lands converted to woodlands and grasslands than land with no conversion under similar dry conditions [38]. This is also the reason why the VGC effect in the study area is stronger than other factors. In the PGS, it showed a higher contribution of vegetation growth carryover effect, which is primarily inherited from the preceding-season vegetation greening (67%) rather than from the contributions of the climate factors (19%). Without considering the vegetation growth carryover effect, numerous studies suggested that climate factors and human activities are the driving factors for vegetation greening [4,21,45]. Yet, our study shows that the VGC effect contributes much more to vegetation greening than other factors. Though the positive VGC effect of vegetation growth can override negative climate impacts under the present climate and carry over into the subsequent year, it is still an open question whether this positive vegetation carryover will continue with future climate change.
4.4. Limitations and Implications
Although we studied the responses of vegetation dynamics to various drivers on the phenology-based seasonal scale, due to the complex driving factors, there are still some limitations and uncertainties in our study. Firstly, due to differences in sensor performance and soil background color, satellite-based NDVI data have inherent limitations [18]. Secondly, other factors, such as natural disturbance and human activities have a non-negligible impact on vegetation growth [1,50n51]. Taking all these factors into account is the most likely to yield more comprehensive and accurate outcomes. Finally, we noticed that climate factors have both a time delay effect and a cumulative effect on global vegetation growth. Our research only focused on the immediate and lagged impacts of climate. Therefore, in future work, we should discuss the influence of other variables in detail.
5. Conclusions
Based on the phenological seasonal scale, we exhibit vegetation dynamics in the upper and middle reaches of the Yellow River basin from 2000 to 2019, as well as immediate and lagged impacts of climate and vegetation growth carryover effects. The following conclusions are drawn: (1) From 2000 to 2019, the spatial distribution of mean NDVI, GPP, and LAI in the growing season exhibited a declining trend from southeast to northwest in the upper and middle reaches of the YRB. The vegetation coverage and productivity experienced a significant increase throughout the study area. (2) Significant positive correlations in the statistical analyses suggest that the vegetation carryover effect dominated the vegetation greening during the three active growing seasons, and this effect increased from early to late growing season. The concurrent season climate factors, especially precipitation, are also important drivers, followed by the climate of the preceding season. Sunshine duration, including its immediate and lagged impacts, always played a negative effect on vegetation growth. (3) As expected, the strongly observed greening trends of the three growing seasons were predominately attributed to the vegetation growth state of the preceding season. In addition, the vegetation growth carryover can be carried over to the subsequent year.
This carryover in seasonal vegetation growth is conducive to the next stage of vegetation growth. Although the vegetation growth carryover effect can counteract the negative effects of climate factors, whether this growth carryover effect will still exist under future climate change still needs to be addressed in future research.
Supplementary Materials
The following supporting information can be downloaded at: https://www.mdpi.com/article/10.3390/rs14195011/s1, Figure S1: Spatial distribution (a–c) and inter-annual variation rates (slope) (d–f) of mean precipitation (PRE), mean temperature (TEM), and mean sunshine duration (SSD) in growing season in the upper and middle reaches of the YRB over a 20-year period (2000–2019); Figure S2: The inter-annual variation rates (slope) of GPP (a) and LAI (b) in the growing season in the middle and upper of the YRB over a 20-year period (2000–2019). Black dots indicate statistically significant correlations at the 95% confidence level. Same below; Figure S3: The inter-annual variation rates (slope) of NDVI in three active seasons in the upper and middle reaches of the YRB over a 20-year period (2000–2019). The slopes patterns are shown for EGS (a), PGS (b) and LGS (c); Figure S4: Partial correlations between vegetation growth and that of its driving factors. This is same as Figure 3, except that vegetation growth is here based on GPP (a) and LAI (b); Figure S5: Spatial distribution of the partial correlations between GPP (a–c) or LAI (d–f) of each season and that of the preceding season. Correlation patterns are shown for EGS (a,d), PGS (b,e), and LGS (c,f); Figure S6: Spatial distribution of the partial correlations between GPP of each season and the concurrent climate factors. Correlation patterns are shown for EGS (a,d,g), PGS (b,e,h) and LGS (c,f,i), and for correlation with concurrent temperature (TEM) (a–c), precipitation (PRE) (d–f) and sunshine duration (SSD) (g–i); Figure S7: Spatial distribution of the partial correlations between GPP of each season and climate factors of the preceding season. Correlation patterns are shown for EGS (a,d,g), PGS (b,e,h) and LGS (c,f,i), and for correlation with preceding season temperature (TEM) (a–c), precipitation (PRE) (d–f), and sunshine duration (SSD) (g–i); Figure S8: Spatial distribution of the partial correlations between LAI of each season and the concurrent climate factors. Correlation patterns are shown for EGS (a,d,g), PGS (b,e,h) and LGS (c,f,i), and for correlation with concurrent temperature (TEM) (a–c), precipitation (PRE) (d–f), and sunshine duration (SSD) (g–i); Figure S9: Spatial distribution of the partial correlations between LAI of each season and climate factors of the preceding season. Correlation patterns are shown for EGS (a,d,g), PGS (b,e,h), and LGS (c,f,i), and for correlation with preceding season temperature (TEM) (a–c), precipitation (PRE) (d–f) and sunshine duration (SSD) (g–i).
Author Contributions
Conceptualization, X.Z. and J.L.; Funding acquisition, J.L.; Methodology, X.Z., Q.C., H.C. and J.L.; Resources, J.L.; Software, X.Z.; Visualization, X.Z.; Writing—original draft, X.Z.; Writing—review and editing, Q.C., H.C., Q.Q., C.L., J.D., M.C., S.Y. and J.L. All authors have read and agreed to the published version of the manuscript.
Funding
This research was funded by the National Natural Science Foundation of China (No. 32071523); the Scientific Project of Jinan Environmental Research Academy (No. SDGP370100202102000636); and the Hydraulic Science and Technology Plan Foundation of Shaanxi Province (No. 2019slkj-B1).
Institutional Review Board Statement
Not applicable.
Informed Consent Statement
Not applicable.
Data Availability Statement
Publicly available datasets were analyzed in this study. The data source and access links are indicated in the text. The code for the analysis of the data in this article is available from the corresponding author upon reasonable request.
Acknowledgments
The authors thank Pamela Holt (Shandong University) for improving the English language of our manuscript.
Conflicts of Interest
The authors declare no conflict of interest.
References
- Piao, S.; Wang, X.; Wang, K.; Li, X.; Bastos, A.; Canadell, J.G.; Ciais, P.; Friedlingstein, P.; Sitch, S. Interannual variation of terrestrial carbon cycle: Issues and perspectives. Glob. Chang. Biol. 2020, 26, 300–318. [Google Scholar] [CrossRef] [PubMed]
- Gemitzi, A.; Albarakat, R.; Kratouna, F.; Lakshmi, V. Land cover and vegetation carbon stock changes in Greece: A 29-year assessment based on CORINE and Landsat land cover data. Sci. Total Environ. 2021, 786, 147408. [Google Scholar] [CrossRef] [PubMed]
- Konapala, G.; Mishra, A.K.; Wada, Y.; Mann, M.E. Climate change will affect global water availability through compounding changes in seasonal precipitation and evaporation. Nat. Commun. 2020, 11, 3044. [Google Scholar] [CrossRef] [PubMed]
- Lu, C.; Hou, M.; Liu, Z.; Li, H.; Lu, C. Variation Characteristic of NDVI and its Response to Climate Change in the Middle and Upper Reaches of Yellow River Basin, China. IEEE J. Sel. Top. Appl. Earth Obs. Remote Sens. 2021, 14, 8484–8496. [Google Scholar] [CrossRef]
- Duan, H.; Qi, Y.; Kang, W.; Zhang, J.; Wang, H.; Jiang, X. Seasonal Variation of Vegetation and Its Spatiotemporal Response to Climatic Factors in the Qilian Mountains, China. Sustainability 2022, 14, 4926. [Google Scholar] [CrossRef]
- Zhang, W.; Wang, L.; Xiang, F.; Qin, W.; Jiang, W. Vegetation dynamics and the relations with climate change at multiple time scales in the Yangtze River and Yellow River Basin, China. Ecol. Indic. 2020, 110, 105892. [Google Scholar] [CrossRef]
- Chen, Z.; Wang, W.; Fu, J. Vegetation response to precipitation anomalies under different climatic and biogeographical conditions in China. Sci. Rep. 2020, 10, 830. [Google Scholar] [CrossRef]
- Yan, Y.; Liu, X.; Wen, Y.; Ou, J. Quantitative analysis of the contributions of climatic and human factors to grassland productivity in northern China. Ecol. Indic. 2019, 103, 542–553. [Google Scholar] [CrossRef]
- Lucht, W.; Prentice, I.C.; Myneni, R.B.; Sitch, S.; Friedlingstein, P.; Cramer, W.; Bousquet, P.; Buermann, W.; Smith, B. Climate control of the high-latitude vegetation greening trend and Pinatubo effect. Science 2002, 296, 1687–1689. [Google Scholar] [CrossRef]
- Seddon, A.W.R.; Macias-Fauria, M.; Long, P.R.; Benz, D.; Willis, K.J. Sensitivity of global terrestrial ecosystems to climate variability. Nature 2016, 531, 229–232. [Google Scholar] [CrossRef]
- Ayanlade, A.; Jeje, O.D.; Nwaezeigwe, J.O.; Orimoogunje, O.O.I.; Olokeogun, O.S. Rainfall seasonality effects on vegetation greenness in different ecological zones. Environ. Challenges. 2021, 4, 100144. [Google Scholar] [CrossRef]
- Soergel, B.; Kriegler, E.; Weindl, I.; Rauner, S.; Dirnaichner, A.; Ruhe, C.; Hofmann, M.; Bauer, N.; Bertram, C.; Bodirsky, B.L.; et al. A sustainable development pathway for climate action within the UN 2030 Agenda. Nat. Clim. Chang. 2021, 11, 656–664. [Google Scholar] [CrossRef]
- Anderegg, W.R.L.; Schwalm, C.; Biondi, F.; Camarero, J.J.; Koch, G.; Litvak, M.; Ogle, K.; Shaw, J.D.; Shevliakova, E.; Williams, A.P.; et al. Pervasive drought legacies in forest ecosystems and their implications for carbon cycle models. Science 2015, 349, 528–532. [Google Scholar] [CrossRef]
- Piao, S.; Fang, J.; Zhou, L.; Guo, Q.; Henderson, M.; Ji, W.; Li, Y.; Tao, S. Interannual variations of monthly and seasonal normalized difference vegetation index (NDVI) in China from 1982 to 1999. J. Geophys. Res. Atmos. 2003, 108, 4401. [Google Scholar] [CrossRef]
- Wu, D.; Zhao, X.; Liang, S.; Zhou, T.; Huang, K.; Tang, B.; Zhao, W. Time-lag effects of global vegetation responses to climate change. Glob. Change Biol. 2015, 21, 3520–3531. [Google Scholar] [CrossRef]
- Sun, Q.; Liu, C.; Chen, T.; Zhang, A. A Weighted-Time-Lag Method to Detect Lag Vegetation Response to Climate Variation: A Case Study in Loess Plateau, China, 1982–2013. Remote Sens. 2021, 13, 923. [Google Scholar] [CrossRef]
- Lian, X.; Piao, S.; Chen, A.; Wang, K.; Li, X.; Buermann, W.; Huntingford, C.; Peñuelas, J.; Xu, H.; Myneni, R.B. Seasonal biological carryover dominates northern vegetation growth. Nat. Commun. 2021, 12, 983. [Google Scholar] [CrossRef]
- Yuan, Y.; Bao, A.; Jiapaer, G.; Jiang, L.; De Maeyer, P. Phenology-based seasonal terrestrial vegetation growth response to climate variability with consideration of cumulative effect and biological carryover. Sci. Total Environ. 2022, 817, 152805. [Google Scholar] [CrossRef]
- O’Connor, C.M.; Norris, D.R.; Crossin, G.T.; Cooke, S.J. Biological carryover effects: Linking common concepts and mechanisms in ecology and evolution. Ecosphere 2014, 5, art28. [Google Scholar] [CrossRef]
- Liu, Y.; Schwalm, C.R.; Samuels-Crow, K.E.; Ogle, K. Ecological memory of daily carbon exchange across the globe and its importance in drylands. Ecol. Lett. 2019, 22, 1806–1816. [Google Scholar] [CrossRef]
- Jiang, W.; Niu, Z.; Wang, L.; Yao, R.; Gui, X.; Xiang, F.; Ji, Y. Impacts of Drought and Climatic Factors on Vegetation Dynamics in the Yellow River Basin and Yangtze River Basin, China. Remote Sens. 2022, 14, 930. [Google Scholar] [CrossRef]
- Fang, M.; Si, G.; Yu, Q.; Huang, H.; Huang, Y.; Liu, W.; Guo, H. Study on the Relationship between Topological Characteristics of Vegetation Ecospatial Network and Carbon Sequestration Capacity in the Yellow River Basin, China. Remote Sens. 2021, 13, 4926. [Google Scholar] [CrossRef]
- Ma, L.; Xia, H.; Meng, Q. Spatiotemporal Variability of Asymmetric Daytime and Night-Time Warming and Its Effects on Vegetation in the Yellow River Basin from 1982 to 2015. Sensors 2019, 19, 1832. [Google Scholar] [CrossRef]
- Liu, W.; Shi, C.; Zhou, Y. Trends and attribution of runoff changes in the upper and middle reaches of the Yellow River in China. J. Hydro-Enviro. Res. 2021, 37, 57–66. [Google Scholar] [CrossRef]
- Zhao, Y.; Hu, C.; Zhang, X.; Lv, X.; Yin, X.; Wang, Z. Response of sediment discharge to soil erosion control in the middle reaches of the Yellow River. Catena 2021, 203, 105330. [Google Scholar] [CrossRef]
- Yu, M.; Gao, Q. Increasing Summer Rainfall and Asymmetrical Diurnal and Seasonal Warming Enhanced Vegetation Greenness in Temperate Deciduous Forests and Grasslands of Northern China. Remote. Sens. 2020, 12, 2569. [Google Scholar] [CrossRef]
- Kong, D.; Zhang, Q.; Singh, V.P.; Shi, P. Seasonal vegetation response to climate change in the Northern Hemisphere (1982–2013). Glob. Planet. Change. 2017, 148, 1–8. [Google Scholar] [CrossRef]
- Gao, M.; Piao, S.; Chen, A.; Yang, H.; Liu, Q.; Fu, Y.H.; Janssens, I.A. Divergent changes in the elevational gradient of vegetation activities over the last 30 years. Nat. Commun. 2019, 10, 2970. [Google Scholar] [CrossRef]
- Beck, H.E.; Zimmermann, N.E.; McVicar, T.R.; Vergopolan, N.; Berg, A.; Wood, E.F. Present and future Köppen-Geiger climate classification maps at 1-km resolution. Sci. Data 2018, 5, 180214. [Google Scholar] [CrossRef]
- Chen, J.; Jönsson, P.; Tamura, M.; Gu, Z.; Matsushita, B.; Eklundh, L. A simple method for reconstructing a high-quality NDVI time-series data set based on the Savitzky–Golay filter. Remote Sens. Environ. 2004, 91, 332–344. [Google Scholar] [CrossRef]
- Jönsson, P.; Eklundh, L. TIMESAT—A program for analyzing time-series of satellite sensor data. Comput. Geosci. 2004, 30, 833–845. [Google Scholar] [CrossRef]
- Moss, D.N. Solar energy in photosynthesis. Sol. Energy. 1967, 11, 173–179. [Google Scholar] [CrossRef]
- Peng, S.; Piao, S.; Ciais, P.; Myneni, R.B.; Chen, A.; Chevallier, F.; Dolman, A.J.; Janssens, I.A.; Peñuelas, J.; Zhang, G.; et al. Asymmetric effects of daytime and night-time warming on Northern Hemisphere vegetation. Nature 2013, 501, 88–92. [Google Scholar] [CrossRef] [PubMed]
- Lian, X.; Piao, S.; Li, L.Z.X.; Li, Y.; Huntingford, C.; Ciais, P.; Cescatti, A.; Janssens, I.A.; Peñuelas, J.; Buermann, W.; et al. Summer soil drying exacerbated by earlier spring greening of northern vegetation. Sci. Adv. 2020, 6, eaax0255. [Google Scholar] [CrossRef] [PubMed]
- Zhu, Z.; Piao, S.; Lian, X.; Myneni, R.B.; Peng, S.; Yang, H. Attribution of seasonal leaf area index trends in the northern latitudes with “optimally” integrated ecosystem models. Glob. Chang. Biol. 2017, 23, 4798–4813. [Google Scholar] [CrossRef] [PubMed]
- Wang, L.; Tian, F.; Huang, K.; Wang, Y.; Wu, Z.; Fensholt, R. Asymmetric patterns and temporal changes in phenology-based seasonal gross carbon uptake of global terrestrial ecosystems. Glob. Ecol. Biogeogr. 2020, 29, 1020–1033. [Google Scholar] [CrossRef]
- Pei, T.; Ji, Z.; Chen, Y.; Wu, H.; Hou, Q.; Qin, G.; Xie, B. The Sensitivity of Vegetation Phenology to Extreme Climate Indices in the Loess Plateau, China. Sustainability 2021, 13, 7623. [Google Scholar] [CrossRef]
- Ren, Y.; Liu, J.; Liu, S.; Wang, Z.; Liu, T.; Shalamzari, M.J. Effects of Climate Change on Vegetation Growth in the Yellow River Basin from 2000 to 2019. Remote Sens. 2022, 14, 687. [Google Scholar] [CrossRef]
- Wang, W.; Sun, L.; Luo, Y. Changes in Vegetation Greenness in the Upper and Middle Reaches of the Yellow River Basin over 2000–2015. Sustainability 2019, 11, 2176. [Google Scholar] [CrossRef]
- Knapp, A.K.; Carroll, C.J.W.; Denton, E.M.; La Pierre, K.J.; Collins, S.L.; Smith, M.D. Differential sensitivity to regional-scale drought in six central US grasslands. Oecologia 2015, 177, 949–957. [Google Scholar] [CrossRef]
- Ding, Y.; Li, Z.; Peng, S. Global analysis of time-lag and -accumulation effects of climate on vegetation growth. Int. J. Appl. Earth Obs. Geoinf. 2020, 92, 102679. [Google Scholar] [CrossRef]
- Craine, J.M.; Ocheltree, T.W.; Nippert, J.B.; Towne, E.G.; Skibbe, A.M.; Kembel, S.W.; Fargione, J.E. Global diversity of drought tolerance and grassland climate-change resilience. Nat. Clim. Chang. 2012, 3, 63–67. [Google Scholar] [CrossRef]
- Costa, G.B.; Mendes, K.R.; Viana, L.B.; Almeida, G.V.; Mutti, P.R.; e Silva, C.M.S.; Bezerra, B.G.; Marques, T.V.; Ferreira, R.R.; Oliveira, C.P.; et al. Seasonal Ecosystem Productivity in a Seasonally Dry Tropical Forest (Caatinga) Using Flux Tower Measurements and Remote Sensing Data. Remote Sens. 2022, 14, 3955. [Google Scholar] [CrossRef]
- Wang, T.; Peng, S.; Lin, X.; Chang, J. Declining snow cover may affect spring phenological trend on the Tibetan Plateau. Proc. Natl. Acad. Sci. USA 2013, 110, E2854–E2855. [Google Scholar] [CrossRef]
- Ji, Y.; Zhou, G.; Wang, S.; Wang, L. Prominent vegetation greening and its correlation with climatic variables in northern China. Environ. Monit. Assess. 2020, 192, 636. [Google Scholar] [CrossRef]
- Omer, A.; Elagib, N.A.; Zhuguo, M.; Saleem, F.; Mohammed, A. Water scarcity in the Yellow River Basin under future climate change and human activities. Sci. Total Environ. 2020, 749, 141446. [Google Scholar] [CrossRef]
- Vicente-Serrano, S.M.; Gouveia, C.; Camarero, J.J.; Begueria, S.; Trigo, R.; Lopez-Moreno, J.I.; Azorín-Molina, C.; Pasho, E.; Lorenzo-Lacruz, J.; Revuelto, J.; et al. Response of vegetation to drought time-scales across global land biomes. Proc. Natl. Acad. Sci. USA 2013, 110, 52–57. [Google Scholar] [CrossRef]
- Gazol, A.; Camarero, J.J.; Sánchez-Salguero, R.; Vicente-Serrano, S.M.; Serra-Maluquer, X.; Gutiérrez, E.; de Luis, M.; Sangüesa-Barreda, G.; Novak, K.; Rozas, V.; et al. Drought legacies are short, prevail in dry conifer forests and depend on growth variability. J. Ecol. 2020, 108, 2473–2484. [Google Scholar] [CrossRef]
- Zhang, J.; Zhang, Y.; Qin, S.; Wu, B.; Wu, X.; Zhu, Y.; Shao, Y.; Gao, Y.; Jin, Q.; Lai, Z. Effects of seasonal variability of climate factors on vegetation coverage across drylands in northern China. Land Degrad. Dev. 2018, 29, 1782–1791. [Google Scholar] [CrossRef]
- Zhu, Z.; Piao, S.; Myneni, R.B.; Huang, M.; Zeng, Z.; Canadell, J.G.; Ciais, P.; Sitch, S.; Friedlingstein, P.; Arneth, A.; et al. Greening of the Earth and its drivers. Nat. Clim. Chang. 2016, 6, 791–795. [Google Scholar] [CrossRef]
- Nemani, R.R.; Keeling, C.D.; Hashimoto, H.; Jolly, W.M.; Piper, S.C.; Tucker, C.J.; Myneni, R.B.; Running, S.W. Climate-driven increases in global terrestrial net primary production from 1982 to 1999. Science 2003, 300, 1560–1563. [Google Scholar] [CrossRef]
- Guo, E.; Wang, Y.; Wang, C.; Sun, Z.; Bao, Y.; Mandula, N.; Jirigala, B.; Bao, Y.; Li, H. NDVI Indicates Long-Term Dynamics of Vegetation and Its Driving Forces from Climatic and Anthropogenic Factors in Mongolian Plateau. Remote Sens. 2021, 13, 688. [Google Scholar] [CrossRef]
- Omer, A.; Zhuguo, M.; Zheng, Z.; Saleem, F. Natural and anthropogenic influences on the recent droughts in Yellow River Basin, China. Sci. Total Environ. 2020, 704, 135428. [Google Scholar] [CrossRef]
- Ayanlade, A.; Oluwaranti, A.; Ayanlade, O.S.; Borderon, M.; Sterly, H.; Sakdapolrak, P.; Jegede, M.O.; Weldemariam, L.F.; Ayinde, A.F.O. Extreme climate events in sub-Saharan Africa: A call for improving agricultural technology transfer to enhance adaptive capacity. Clim. Serv. 2022, 27, 100311. [Google Scholar] [CrossRef]
- Fang, J.; Piao, S.; Zhou, L.; He, J.; Wei, F.; Myneni, R.B.; Tucker, C.J.; Tan, K. Precipitation patterns alter growth of temperate vegetation. Geophys. Res. Lett. 2005, 32, L2144. [Google Scholar] [CrossRef]
Publisher’s Note: MDPI stays neutral with regard to jurisdictional claims in published maps and institutional affiliations. |
© 2022 by the authors. Licensee MDPI, Basel, Switzerland. This article is an open access article distributed under the terms and conditions of the Creative Commons Attribution (CC BY) license (https://creativecommons.org/licenses/by/4.0/).