Abstract
Changes in lake water volume can reflect variations in regional hydrometeorology and are a sensitive indicator of regional environmental change. The Tibetan Plateau, referred to as the “Asian Water Tower”, has a large number of lakes. These lakes are in a natural state and are relatively unaffected by human activities. Understanding the changes to lake water volume is a key issue for the study of lake-atmosphere interactions and the effects of lake expansion and contraction on regional climate. By using multisource remote sensing and water level observations, this study systematically analyzed inter-annual changes from 1970 to 2021 of three typical inland lakes basin (Bamu Co-Peng Co basin, Langa Co-Mapum Yumco basin andLongmu Co-Songmuxi Co basin), which are located in different climatic regions of the Tibetan Plateau and monthly changes from 2019 to 2021 of Bamu Co, Langa Co and Longmu Co in the lake area, water level, and water volume. In addition, the study analyzed the response of lakes in different climate regions to climate change from 1979 to 2018. The main conclusions are as follows. (1) From 1970 to 2021, there were similar trends in lake changes between the primary and twin lakes. (2) The changes to lakes in different climatic regions are different: lakes in the monsoon-dominated region showed a significant trend of expansion from 2000 to 2014, but the trend slowed down and stabilized after 2014; lakes in the westerlies-dominated region showed a small expansion trend; lakes in the region affected by both westerlies and the monsoon showed an overall shrinking trend. (3) The monthly variation of lake water volume showed a trend of first increasing and then decreasing, with the largest relative change of lake water volume in August and September. (4) Precipitation is a dominant factor controlling lake variation during the year. (5) Temperature and precipitation are dominant meteorological elements affecting the decadal variation of the lake, and with the warming of the TP, temperature plays an increasingly important role.
1. Introduction
The Tibetan Plateau (TP) has an average elevation of over 4000 m. This region is known as the “Asian Water Tower” as it contains numerous lakes, covering a total area of 5 × 10⁴ km2 in 2018 [1], and is the birthplace of many large rivers [2]. Most lakes on the TP are in a natural state and are relatively unaffected by human activities. Under the background of TP warming and wetting in recent decades, the change in lake water volume is one of the most sensitive indicators of regional environmental change [3]. The change in lake water volume is the result of the combined action of variability in water level and lake area. The magnitude of these changes determines the heat absorbed and released by lakes, which affects the energy exchange between the land and the atmosphere. As such, lakes need to be closely monitored and are good sentinels of climate change [4,5,6].
The rapid development of remote sensing, multispectral mapping, and satellite altimetry has led to great improvements in understanding the variations of TP lakes in recent years [7,8]. Multispectral optical remote sensing images, such as the Landsat MSS/TM/ETM+/OLI, Gaofen series satellites (GF−1 and GF−2), and Sentinel data (Sentinel−2), have enabled lake mapping since the 1970s [7,8,9]. Many previous studies have analyzed the changes in water volume in a single lake on the TP. For example, Zhu et al., 2010, used remote sensing, meteorological data, and field-measured water depth to analyze the temporal and spatial changes in water volume in Nam Co from 1970 to 2004. This study found that lake water volume increased from 78.32 km3 to 86.38 km3 across this period at a rate of 2.37 km3/a [10]. Zhang et al. used field-measured water depth and the area extracted from remote sensing images of Nam Co to quantify the lake water volume and its variation in 2011. The result shows that the water volume of Nam Co increased by 84.24 km3 from 1976 to 2009 [11]. Qiao et al. used field bathymetry data, remote sensing images, and satellite altimetry of Chibuzhang Co and Duoersuodong Co in 2019. This study showed that these two lakes increased by 2.4 km3 and 2 km3 from 2003 to 2014, accounting for 24.5% and 14.1% of the original lake water, respectively [12].
Additional studies have analyzed changes in the lake water volume across the entire TP. Zhang et al. used SRTM DEM (30 m) data to estimate the water volume change of lakes with an area greater than 1 km2 from 1976 to 2019 in 2021. The results show that lake water storage on the TP increased by about 170 km3 mainly in the inflow area (158 km3) [13]. The increase in water volume of glacial-supplied lakes (about 127 km3) was much higher than that of non-glacial-supplied lakes (43 km3). This result was related to the large number and wide area of glacier-supplied lakes. In addition, the increase in the water volume of closed lakes (about 163 km3) was much higher than that of outflow lakes (about 8 km3). Luo et al. further estimated the water storage change of 242 lakes on the TP from 2003 to 2019 to be 11.51 ± 2.26 km3/a by integrating ICESat/ICESat−2, the global surface water dataset, and the HydroLAKES dataset in 2021 [14].
At present, most research on the change of lake water volume on the TP is based on the analysis of long-term interannual variability. There are relatively few studies on the trend of water level changes in lakes and the dynamic characteristics of lake areas during the year in different climate zones. The change in lake water volume can accurately reflect changes to the regional climate and hydrological processes and is a sensitive indicator of environmental change. Lake effects affect climate change mainly by affecting the energy budget. The energy absorbed and released will affect the energy exchange between land and the atmosphere and affect the regional climate [15]. Therefore, records of lake water volume changes provide valuable information for understanding how lakes respond to climate change.
Due to the remote location and a lack of observational data, there is currently limited research about intra-annual water volume changes and spatial differences of lakes on the TP. This paper selects three lakes in the westerlies-dominated, monsoon-dominated, and westerlies–monsoon interaction zones of the TP and analyzes the differences in lake water volume change between these regions (Figure 1). First, the monthly lake water area of the three lakes was extracted using multisource remote sensing satellite images and the Normalized Difference Water Index. Then, the variations in lake water level were calculated from remote sensing altimetry data and in situ observations of water level. Finally, the water volume changes of the three lakes and their spatial differences were analyzed by quantifying the estimated change in the lake area and water level.
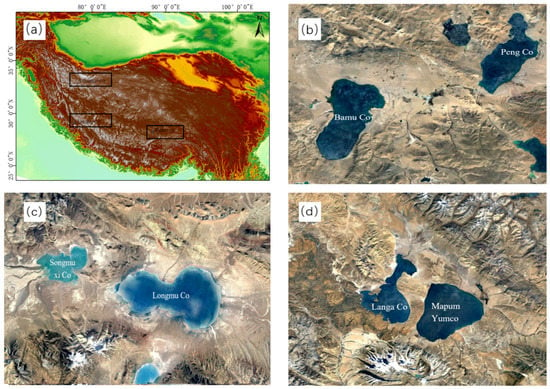
Figure 1.
(a) Area of the basins studied, (b) BMC-PC basin, (c) LMC-SMXC basin, (d) LAC-MPYC basin.
2. Overview of the Study Area
We analyzed three groups of inland lakes in different climate regions for our study. Firstly, according to the atmospheric circulation field and local dry/wet conditions in the area, we divided the TP into the monsoon region, westerly region, and monsoon–westerly interaction region. Then three groups of lakes with large adjacent lakes and similar topographic conditions in the catchment area were selected from different climate zones, which were Bamu Co (BMC) and Peng Co (PC) in the monsoon zone, the Longmu Co (LMC) and Songmuxi Co (SMXC) in the westerly zone and the Langa Co and Mapum Yumco (MPYC) in the monsoon–westerly interaction zone.
The BMC (31.25°N, 90.58°E)–PC (31.52°N, 90.97°E) basin locate in the east of Bangor Country, in the Tibetan Autonomous Region of China, and it is situated in the north of the Nyenchen Tanglha Mountain. The BMC extends in a north-south direction and is a relatively regular rectangular shape with an average altitude of 4566 m, a lake area of 242.05 km2 and the PC shows a shape of narrow in the north and wide in the south with an average altitude of 4553 m, the lake area of 175.43 km2. The basin belongs to the sub-frigid and semi-arid climate region of the TP, which is mainly affected by the monsoon; the mean annual temperature is 0.0~2.0 °C, with the highest average temperature in July and the lowest in January; the annual precipitation is 300~400 mm, and multi-year average precipitation from June to September is 263.30 mm [16]. The area of the catchment is 4839.2 km2 and 1020.3 km2 with a supply factor of 25.3 and 7.5, respectively. The two lakes both mainly rely on surface runoff for supply, in which BMC has nine inflow rivers, and among which the Baisangsangqu is mainly a supply river, with a drainage area of 1890.0 km2, accounting for 38% of the total lake catchment area, and PC has 11 inflow rivers, among which the Dangxiong Co is mainly a supply river [17].
The LAC (30.69°N, 81.22°E)–MPYC (30.67°N, 81.47°E) basin locate in Pulan County in Pulan County in the Ali area of the Tibetan Autonomous Region of China, and there are two high mountains facing each other in the south and north of the basin: The Naimona’nyi Peak on the south side is 7728 m above sea level with developed glaciers; the Kangrinpoche Mountain on the north side is 6656 m above sea level and covered with ice and snow the whole year. There are five tiers of ladder plates in the east and west of the basin, which are 1.5~2.0, 4.0, 8.0~10.0, 13.0~15.0, and 27.0~30.0 m higher than the lake surface, respectively. The LAC shows a spoon shape, with an average altitude of 4567 m and a lake area of 252.43 km2, where the northern part is an alluvial fan with a depth of 10 m. The middle part of the lake is narrow and long, with a depth of about 25 m; and the MPYC exhibits a trapezoidal shape that is wide in the north and narrow in the south, with an average altitude of 4572 m, the lake area of 414.23 km2. The basin locates in a semi-arid region with mountainous shrubs and grasslands, which is a mixed climatic zone that is affected by both the westerly belt and the monsoon, the mean annual temperature is about 2.0 °C, with the highest average temperature in July and the lowest in January, and the lake surface temperature reaches a maximum in August [18]; the annual precipitation is 150~200 mm. The area of the catchment is 2551.5 km2 and 4148.0 km2 with a supply factor of 9.5 and 10.0, respectively. The LAC mainly relies on precipitation and the Ganga River and Nagqu River in the north of the lake for the supply, and it also receives water from MPYC in the wet season. The MPYC mainly relies on precipitation and surface runoff supply [17].
The LMC (34.61°N, 80.45°E)–SMXC (34.60°N, 80.25°E) basin locate in the Ritu County of the Tibetan Autonomous Region, and it is situated in the northeast of the lowest part of the Quaternary sedimentary basin on the north side of the Karakoram. The two lakes belonged to the same great lake in the Quaternary Period, and now these two lakes are twin lakes. The LMC shows a gourd shape, with an average altitude of 5012 m and an area of 107.95 km2; the average altitude of the SMXC is 5015 m, and the area is 32.64 km2. The climate in the basin is cold and dry and mainly affected by the westerly belt, with an average annual temperature of −8.0 °C and annual precipitation of 75–100 mm. The area of the catchment is 570.0 km2 and 1605.0 km2 and the supply factor of 5.9 and 64.2, respectively. The LMC mainly relies on underground runoff for supply, and there are three main rivers in the east of the lake; the SMXC relies on the surface runoff for supply, and there are two main inflow rivers [17].
The main characteristics of the three inland lakes are shown in Table 1.

Table 1.
Main characteristics of the lakes in the study region.
The climate of the TP is mainly influenced by monsoons (including the Indian monsoon and East Asian monsoon) and westerlies [19,20]. The monsoon brings abundant rainfall to the affected areas during the summer, while the westerlies bring cold and dry weather in winter [21], which will cause different impacts on lakes in different climate zones, resulting in different expansion or contraction trends. The interaction of atmospheric circulation patterns in the TP leads to an uneven distribution of precipitation: The annual precipitation of the BMC-PC basin controlled by the monsoon zone is 300~400 mm; that of the LMC-SMXC basin controlled by the westerly zone is 75–100 mm, and that of LAC-MPYC basin controlled by the westerly–monsoon interaction zone is 150–200 mm, which is between the monsoon zone and the westerly zone.
3. Data and Methods
3.1. Data Source
3.1.1. Satellite Imagery
Multisource remote sensing images were used to extract the annual lake area changes of the six lakes from 1970 to 2021 and monthly lake area changes of the three main lakes from 2019 to 2021 in order to analyze the temporal and spatial variations across the region. Landsat remote sensing images were mainly used to quantify the annual lake area from 1970 to 2021. Sentinel−2 remote sensing images were mainly used to extract monthly lake area data from 2019 to 2021. The Landsat project has completed seven missions since 1972 and provided a long time-series of observations for monitoring water resources on the Earth’s surface [9,22,23,24,25]. We selected Landsat images with little or no cloud cover and the highest satellite repetition period. Sentinel-1 remote sensing images are supplemented into the dataset. Due to the lack of complete data from 1970 to 2013, we calculated the mean lake area from 1970 to 1990 as the lake area of the 1970s. From 1990 to 2010, we calculated the lake area every five years.
The Landsat images used in this study were collected using the Multispectral Scanner (MSS) of Landsat1-3, Thematic Mapper (TM) of Landsat 5, Enhanced Thematic Mapper Plus (ETM+) of Landsat7 and Operational Land Imager (OLI) of Landsat8. Sentinel−2 is a multispectral imaging satellite developed by the European Space Agency. These data not only have high resolution and a short revisit period but are also freely available to the public [26]. Sentinel−2A and Sentinel−2B satellites were launched and put into use on 23 June 2015 and 7 March 2017, respectively. The two satellites are polar orbit satellites, with an orbital altitude of 786 km and an inclination of 98.62°E. The swath width is 290 km, and the orbital period is 100 min [27].
Under good meteorological conditions, dual-satellite synchronization can shorten the satellite revisit period to 5 days and achieve full coverage in 2–3 days in mid-latitude regions [9]. Sentinel−2A/B satellite is equipped with a multispectral imager MIS (Multispectral Instrument). The sensor is arranged with 12 detection elements along the scanning direction. The ground reflection spectrum of the scanning zone is obtained by push-broom scanning. The imager can obtain 13 detection elements. The green light band (B3) and the near-infrared band (B8) are mainly used to calculate the water body index in this study.
Sentinel−1 contains four imaging modes: SM (Strip map), IW (Interferometric Wide swath), EW (Extra-Wide swath), and WV (Wave). The SM, IW, and EM modes include single polarization (HH/VV) and dual polarization ((HH + HV)/(VV + HV)) imaging. The WV mode contains single polarization (HH/VV) imaging. The acronyms VV, HH, HV, and VH refer to different transmit and receive angles, which are vertical transmit/vertical receive, horizontal transmit/horizontal receive, horizontal transmit/vertical receive, and vertical transmit/horizontal receive, respectively, with a single co-polarization. VV + VV and VV + HV refer to dual-frequency cross-polarization with different transmit and receive angles [28]. End users have access to a variety of applications, including surface water monitoring [29]. To ensure the accuracy of the data, the lake area of this study was also compared with a long-term dataset of lake areas on the Tibetan Plateau (1970–2013) [30], and the changing trend was similar.
3.1.2. Satellite Altimetry
Satellite altimetry technology refers to using altimeters carried by satellites to measure the height of the Earth’s surface. There are two major categories of satellite altimeters: laser and radar. Laser altimeters are mainly used in the Ice, Cloud, and land Elevation Satellite (ICESat). Laser altimeters have smaller footprints and higher accuracy than radar altimeters [31,32] but a lower time resolution. In this study, we use multisource altimetry data (CryoSat−2, Jason−2, Sentinel−3B, and ICESat−2). These data were combined if available. A brief description of the data is shown in Table 2 below.

Table 2.
Summary of the multisource altimetry data used in this study.
3.1.3. Water Level Observational Data
The water level in the lakes was measured using an automatic water level gauge (HOBO−U20). The pressure water level gauge can observe small changes (1 mm) in the lake water level. Two HOBO−U20 loggers were placed on the long axis of the BMC, LAC, and LMC. The field environment restricted measurements of all six lakes. The water level gauges observe hourly water levels and obtain average lake water level data every half hour/day. Due to the climate and geographical environment of the TP, the shallow layers of the lakes are frozen in winter, and the movement of the ice will damage the instruments. Therefore, water level data are mainly concentrated in summer (May, June, and July) and autumn (August, September, and October). Due to the impact of COVID-19 prevention policies, it was not possible to replace the batteries in the water level gauge, resulting in partial data loss. The missing data were filled using satellite altimetry data.
3.1.4. Meteorological Data
This study mainly used the dataset of lake-catchment characteristics for the Tibetan Plateau (LCC−TP v1.0) [33]. The data are the first dataset of lake-catchment characteristics on the TP; it can provide fundamental data for the study of lakes in the TP. The climate variables mainly used the grid-based CMFD dataset to calculate the catchment-level climate characteristics; the CMFD was constructed through the fusion of in situ observation, remote sensing data, and reanalysis datasets, which improved the data quality in the TP. By reprocessing the CMFD dataset, the LCC−TP v1.0 dataset obtained the meteorological data from 1979 to 2018 of lakes over 0.2 km2 with a temporal resolution of 1 day. We extracted basic meteorological data (temperature, precipitation, wind), which are related to the change of lake for catchments of the BMC, PC, LMC, SMXC, LAC, and MPYC. Moreover, the monthly precipitation from 2019 to 2021 is collected by the automatic weather station and rain gauge set around the BMC, LMC, and LAC.
3.2. Calculation Method
3.2.1. Extraction of Water Area
The extraction of water bodies from remote sensing images mainly uses the different spectral characteristics of different ground objects on remote sensing images. There are many satellites remote sensing data available for lake mapping on the TP. The method for extracting the lake area is generally referred to as the Normalized Difference Water Index (NDWI), which is a reliable method for the extraction of lake water information on the TP [9]. The normalized difference water body index method was proposed by Mcfeeters [34]. The method highlights the water body and weakens the background environment. The most basic formula (1) is:
where Green represents the green wave band, and NIR represents the near-infrared band.
In this study, the long time-series lake area is mainly extracted by the data of Landsat and Sentinel−1 SAR data, and the monthly lake area from 2019 to 2021 is mainly extracted by the data of Landsat−8 and Sentinel−2 remote sensing images. The data are processed by GEE (Google Earth Engine) platform; the GEE is a comprehensive platform for geographic information data processing and visualization launched by Google. It provides remote sensing data, including Sentinel and Landsat and topographic data, and it can process data online. The Sentinel−1 data provided by the GEE have been preprocessed for thermal noise removal, radiometric calibration, terrain correction, and fringe processing. We adopt the SVM (Support Vector Machine) method to extract the lake water body. The SVM is a kind of generalized linear classifier that classifies data bivariate according to supervised learning. The decision boundary is the maximum-margin hyperplane solved for the learning sample. It can be classified nonlinearly by kernel method, which is one of the common kernel learning methods and is widely used in pattern recognition. In this study, we use the hard margin linear SVM to classify the water body using NDWI; the ultimate goal of this method is to calculate an optimal separating hyperplane based on the calculated NDWI as the identification boundary between land and water bodies (2).
where m is the margin of the optimal separating hyperplane, and ‖w‖ means the two norms of each element. The calculation result of NDWI, which are larger than the optimal separating hyperplane, can be recognized in the water body.
The first step is the processing of remote sensing images, which is carried out on the GEE platform. This preprocessing involves cloud removal and atmospheric correction on the remote sensing images. We then use the NDWI to identify lakes and a machine learning method to classify lake water bodies. This study adopts the SVM method, which enables accurate identification and classification of water bodies. After the water body is determined, the vectorized processing is performed on ArcGIS. The monthly water body area of the lake is finally obtained through manual sight translation.
The second step is the processing of remote sensing images, including a topographic correction and speckle noise removal. The fluctuation of terrain causes significant geometric distortion of remote sensing images and can lead to perspective shrinkage, overlapping, shadows, and other phenomena. In addition, when the echoes of continuous radar pulses are processed over a rough surface, the superposition of reflected electromagnetic waves and the different distances between each scatterer and the sensor means that the echoes are incoherent in phase, resulting in echoes. Pixel-by-pixel variation in intensity, which appears grainy in pattern, resulting in randomly distributed black-and-white specks in the image. In order to address these issues, the images are topographically corrected, and speckle noise is removed. The water body index is then calculated as shown in Equation (3):
After determining the water body index, we export the image and carry out a vectorization processing in ArcGIS to produce a water area of the lake every month through visual interpretation (VI).
3.2.2. Extraction and Calculation of the Lake Water Level
The first step is the processing of the observational data of the lake water level. The HOBO water level gauge is used to observe the lake water level, producing half-hourly lake water level data. As the gauge use pressure changes to record changes in water level, air pressure data obtained from meteorological observations are subtracted from the water level to remove the influence of atmospheric pressure changes. The monthly average water level is calculated from the data. We mainly focus on the process of lake surface fluctuations and do not consider the absolute elevation of each lake surface. As such, we only use the relative change of lake water level of different months in the summer (May, June, July) and autumn (August, September, October) of the same year, compared to the lake level in May.
The second step involves processing the satellite altimetry data. Using the acquisition of ICESat−2 altimetry data as an example, we use basic geospatial data such as water bodies and lake boundaries to mask the longitude and latitude information of the spot center in the ATL13 product. Second, we extract the sub-satellite track of the ICESat−2 satellite in the lake area and perform photon signal delay and geophysical corrections. Third, we correct the spot heights corresponding to the six pulse signals (gravity level anomaly, level height, and projection deformation) and calculate the corrected instantaneous water level of the lake. Finally, a simple Normalized Median Absolute Deviation method (NMAD) is used to remove outliers and obtain the average lake level [35]. After obtaining the lake water level data from different satellite altimeters for the six lakes, we compare the mean lake water level for the same period to eliminate systematic errors between different satellite altimeters. We also use observational data as a reference for the altimetry-derived water levels to improve the accuracy of the data.
3.2.3. Estimation of Changes in Water Volume
Because the lake area is irregular, the lake water volume can be approximately simplified as an irregular platform, as shown in Equation (4):
where S’ and S are the lake surface area and the lake bottom area, respectively. H is the lake height. The lake water volume change is calculated from the difference between the upper and lower bottom areas of the two lakes, as shown in Equation (5):
where ΔV is the change of lake water volume from lake surface water level H1 and area S1 relative to water level S2 and area S2.
A flowchart showing the method for calculating the relative change in lake water volume is shown in Figure 2.
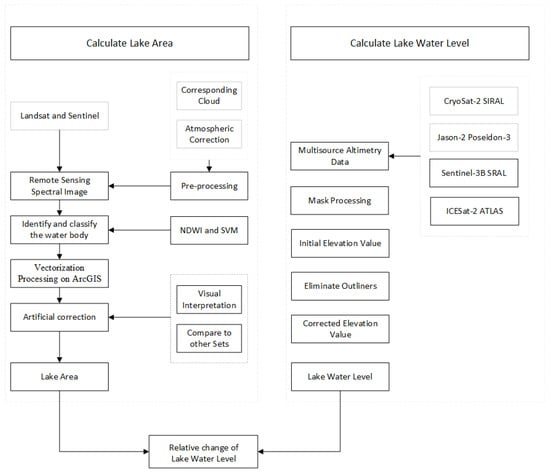
Figure 2.
A flowchart illustrating the method used to calculate lake water volume change.
3.2.4. Calculating Lakes Changes Responses to Climate Change
In the study, we mainly used Pearson Correlation to analyze the response of lake changes to climate change. The Pearson correlation coefficient is widely used to measure the degree of correlation between two variables in natural sciences research. Among them, the correlation coefficient of the sample is denoted by r, and p is a probability value. If p < 0.01, it means that the null hypothesis is rejected at the 99% confidence level; p < 0.05 or 0.1 is the same, and the p-value can be used as an evaluation index of contribution. The formula is shown in formula (6).
where the X and Y means lake water area and meteorological elements in the same year.
4. Results and Analyses
4.1. Analysis of Lake Change
Analysis of Area Change
The lake area changes differently in different climate zones from the 1970s to 2021 (Figure 3). Lakes in the monsoon region (BMC and PC) and the westerly region (LMC and SMXC) show an overall expansion trend. The BMC and PC showed a trend of rapid expansion from 1995 to 2005, with growth rates of 4.746 km2/a and 31.8098 km2/a, respectively, before the trend stabilizes. The LMC and SMXC showed a steady growth trend from the 1970s to 2021, with growth rates of 1.092 km2/a and 0.747 km2/a, respectively. Lakes in the westerly–monsoon interaction zone (LAC and MPYC) showed an overall shrinking trend. Lake areas in this region show a rapid shrinking trend from the 1970s to 2005, with a reduced rate of 1.744 km2/a and 1.061 km2/a, after which the reduction slows or stabilizes. The three groups of primary and twin lakes have similar trends, suggesting they are connected by groundwater.
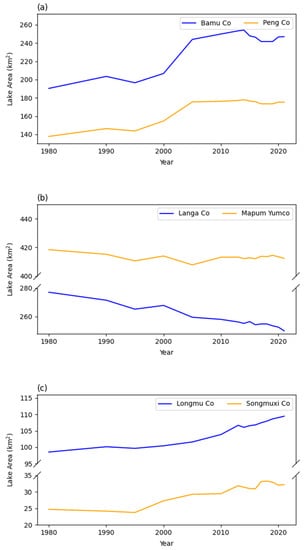
Figure 3.
Lake area from 1970 to 2021, (a) lakes in the monsoon region, (b) lakes in the westerly–monsoon interaction region, (c) lakes in the westerly region.
The changes in the lake area of inland lakes on the TP are primarily affected by precipitation, snowfall, and melting of glaciers and permafrost. There are obvious seasonal differences in the supply of these water resources, meaning that changes in lakes within a year cannot be ignored. In order to make the investigation more accurate and make full use of the observed meteorological and lake water level data, the analysis of annual variance in lake water level focuses on 2019–2021. The lakes in the monsoon region and westerly–monsoon interaction region have similar trends during the year. Lakes in these regions both began to expand in May, reached the maximum in August then began to shrink. The lake area expanded slightly in winter after the lake surface froze. The timing of the maximum lake area in the westerly–monsoon interaction region was delayed by one month compared to the monsoon region.
It can also be seen in Figure 4 that the seasonal changes in the lake area from 2019 to 2021 are different. For example, at BMC in 2019, the lake area showed a decreasing trend from January to April. The lake ice started to melt in May, and the lake area expanded and reached a maximum in August before gradually retreating. In 2020, the lake area showed a decreasing trend from January to May. The lake ice began to melt in May, and the lake area began to expand. The lake area reached a maximum in August and then gradually retreated. In 2021, the lake area showed a decreasing trend from January to March, and the lake ice began to melt in May. The lake area began to expand in May and reached a maximum in September before gradually retreating.
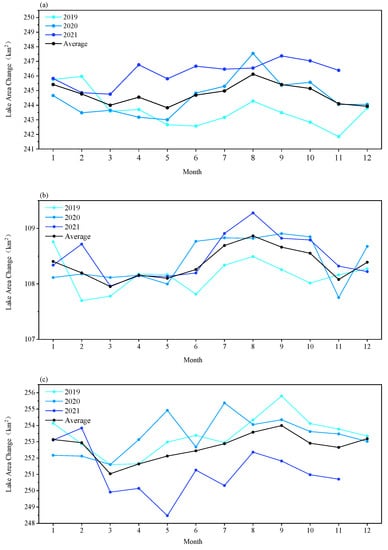
Figure 4.
The annual lake area changes from 2019 to 2021, (a) BMC, (b) LMC, (c) LAC.
4.2. Analysis of Lake Water Level Change
The parameter of lake level change is very important for estimating the change of lake water volume and can represent climate change to a certain extent. Lakes located in different climate zones have different trends (Figure 5). The twin lakes have similar interannual variations in lake water level as their respective primary lakes.
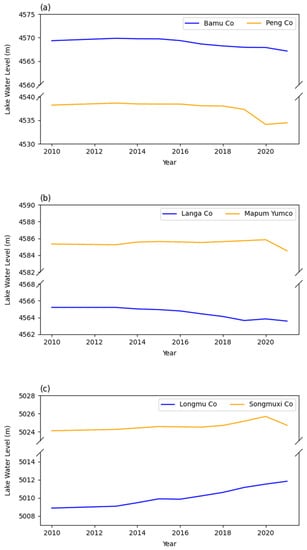
Figure 5.
Lake water level from 1970s to 2021, (a) lakes in monsoon region, (b) lakes in westerly–monsoon interaction region, (c) lakes in westerly region.
In this study, lake water level change is mainly analyzed for seasonal characteristics. The change in lake water level in May is set to zero every year, and then the monthly average value of water level change during the non-freezing period (May to October) relative to that in May is calculated. In order to verify the accuracy of the ICESat−2 ATL13 remote sensing altimetry product, this paper selects 26 repeated ATL13 orbital data passing through the three lakes from May to October every year from 2019 to 2021. We then calculate the change of lake water level obtained by the ATL13 remote sensing altimetry products as the change of lake water level in the month relative to that in May. The changes in the repeater orbit data of ATL13 are not considered due to the relatively small amount of data obtained from BMC (Table 3). Correlation analysis between the relative change of lake water level from ATL13 and the observational data (Figure 6) showed R2 values of 0.85. Therefore, the ICESat−2/ATL13 laser altimetry product can accurately reflect the relative change in lake water level.

Table 3.
Repeat orbit data from ATL13 of Bamu Co, Langa Co and Longmu Co (m).
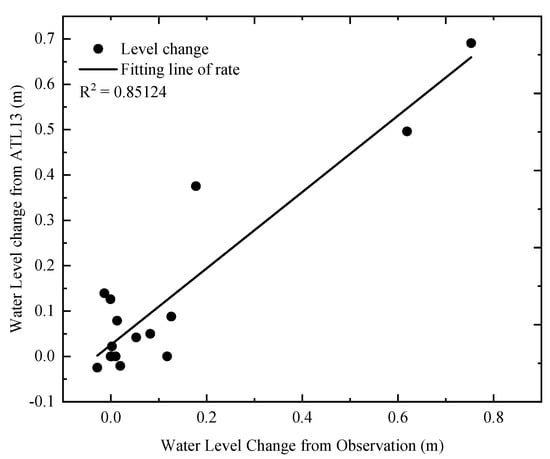
Figure 6.
Water level change rate from ICESat−2 and observation.
As is shown in the Figure 7, the relative lake water level change of BMC reached maximum values in September 2019 (0.32 m), August 2020 (0.23 m), and September 2021 (0.42 m). LMC reached maximum values in August 2019 (0.17 m), August 2020 (0.02 m), and September 2021 (0.01 m). LAC reached maximum values in September 2019 (0.75 m), August 2020 (0.07 m), and August 2021 (0.01 m).
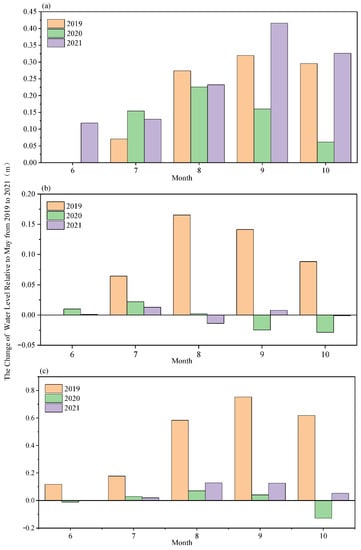
Figure 7.
The relative change of water level in (a) BMC, (b) LMC, (c) LAC.
4.3. Analysis of Relative Change in Lake Water Volume
The change in lake water volume is a key factor for evaluating the degree of lake impacts on climate. Changes in lake volume are the result of the combined action of water level change and lake area change. By using the obtained lake water level change and lake area change, the lake water volume change can be estimated following Equations (3) and (4) [36,37].
The inter-annual relative change of lake water level from 2013–2021 is calculated relative to 2011 (Figure 8). The inter-annual relative change of lake water level showed a significant difference in the different climatic regions. At the BMC and PC, in the monsoon region, the water volume of the lake was relatively stable before around 2017 but then decreased significantly. LAC in the westerly–monsoon interaction region showed a significant decreasing trend, while MPYC was stable. LMC and SMXC in the westerly region showed a significant increasing trend. However, the growth rate of SMXC is an order of magnitude lower than LMC.
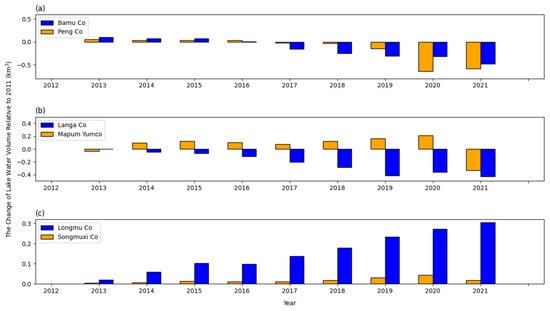
Figure 8.
Relative change of lake water volume from 2013 to 2021, (a) lakes in the monsoon region, (b) lakes in the westerly–monsoon interaction region, (c) lakes in the westerly region.
Differences in lake water volume change are significantly related to temporal and spatial variations in precipitation. From 1980–2015, the monsoon region showed a warm-wet tendency (ΔT = 0.54 °C/10a, Δp = −12.44 mm/10a), the Westerly–monsoon interaction region showed a cold-wet tendency (ΔT = −0.71 °C/10a, Δp = 37.66 mm/10a) and the westerly region showed a warm–dry tendency (ΔT = −0.53 °C/10a, Δp = −12.44 mm/a). The combined action of precipitation and melting of glacial snow cover causes lake expansion [38]. In the TP, which is relatively unaffected by human factors, variations in precipitation are the main drivers of inland lake change [39,40].
The annual relative change in 2019–2021 is calculated relative to the first month of the year for which data are available each year (Figure 9). The relative changes in lake water volume in typical inland lakes in different climatic regions are different in different seasons.
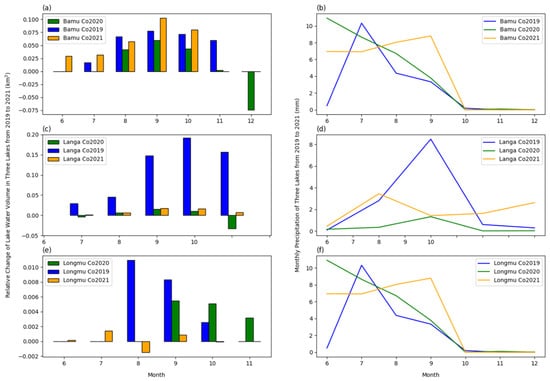
Figure 9.
Monthly relative change of lake water volume and precipitation from 2019–2021, (a,b) lake water volume change and precipitation of BMC, (c,d) lake water volume change and precipitation of LAC, (e,f) lake water volume change and precipitation of LMC.
The lake water volume of BMC, located in the monsoon region, is relatively stable, and the overall lake water volume shows an increasing trend from 2019 to 2021. Among the annual changes in the lake water volume, the relative change of lake water volume shows a trend of first rising and then falling. The relative change of lake water volume reached maximum values in August 2019 (77.76 × 10³ km−3), August 2020 (55.61 × 10³ km3), and September 2021 (102.91 × 10³ km3). The lake water volume in LMC, located in the westerlies area, showed a significant change trend in 2019 but was stable in 2020 and 2021. The annual changes in the lake water volume at LMC reached maximum values in August 2019 (42.16 × 10³ km3), August 2020 (5.66 × 10³ km3), and June 2021 (8.67 × 10³ km3). The lake water volume of LAC, located in the westerly–monsoon interaction area, shows an overall decreasing trend from 2019 to 2021. The relative lake water volume change of LAC reached maximum values in September 2019 (81.44 × 10³ km3), August 2020 (7.66 × 10³ km3), and August 2021 (32.43 × 10³ km3).
Abnormally high rainfall in the westerly region (LAC and LMC) in 2019 meant that the precipitation was significantly higher compared with other years. This high precipitation shows a good correlation with the obvious increase in lake water volume in 2019. In addition, there is also a good correlation between the peak of precipitation and the increase in lake water volume, indicating that precipitation is an important factor affecting lake change.
4.4. Response of Lake Change to Climate Change
4.4.1. Interdecadal Variation of Meteorological Elements
From 1979 to 2018, the temperature showed an overall increasing trend with different rates: BMC-PC basin in the monsoon region is 0.68 °C/10a; LMC-SMXC basin in the westerly region is 0.24 °C/10a; LAC-MPYC basin in the westerly–monsoon interaction region is 0.064 °C/10a (Figure 10), the annual mean temperature of the three basins are −1.96, −4.26 and −8.48 °C, respectively. Among them, we can see that the BMC-PC basin showed a rapid warming trend, while the LAC-MPYC basin was relatively stable, and it is worth noting that the LMC-SMXC basin was stable before 2000, but it sharply decreased in 2000 then increased significantly.
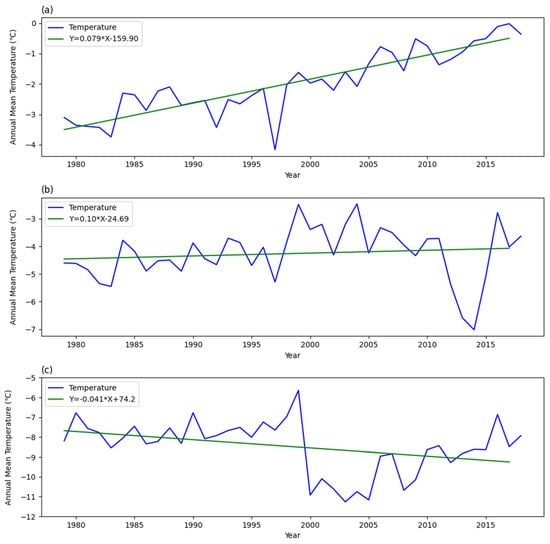
Figure 10.
Annual mean temperature of three basins in different climate region, the green lines mean one linear fitting equation, (a) the BMC-PC basin, (b) the LAC-MPYC basin, (c) the LMC-SMXC basin.
The annual cumulative precipitation in different climate regions showed an overall increasing trend with a ratio of 36.31, 12.40, and 119.12 mm/10a, respectively, from 1979 to 2018. Among them, the cumulative precipitation of the BMC-PC basin was relatively stable before 2000 but fluctuated significantly after 2000, that of the LAC-MPYC basin increased significantly after 2000, and that of the LMC-SMXC basin was stable before 1998 and then increased rapidly. The increasing trend of the cumulative precipitation rate was mostly bounded by the year 2000, and the cumulative precipitation increased significantly after 2000, which corresponded to the obvious increase in the lake area after 2000 (Figure 11).
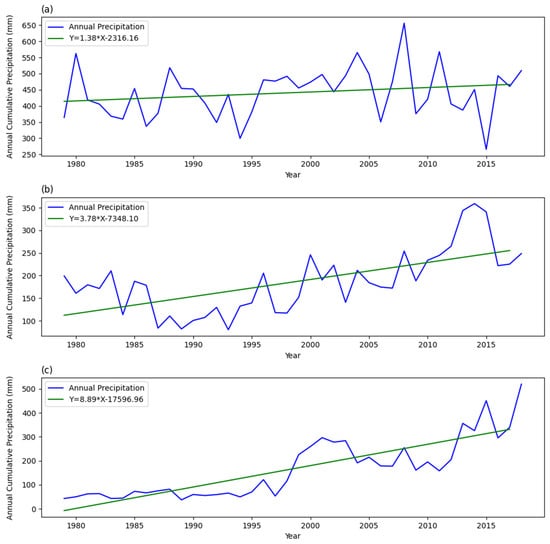
Figure 11.
Annual cumulative precipitation of three basins in different climate region, the green lines mean one linear fitting equation, (a) the BMC-PC basin, (b) the LAC-MPYC basin, (c) the LMC-SMXC basin.
The annual mean wind speed from 1979 to 2018 showed different trends in different climate regions: the wind speed of the BMC-PC basin decreased slightly, with the rate of −0.16 m/(s·10a), and the wind speed fluctuated significantly from 1990 to 2000, then stabilized; the wind speed of LAC-MPYC basin decreased with the rate of −0.20 m/(s·10a), the wind speed increased in 2000 then decreased rapidly; the wind speed of LMC-SMXC basin decreased slightly before 1997 then increased rapidly with the rate of 0.39 m/(s·10a) (Figure 12).
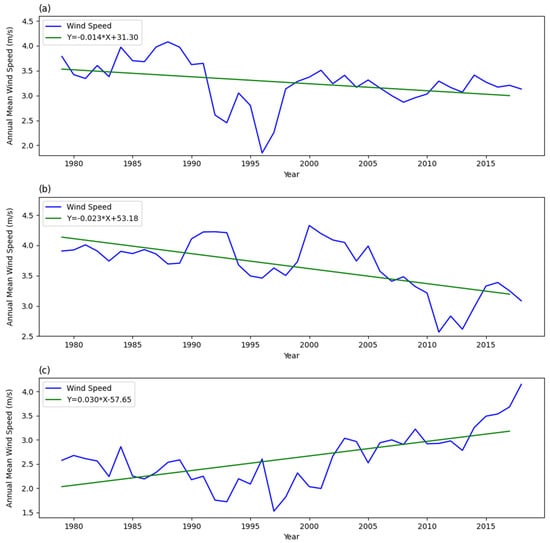
Figure 12.
Annual mean wind speed of three basins in different climate region, the green lines mean one linear fitting equation, (a) the BMC-PC basin, (b) the LAC-MPYC basin, (c) the LMC-SMXC basin.
The annual average specific humidity is generally stable from 1979 to 2018, but there are abnormally large or small around 2000: the specific humidity of the BMC-PC basin in the monsoon region and the LMC-SMXC basin increased significantly from 1995 to 2000 then decreased gradually while that of the LAC-MPYC basin showed a contrary tendency (Figure 13).
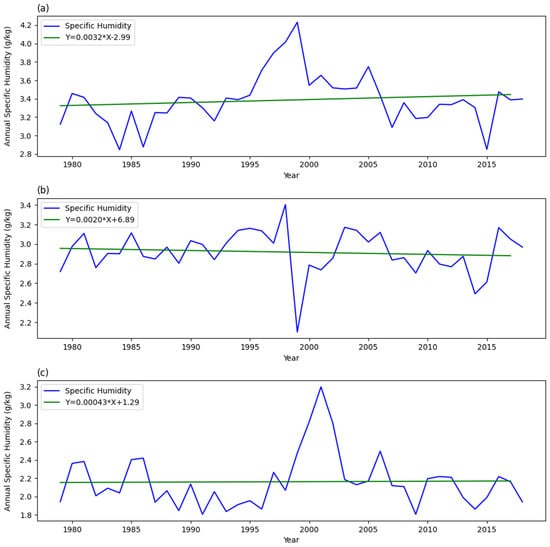
Figure 13.
Annual Specific Humidity of three basins in different climate region, the green lines mean one linear fitting equation, (a) the BMC-PC basin, (b) the LAC-MPYC basin, (c) the LMC-SMXC basin.
The variation trends of these meteorological elements changed in 2000, and the variation trends of the lake also changed in the same period. Therefore, the response mechanism of lakes to climate change will be analyzed in different periods, and the responses will be discussed over the entire time, before and after 2000.
4.4.2. Response of Lake Change to Climate
In this study, we analyzed the correlation between the lake area and the annual mean temperature, wind speed, specific humidity, and annual cumulative precipitation. Analysis results from 1979 to 2918 show that the main factors affecting the lake change are different from the change in climate zone. For the BMC and PC in the monsoon region, the correlation between temperature and lake area was the highest, with a correlation coefficient of 0.90 (p < 0.01), followed by specific humidity, with a correlation coefficient of −0.37 (p = 0.23), indicating a strong correlation; for the LMC and SMXC, the correlation between cumulative precipitation and lake area was the highest, with a correlation coefficient of 0.87 (p < 0.01) and 0.88 (p < 0.01), followed by specific humidity, with a correlation coefficient of −0.36 (p = 0.24), indicating a strong correlation; for the LAC and MPYC, the correlation between wind speed, cumulative precipitation, and lake area were both high, with a correlation coefficient of 0.78 (p < 0.01) and −0.71 (p < 0.01), respectively. In addition, the dominant meteorological factors also changed in different periods. Before 2000, the dominant factors in the monsoon zone, the westerly zone, and the monsoon–westerly interaction zone were temperature, precipitation, and wind speed, while after 2000, which is the period of acceleration of warming on the TP, the dominant factors changed to temperature, precipitation, temperature and wind speed, specific humidity, respectively (Table 4). The wind speed and specific humidity (which can represent evaporation) are the dominant meteorological elements in the LAC-MPYC basin and show a negative correlation; this explains the contraction trend of lake area changes in the LAC and MPYC.

Table 4.
Correlation analysis between lake area and meteorological factors.
In conclusion, although the dominant meteorological factors change with different climate regions, temperature and precipitation are always the main factors affecting the change of the lake. With the rapid warming of the TP, the influence of temperature on the expansion of the lake area is becoming more significant. The warming of the lake catchment area leads to the melting of glaciers and snow, which increases runoff and leads to the expansion of lakes. Moreover, with the warming and wetting of the TP, the precipitation gradually increases, which also promotes the expansion of lakes.
5. Discussion
In recent years, the TP has become warmer and wetter. This trend involves a decreasing surface sensible heat and increasing latent heat from the northwest to the southeast, resulting in a significant increase in precipitation in the southeast and a decrease in the northwest [41,42]. In addition to being affected by precipitation, lakes in the TP are also closely related to glacial meltwater and permafrost degradation in the basin. Lake changes in the TP are significantly influenced by water and heat exchange between the lakes and the atmosphere, which in turn affects the regional water cycle. However, quantifying the dominant factors affecting lakes in different regions and how these factors will change under climate change conditions is key to accurately understanding the mechanistic role that lakes play in the water cycle of “Asian Water Tower”.
Therefore, in each typical area of the TP, we should strengthen research on lake water balance and its response to climate change. This will involve collecting observations of the spatial and seasonal distribution of precipitation, runoff (including precipitation, meltwater, and underground runoff), and evaporation, and using methods such as a total water balance and isotope segmentation to study the response of lake water balance to changes in different supply sources. Such research would provide valuable information about the processes and mechanisms of how climate change will impact lakes in the future.
The changes in the area, water level, and water volume, as well as the monthly water volume variations of three pairwise lakes from different climate zones, were analyzed using remote sensing data and in situ observations. For the response of lake change to meteorological factors, we mainly focused on qualitative research but lacked quantitative research on the contribution of each meteorological element. In addition, there is still a part of the research that has not been carried out, such as the reason for lake water decline after 2020 due to lack of meteorological data. Therefore, quantifying the contribution of meteorological elements to lake change and using high-frequency meteorological data and eddy covariance data to analyze the reduction of lake level after 2020 will be the focus of the next stage of research. This will be helpful in accurately understanding the mechanism of climate change affecting lakes. Moreover, with the development of tourism in Tibet, the TP has been affected by more and more human activities; consideration of direct human impacts on the TP water supply remains poorly articulated but potentially important to the lake change research [43,44].
6. Conclusions
There is a lack of research on the annual water volume changes and spatial differences of typical lakes in the TP due to the remote location and the lack of observational data. In the study, we have found there is obvious spatial heterogeneity in the seasonal changes of lake water volume in different climate regions. By using Sentine−2 remote sensing images, multisource altimetry, and observational water level data, the following conclusions are drawn.
(1) Inter-annual variations of lakes in different climatic zones are markedly different. From the 1970s to 2021, lakes in the monsoon (BMC and PC) and westerly (LMC and SMXC) regions show an overall expansion trend, while lakes in the westerly–monsoon interaction region (LAC and MPYC) showed an overall shrinking trend [45]. In the westerly–monsoon interaction region, the lake area shows a rapidly shrinking trend from the 1970s to 2005, after which the reduction slows or stabilizes [46]. The three groups of lakes have similar trends.
(2) Monthly variations of the lakes during the year in different climatic zones generally show similar trends. The changes are highly correlated with increases and decreases in monthly rainfall. This correlation is especially strong in 2019, which was a year of abnormal fluctuations in the westerly belt, with increased precipitation and significantly increased monthly changes in lake water volume. In addition, there is a good correlation between the peak of precipitation and lake water volume increase. These findings indicate that precipitation is a dominant factor affecting lake changes in the TP.
(3) The paper focuses on the effects of climate change on lakes from 1979 to 2018. The meteorological factors that dominate lake variation are temperature, precipitation, specific humidity, and wind speed (where specific humidity and wind speed can represent evaporation). Increases in temperature (which promotes melting of glaciers and snow) and precipitation promote the lake expansion, while increases in evaporation cause the lake shrinkage. For lakes in different climate regions, the main impact of meteorological elements is different, but with the accelerated warming on the TP, temperature plays an increasingly important role in accelerating lake expansion, while in the LAC-MPYC basin, evaporation is the leading factor that has caused the lake to shrink over the past decade.
Author Contributions
Conceptualization, W.M. (Weiyao Ma), L.B. and W.M. (Weiqiang Ma); methodology, W.M. (Weiyao Ma) and L.B.; validation, L.B., Z.X., W.H., R.S. and B.W.; formal analysis, W.M. (Weiyao Ma), W.H. and Z.X.; investigation, L.B.; resources, W.M. (Weiyao Ma), L.B., W.H. and R.S.; data curation, W.M. (Weiyao Ma) and L.B.; writing—original draft preparation, W.M. (Weiyao Ma) and L.B.; writing—review and editing, W.M. (Weiqiang Ma), Z.X., W.H., R.S., B.W., and Y.M.; visualization, W.M. (Weiyao Ma); supervision, W.M. (Weiqiang Ma); All authors have read and agreed to the published version of the manuscript.
Funding
This research has been funded by the National Natural Science Foundation of China (Grant No. 41830650); the Second Tibetan Plateau Scientific Expedition and Research Program (STEP) (Grant No. 2019QZKK0103) and the Strategic Priority Research Program of Chinese Academy of Sciences (Grant No. XDA20060101).
Data Availability Statement
The ICESat−2 data can be availability in the National Snow and ICE Data Center (https://nsidc.org/data/atl13/versions/5); The CryoSat−2 data can be availability in European Space Agency Earth Online (https://earth.esa.int/eogateway/missions/cryosat); The Sentinel 3B data can be availability in the Copernicus Open Access Hub (https://scihub.copernicus.eu/); The Jason−2 data can be availability in NOAA NCEI (https://www.ncei.noaa.gov/products/jason-satellite-products).
Acknowledgments
The authors would like to acknowledge the National Aeronautics and Space Administration (NASA) and European Space Agency (ESA) for providing remote-sensing and multisource altimetry data, the Institute of Tibetan Plateau Research, Chinese Academy of Science for providing the lake water level and precipitation data from the Bamu Co, Langa Co and Longmu Co, and the students who went to Tibet to collect data.
Conflicts of Interest
The authors declare no conflict of interest.
References
- Zhang, G.; Luo, W.; Chen, W.; Zheng, G. A robust but variable lake expansion on the Tibetan Plateau. Sci. Bull. 2019, 64, 1306–1309. [Google Scholar] [CrossRef]
- Immerzeel, W.W.; van Beek, L.P.H.; Bierkens, M.F.P. Climate change will affect the Asian Water Towers. Science 2010, 328, 1382–1385. [Google Scholar] [CrossRef]
- Zhang, G.; Yao, T.; Xie, H.; Yang, K.; Zhu, L.; Shum, C.; Bolch, T.; Yi, S.; Allen, S.; Jiang, L.; et al. Response of Tibetan Plateau lakes to climate change: Trends, patterns, and mechanisms. Earth Sci. Rev. 2020, 208, 103269. [Google Scholar] [CrossRef]
- Carpenter, S.R.; Benson, B.J.; Biggs, R.; Chipman, J.W.; Foley, J.A.; Golding, S.A.; Hammer, R.B.; Hanson, P.C.; Johnson, P.T.J.; Kamarainen, A.M.; et al. Understanding regional change: A comparison of two lake districts. Bioscience 2007, 57, 323–335. [Google Scholar] [CrossRef]
- Pham, S.V.; Leavitt, P.R.; McGowan, S.; Peres-Neto, P. Spatial variability of climate and land-use effects on lakes of the northern Great Plains. Limnol. Oceanogr. 2008, 53, 728–742. [Google Scholar] [CrossRef]
- Williamson, C.E.; Dodds, W.; Kratz, T.K.; Palmer, M.A. Lakes and streams as sentinels of environmental change in terrestrial and atmospheric processes. Front. Ecol. Environ. 2008, 6, 247–254. [Google Scholar] [CrossRef]
- Wang, W.Z.; Huang, D.; Liu, J.F.; Liu, H.W.; Wang, H. Patterns and causes of changes in water level and volume in Tangra Yumco from 1988 to 2018 based on Landsat images and Sentinel-3A synthetic aperture radar. J. Lake Sci. 2020, 32, 1552–1563. [Google Scholar]
- Zhang, G.Q.; Wang, M.M.; Zhou, T.; Chen, W.F. Progress in remote sensing monitoring of lake area, water level, and volume changes on the Tibetan Plateau. Natl. Remote Sens. Bull. 2022, 26, 115–125. [Google Scholar]
- Zhang, G.Q.; Yao, T.D.; Shum, C.K.; Yi, S.; Yang, K.; Xie, H.J.; Feng, W.; Bolch, T.; Wang, L.; Behrangi, A.; et al. Lake volume and groundwater storage variations in Tibetan Plateau’s endorheic basin. Geophys. Res. Lett. 2017, 44, 5550–5560. [Google Scholar] [CrossRef]
- Zhu, L.P.; Xie, M.P.; Wu, Y.H. Quantitative analysis of lake area variations and the influence factors from 1971 to 2004 in the Nam Co basin of the Tibetan Plateau. Chin. Sci. Bull. 2010, 55, 1294–1303. [Google Scholar] [CrossRef]
- Zhang, B.; Wu, Y.; Zhu, L.; Wang, J.; Li, J.; Chen, D. Estimation and trend detection of water storage at Nam Co Lake, central Tibetan Plateau. J. Hydrol. 2011, 405, 161–170. [Google Scholar] [CrossRef]
- Qiao, B.J.; Zhu, L.P.; Yang, R.M. Temporal-spatial differences in lake water storage changes and their links to climate change throughout the Tibetan Plateau. Remote Sens. Environ. 2019, 222, 232–243. [Google Scholar] [CrossRef]
- Zhang, G.; Bolch, T.; Chen, W.; Crétaux, J. Comprehensive estimation of lake volume changes on the Tibetan Plateau during 1976–2019 and basin-wide glacier contribution. Sci. Total Environ. 2021, 772, 145463. [Google Scholar] [CrossRef] [PubMed]
- Luo, S.; Song, C.; Zhan, P.; Liu, K.; Chen, T.; Li, W.; Ke, L. Refined estimation of lake water level and storage changes on the Tibetan Plateau from ICESat/ICESat-2. Catena 2021, 200, 105177. [Google Scholar] [CrossRef]
- Changnon, J.; Jones, D. Review of the influences of the Great Lakes on weather. Water Resour. Res. 1972, 8, 360–371. [Google Scholar] [CrossRef]
- Bhasang, T.; Liu, J.S.; Niu, J.F.; Dhawa, T.; Ci, B. Area Variation and Its Causes of Bamu Co Lake in the Central Tibet. J. Nat. Resour. 2012, 27, 9. [Google Scholar]
- Wang, S.M.; Dou, H.S. The Volume of Chinese Lake; Science Press: Beijing, China, 1998. [Google Scholar]
- Su, R.M.Z.; Ma, W.Q.; Ma, Y.M.; Xie, Z.P.; Wang, B.B.; Hu, W.; Liu, J.S. Investigation of thermal stratification and mixed layer depth in La’ang Co in the Tibetan Plateau. J. Lake Sci. 2021, 33, 550–560. [Google Scholar]
- Krause, P.; Biskop, S.; Helmschrot, J.; Flügel, W.-A.; Kang, S.; Gao, T. Hydrological system analysis and modelling of the Nam Co basin in Tibet. Adv. Geosci. 2010, 27, 29–36. [Google Scholar] [CrossRef]
- Fan, Z.-X.; Thomas, A. Spatiotemporal variability of reference evapotranspiration and its contributing climatic factors in Yunnan province, SW China, 1961–2004. Clim. Chang. 2013, 116, 309–325. [Google Scholar] [CrossRef]
- Yao, T.D.; Thompson, L.; Yang, W.; Yu, W.S.; Gao, Y.; Guo, X.J.; Yang, X.X.; Duan, K.Q.; Zhao, H.B.; Xu, B.Q.; et al. Different glacier status with atmospheric circulations in Tibetan Plateau and surroundings. Nat. Clim. Chang. 2012, 2, 663–667. [Google Scholar] [CrossRef]
- Alsdorf, D.E.; Rodríguez, E.; Lettenmaier, D.P. Measuring surface water from space. Rev. Geophys. 2007, 45, 24. [Google Scholar] [CrossRef]
- Pekel, J.F.; Cottam, A.; Gorelick, N.; Belward, A.S. High-resolution mapping of global surface water and its long-term changes. Nature 2016, 540, 418–422. [Google Scholar] [CrossRef]
- Crétaux, J.-F.; Calmant, S.; Romanovski, V.; Shabunin, A.; Lyard, F.; Bergé-Nguyen, M.; Cazenave, A.; Hernandez, F.; Perosanz, F. An absolute calibration site for radar altimeters in the continental domain: Lake Issykkul in Central Asia. J. Geod. 2009, 83, 723–735. [Google Scholar] [CrossRef]
- Verpoorter, C.; Kutser, T.; Seekell, D.A.; Tranvik, L.J. A global inventory of lakes based on high-resolution satellite imagery. Geophys. Res. Lett. 2014, 41, 6396–6402. [Google Scholar] [CrossRef]
- Li, D.; Wu, B.S.; Chen, B.W.; Xue, Y.; Zhang, Y. Review of water body information extraction based on satellite remote sensing. J. Tsinghua Univ. Sci. Technol. 2020, 60, 15. [Google Scholar]
- Gong, R. Sentinel-2A optical imaging satellite launched. Space Int. 2015, 8, 36–40. [Google Scholar]
- Attema, E.; Cafforio, C.; Gottwald, M.; Pietro, G.; Guarnieri, A.M.; Rocca, F.; Snoeij, P. Flexible dynamic block adaptive quantization for Sentinel-1 SAR missions. IEEE Geosci. Remote Sens. Lett. 2010, 7, 766–770. [Google Scholar] [CrossRef]
- Binh, P.D.; Catherine, P.; Filipe, A. Surface Water Monitoring within Cambodia and the Vietnamese Mekong Delta over a Year, with Sentinel-1 SAR Observations. Water 2017, 9, 366. [Google Scholar]
- Zhang, G.Q.; Chen, W.F.; Xie, H.J. Tibetan Plateau’s Lake Level and Volume Changes From NASA’s ICESat/ICESat-2 and Landsat Missions. Geophys. Res. Lett. 2019, 46, 13107–13118. [Google Scholar] [CrossRef]
- Neckel, N.; Kropáček, J.; Bolch, T.; Hochschild, V. Glacier mass changes on the Tibetan Plateau 2003–2009 derived from ICESat laser altimetry measurements. Environ. Res. Lett. 2014, 9, 014009. [Google Scholar] [CrossRef]
- Yuan, C.; Gong, P.; Bai, Y. Performance assessment of ICESat-2 laser altimeter data for water-level measurement over lakes and reservoirs in China. Remote Sens. 2020, 12, 770. [Google Scholar] [CrossRef]
- Liu, J.; Fang, P.; Que, Y.; Zhu, L.-J.; Duan, Z.; Tang, G.; Liu, P.; Ji, M.; Liu, Y. A dataset of lake-catchment characteristics for the Tibetan Plateau. Earth Syst. Sci. Data Discuss. 2022, 14, 1–21. [Google Scholar] [CrossRef]
- Mcfeeters, S.K. The use of the Normalized Difference Water Index (NDWI) in the delineation of open water features. Int. J. Remote Sens. 1996, 17, 1425–1432. [Google Scholar] [CrossRef]
- Höhle, J.M. Accuracy assessment of digital elevation models by means of robust statistical methods. ISPRS J. Photogramm. Remote Sens. 2009, 64, 398–406. [Google Scholar] [CrossRef]
- Song, C.; Huang, B.; Ke, L. Modeling and analysis of lake water storage changes on the Tibetan Plateau using multi-mission satellite data. Remote Sens. Environ. 2013, 135, 25–35. [Google Scholar] [CrossRef]
- Zhang, G.; Yao, T.; Xie, H.; Zhang, K.; Zhu, F. Lakes’ state and abundance across the Tibetan Plateau. Chin. Sci. Bull. 2014, 59, 3010–3021. [Google Scholar] [CrossRef]
- Lv, L.; Zhang, T.B.; Yi, G.H.; Miao, J.Q.; Li, J.J.; Bie, X.J.; Huang, X.L. Changes of lake areas and its response to the climatic factors in Tibetan Plateau since 2000. J. Lake Sci. 2019, 31, 573–589. [Google Scholar]
- Lei, Y.; Yang, K.; Wang, B.; Sheng, Y.; Bird, B.W.; Zhang, G.; Tian, L. Response of inland lake dynamics over the Tibetan Plateau to climate change. Clim. Chang. 2014, 125, 281–290. [Google Scholar] [CrossRef]
- Li, B.; Zhang, J.; Yu, Z.; Liang, Z.; Chen, L.; Acharya, K. Climate change driven water budget dynamics of a Tibetan inland lake. Glob. Planet. Chang. 2017, 150, 70–80. [Google Scholar] [CrossRef]
- Yang, K.; Wu, H.; Qin, J.; Lin, C.; Tang, W.; Chen, Y. Recent climate changes over the Tibetan Plateau and their impacts on energy and water cycle: A review. Glob. Planet. Chang. 2014, 112, 79–91. [Google Scholar] [CrossRef]
- Han, Y.Z.; Ma, W.Q.; Wang, B.Y.; Ma, Y.M.; Tian, R.X. Climatic Characteristics of Rainfall Change over the Qinghai-Tibetan Plateau from 1980 to 2013. Plateau Meteorol. 2017, 36, 1477–1486. [Google Scholar]
- Cooley, S.W.; Ryan, J.C.; Smith, L.C. Human alteration of global surface water storage variability. Nature 2021, 591, 78–81. [Google Scholar] [CrossRef] [PubMed]
- Vörösmarty, C.J.; Green, P.; Salisbury, J.; Lammers, R.B. Global water resources: Vulnerability from climate change and population growth. Science 2000, 289, 284–288. [Google Scholar] [CrossRef] [PubMed]
- La, B.; Bian, D.; Ci, Z.; Laba, Z.; Chen, T. Study on the Change of Lake Area and Its Causes in the Mapangyong Co Basin in Tibet. Arid. Zone Res. 2012, 29, 992–996. [Google Scholar]
- Yang, R.; Zhu, L.; Wang, J.; Ju, J.; Ma, Q.; Turner, F.; Guo, Y. Spatiotemporal variations in volume of closed lakes on the Tibetan Plateau and their climatic responses from 1976 to 2013. Clim. Chang. 2017, 140, 621–633. [Google Scholar] [CrossRef]
Publisher’s Note: MDPI stays neutral with regard to jurisdictional claims in published maps and institutional affiliations. |
© 2022 by the authors. Licensee MDPI, Basel, Switzerland. This article is an open access article distributed under the terms and conditions of the Creative Commons Attribution (CC BY) license (https://creativecommons.org/licenses/by/4.0/).