Article

Investigating NUCAPS Skill in Profiling Saharan Dust for Near-Real-Time Forecasting

1
Naval Research Laboratory, Marine Meteorology Division, Monterey, CA 93943, USA
2
National Oceanographic and Atmospheric Administration/National Environmental Satellite, Data, and Information Service (NESDIS)/Center for Satellite Applications and Research (STAR), College Park, MD 20852, USA
3
Science and Technology Corporation, Columbia, MD 21046, USA
4
IMSG, Inc., NOAA/NESDIS/STAR, College Park, MD 20740, USA
5
School of Mathematical and Natural Sciences, Arizona State University, Phoenix, AZ 85004, USA
*
Author to whom correspondence should be addressed.
Remote Sens. 2022, 14(17), 4261; https://doi.org/10.3390/rs14174261
Submission received: 27 June 2022 / Revised: 9 August 2022 / Accepted: 17 August 2022 / Published: 29 August 2022

Abstract

:
Dust outflows off Northwest Africa often propagate westward across the North Tropical Atlantic Basin (NTAB) into the greater Caribbean and US. From a health perspective, weather forecasters in these regions often monitor hazardous air quality associated with this dust. However, forecasters can be constrained by sparse data observations upwind over the Atlantic of the impacted populated areas. Global satellite sounding retrievals can potentially augment and enhance the operational forecasting toolkit for monitoring Saharan dust episodes. The focus of this paper was to examine the skill of the NOAA Unique Combined Atmospheric Processing System (NUCAPS) temperature and water vapor profiles within the dust and non-dust conditions during the March 2019 NOAA Aerosols and Ocean Science Expedition (AEROSE). During this time, the NOAA Ron Brown research ship launched radiosondes to coincide with satellite overpasses that served as independent ground truth data for evaluating NUCAPS. Compared to RAOBs from the Ron Brown, the SNPP and NOAA-20 NUCAPS-derived soundings showed skill in profiling atmospheric conditions supporting Saharan dust monitoring. Outside of dust regions, the NOAA-20 NUCAPS surface temperature bias peaks at 2.0 K; the surface water vapor bias is minimal (~1000 hPa), with a small cold bias that peaks at −50% between 742 and 790 hPa. Corresponding temperature RMS values are less than 2.0 K; water vapor RMS values are generally below 70%. Within the dust regions, NOAA-20 NUCAPS temperature soundings show a cold bias peak of 2.6 K at 918 hPa and 113% of a moist bias peak at the same level. Corresponding temperature RMS values maximize at 3.5 K at 945 hPa; the water vapor RMS shows a peak value of 106% at the same level. Weather forecasters can apply NUCAPS across the NTAB in issuing timely and accurate hazardous air quality warnings and visibility alerts to health officials and the general public.

Graphical Abstract

1. Introduction

Saharan dust is a diverse aerosol species of organic and inorganic compounds that constitute one of the greatest sources of atmospheric aerosol globally, with dust transported into Europe and westward for thousands of kilometers across the Atlantic Ocean to the Greater Caribbean and the Americas [1]. The dust provides great benefits to soil and coral reef nutrients. Unfortunately, however, the human respiratory system does not react well to its concentrations, where PM10 and PM2.5 counts can reach well into unhealthy levels. Fine dust particles can significantly reduce air quality, degrade vision, cause eye irritation, and can also cause sinus and respiratory problems. For the Caribbean region, namely the West Indies and Puerto Rico, some of the highest asthmatic rates globally that can lead to mortality are in large part due to episodes of Saharan dust transport over this region [2,3,4]. The most significant Saharan dust impacts occur during the boreal summer, as the Saharan dust is contained within an elevated air mass known as the Saharan air layer (SAL). During certain summers (e.g., 2019 and 2020), these dust-laden SAL events occurred with continuous frequency across the Atlantic.
As a satellite forecasting tool, the National Oceanic and Atmospheric Administration (NOAA) Unique Combine Atmospheric Processing System (NUCAPS) [5,6,7] can monitor Saharan dust outflow into the NTAB over space (volume) and time. NUCAPS is an operational satellite-derived atmospheric sounding algorithm that combines and processes infrared (IR) and microwave (MW) sounder sensors (Cross-track Infrared Sounder (CrIS) and Advanced Technology Microwave Sounder (ATMS)) onboard the Suomi National Polar-orbiting Partnership (SNPP) and the National Oceanic and Atmospheric Administration-20 NOAA-20 (formerly, the Joint Polar Satellite System-1 (JPSS-1) platforms. NUCAPS products include remotely sensed temperature and moisture profiles which, when analyzed on skew-T log-P (hereafter, skew-T) plots, can provide atmospheric stability parameters useful in dust forecasts [8]. NUCAPS soundings can resolve approximately 2.5 km vertical resolution [9] and between 50 km (nadir) and 150 km (scan edge) horizontal resolution volumetric profiles for temperature, water vapor, and trace gases. NUCAPS are retrieved on 100 layers from the surface to 1 hPa. These products are routinely available to weather forecasters within the NOAA National Weather Service (NWS) Advanced Weather Interactive Processing System, version 2 (AWIPS-II) workstations.
Since its operational inception in 2013, NUCAPS has emerged as a valuable source of operational (and research) observations capable of profiling a variety of weather features, including tropical cyclones, pre-convective conditions for developing severe thunderstorms, atmospheric rivers, and Cold Air Aloft (CAA) [10]. NUCAPS was extensively validated against global collocated radiosonde observations (RAOB), where the combined root-mean-square uncertainty (RMSE) versus these in situ measurements was found to be ≤2.0 K and ≤26% (water vapor mixing ratio fraction of the tropospheric layer below 300 hPa) [11].
For the NWS forecaster, NUCAPS produces tailor-made products via the AWIPS-II graphical workstations in data latencies that satisfy operational time constraints. Over the past 3 years, NUCAPS has been tested with success in providing forecast guidance in cases of severe convective weather via Hazardous Weather Testbed (HWT) experiments over the US Midwest [12]. Additionally, NUCAPS applications in profiling CAA are assisting forecasters over the Alaska region in identifying very cold atmospheric regions where jet fuel can coagulate and jeopardize operations [10]. As a result, NUCAPS has gained traction as a useful resource within NWS forecast operations.
As it is a part of a polar-orbiting network of weather satellites, NUCAPS soundings can provide global-wide users with reliable atmospheric information in near real-time, covering the broad expanses of data-sparse regions. Since radiosondes on a global scale are relatively sparse temporally speaking (and spatially sparse over oceans), the ability of these soundings to fill in gaps is invaluable. NUCAPS does not directly measure African mineral dust outflow into the open water of the Atlantic basin, but it can identify SAL conditions associated with dust [13], as well as atmospheric conditions conducive to dust transport. Saharan dust is typically confined to the lowest layer of the atmosphere [14,15]. During the 2019 AEROSE cruise study period of early spring, Saharan dust content was typically below 850 hPa and is our focus area. NUCAPS skew-T profiles correspond to Ron Brown observations and RAOBs. For this study, the dust environment is defined by an open water region just offshore of the Northwest African coast, as depicted in Figure 1, within the “Leg 2” portion of the 2019 NOAA Aerosols and Ocean Science Expedition (AEROSE) cruise.
In the current paper, using a case study approach, we outline processes to provide forecasters and agencies situated in the greater Caribbean with timely NUCAPS products that can provide more timely and additional information to the public in preparing for SAL events. We evaluated NUCAPS’s skill in profiling a Saharan dust outflow event from NOAA’s Ronald H. Brown weather research vessel (hereafter, Ron Brown) during the 2019 AEROSE [11]. Section 2 describes the various datasets and operations that are used for this evaluation. Section 3 investigates case studies during AEROSE for non-dust (8 and 24 March) days and in-dust (13 and 18 March) days, where NUCAPS was compared against RAOBs launched by the Ron Brown. This section also provides validation results Section 4 investigates bulk studies during the entire timeframe of 3–29 March along the Ron Brown voyage from within the dust-free conditions in the western and NATB to in-dust conditions during 12–19 March. Section 4 provides a summary of the results. Finally, Table A1 in the Appendix A section describes the acronyms used in this article as an easy reference.

2. Materials and Methods

2.1. NUCAPS

NUCAPS retrieves profiles of temperature, moisture, and trace gases with a reasonable degree of accuracy under both clear and partly cloudy (non-uniform or precipitating) scenes using measurements obtained from IR and MW sounders [16]. NUCAPS is run operationally by NOAA using the Cross-track Infrared Sounder (CrIS) and Advanced Technology Microwave Sounder (ATMS) instruments on the Suomi-National Polar-orbiting Partnership (SNPP) and NOAA-20 low earth orbiting (LEO) platforms. NUCAPS is available for other satellites as well (e.g., Metop-B, -C). A single satellite can produce up to 340,000 volumetric profiles globally per day, providing valuable data between radiosonde launches and over remote regions. Note that NUCAPS retrievals are highly consistent across platforms (https://www.star.nesdis.noaa.gov/jpss/soundings.php) accessed on 7 July 2022.
A high-level flowchart of the major algorithm steps is shown in Figure 2, with the bolded steps being the most relevant to this paper. NUCAPS retrieves (1) an MW-only estimate of temperature and moisture (left panel) and (2) a combined IR plus MW (IR + MW) retrieval (right panel) with the retrieved temperature and moisture at a higher vertical resolution than the MW-only retrieval. While both retrievals and a multitude of trace gas products are available for research users in the NUCAPS environmental data records (EDR), forecasters only receive the combined IR+MW temperature, water vapor, and ozone retrievals. For this reason, we only evaluated the IR+MW retrievals in this paper.
The combined IR + MW NUCAPS algorithm uses a sequential Bayesian optimal estimation method to estimate the atmospheric state [6,7]. This methodology is based on the Atmospheric Infrared Sounder (AIRS) version 5 algorithm. The NUCAPS algorithm begins with a regression-based first guess of the atmospheric temperature and moisture profile state. The first guess is then updated for scenes where the retrieval has observing capabilities, such as non-precipitating scenes or those with non-uniform cloud cover. NUCAPS can retrieve multiple variables at different vertical pressure levels by only using a subset of spectral channels. The channels are selected such that they are sensitive to the target variables while maintaining as much spectral independence from other retrieved parameters as possible [13]. Furthermore, the order that variables are retrieved helps to further stabilize the solution, as some atmospheric constituents are highly sensitive to other variables. For example, the temperature is retrieved twice, once to produce an initial estimate and a more accurate estimate once H2O, CO, and HNO3 are known. While NUCAPS retrieves many atmospheric state variables, we considered only the temperature and moisture retrievals in this paper for near real-time monitoring of Saharan dust.
Each NUCAPS footprint is an aggregation of a 3 × 3 array of the CrIS fields-of-view (FOV), which is called the field-of-regard (FOR). Because the IR cannot penetrate cloud tops, NUCAPS instead retrieves variables by estimating the atmosphere around clouds. This method, called cloud clearing, is performed by aggregating the clear FOVs within each FOR. Note that even if cloud clearing fails (e.g., during 100% cloud cover), NUCAPS always retrieves all variables, although the result more closely resembles the first guess. These retrievals include a degraded quality flag.
In 2014, NUCAPS temperature and moisture retrievals from SNPP were made available to NWS via the Satellite Broadcast Network (SBN) for display in AWIPS-II. On 7 March 2019, NUCAPS from NOAA-20 became operational but was not initially included in the SBN. From 26 March to 11 August 2019, the CrIS on the SNPP experienced an electronics malfunction, so NUCAPS from NOAA-20 replaced those from SNPP. Having both satellites could provide significant improvements in temporal and spatial coverage. However, it is important to note that at present, only NOAA-20 is delivered via SBN to AWIPS-II, and data from other satellites must be accessed from other sources.
Within AWIPS-II, NUCAPS can be displayed as a skew-T diagram and as a gridded product [17], which allows forecasters to assess stability parameters such as lapse rates, Convective Available Potential Energy (CAPE), and Lifting Condensation Level (LCL). Outside of AWIPS-II, the NUCAPS EDR from both SNPP and NOAA-20 are available to the public via the NOAA Comprehensive Large Array-data Stewardship System (CLASS: (www.class.noaa.gov) accessed on 4 April 2022. Non-NWS forecasters can also benefit from the NUCAPS skew-T and Gridded NUCAPS retrievals and derived products on web-based resources. An up-to-date listing of NUCAPS visualization tools can be found at https://weather.msfc.nasa.gov/nucaps/ (accessed on 3 March 2022).

2.2. Visible Infrared Imaging Radiometer Suite (VIIRS)

VIIRS provides a daily, high-resolution visual display of dust and cloud conditions. We examined the NOAA-20 and SNPP VIIRS true color imagery (from NASA worldview: (https://worldview.earthdata.nasa.gov) (accessed on 4 April 2022)) during the early afternoons for the days within the case study as a visual resource toward dust production and intensity over the Saharan region and the dust extent into the NATB. These products were especially useful in assessing dust conditions over the source regions as well as within the path of the Ron Brown.

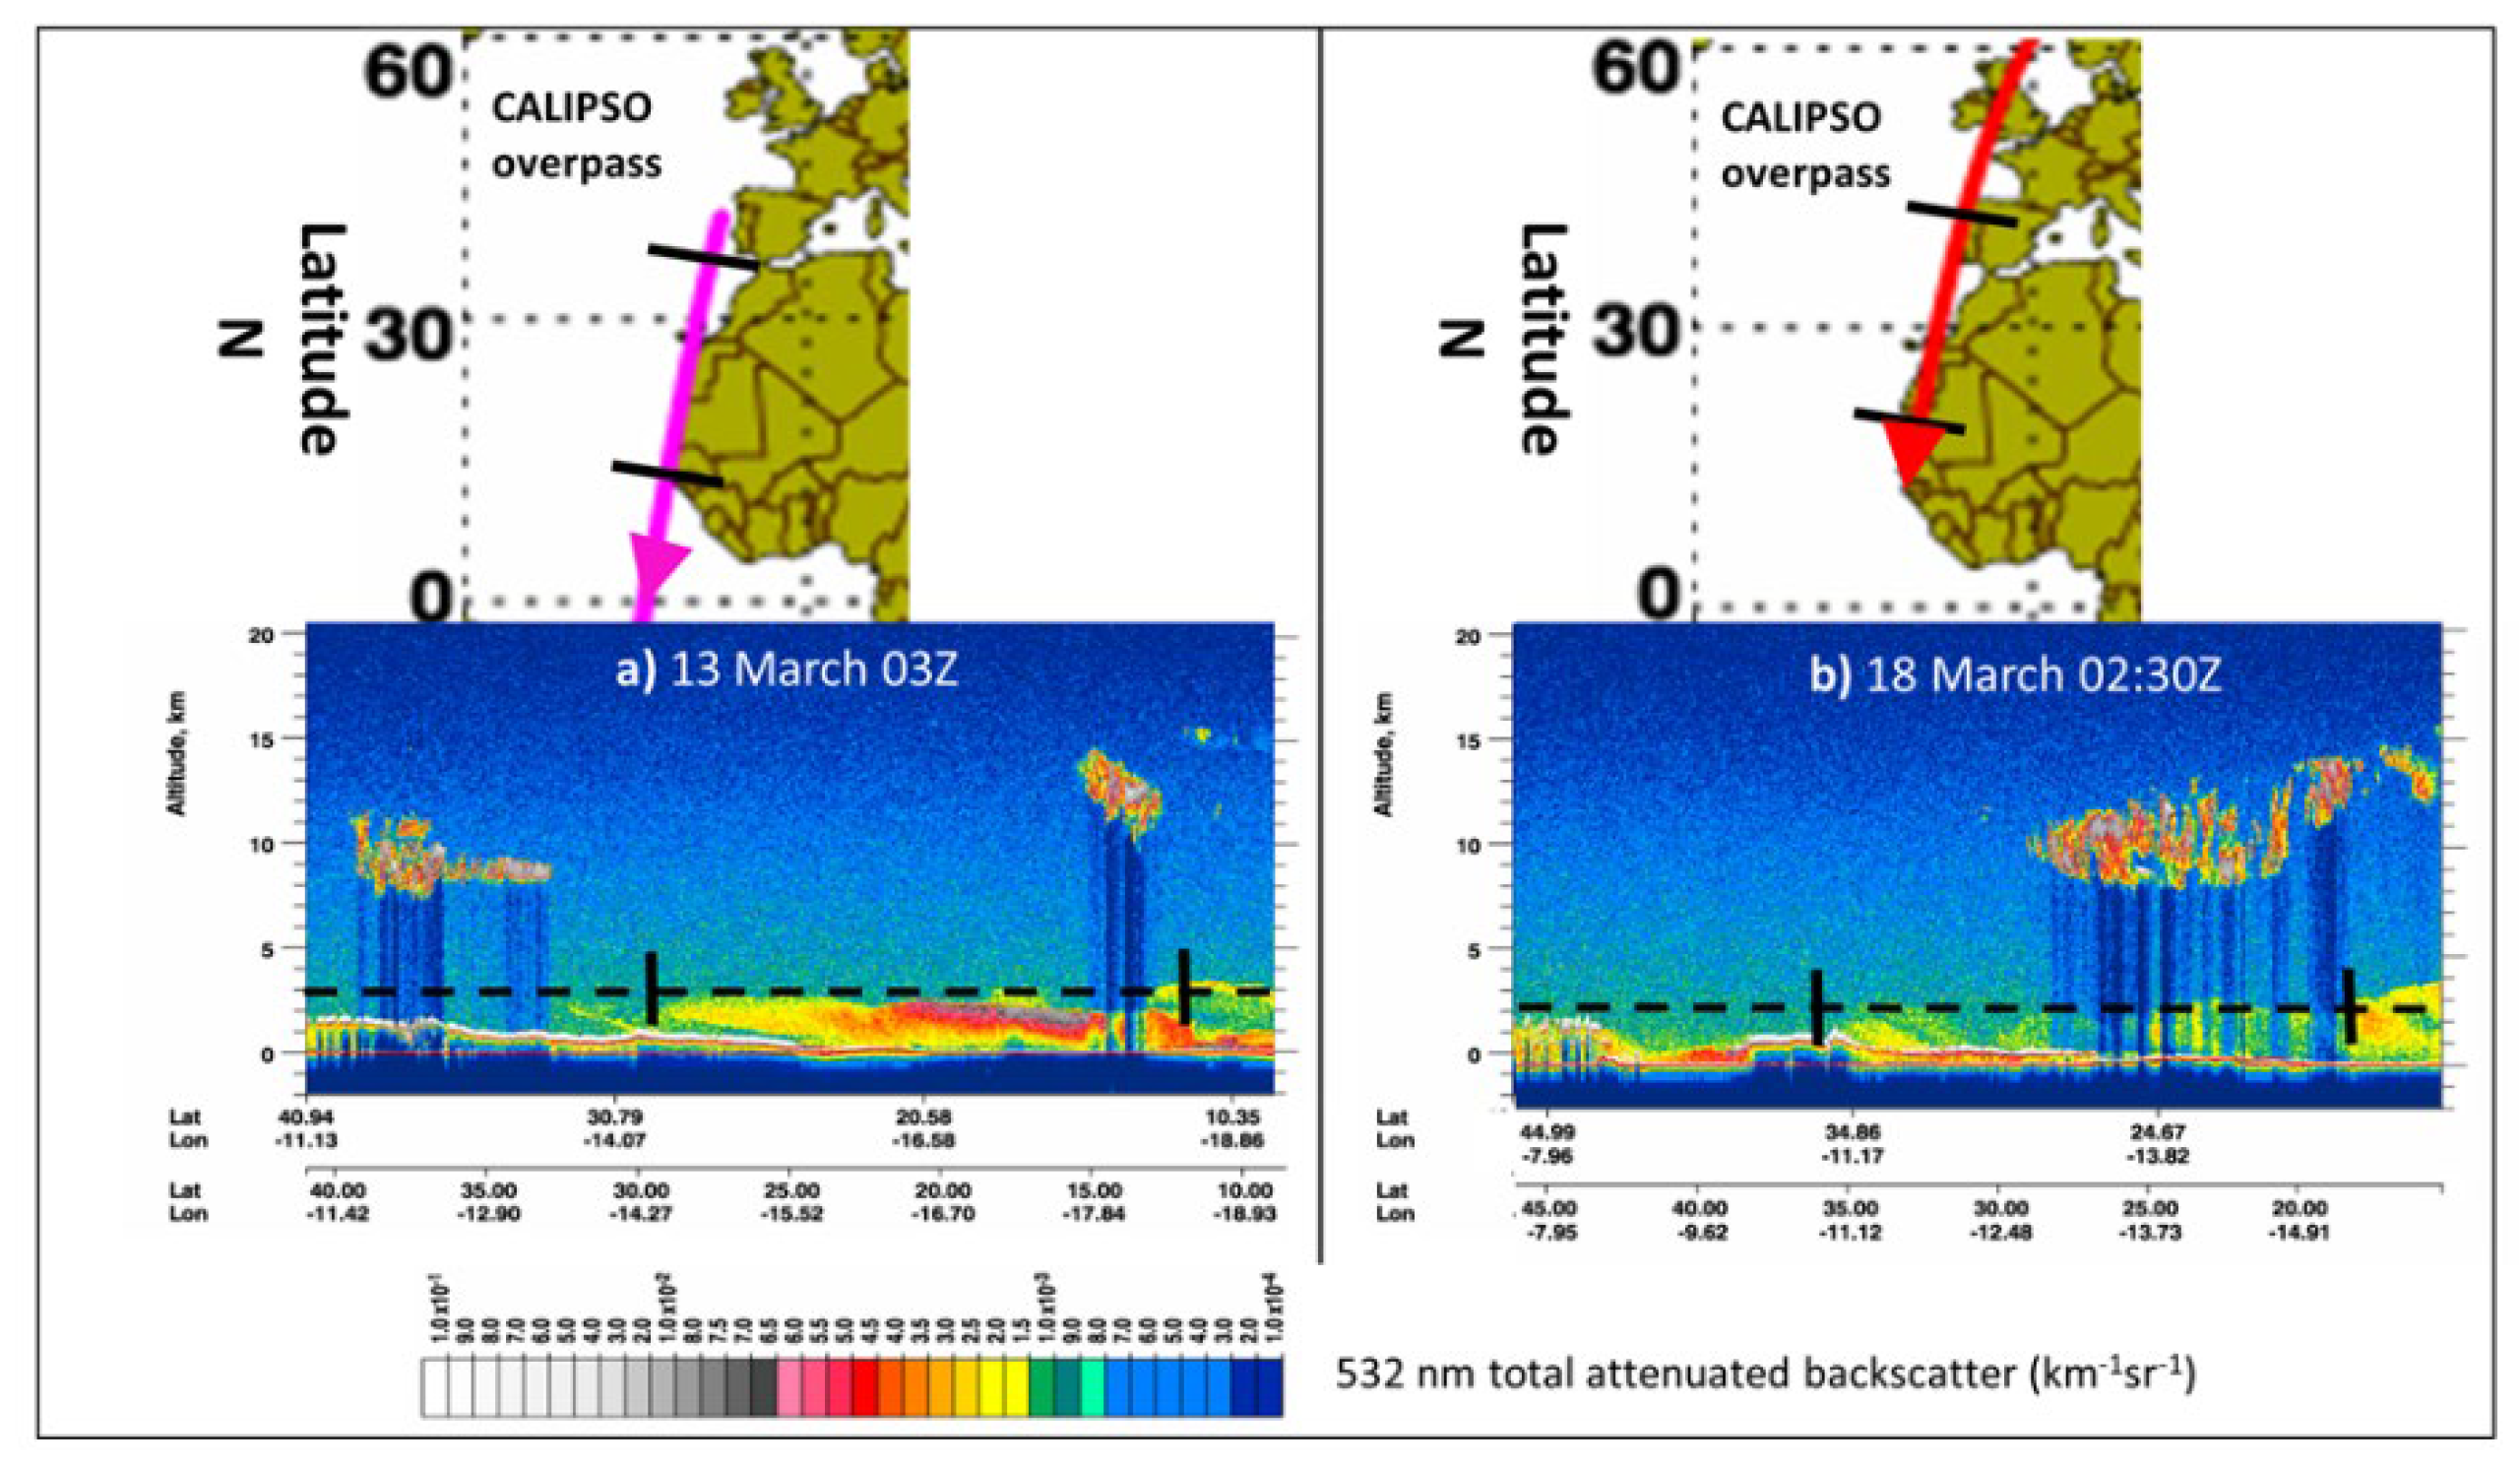
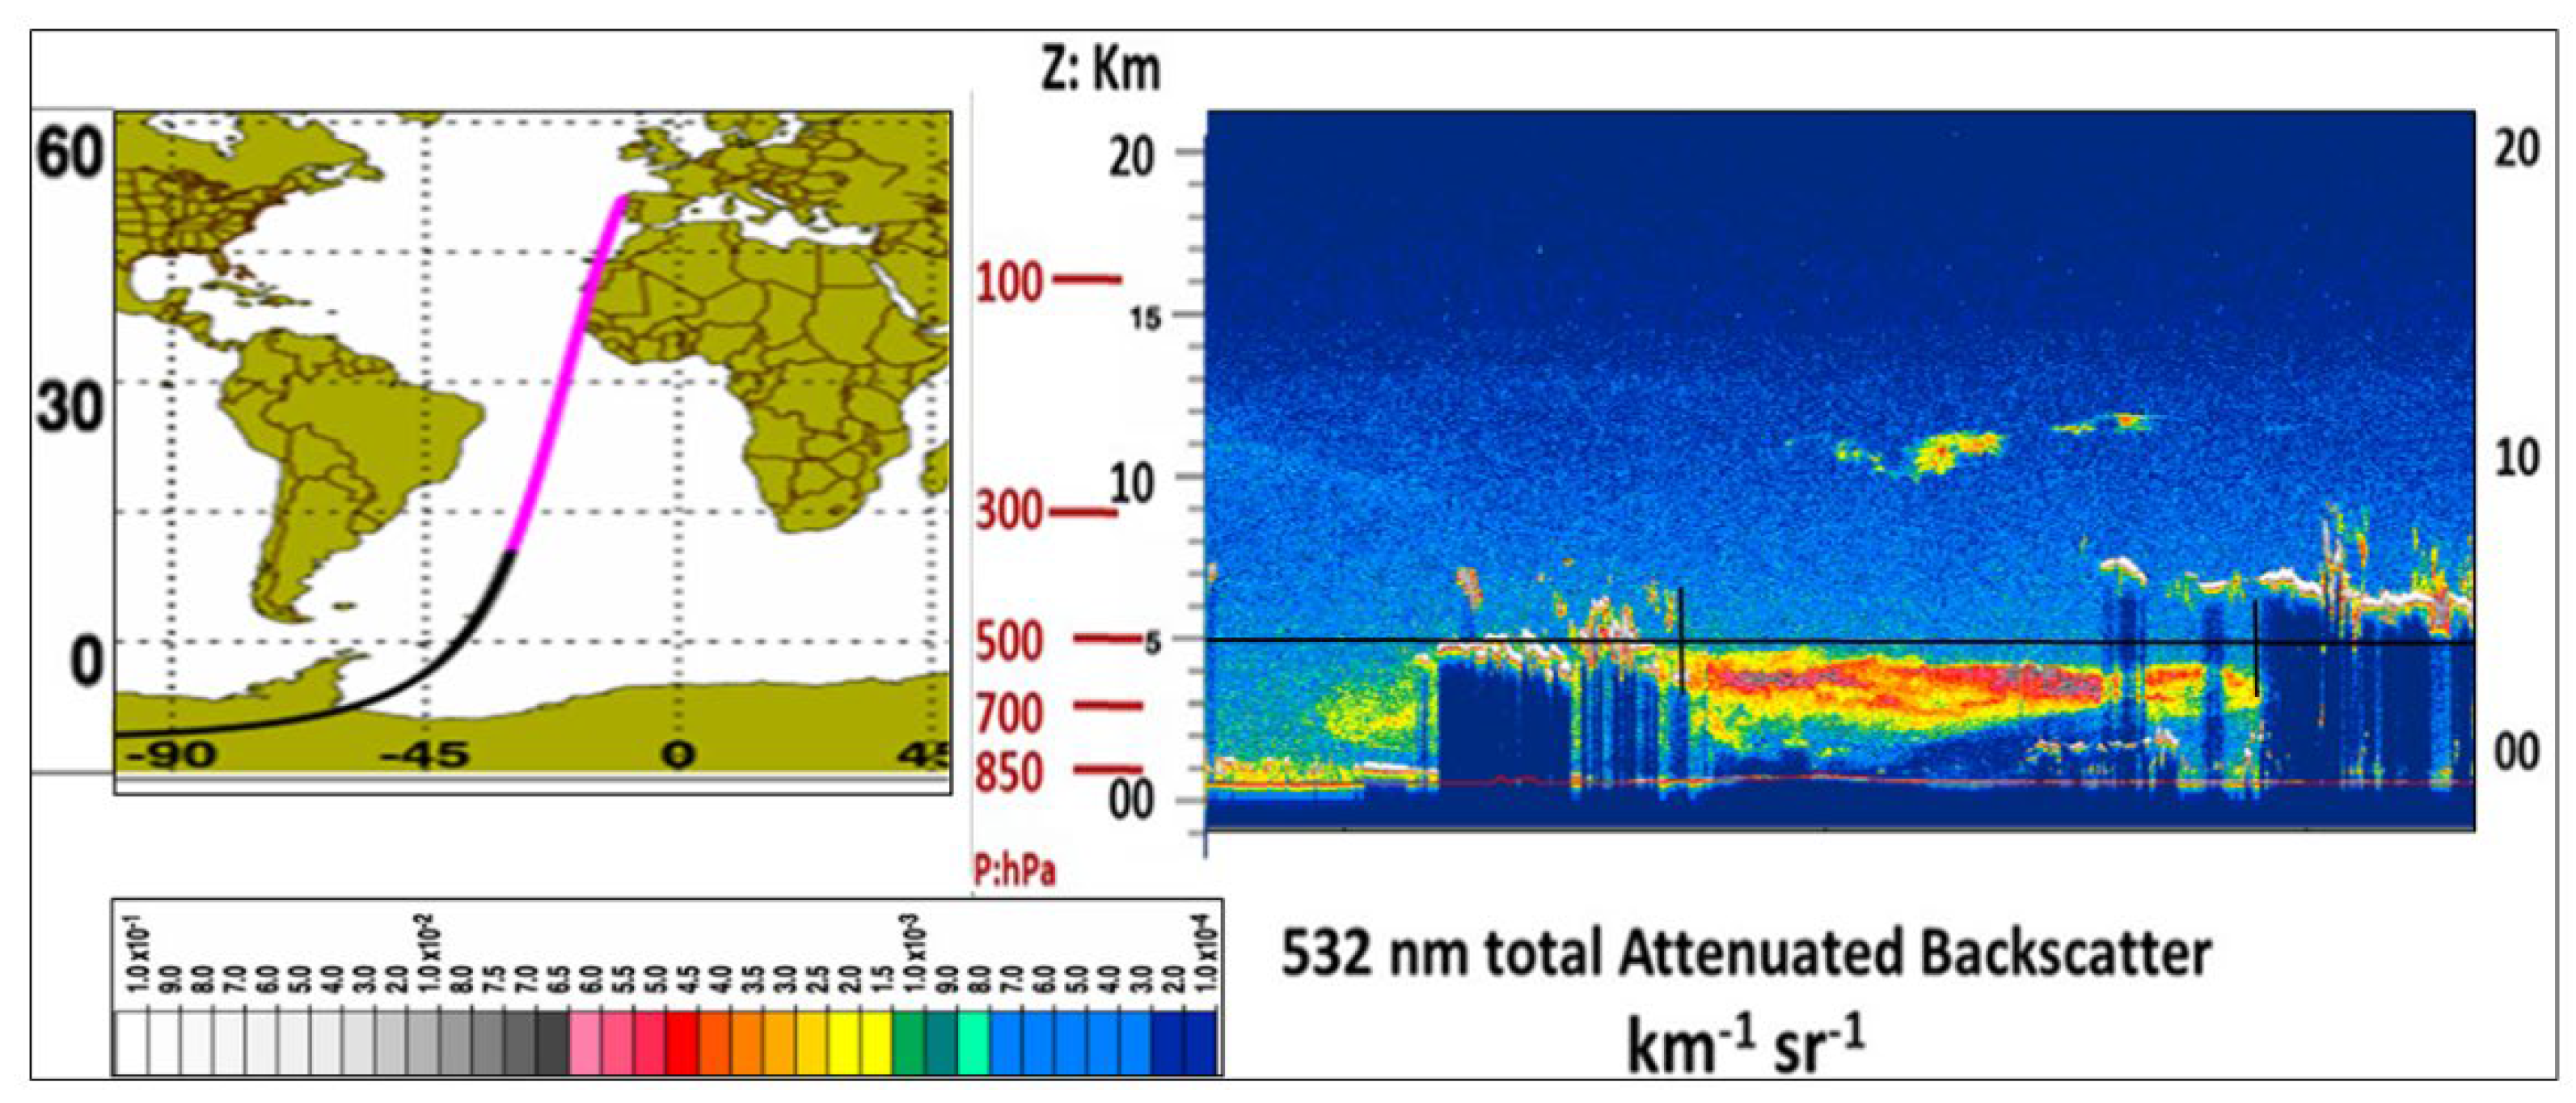
2.3. Cloud-Aerosol Lidar with Orthogonal Polarization (CALIOP)

CALIOP [18] is a nadir pointing two-wavelength polarization lidar that resides onboard the Cloud-Aerosol Lidar and Infrared Pathfinder Satellite Observation (CALIPSO) satellite, part of NASA’s A-train constellation of low earth orbiting (LEO) satellites (which are flown in the same 01:30/13:30 orbit as NOAA-20 and SNPP) since May 2006. CALIOP provides high-resolution vertical profiles of aerosols and clouds throughout the troposphere and lower stratosphere. For this paper, CALIOP products consisted of backscatter related to aerosols, in this case, Saharan dust. This resource is especially useful in tracking the SAL height as traced by the associated dust plume as well as determining the evolution of the dust pattern as it propagates from east to west.

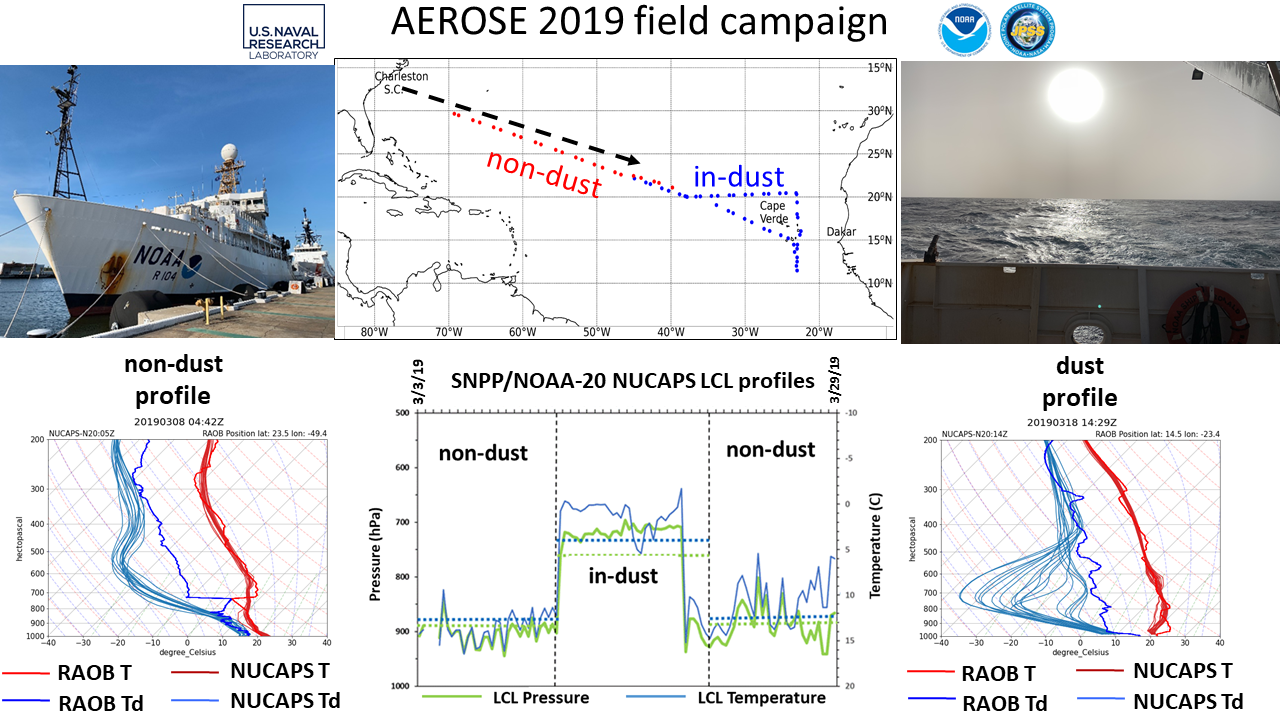
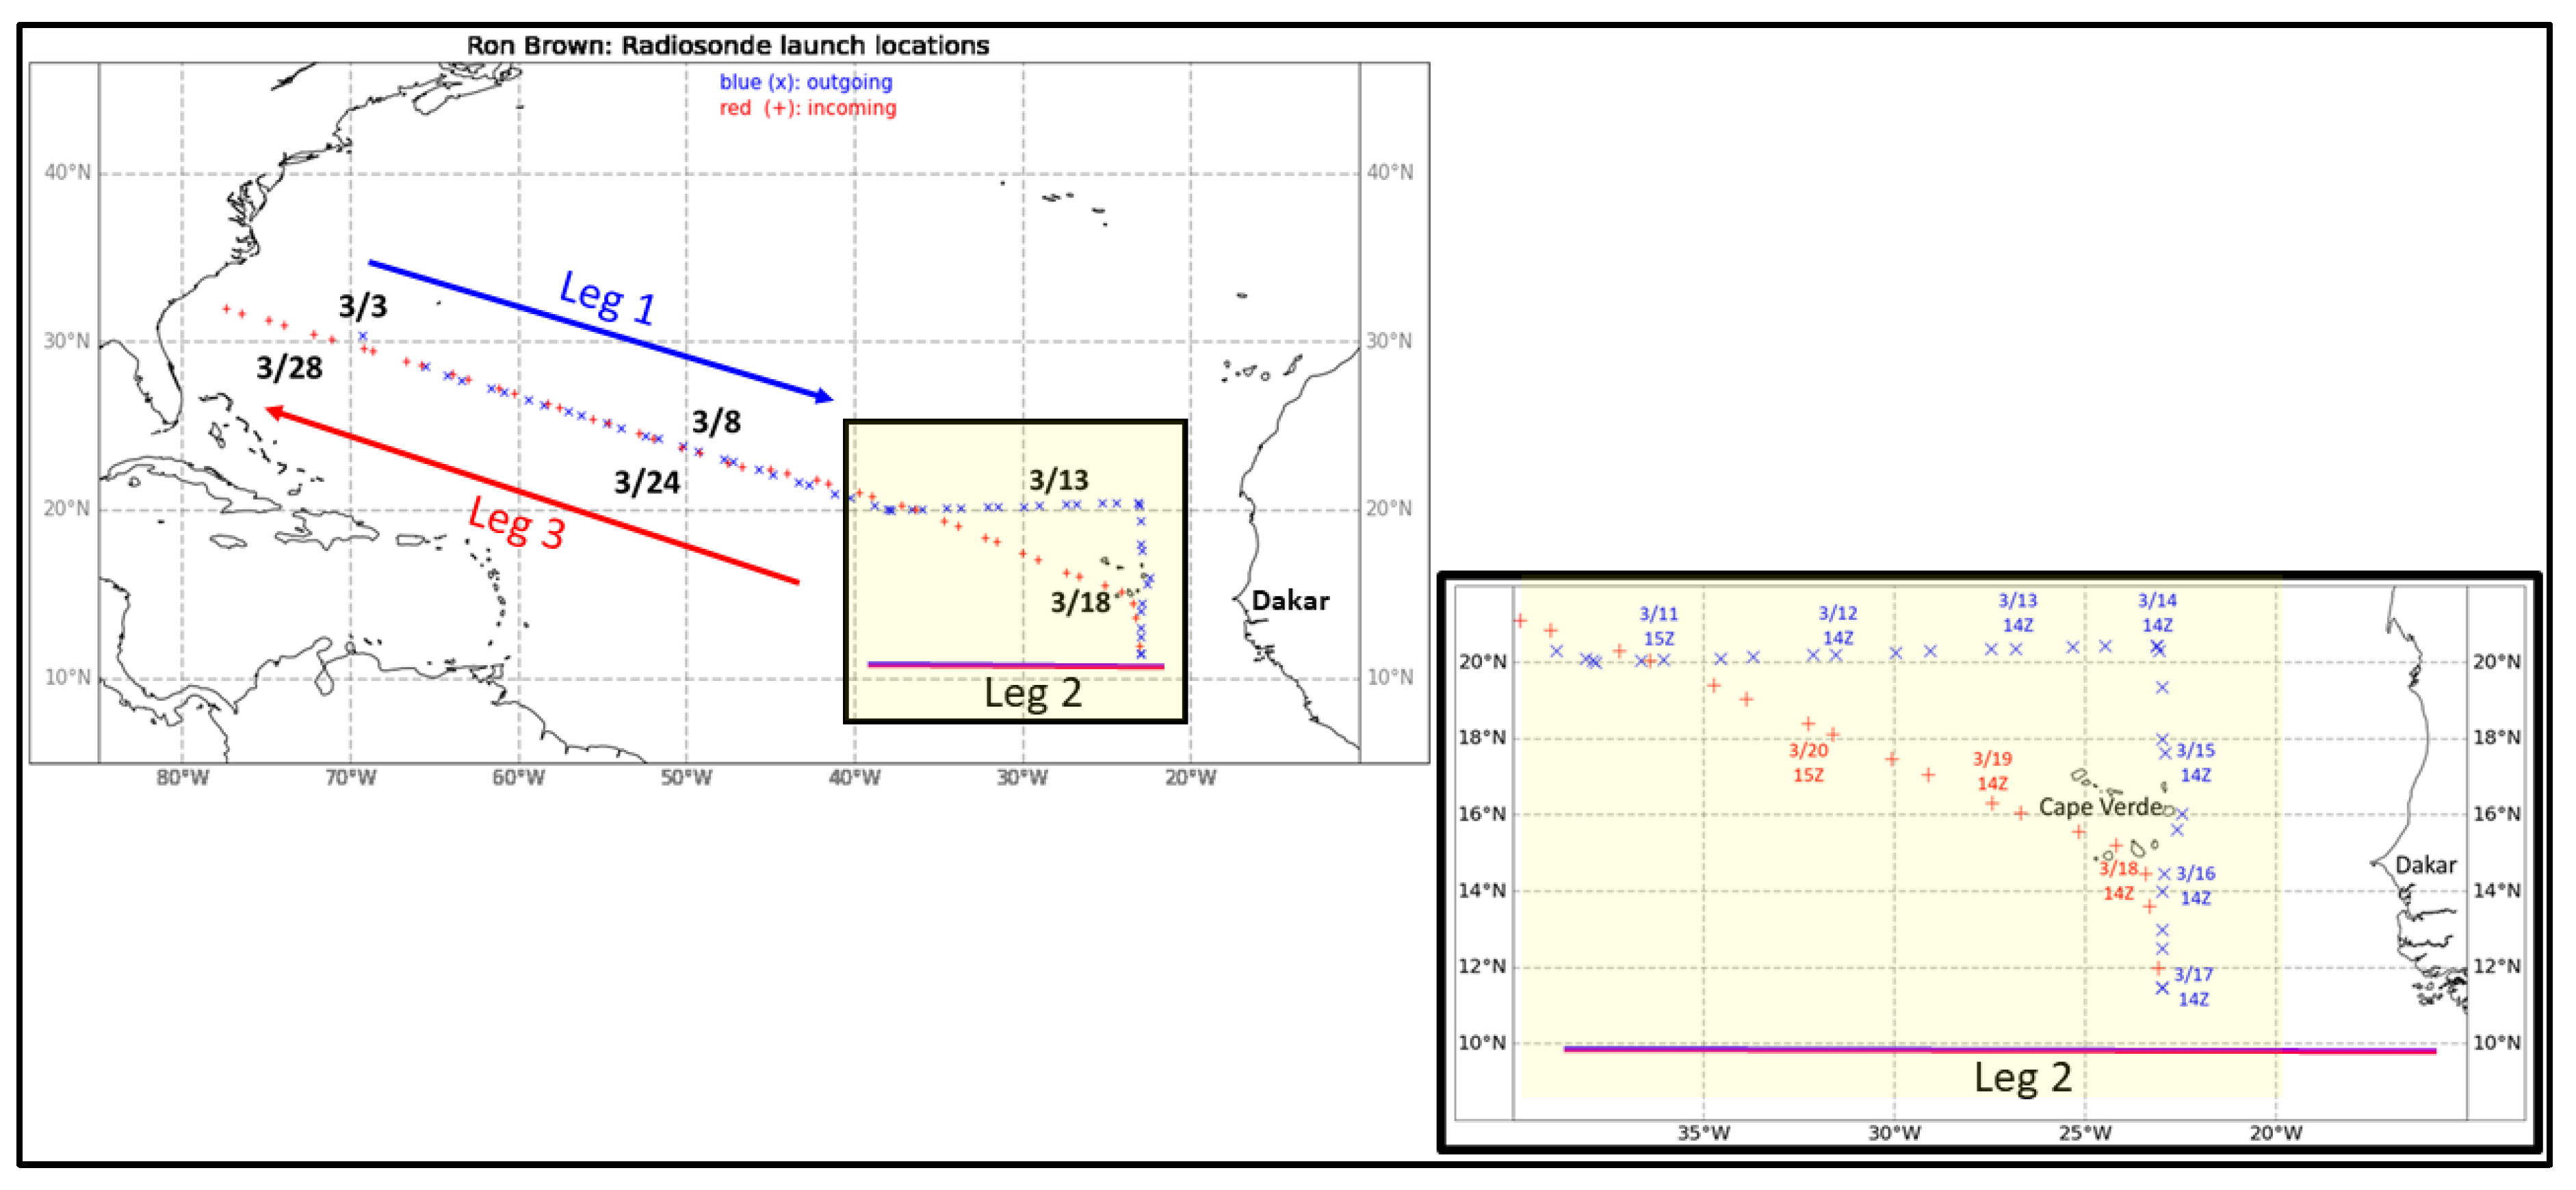
2.4. Radiosondes from the AEROSE Field Campaign and Their Collocations with NUCAPS Sounding Profiles

The Saharan AEROSE campaigns are an internationally recognized series of trans-Atlantic field campaigns conducted onboard the NOAA ship Ron Brown and designed to explore African air mass and their impacts on climate, weather, and environmental health [19,20]. The AEROSE campaign during March 2019 [19] provided a wealth of marine in situ atmospheric data, in particular, sounding data from ship-based dedicated radiosonde (RAOB) launches for evaluating NUCAPS in the context of SAL events coming off of the Northwest African coast. During 12–19 March 2019, the Naval Research Laboratory—Marine Meteorology Division (NRL-MMD) leveraged a rich dataset of 101 high-quality Vaisala RS41 radiosondes contributed by the NOAA JPSS calibration and validation program for launch during AEROSE ship transects. Vaisala RS41, the newly emerging sonde type, shows improvements over its predecessor sonde RS92 in the accuracy of temperature and particularly humidity measurements [21,22,23], warranting a more accurate (than using RS92) assessment of NUCAPS products. The Vaisala RS41 also contains the positional aspect that allows the GPS to track upper levels of wind directions and speeds, i.e., rawinsonde observations. The AEROSE team timed the launching of RAOBs approximately 30 min prior to NOAA-20; SNPP and Metop-B served as alternative resources in cases of NOAA-20 orbital gaps. Data obtained during this time period were a series of significant outflows of Saharan dust; the most intensive periods were 12–14 March and 17–18 March, when the Ron Brown was closest to the African coast. NRL-MMD collected both inland and offshore RAOB data.
The AEROSE 2019 radiosondes (along with other dedicated and GRUAN radiosondes) were collocated with NUCAPS SNPP, NOAA-20, and other satellite products through the NOAA Products Validation System (NPROVS) [24,25], supported by the NOAA Joint Polar Satellite System (JPSS) and operated at NOAA NESDIS office of Satellite Applications and Research (STAR) starting 2008. NPROVS provides routine data access, collocation, and intercomparison of multiple satellite temperature and water vapor sounding product suites and NWP model profiles matched with global operational radiosonde and dropsonde observations and dedicated radiosondes. The collocation approach employed in NPROVS is to select the “single closest” sounding from each satellite product suite for a given radiosonde profile. The time and distance differences between radiosonde and satellite are computed based on the radiosonde launch time and location and the satellite profile time and location on the Earth’s surface. In addition to satellite product monitoring, NPROVS collocation data has emerged as a source of “condensed” dataset for product cross-checking and validation, including assessing if satellite products meet mission requirements by taking advantage of the large radiosonde sample from the conventional network and high-quality dedicated/GRUAN data [13,23].
Figure 1 displays mapping of the AEROSE March 2019 dedicated RAOB launch locations that are collocated to both SNPP and NOAA-20 soundings from the Ron Brown. Between 12 and 21 March (inset in Figure 3), the Ron Brown maneuvered along a triangular path, with its eastern boundary along the 24 W longitude. It was during this period that the ship encountered a variety of light to heavy Saharan dust concentrations from outflow off the coast. The vessel’s latitude ranged from 11 N to 22N.

2.5. Aerosol Robotic Network (AERONET)

AERONET [26] is a federation of a ground-based global network of sun photometers that provide instrument measurements of spectral aerosol optical depth (AOD), inversion products, and precipitable water in diverse aerosol regimes. For this study, we applied AERONET measurements that focus on AOD retrievals from sites situated over interior/coastal Africa and Cape Verde, located just offshore of Northwest Africa. It provides quantitative assessments of dust activity over inland Africa. The AERONET plots and discussions in this paper confirm the very large concentrations of Saharan dust events during 11–14 March 2019.

2.6. Model Support

The Global Forecast System (GFS) provides archives of synoptic upper air chart forecasts as hosted by the University of Wyoming’s Wyoming Weather Web. Chart products covering the NATB are customized for this article by Larry Oolman of the University of Wyoming.

2.7. Method of Comparing NUCAPS to Ron Brown RAOB Observations

In order to properly compare NUCAPS to the Ron Brown RAOBs (ground truth), it is important to select representative NUCAPS skew-T plots about the RAOB location. In viewing adjacent NUCAPS plots, there is some variability in the temperature and dew point temperature profiles, which are computed from temperature and moisture data for NUCAPS. Additionally, the NUCAPS field of regard (FOR) varies from a large density at nadir (~50 km) to relatively few at the edge of the scan (~150 km) [27]. Therefore, we subjectively chose representative NUCAPS Skew-T plots to be within ±1 degree in both the latitude and longitude of the RAOB location. We only used profiles that have a successful IR+MW retrieval.
Additionally, as already mentioned, NUCAPS are volumetric retrievals, not point soundings such as RAOBs, which inhibits their response to fine-scale structures but enhances their representation of the larger (synoptic) scale environment. The fundamental vertical and horizontal resolving power of the passive IR measurements is optimal at these scales and useful (fills voids) for forecast applications. NUCAPS thus provides unique temperature and moisture “observations” that can effectively fill large global “volumes” across data-sparse regions but may also miss the fine vertical structure, particularly within the lowest (boundary) layers. Forecasters can identify/affirm larger-scale Saharan dust signatures using NUCAPS retrievals. Forecasters can also benefit from ancillary information such as model output and in situ measurements, particularly in the boundary layer vicinity, where fine structure changes are common; efforts are underway at the National Weather Service Weather Forecast offices (NWS-WFO) to “adjust” NUCAPS targeting the boundary layer.

3. Results

3.1. Case Studies of Dust and Non-Dust Environments

We studied how and whether NUCAPS-processed skew-Ts respond to dust and non-dust conditions throughout the NATB. Thanks to the wealth of sounding data provided by the Ron Brown during the AEROSE 2019 campaign, we were able to collect 102 sets of soundings from the rawinsonde launches (RAOBs) from the Ron Brown. Each of these RAOBs matched at least one NUCAPS retrieval from either or both of the SNPP/NOAA-20) platforms. RAOBs and SNPP/NOAA-20 NUCAPS. Table 1 displays the times and positions for each case study day that describe four soundings of dust and four soundings of non-dust background conditions. As noted in Section 2.7, the NUCAPS positions are within 1 degree in latitude (~111 km) and longitude (~80 km) of the position where the RAOB was launched, as listed in the last column. As shown, the time differences between the RAOB and either SNPP or NOAA-20 NUCAPS were within 1.5 h. Synoptically, the low level (850 hPa) pressure pattern across the NATB is tied to the semi-permanent Azores High, which is the prominent mechanism for the circulation pattern of Saharan dust and its westward propagation toward the Caribbean Islands [28].

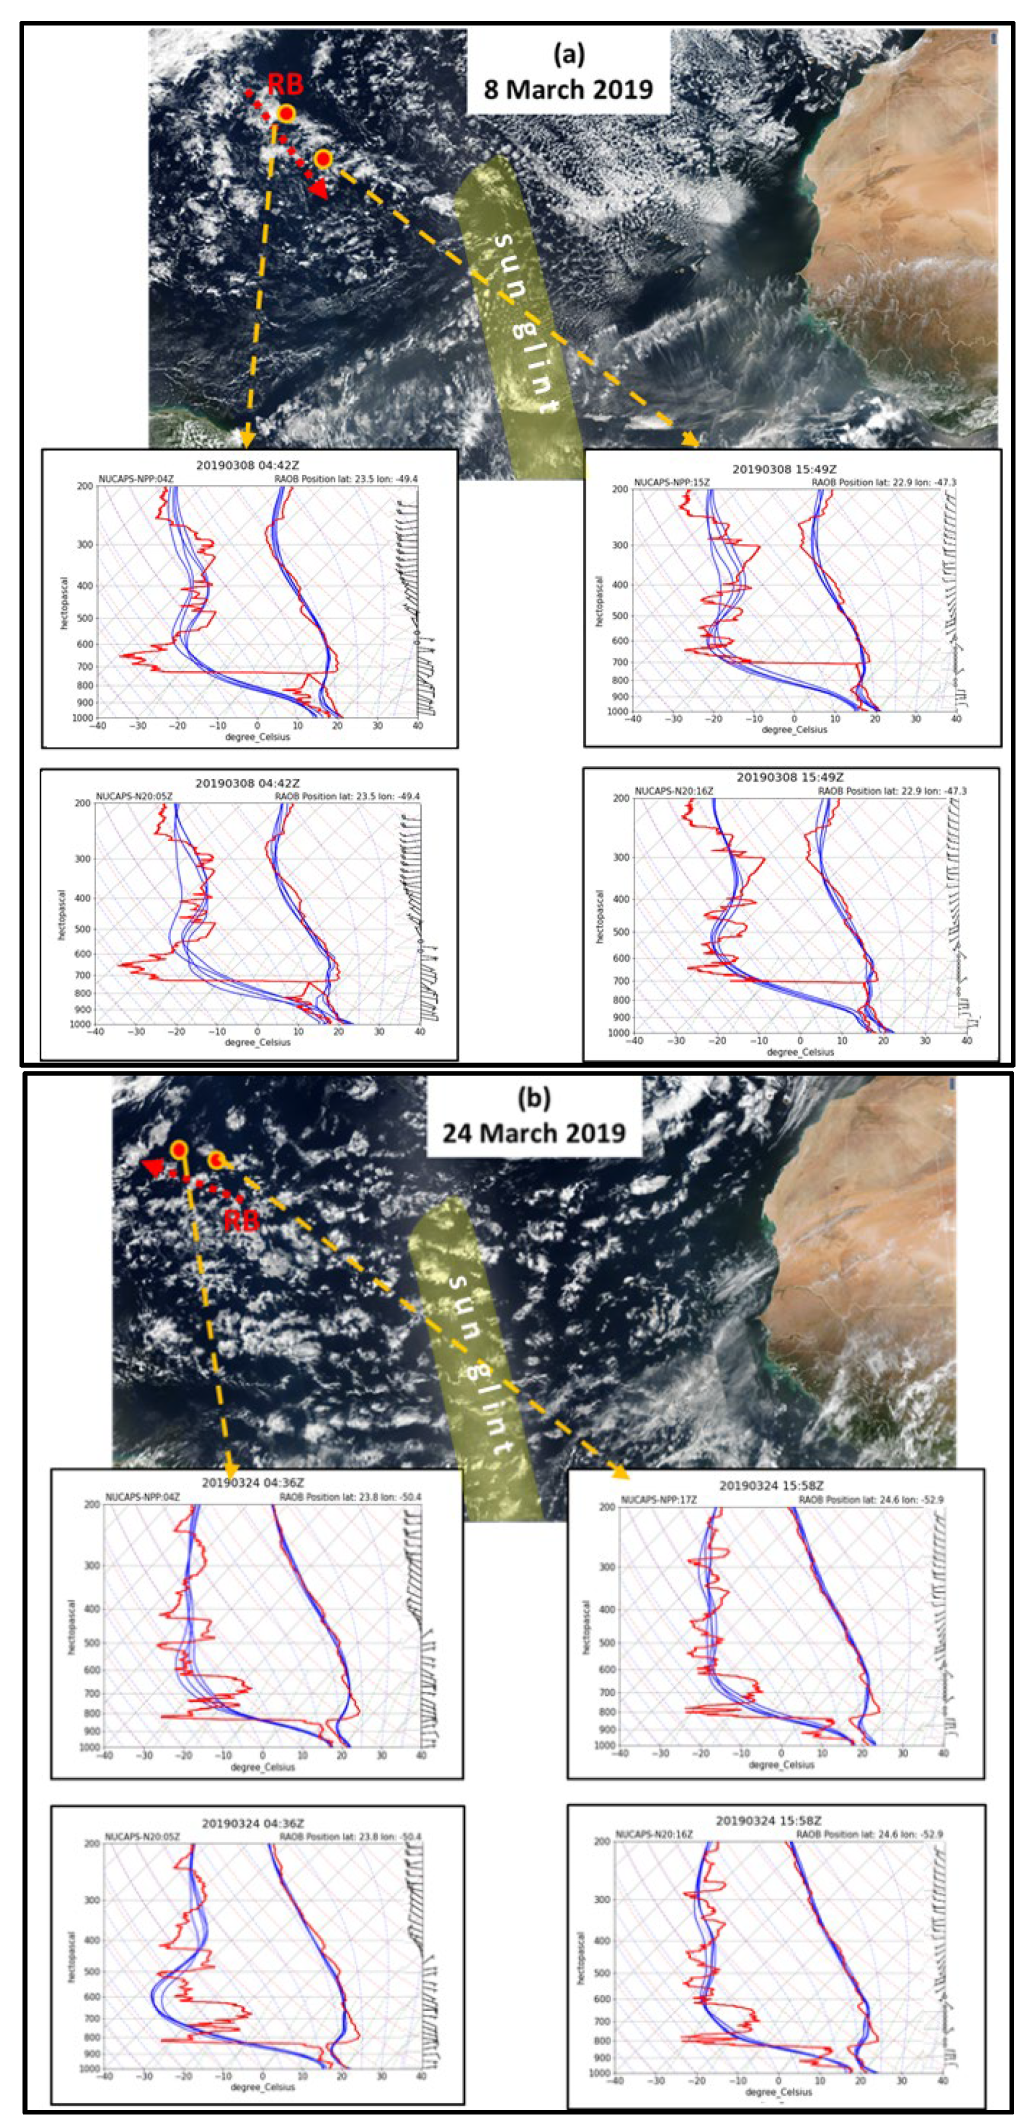
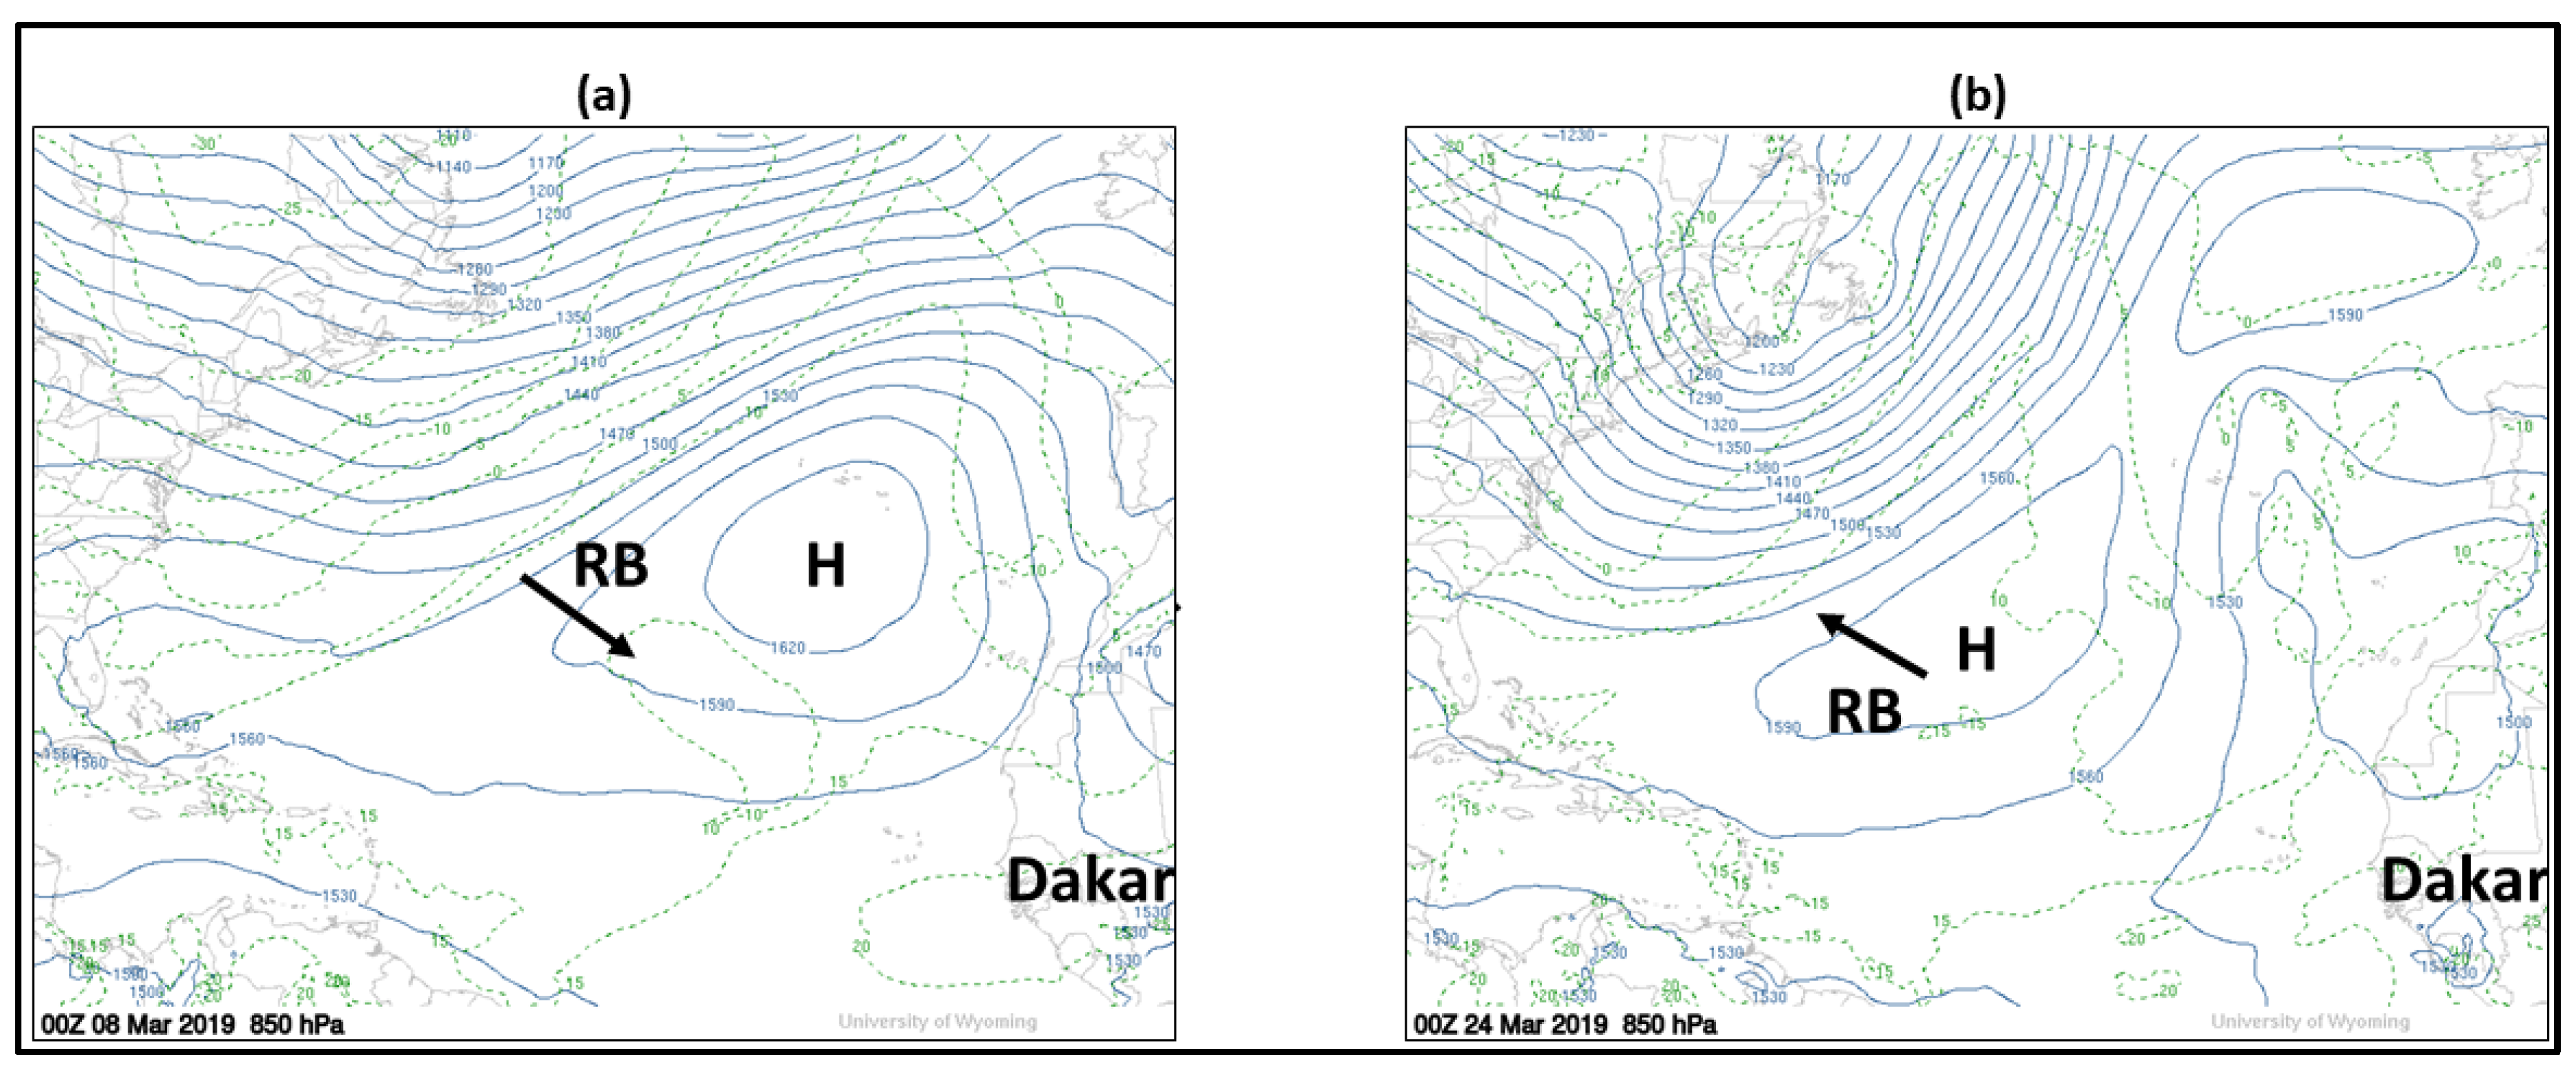
3.1.1. Non-Dust (Background) Profiling: 8 March and 24 March

For this study, we look at two cases where the Ron Brown traveled outside of the dusty environment on 8 March and 24 March; these are representative of natural (non-dust) atmospheric conditions across the NATB. Throughout the year, African dust transport is closely tied to a semi-permanent high-pressure system off the coast of the Azores [26]. Figure 3 provides 850 hPa synoptic charts from the GFS tau = 0 (initial model run) for 8 March (Figure 3a) and 24 March (Figure 3b). An overlay of the Ron Brown cruise during each day is annotated by a solid black arrow. In both cases, the RAOBs are launched in a dust-free environment, close to the center of the high-pressure system.
Figure 4 presents the early afternoon true color imagery and associated skew-T plots for (a) 8 March and (b) 24 March. The red dashed arrows within the true color image indicate the path of the Ron Brown throughout the day; for both cases, the Ron Brown is traversing across partly cloudy and dust-free conditions throughout the NTAB. On 8 March (Figure 4a), the path of the Ron Brown was from northwest to southeast on its journey toward Africa. On 24 March (Figure 4b), the Ron Brown was on its westward trek toward its home port in Charleston, SC. In both cases, the Ron Brown was far removed from any Saharan dust. The pair of orange/red dots within the true color images depict the RAOB launch locations, one at night and the other during the early afternoon. The lower four panels consist of four associated skew-T plots (depicted by the orange dashed lines) consisting of one RAOB (in red) and four NUCAPS (in blue). The SNPP NUCAPS profiles are in the top two skew-T plots, while the NOAA-20 NUCAPS profiles are shown in the bottom two skew-T plots. The RAOB plots are the same for the nighttime (left panels) or daytime (right panels). There are four NUCAPS plots that surround the location of the RAOB launch; operational forecasters typically view at least several NUCAPS locations in order to establish consistency about the region of interest. In viewing the NUCAPS plots, the individual profiles vary somewhat in the dew point temperature profiles but are still fairly consistent with each other. With its accuracy described in Section 2.4, along with nearly 9000 levels for each skew-T plot (compared to 100 levels in NUCAPS), the RAOB plots clearly provide much finer detail and thus serve as ground truth for NUCAPS validation.
For the 8 March case in Figure 4a, the RAOBs for both the night and early afternoon identify a single point between 720 and 700 hPa, where the dew point temperature and temperature are the same. Below that level, the environment consists of typical maritime (moist) conditions. NUCAPS temperature profiles match the RAOBs fairly well throughout the atmosphere, with the exception of the RAOB sharply defined lower inversion layer. Within the RAOBs dew point temperature profiles, there’s a distinct dry layer that begins at the top of the boundary layer at 720–700 hPa that is maximized at ~650 hPa. During the nighttime conditions (left panels), the NUCAPS dew point temperature profile compares well to the RAOB near the surface (up to ~800 hPa) but then appears to “seek” the driest layer as profiled by the RAOB. The NUCAPS (SNPP and NOAA-20) dew point temperature profile is minimized at ~550–600 hPa; NUCAPS misses most of the low-level kinks revealed by the fine detail provided by the RAOB. Above that level, NUCAPS shows consistency with the RAOB. During the daytime (right panels), NUCAPS is consistent with the RAOB at the lowest layer and is better aligned with the RAOB in the driest portion of the profile. The RAOB-derived wind field does not contain any distinctive wind shear within the boundary layer; however, wind shear does occur at ~600 hPa. A strong dust field would provide inversion layers at low levels; therefore, the environment does not support dust in these regions.
For the 24 March case, in Figure 4b, with the exception of the sharp inversion layer between 820 and 800 hPa, the NUCAPS temperature profile (SNPP and NOAA-20) follows a similar trend that was described in Figure 4a. The NUCAPS dew point temperature profile misses the low-level perturbations that the RAOB provides; instead, NUCAPS profiles a broad drying pattern from the surface to a minimum dew point temperature of ~−5 C at ~600 hPa. Above this layer, NUCAPS tracks the RAOB profile fairly well. The nighttime conditions show no wind shear until ~500 hPa. During the daytime, the RAOBs indicate a weak wind shear above the boundary layer inversion, changing from easterly near the surface to light and variable and then westerly above 600 hPa. The lack of wind shear near the boundary layer suggests that this region is well-mixed with little or no possibility of dust. The wind fields from the RAOB indicate that the inversion layers for both wind shear (450–700 hPa) and temperature and dew point temperature inversion levels (~800 hPa) are at relatively high levels, further confirming an environment that would lack any dust concentrations.

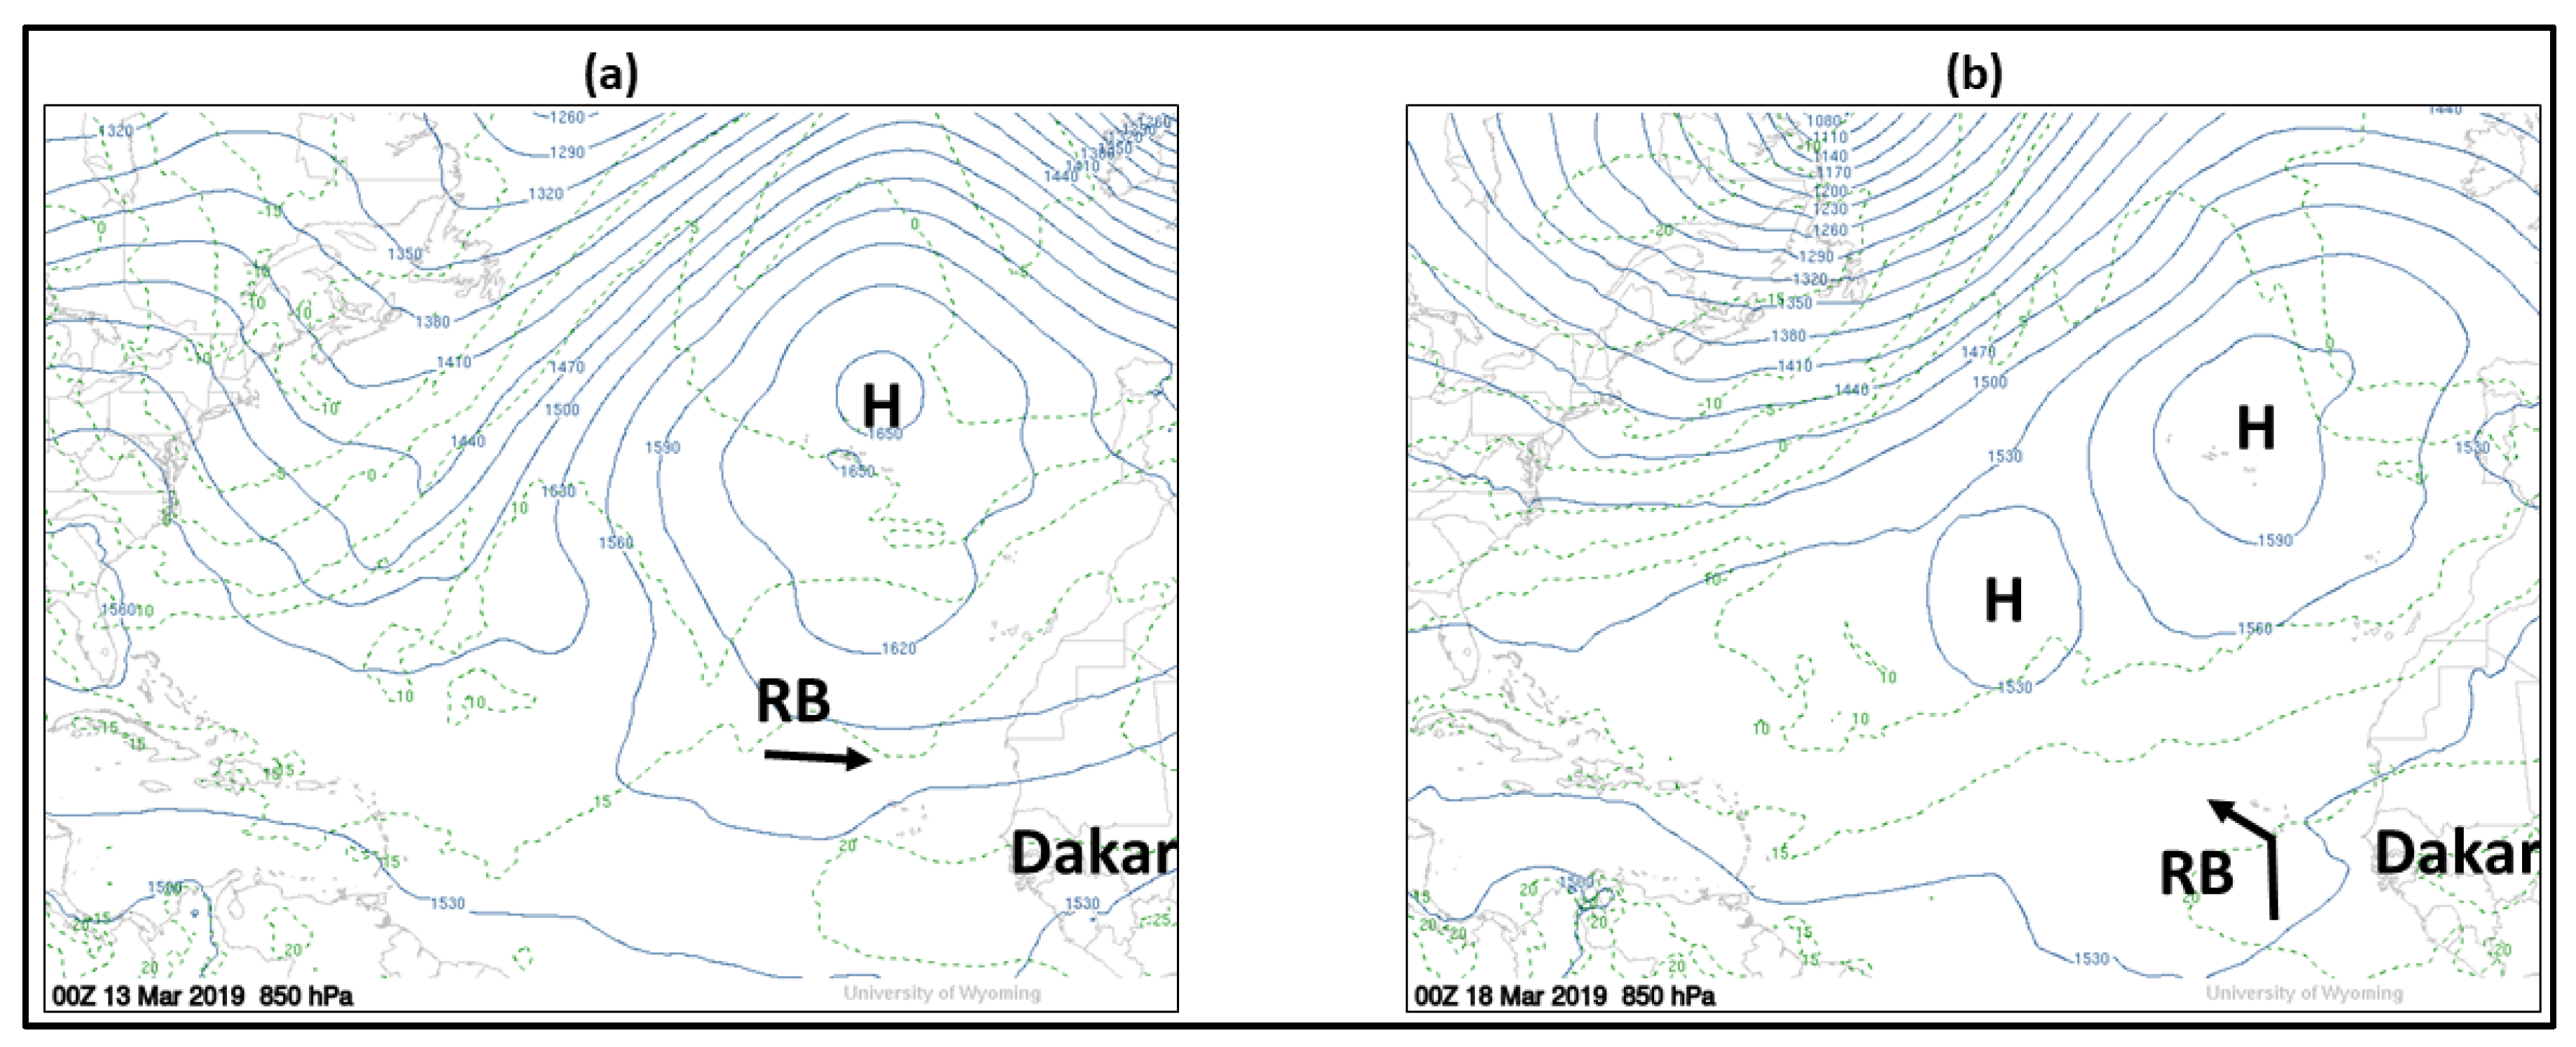
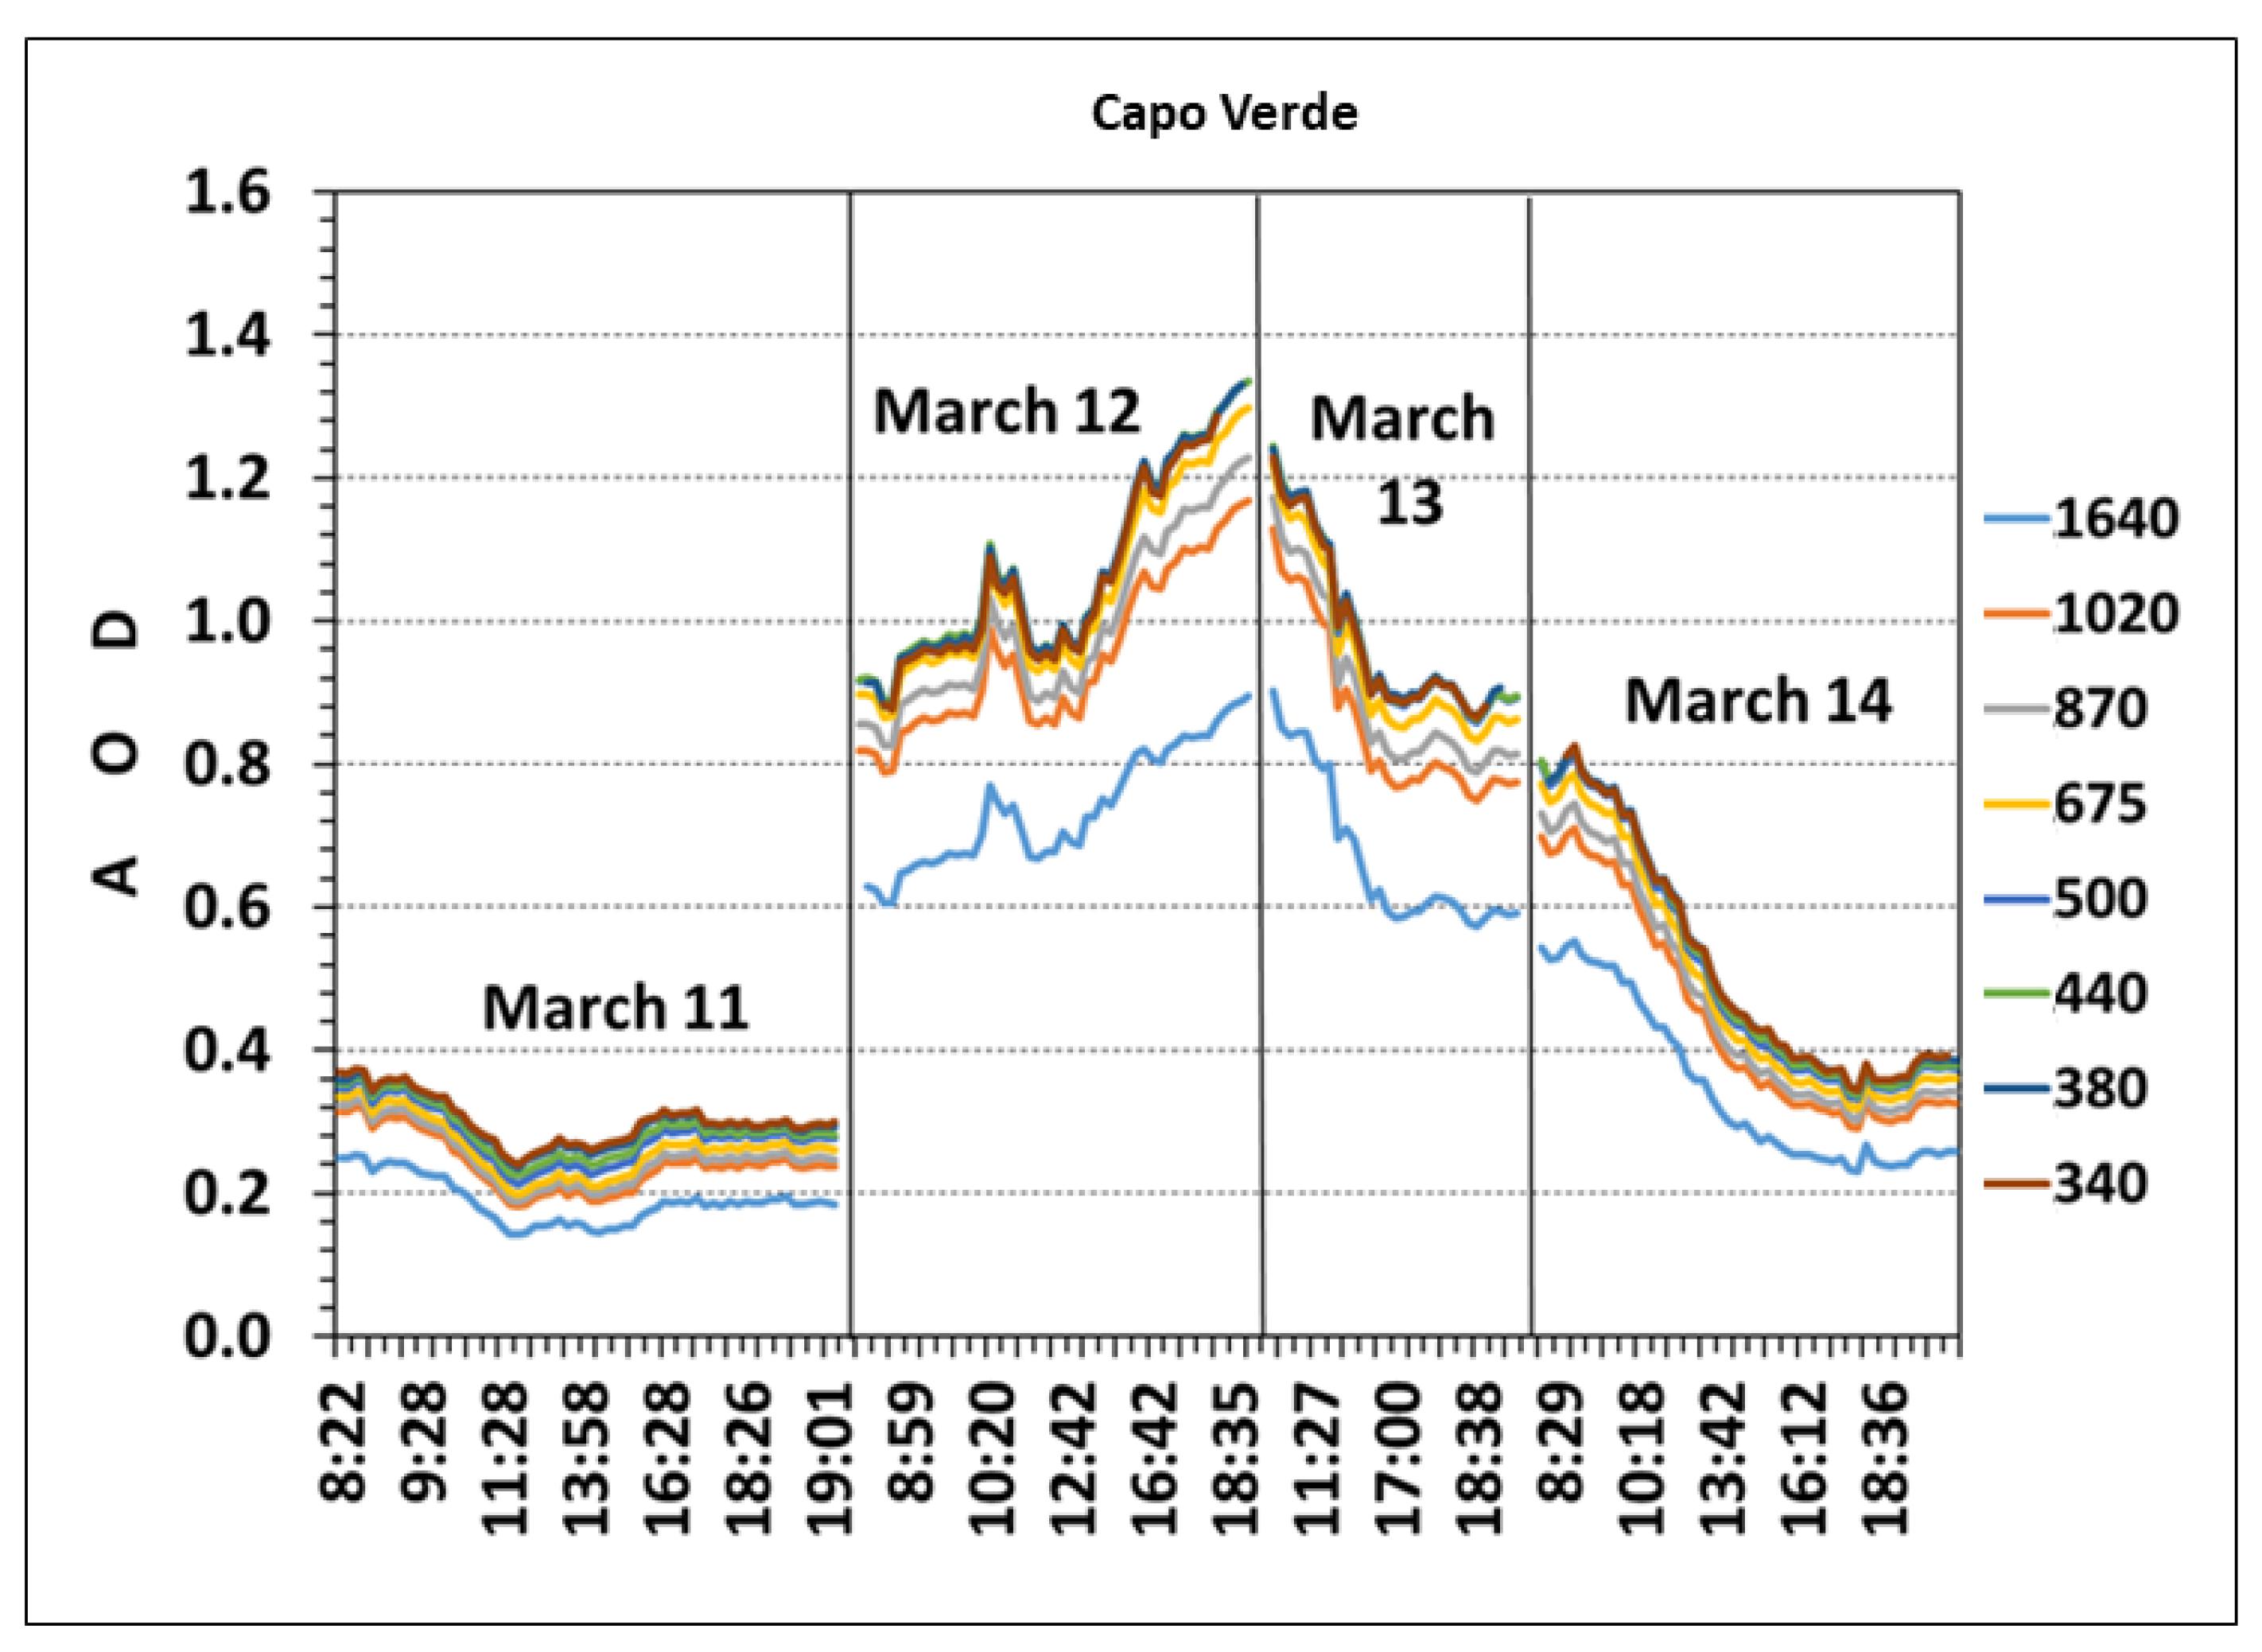
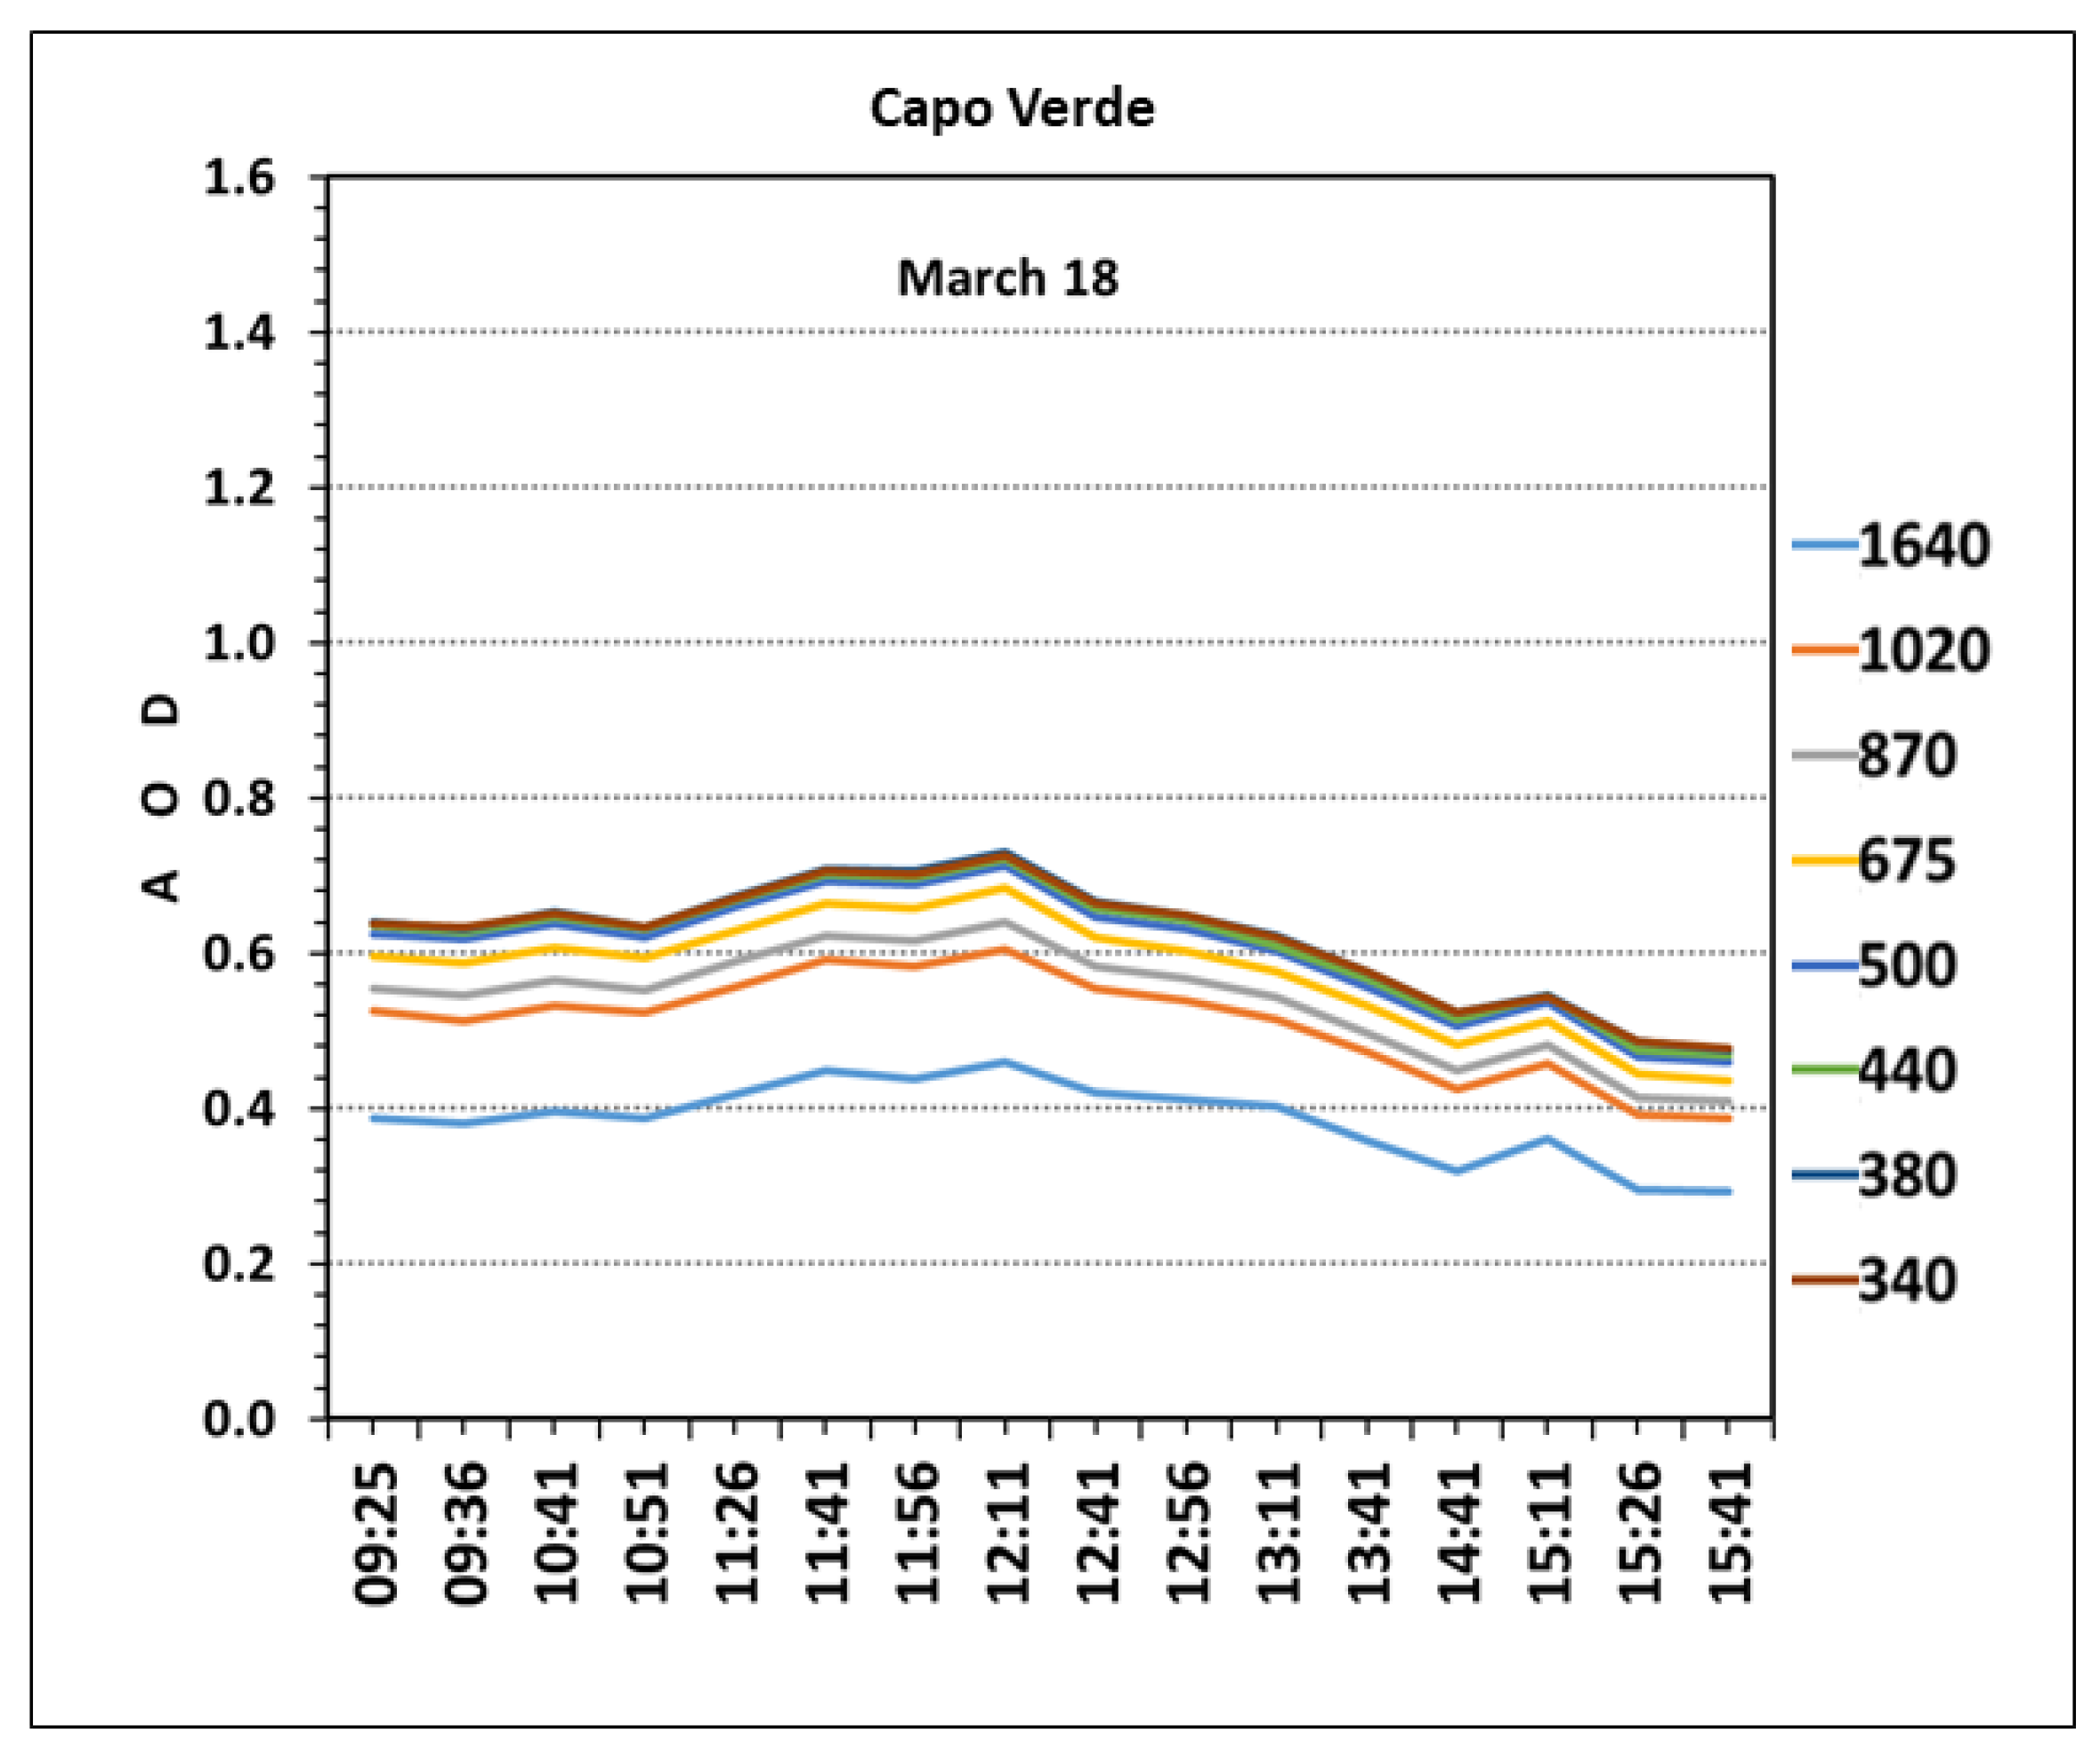
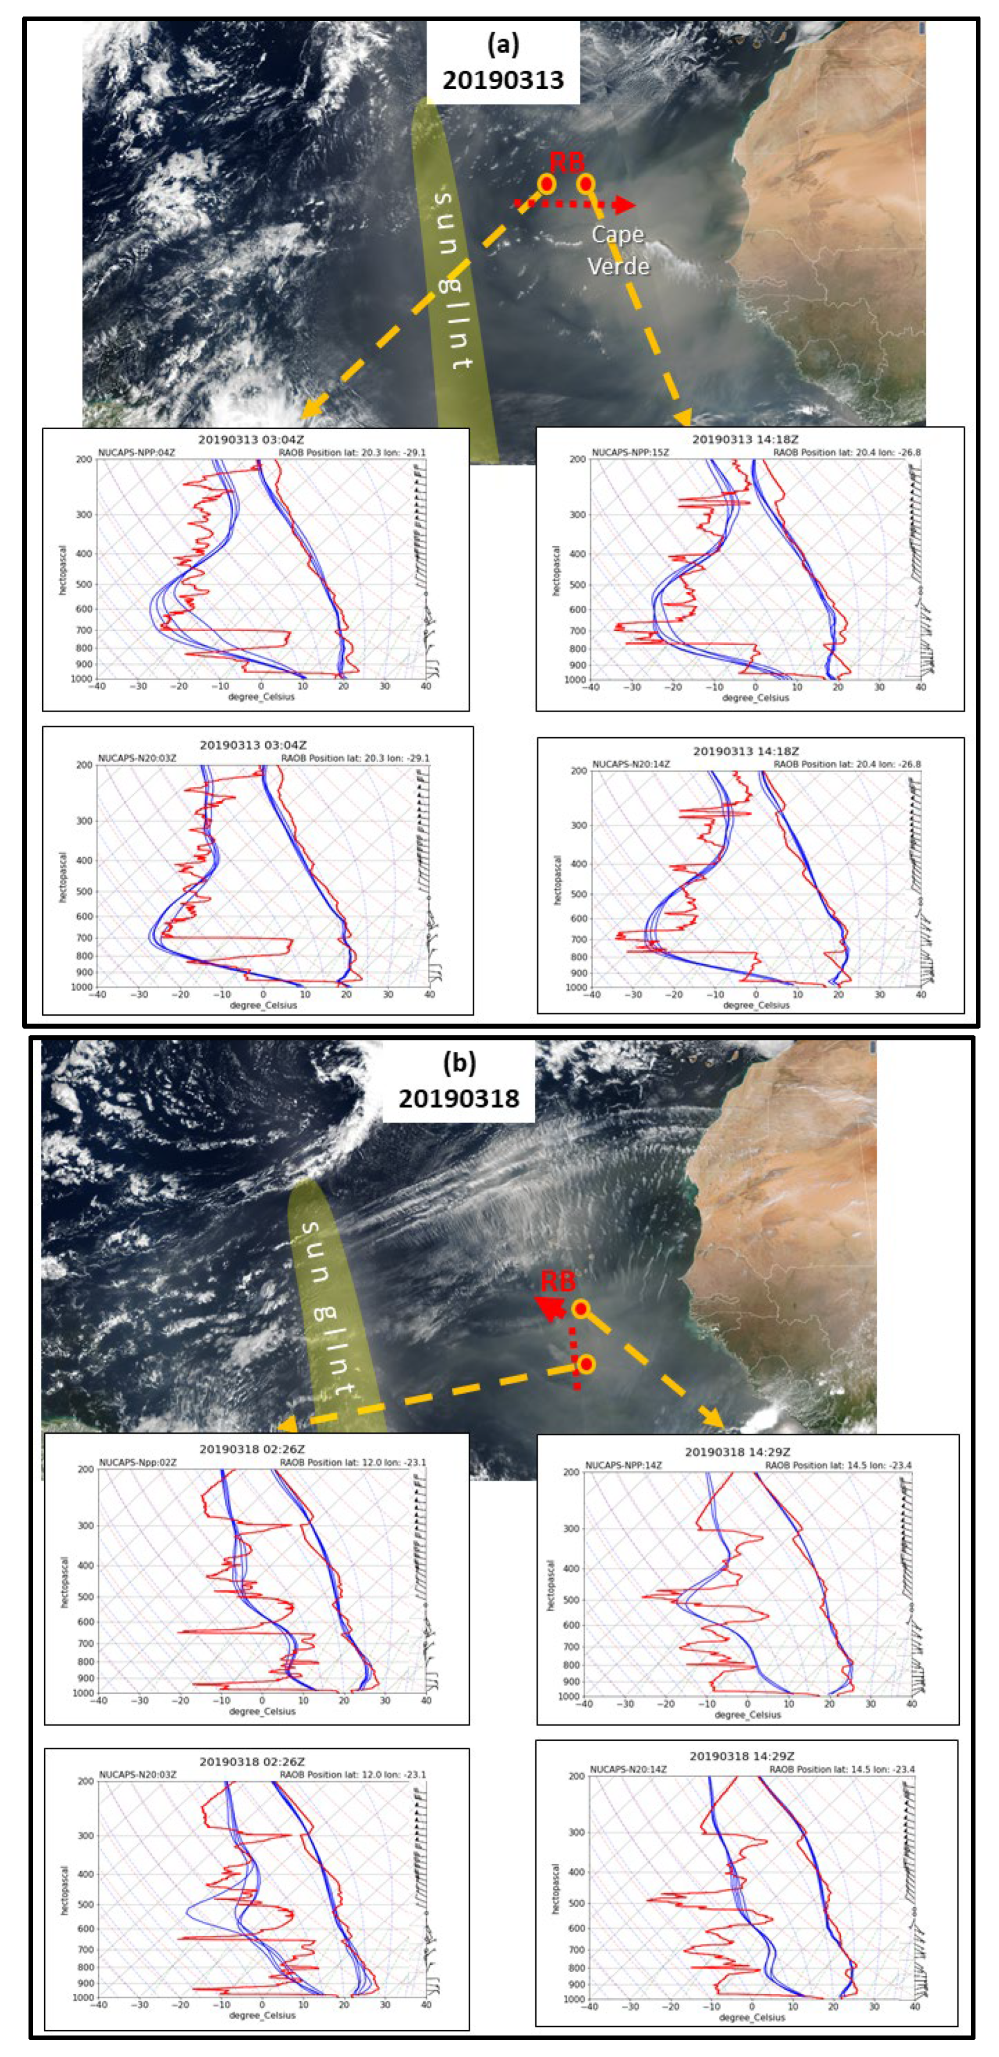
3.1.2. In-Dust Profiling: 13 March and 18 March

The 850 hPa synoptic analysis charts in Figure 5 describe the path of the Ron Brown and associated RAOB launches for both the 13th and 18th. In both cases, the Ron Brown and associated rawinsonde launches were situated underneath a strong high-pressure field. On 13 March (Figure 5a), the contour pattern over the eastward path of the Ron Brown seemed to provide an environment of westerly transport of Saharan dust. On 18 March (Figure 5b), there was little or no circulation near the Ron Brown.
During 12–13 March, AERONET AOD observations confirm the presence of a significant Saharan dust outbreak over Cape Verde, near the location of the Ron Brown (Figure 6). As shown, AOD values at the 0.34 µm wavelength peaked at >1.35 sometime during the evening of the 12th into the late morning on the 13th. These dust concentrations produced the largest AOD spike for the entire month. The 13th appears to provide ideal conditions to study how NUCAPS profiles Saharan dust, even outside of the more active boreal summer season.
On 18 March, the AERONET AOD revealed a significantly weaker Saharan dust case (Figure 7), although its values during the local early and middle afternoon time period (11–13:00 UTC) are still well above the threshold for significant dust. Unlike 13 March, Saharan dust concentrations did not come across Cape Verde as a wave-like episode but rather as a continuous entity.
Dust episodes are associated with lower boundary layers, which can be seen from satellite imagery. Figure 8 presents nighttime CALIPSO-CALIOP backscatter aerosol profiles on 13 and 18 March, featuring the vertical extent of the Saharan dust. As shown in the upper panels, the orbital overpasses along with the black annotations are very similar in location. For Figure 8a,b, the short vertical black line segments describe the extent of the corresponding 2D backscatter images (bottom panels) along the NW African coast. In Figure 8a, the dust profile for 13 March appears relatively solid throughout the horizontal extent, with dust tops reaching 3 km, as annotated by the black dashed line. In Figure 8b, the dust profile is much weaker and more scattered, with a dust layer capped at or below 3 km. Within this image, there is high-level scattered cloud coverage that exists from 9 km to 14.5 km, obstructing some of the low-level dust. For both days, the dust is surface-based, which is in contrast to the elevated profile in the SAL case that is discussed in Section 3.2.
The CALIOP image on 18 March (Figure 8b) describes the second case of Saharan dust within a rather thick and continuous dust field. In Figure 9b, it was during this day that the Ron Brown traveled north, then turned west. Similar to 13 March, the dew point temperature plots at 14 UTC (right profiles) varied greatly from one NUCAPS profile to the next. Some of this variation may be due to the large dust concentrations that can greatly impact radiance measurements as viewed by satellite [29,30]. The wind field varied between the early morning (04 UTC, right panels) and later early afternoon (15 UTC, left panels). The early morning revealed lighter winds with a wind direction shift at ~700 hPa. On the other hand, the wind pattern during the afternoon was similar to the other non-dust and dust cases, with a relatively high layer. In contrast, during the boreal summer, the stronger dust events associated with SAL are more northeasterly and contain a low-level easterly–northeasterly jet. This is discussed in the next section.
Figure 9 displays the true color and skew-T combination similar to Figure 4, but for dust conditions on 13 and 18 March. For 13 March (Figure 9a), the daytime true color image depicts the Ron Brown track as traversing from light to thicker dust concentrations. Corresponding RAOB profiles show a much sharper and lower boundary layer top at ~950 hPa (compared to the previous non-dust cases) with several strong drying layers and two dew point temperature minima near the surface and then between 780 and 650 hPa. In viewing the CALIPSO profiles in Figure 8, the dust appears to be contained below the 700 hPa level, which compares well with the nighttime RAOB soundings. Between the nighttime and daytime profiles in Figure 9a, it appears that the moist nighttime layer between 850 and 700 hPa lowered to the boundary layer during the daytime; this suggests that there was descending air due to the strong presence of the high surface pressure as shown in Figure 5a. As in the previous cases, the NUCAPS temperature profiles approximate RAOBs soundings fairly well. Within the NUCAPS dew point temperature profile, NUCAPS (SNPP and NOAA-20) missed the surface moisture that the RAOB reveals. This might be attributed to the dust concentrations that impact the radiances of the IR and microwave sounders [29,30]. However, NUCAPS closely matches the RAOB within the driest layer (minimum dew point temperature) at ~700 hPa. As in the non-dust cases, the RAOB-observed wind shear was at a fairly high level between 550 and 600 hPa, suggesting that there was no SAL activity during this time.
The case on 18 March (Figure 9b) describes a second dust case. The true color image with annotations indicates that the Ron Brown was heading north, then turned west into a weaker dust field than in the previous case. Similar to 13 March, the dew point temperature at the surface was somewhat different from the RAOB, suggesting that dust was impacting the radiance measurements [29,30]. Overall, at night (02 UTC), the nighttime (02 UTC) NUCAPS dew point temperature profiles tracked the RAOB fairly well; there were a number of inversions revealed by the RAOB below 600 hPa, yet NUCAPS (particularly SNPP) captured the undulations. During the daytime (14 UTC), the NOAA-20 NUCAPS dew point temperatures were significantly more moist (warmer temperatures) than the RAOB with the exception of a significantly more moist surface level. Throughout the vertical profiles, NUCAPS appeared out of alignment with the RAOB; the SNPP NUCAPS profile was slightly better, as it captured the dry layer at ~500 hPa. The wind field varied between light and variable easterly at the low levels (left panel) to a stronger easterly flow during the daytime. In contrast, during the boreal summer, the stronger dust events associated with SAL are more northeasterly and contain a low-level easterly–northeasterly jet. This is discussed in the next section.

3.1.3. Summary

Despite the variations between NUCAPS and RAOBs described above, NUCAPS does show skill in distinguishing the non-dust environment shown in Figure 4 from the dusty environment shown in Figure 9. Within the non-dust cases, the NUCAPS dew point temperature profiles reach the driest layer between 600 and 550 hPa. In contrast, the dew point temperature profiles reach the driest layer at lower levels (700–650 hPa). As discussed, the wind profiles do not support Saharan dust in these early spring conditions. During strong dust-laden SAL events during the boreal summer, temperature inversions and wind shear regions are typically correlated and also confined within the elevated SAL. This is discussed in the next section.

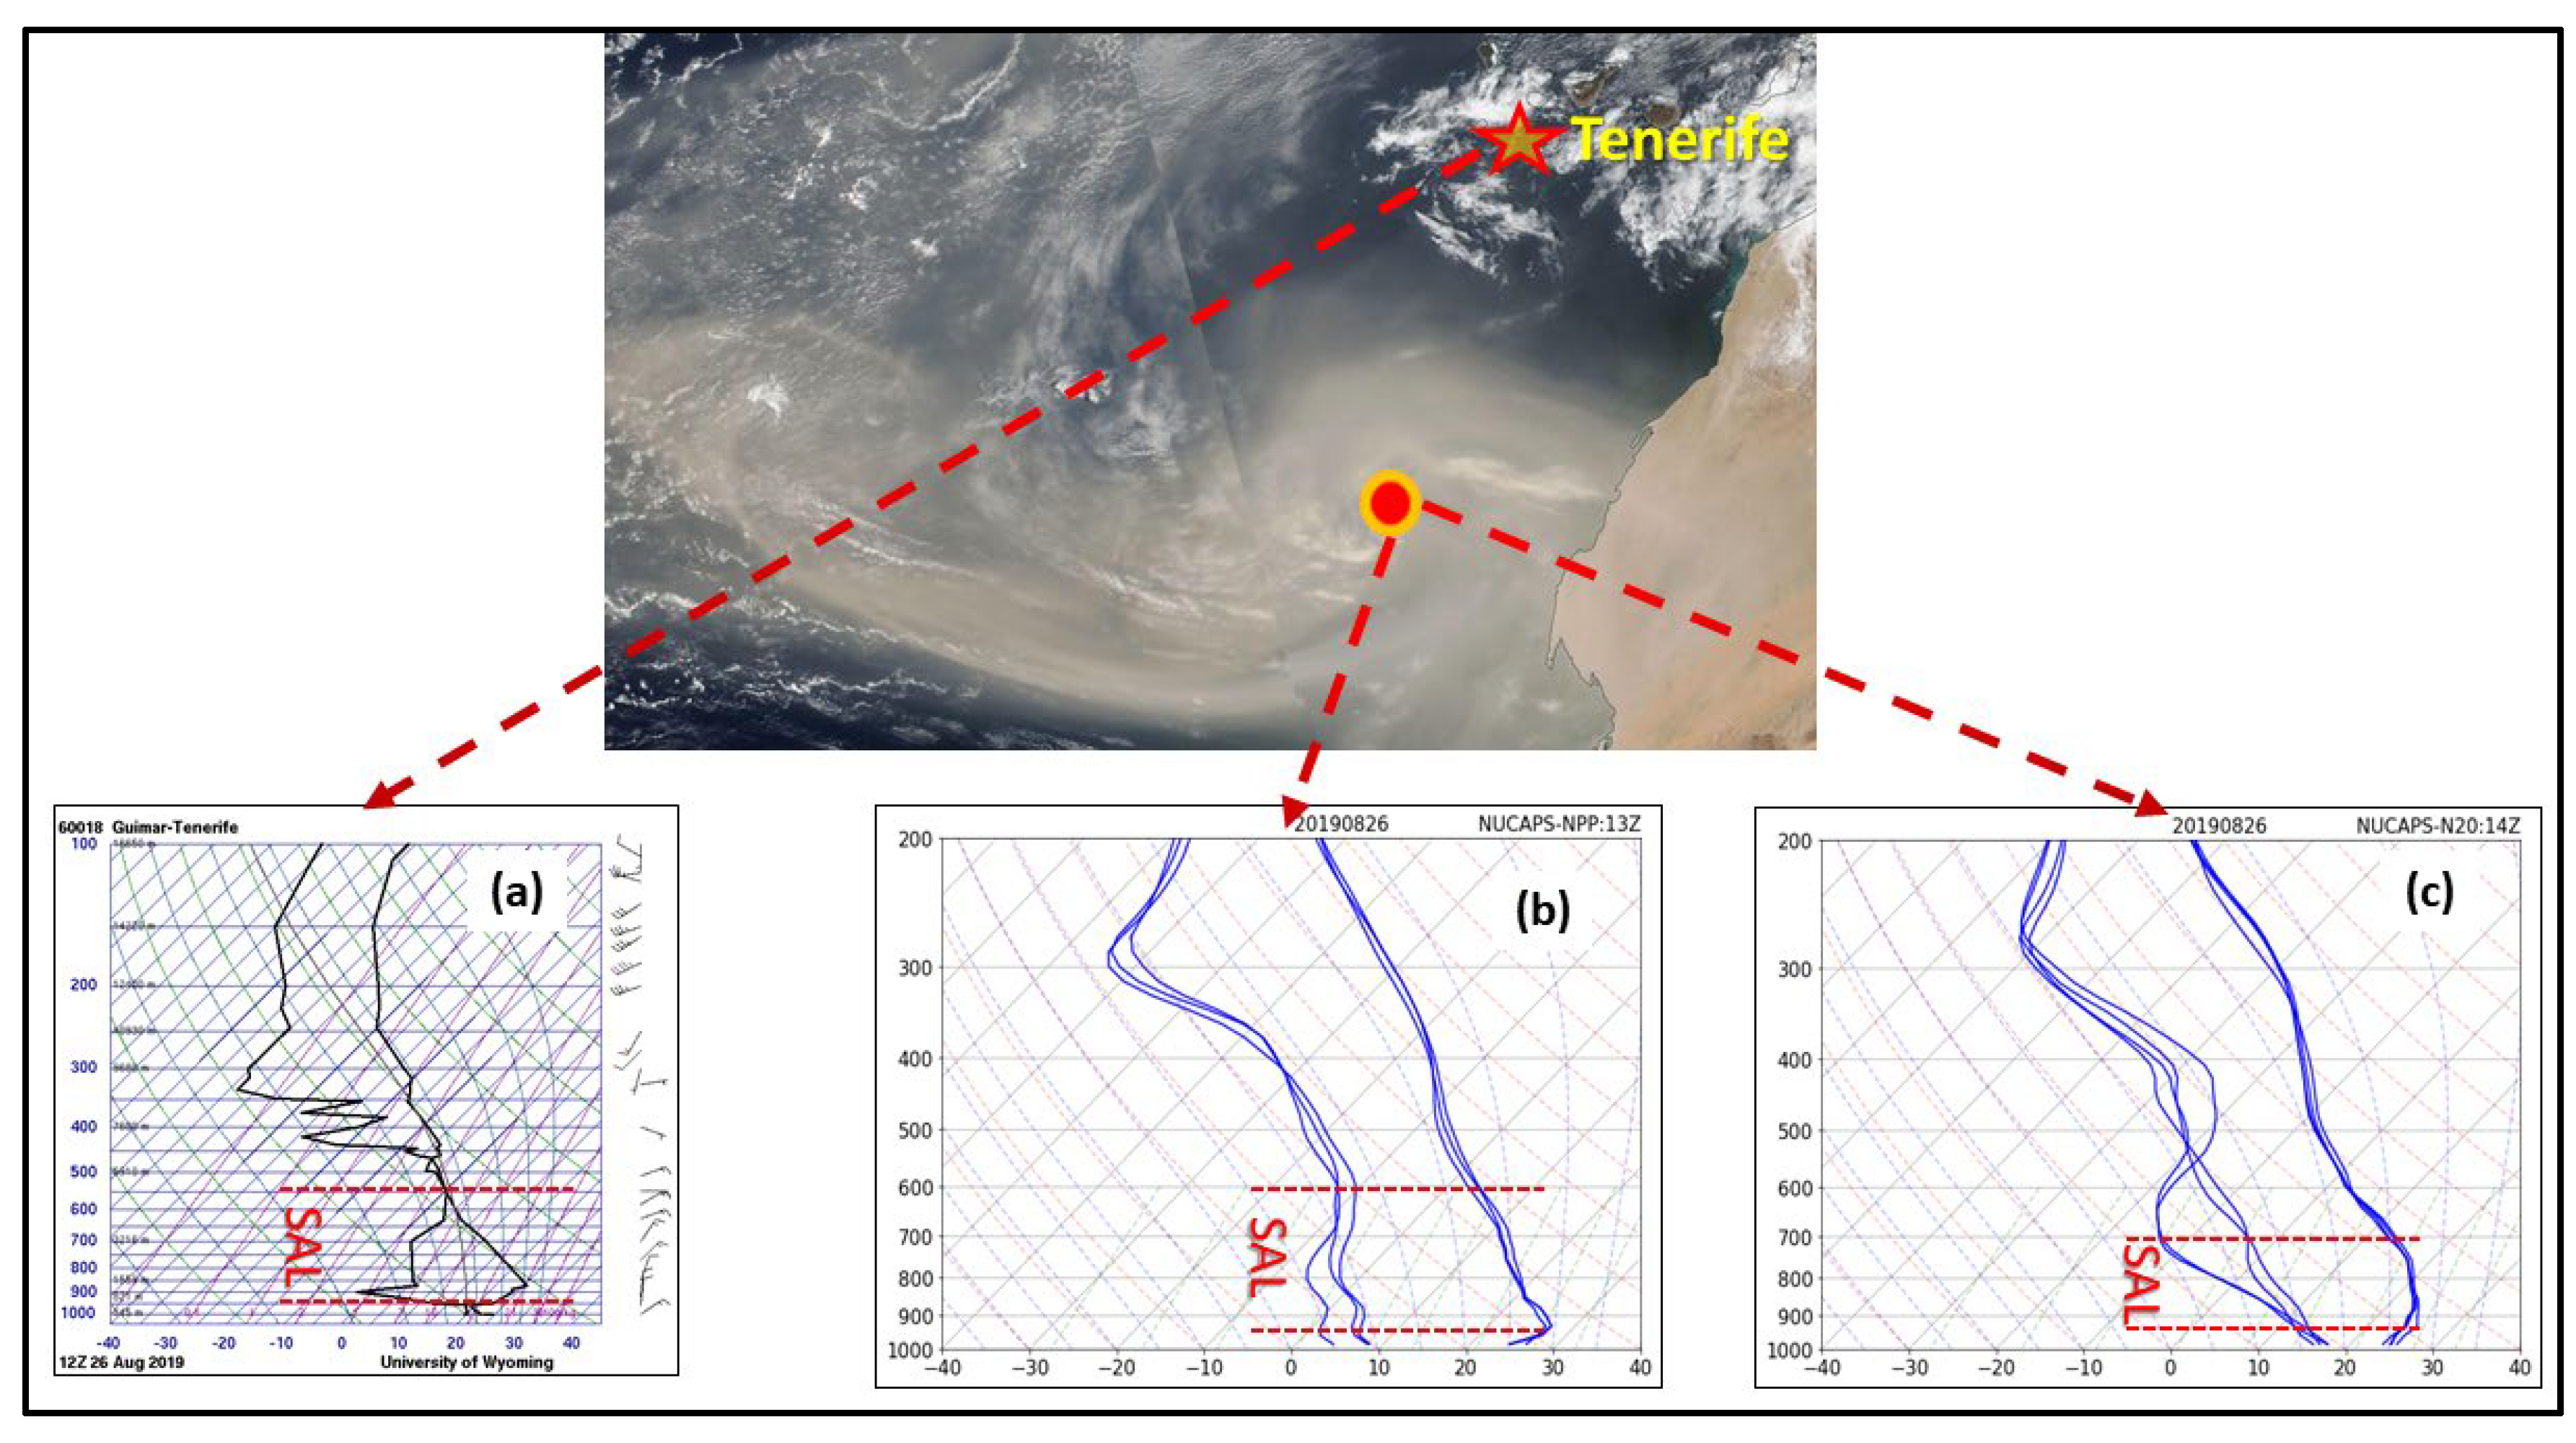
3.2. Applying NUCAPS to Profile Strong SAL Outflow

In addition to evaluating NUCAPS skill during the AEROSE campaign, we also wished to explore the ability of NUCAPS to profile the classic SAL air mass with heavy Saharan dust concentrations; these events provide strong environmental signatures of the hot and dry SAL air mass and the radiative properties associated with the heavy dust concentrations. Figure 10 provides both the 850 hPa synoptic map and the true color image of heavy dust outflow into the Atlantic Ocean with an associated strong SAL development into the Atlantic Ocean from Northwest Africa on 25 August 2019. The high-pressure system, typical during the boreal summer, extends throughout the entire NTAB. The warm tongue extends westward from the NW African coast out to the extent of the SAL region. The SAL and dust eventually propagated further westward into the Greater Caribbean Islands, impacting the populace with heavy dust and associated hazardous air quality. In this case, there were no other nearby sources of available soundings. In situations such as this, weather forecasters situated in the Caribbean Islands would rely on satellite observations, such as NUCAPS.
The 25 August CALIPSO-CALIOP product set (Figure 11) shows a similar orbital path across the offshore region of NW Africa, similar to the 13 March case in Figure 8a. In the image, the Saharan dust is bracketed within the short vertical black lines. There are several differences in the dust structure between 25 August and 13 March. On 25 August, the dust layer was elevated within a layer between 2 km (or 800 hPa) and ~5 km or 500 hPa; on 13 March, the dust was surface based with the tops of the dust layer at only 3.0 km or 700 hPa. The backscatter intensities on 25 August reveal that dust concentrations are more heavily concentrated.
Figure 12 presents skew-T profiles in Figure 12a Tenerife rawinsonde station at 12 UTC, Figure 12b SNPP NUCAPS at ~13 UTC, and Figure 12c NOAA-20 NUCAPS at ~14 UTC. In Figure 12a, the Tenerife radiosonde shows well-defined inversion layers that define the dust-laden SAL layer (marked by red dashed lines). In all three skew-T plots, the lower inversion layer is situated very close to the surface; the high resolution of the Tenerife RAOB shows a much sharper boundary. The red dashed lines indicate the lower and upper bounds of the SAL. The Tenerife skew-T in Figure 12a shows a well-defined SAL layer reaching above 500 hPa; the NUCAPS-determined SAL in Figure 12b,c is much less defined with tops that actually cover a range from 700 to 600 hPa. Regardless of its coarser profile, NUCAPS does show skill in defining the SAL layer. As shown, the temperature and dew point temperature profiles indicate a very dry environment from the surface upward toward ~700 hPa. This might be due to a shallow maritime layer between 1000 hPa and 900 hPa for both NUCAPS plots. The SNPP and NOAA-20 NUCAPS dew point temperature plots in Figure 12b,c, respectively, are fairly similar.
Since this case is outside of the AEROSE campaign, the rawinsonde site “Tenerife” was provided, which profiled a similar air mass regime within the thickest portion of the dust region. We selected the 12Z RAOB near Tenerife, the Canary Islands, which was ~300 km northwest of the NUCAPS soundings in Figure 12 and launched 2 h before the Suomi NPP and 3 h before the NOAA-20 overpass. Figure 12 displays the associated Tenerife RAOB site (with a star) that is located 500 km northwest of the NUCAPS plots. Although not collocated with the RAOB, the air mass pattern during this time is fairly similar within both locations. As shown, the Tenerife RAOB exhibited very sharp lower boundary inversions at the 950 hPa level that was capped at ~550 hPa, the top of the SAL layer. Similarly, the NUCAPS plots showed a similar lower level inversion at ~950 hPa, with the top of the layer at ~700 hPa. Although the NUCAPS dew point temperature profile did not take the moisture field up to 550 hPa, it did provide a more reasonable comparison to the RAOB than the early spring cases discussed in Section 3.3.1 and Section 3.1.2.
In summary, the NUCAPS profiles for this strong SAL case react more favorably to radiosonde observations than for the weaker dust fields. Specifically, during strong SAL events, NUCAPS has some skill in defining the SAL and its embedded Saharan dust.

3.3. Validation of NUCAPS during AEROSE

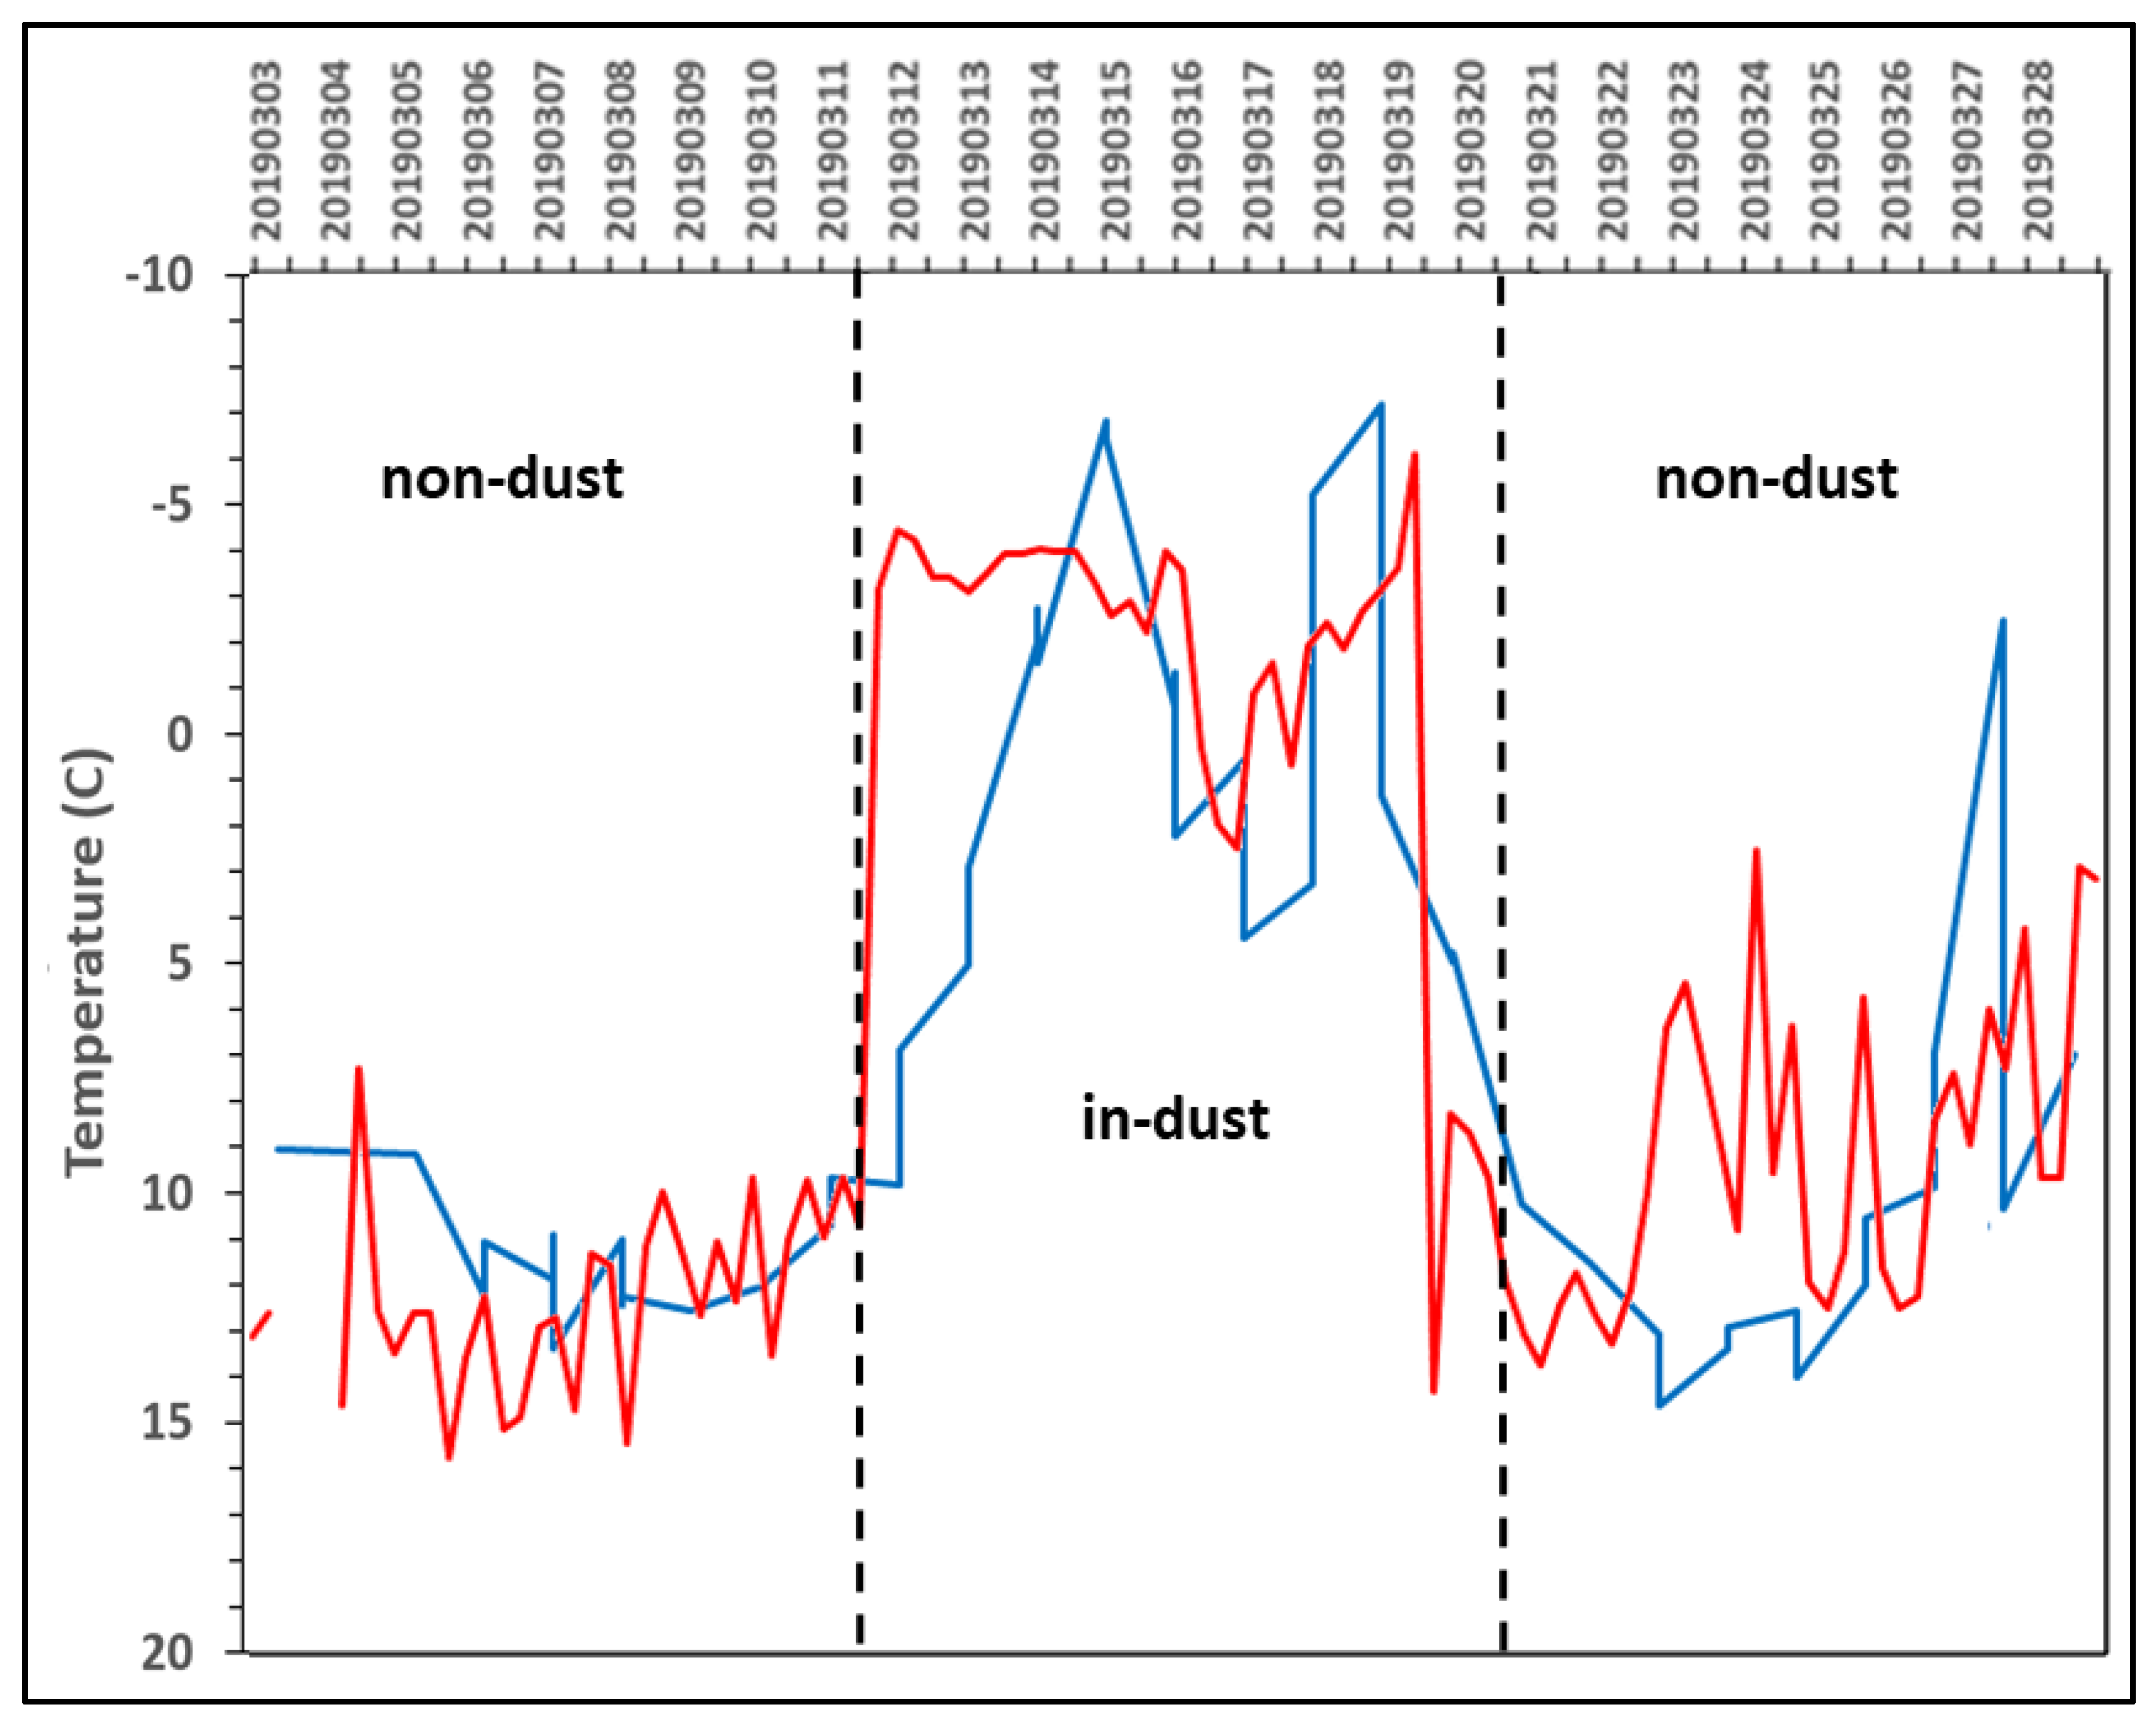
3.3.1. Separating Dust from Non-Dust Conditions

Figure 13 presents a plot of two wavelength AOD profiles as measured by the hand-held Microtops instrument onboard the Ron Brown throughout the entire cruise. The trend is very revealing. There is a marked spike of an aerosol optical thickness (AOT, also AOD) in the 380 and 340 nm wavelengths that occurs between non-dust and dust environments. Therefore, these data provide a confident assessment of the dates during non-dust and dust conditions during AEROSE. As shown, the non-dust regions are between 5–11 March and 22–29 March, while the dust regions are during 13–21 March. Note that the data was unavailable for 3–4 and 29 March. The following section provides the bulk analysis of these legs.

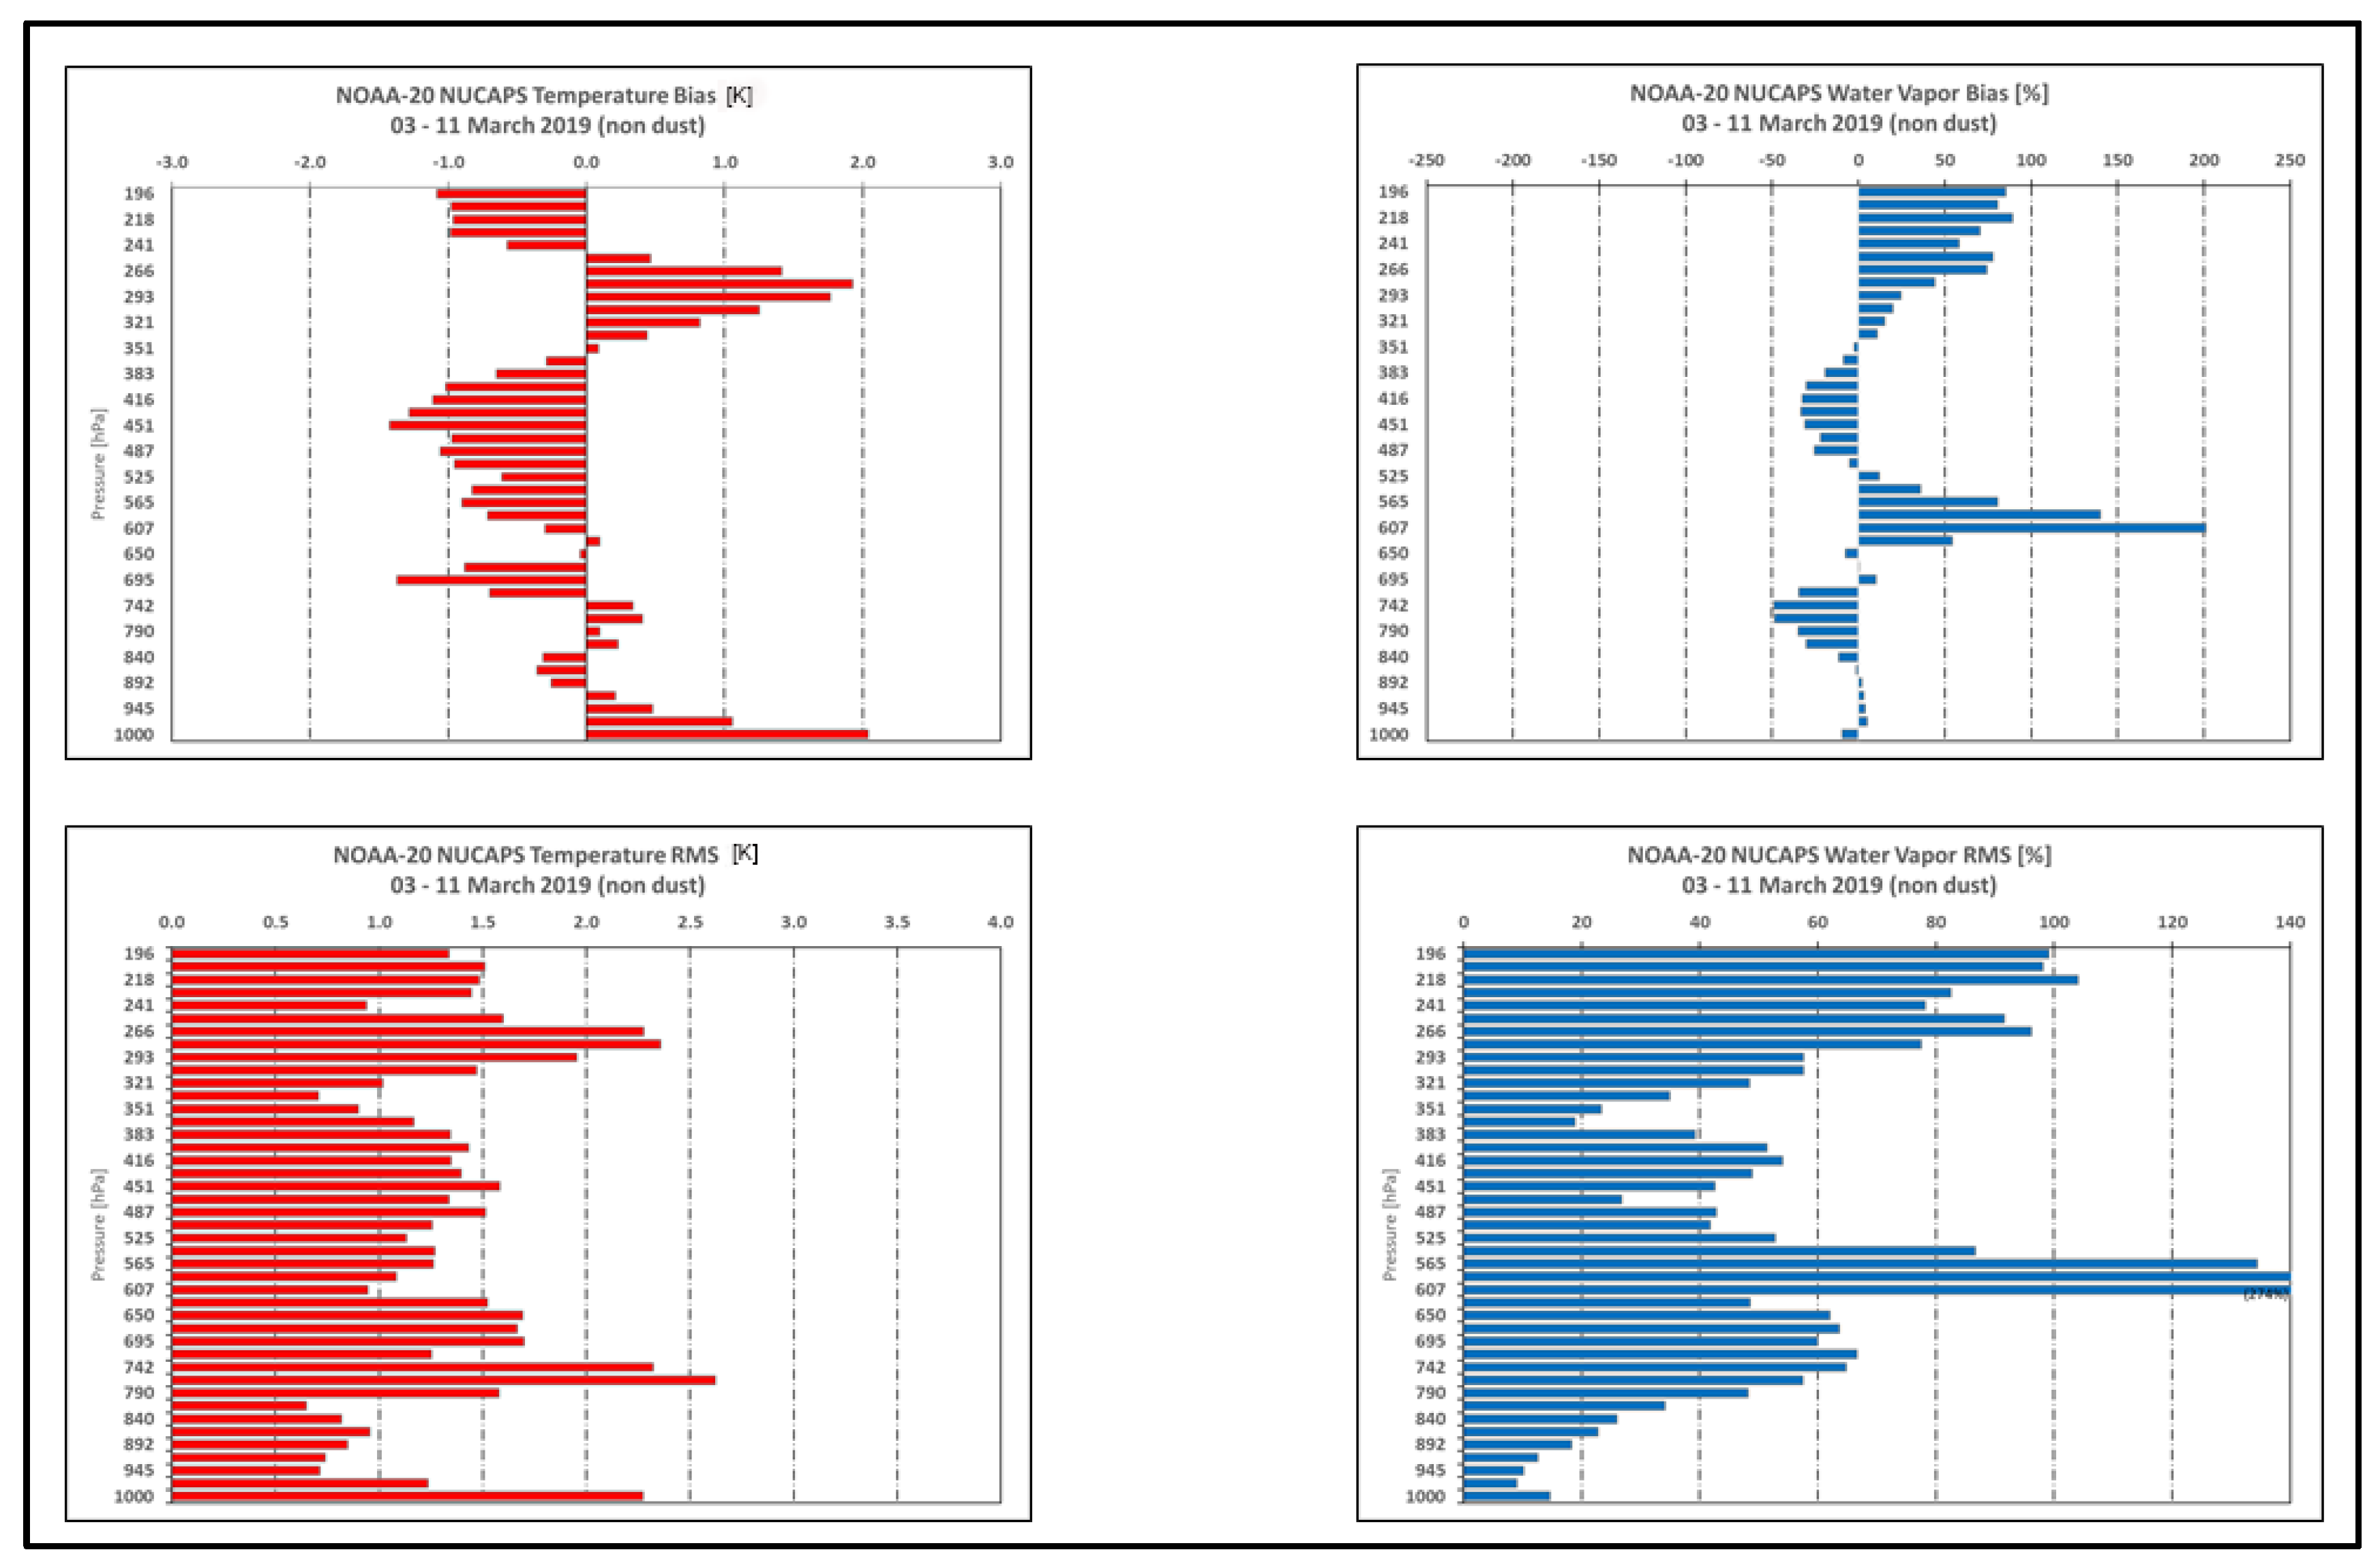
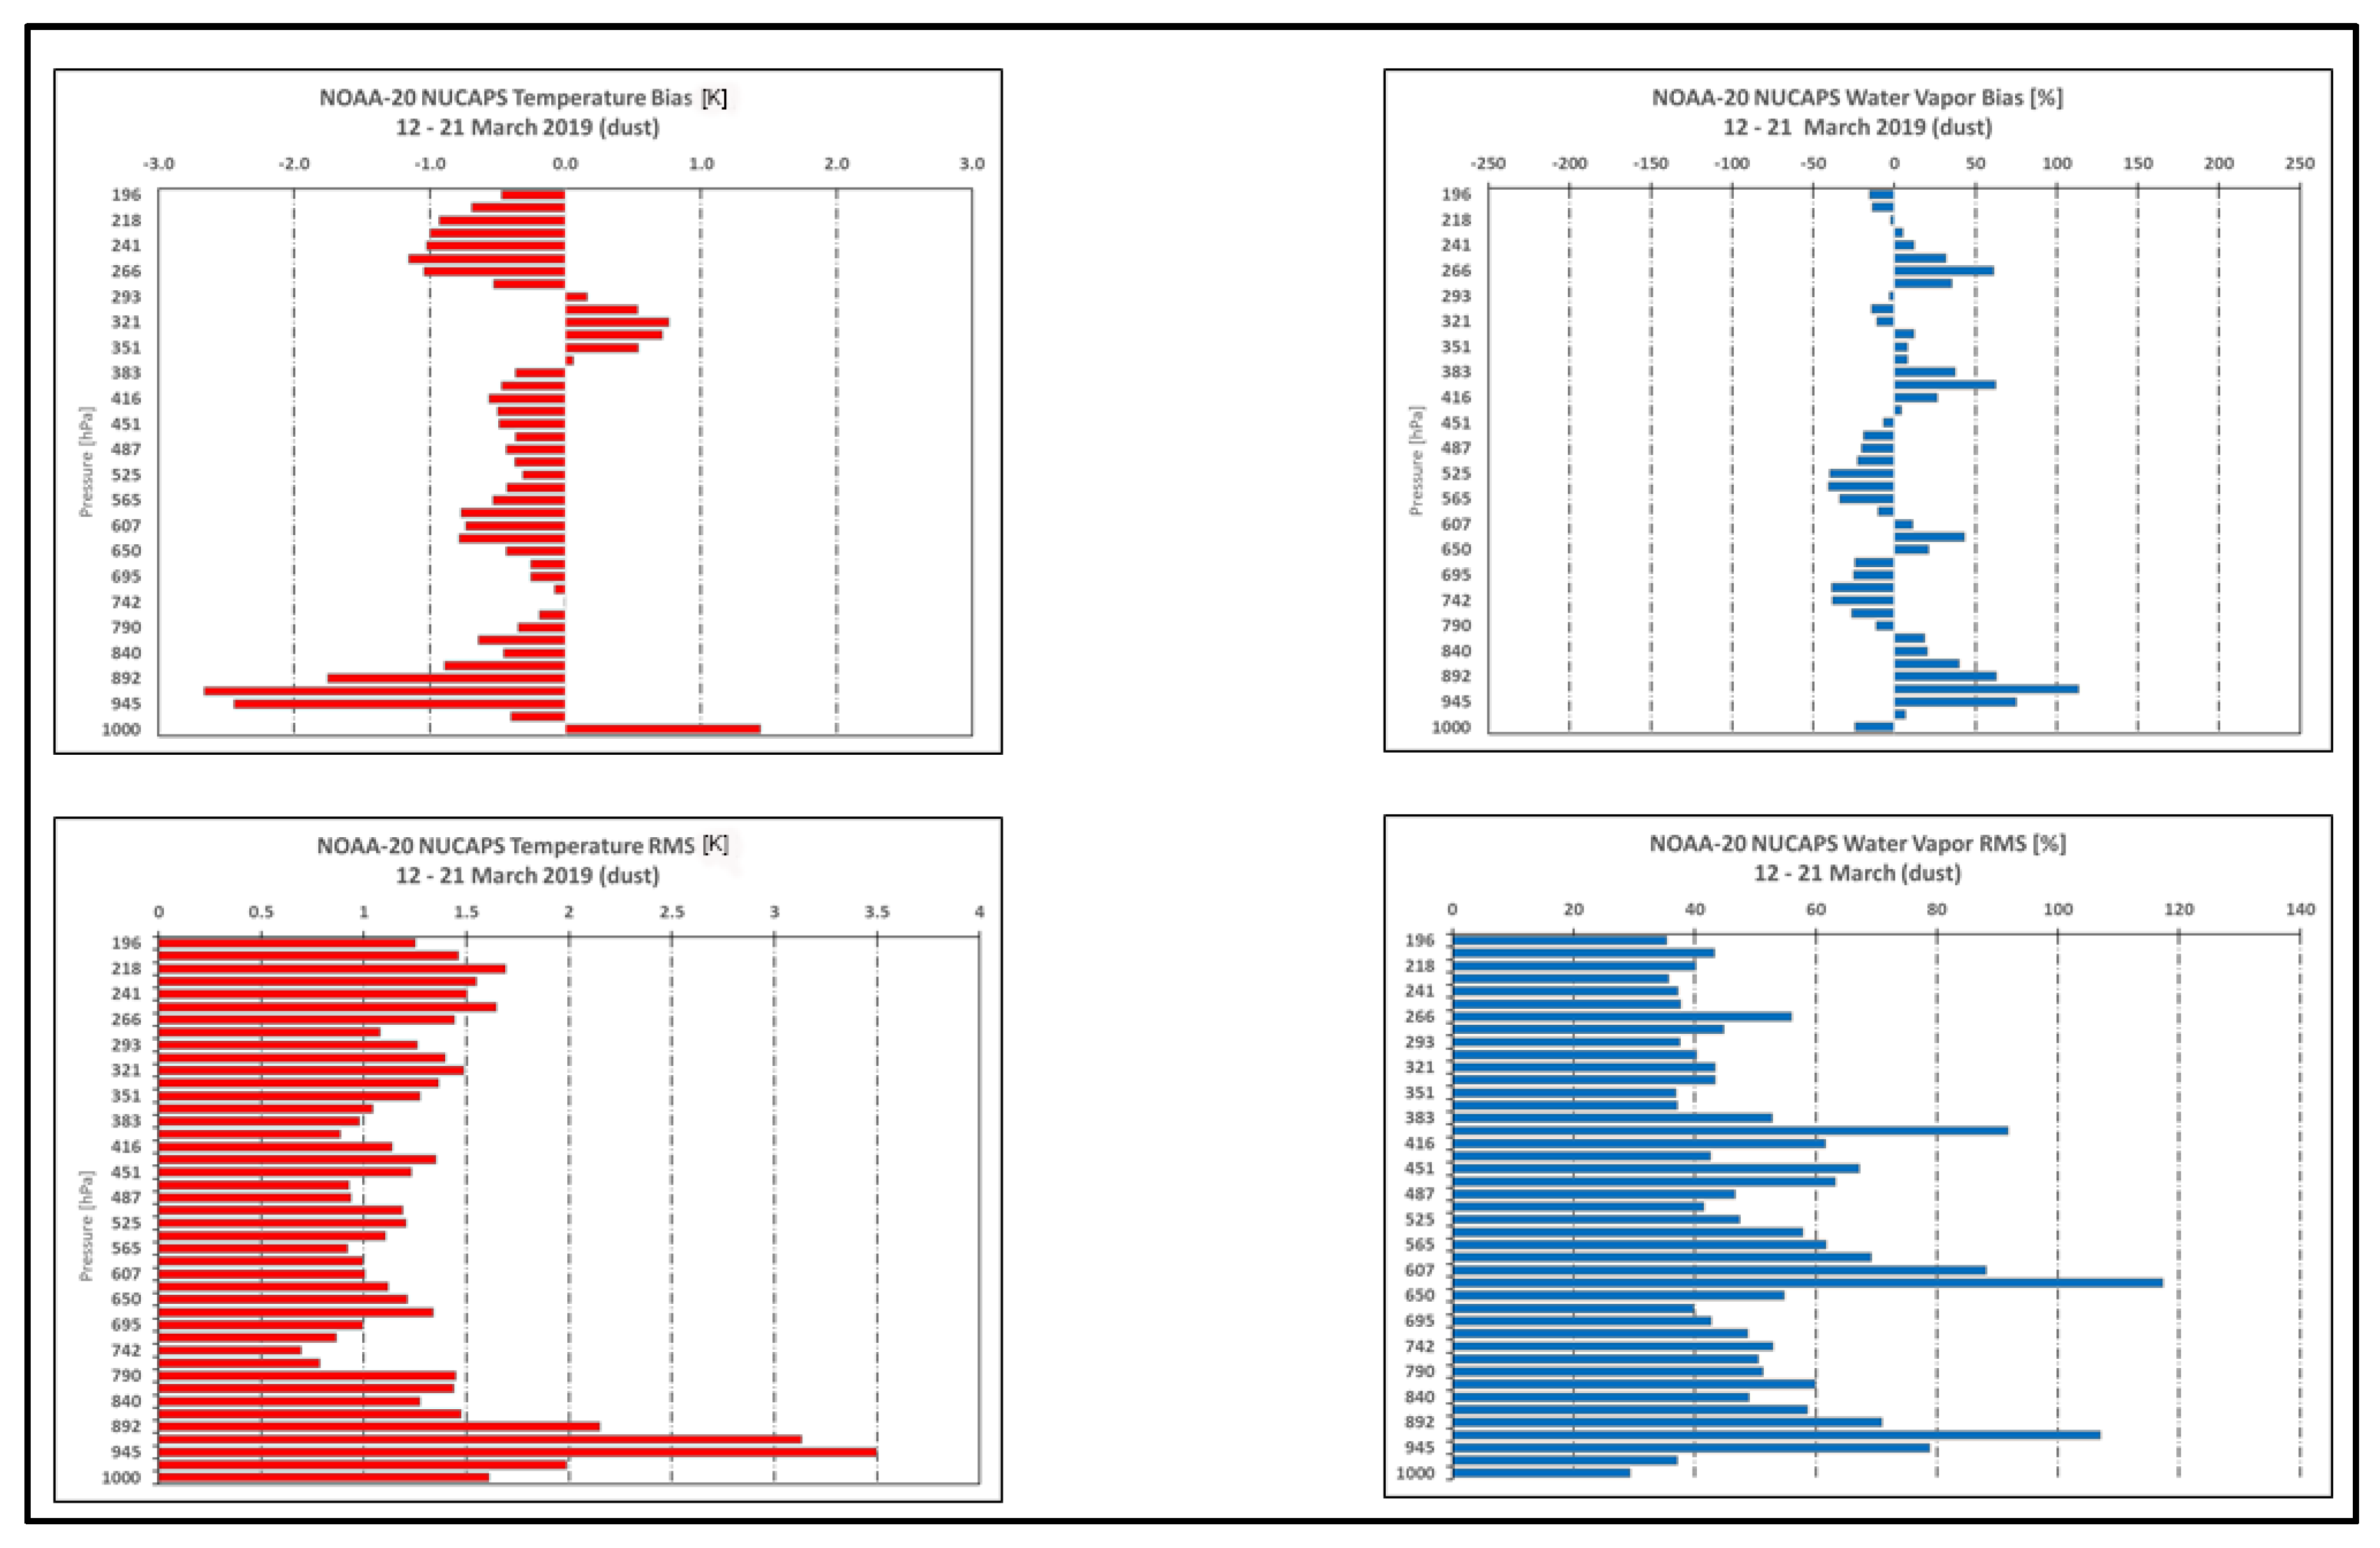
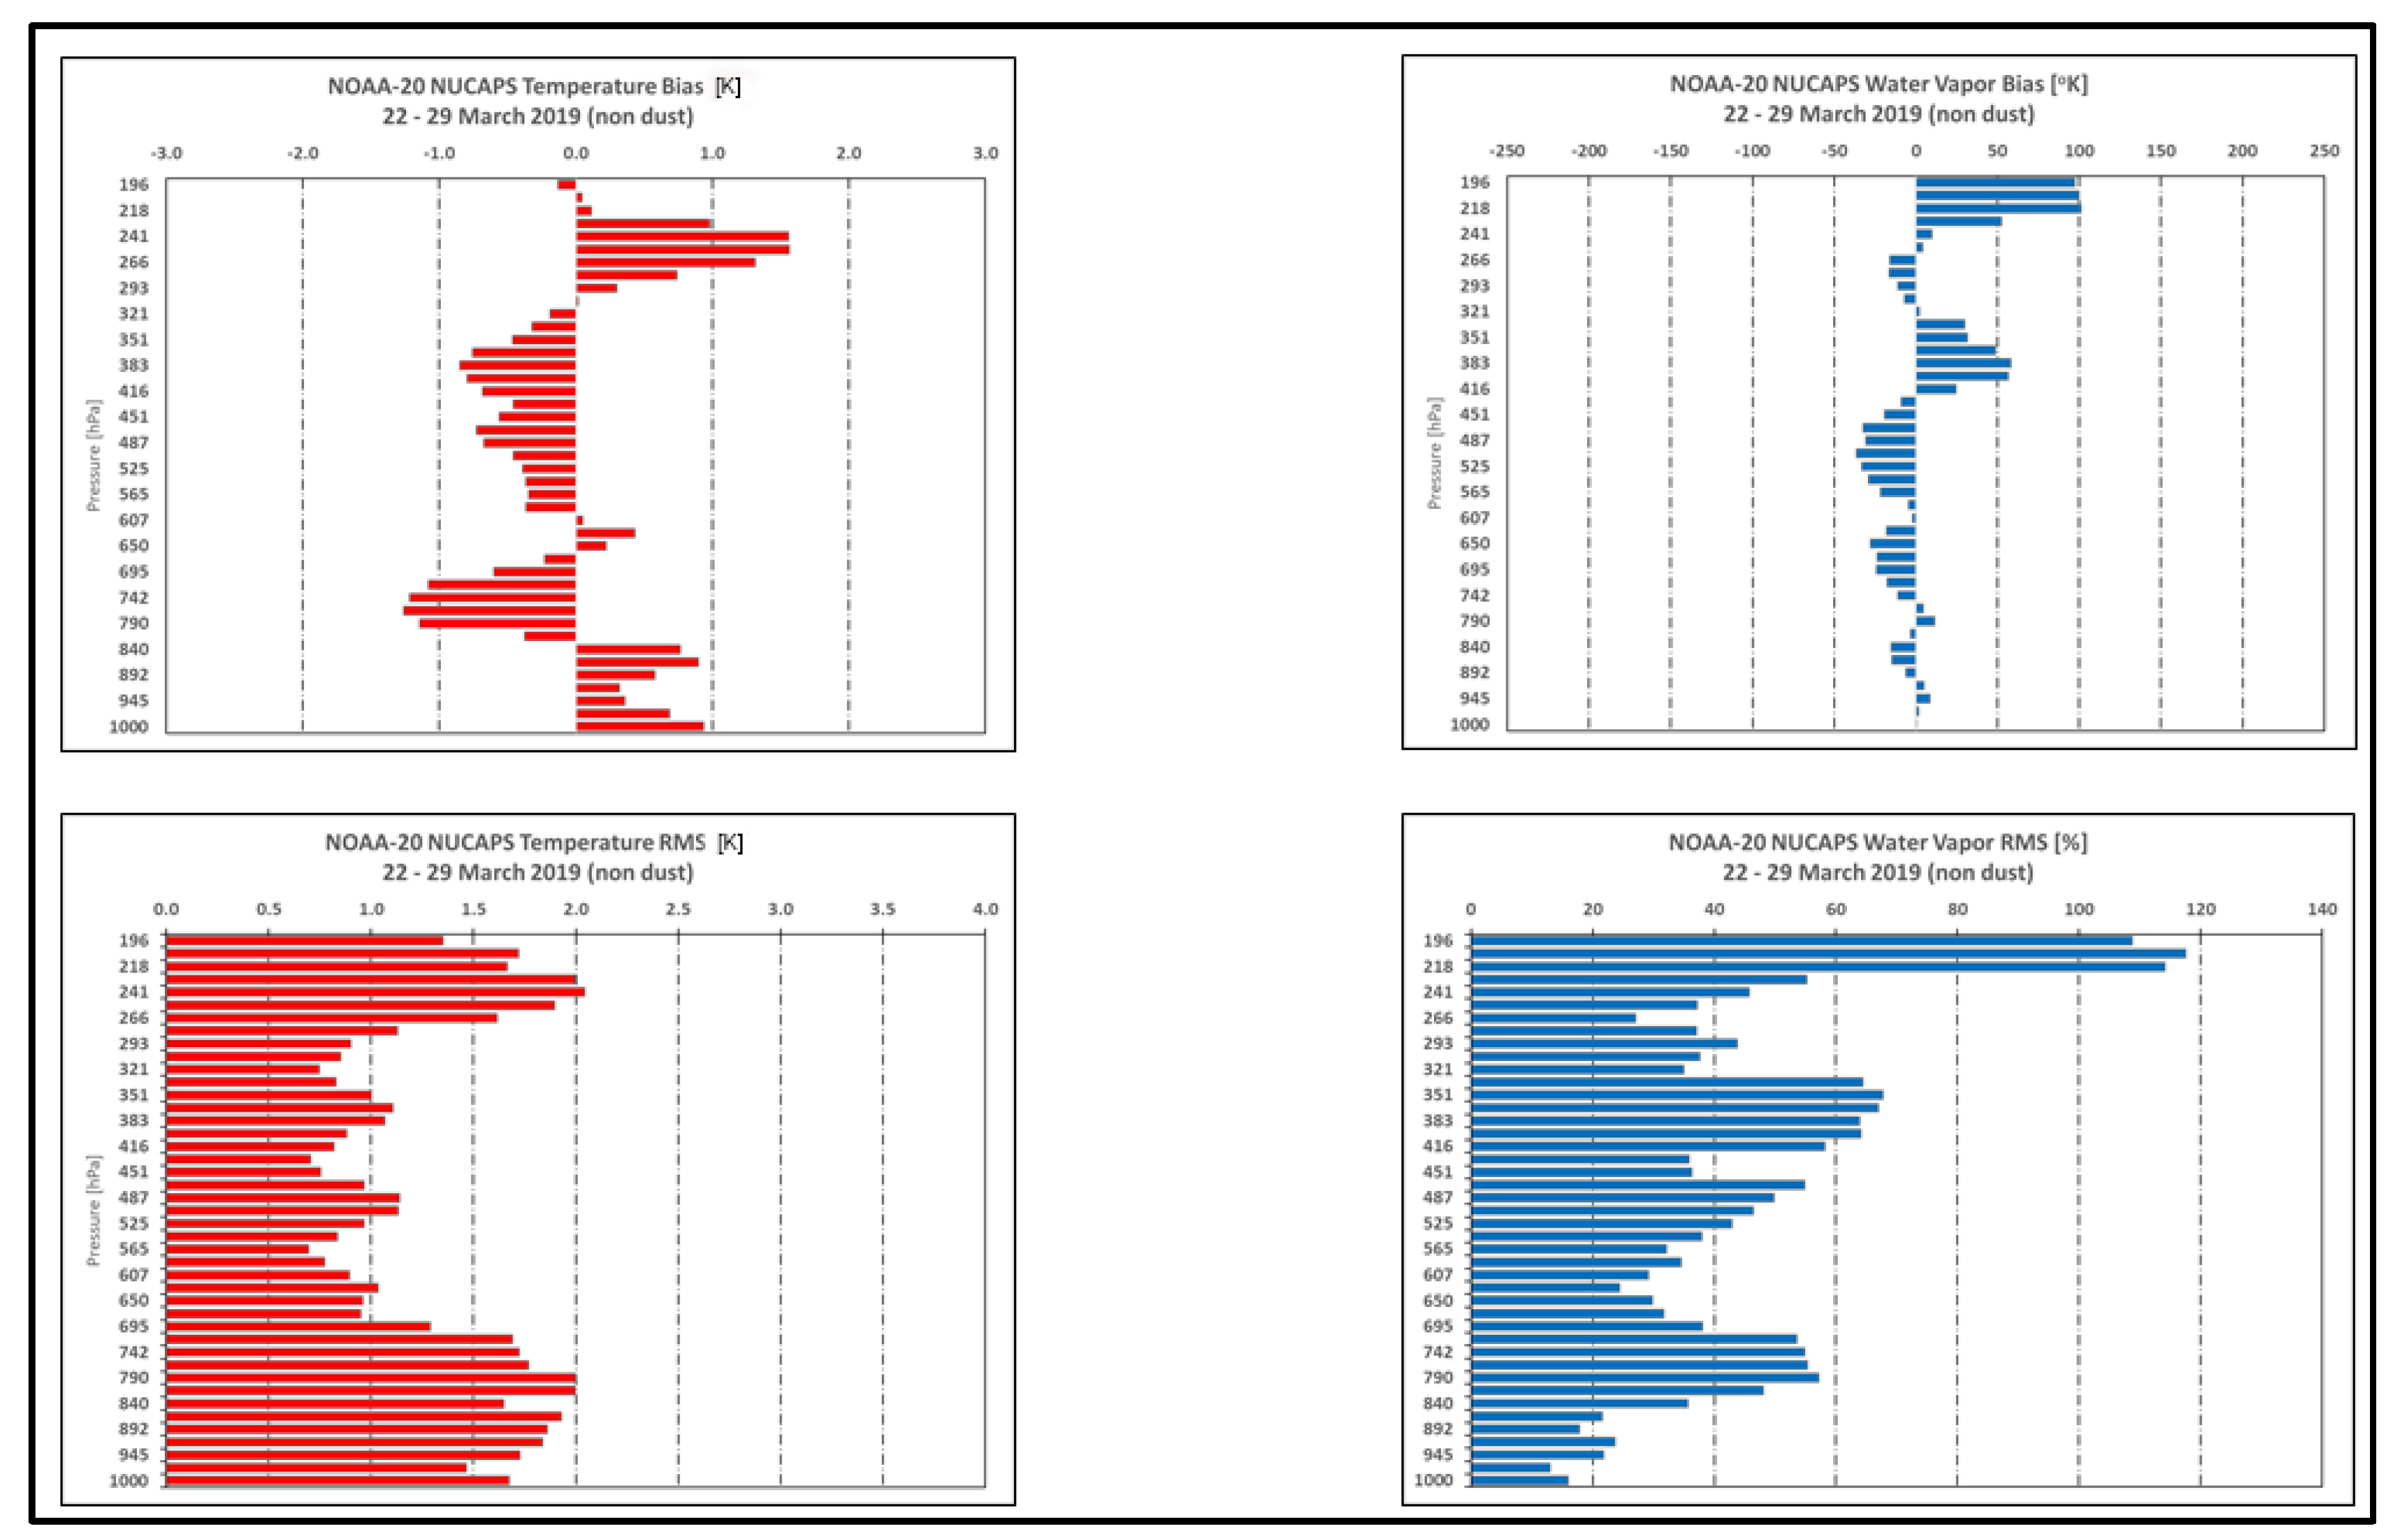
3.3.2. NOAA-20 NUCAPS Temperature and Water Vapor Comparisons with RAOBs

Figure 14, Figure 15 and Figure 16 compare NUCAPS against the AEROSE RAOBS by depicting the temperature and water vapor differences between NUCAPS and AEROSE RAOBs Bias and Root Mean Square (RMS) error calculations. Similar to the case studies described in Section 3.1, NUCAPS overpass positions were within 50 km of the Ron Brown/RAOB locations. This is with the understanding that there is some collocation mismatch due to radiosonde drifts with height. The statistics are computed at 100 effective pressure layers via NPROVS. Those statistics are computed at 100 effective pressure layers via NPROVS. Only NOAA-20 NUCAPS statistical data are provided here; SNPP NUCAPS results are very similar (SNPP NUCAPS products are no longer available to the operational forecaster at NWS).
These statistics summarize the results of three legs of the cruise: the initial outbound cruise from the home port in Charleston, S.C., toward Africa in dust-free conditions (Figure 14), the Saharan dust environment offshore from Northwest Africa (Figure 15), and finally the dust-free environment on the return trip to home port (Figure 16). The left panels show temperature bias (K) and root mean square (RMS) error measurements. Correspondingly, the right panels show water vapor bias and RMS. The water vapor units in these panels are differences between the satellite and RAOB measurements divided by mean RAOB water vapor values that are output as percentages.
In all three figures (Figure 14, Figure 15 and Figure 16), temperature and water vapor biases are consistently sinusoidal in the vertical. The non-dust profiles in “Leg 1” of Figure 14 and in “Leg 3” of Figure 16 is first discussed. In Figure 14, the lowest layer shows a warm bias of 2.1 K near the surface, then undulating vertically from slight cold and warm biases. Above 650 hPa, the biases are contained between −1.5 K and 1.9 K. Since we were only concerned with the dust layer near the surface, those upper-level profiles are trivial. In contrast, the water vapor near-surface biases (upper right panel) are minimal, reaching −50% at approximately 750 hPa. Although the bias becomes moist and maximizes at 200% at 607 hPa, this layer is well above the dust layer and the level of interest. Temperature RMS values range between 2.3 K near the surface (1000 hPa) and 2.6 K at 766 hPa. For Leg 3 (Figure 16), the temperature and water vapor bias profiles are fairly similar to Leg 1. Near the surface, the temperature profile contains a slightly warm bias that is maximized at +0.9 K. Similar to Leg 1, the profile in Leg 3 then has a cold bias, with a maximum of −1.2 K at 766 hPa. Further up and below 300 hPa, the temperature bias stays within +/−1 K. For Leg 3, the water vapor biases are relatively minimal, below 400 hPa. The temperature and water vapor RMS values in Leg 3 are also within reasonable limits. Below 700 hPa, the temperature RMS values range from 1.4 K to 2.0 K. Between 700 and 800 hPa, the water vapor RMS values peak at 57% (790 hPa).
Figure 15 presents the profiling of the dust environment during the AEROSE campaign. Both the temperature and water vapor biases near the surface appear in contrast to the Leg 1 and Leg 3 (non-dust) analyses. Except for the very lowest layer near 1000 hPa level, NUCAPS has a cold bias of −2.7 K at 918 hPa. Similar to this non-dust case, the water vapor bias (top right panel) has a sinusoidal pattern vertically. For the temperature bias, the pattern is similar to the outbound cruise in Figure 13; the temperature starts off in a cold bias region that maximizes at −2.5 K at 892 hPa. Above that level and below 300 hPa, the temperature profile bias remains confined between +/−1.0 K within these two maxima. In a similar fashion, the water vapor bias has a moist bias at the lowest level that maximizes at +81.5% at ~900 hPa. This seems to suggest that at low levels (below 800 hPa), where the greatest concentration of dust exists, NUCAPS cannot resolve the dust radiance and overestimates the moisture. The temperature bias pattern reacts inversely by having a cold bias in this layer. At 607 hPa, the water vapor bias reaches a maximum value of −37.0% at 742 hPa, while the temperature bias is somewhat offset with a slight warm bias at 0.2 K at 742 hPa. The temperature RMS error profiles in the lower left panel to record the highest values at low levels with 3.1 K at ~900 hPa. The corresponding moisture RMS has a maximum error of 77.29% at the same level.
When comparing the statistics between non-dust and dust, the bulk analysis data seem to indicate within the dust environment, and the temperature profile has a warm bias compared to non-dust regions. Additionally, NUCAPS water vapor profiles within dust contain a moist bias near the surface compared to the slightly dry bias within the non-dust environment. In viewing the general trend between dust vs. non-dust, the NOAA-20 NUCAPS performs better in non-dust conditions near the surface.
In summary, Table 2 provides an assessment of how the NOAA-20 NUCAPS temperature and water vapor bias along with RMS compare to the JPSS Level 1 requirements for NUCAPS measurements. Although NUCAPS validation reached validation maturity [11], during this AEROSE campaign, at certain atmospheric levels, the temperature and water vapor bias/RMS values went far beyond the thresholds listed in Table 2, i.e., they did not satisfy the requirements. However, the values in Table 2 reflect global assessments, whereas this article focuses on a very limited scope in space (NTAB).

3.3.3. LCL Comparisons between the Ron Brown RAOBS and NUCAPS

Figure 17 presents bulk LCL patterns during the entire AEROSE campaign. LCL is the level at which a surface parcel lifted dry adiabatically becomes saturated. Within Saharan dust regions, LCL is a weak indicator of any atmospheric instability; however, LCL can infer how well NUCAPS measures boundary layer conditions over open water. The red and blue profiles are derived from the RAOB and from NUCAPS (both SNPP and NOAA-20). As shown in both profiles, there is a strong and very distinguishing contrast of LCL profiling between the non-dust and in-dust environments for both RAOB and NUCAPS. The units for LCL are in degrees C. Within the RAOB profile (red), the average LCL temperature value in the non-dust region is 12 C. Within the dust environment, the average LCL temperature is significantly cooler at 3 C.
The average NUCAPS LCL temperature value is 11.4 C outside of the dust and 1.9 C within the dust. In summary, with such a distinguishing feature between non-dust and dust conditions, forecasters can apply near-surface-based LCL levels as an indicator of dust in the region.

4. Conclusions

NUCAPS shows skill in distinguishing dust from non-dust atmospheric conditions, which is particularly valuable over data-sparse regions. Since conventional observations (i.e., RAOB) sites are typically not available in non-populated areas, a relatively large portion of the earth is a data void, and NUCAPS can fill in gaps. Even in populated areas, where conventional observations can be 6 to 12 h apart, NUCAPS retrievals during the local 1:30 and 13:30 UTC time periods can fill in critical temporal gaps. Positive impacts in the context of next-generation resources and geophysical modeling applications are potentially large.
The AEROSE campaign for March 2019 provided an invaluable opportunity to conduct research and validation work over the typically data-sparse region of the NTAB, with a wealth of observational and instrument datasets for environmental research. From a skew-T perspective, there is good agreement between NUCAPS profiles and the RAOBs. Over the maritime conditions in the NATB, NUCAPS responded to the relatively dry, low-level moisture pattern that supports the existence of Saharan dust and its development. Because of the limitations inherent within satellite sounders, the coarser NUCAPS misses many of the fine detail afforded by the RAOBs.
From a bulk analysis perspective, NUCAPS shows greater skill in distinguishing dust from non-dust environments. The NUCAPS temperature bias and RMS profiles appear quite favorable for implementing NUCAPS far downwind of its initial source. Most noteworthy are the NUCAPS-derived LCL measurements, as illustrated in Figure 17. Both NUCAPS and RAOB profiles are in agreement in presenting surface-based LCL temperatures as cooler during the dusty condition during 12–21 March.
For this study, there is not a clear approach to evaluating the NOAA-20 NUCAPS RMS with regard to satisfying JPSS Level 1 requirements. JPSS requirements evaluate NUCAPS RMS on a global scale at the following coarse layers: 30 for temperature and 20 for the water vapor mixing ratio (WVMR) [11]. In contrast, this study applied NUCAPS RMS on a regional scale (NTAB) and at 100 layers for both temperature and moisture.
As one of the objectives of the NOAA JPSS sounding Initiative, the author conducted various telephone conversations and two field visits at the NWS Weather Forecast Office (WFO), San Juan, Puerto Rico (2017 and 2019). From this encounter, it is the author’s perspective that NUCAPS can provide weather forecasters with a valuable new set of near real-time observations to detect, monitor, and predict SAL transport. NWS forecasters are trained to view and analyze various facets of products from a broad matrix of decision-making resources. Gaining experience in distinguishing atmospheric signatures from clusters of NUCAPS profiles (skew-T diagrams) and associated gridded fields is an emerging resource within the NWS AWIPS-2 program. NUCAPS profiles provide a consistent representation of global atmospheres across the approximately 2.5 km vertical and 50 (to 150 km) planar “volumes” they portray.
Along with Saharan dust applications that are year-round, a related longer-term goal is developing a SAL climatology from the Saharan deserts of northern Africa into the western Atlantic, especially during the boreal summer. As demonstrated in this paper, NUCAPS profiles are particularly sensitive toward synoptic situations leading toward stronger dust-laden SAL outflows during the summer, as the dew point temperature tends to profile the moisture more accurately. The ability to identify strong dust transport occurrences throughout the year along with monitoring the seasonality of SAL outflows and associated SAL strength across the Atlantic can provide downwind forecasters with vital information on the approach of strong SAL outflows.

Author Contributions

Conceptualization, A.K., R.E. and N.R.N.; methodology, A.K. and A.R.; software, A.R. and B.S.; validation, A.R., B.S., A.K. and N.R.N.; formal analysis, A.K. and A.R.; investigation, A.K.; AEROSE data, V.R.M. and N.R.N.; writing—original draft preparation, A.K. and A.R.; writing—review and editing, A.K., R.E., N.R.N., B.S. and V.R.M.; visualization, A.K., A.R. and R.E.; funding acquisition, A.K. All authors have read and agreed to the published version of the manuscript.

Funding

This research was funded by Dr. Mitch Goldberg and Dr. Satya Kalluri through the Joint Polar Satellite System Proving Ground and Risk Reduction Program under the project: “Demonstrating, Evaluating and Promoting NUCAPS during Saharan Air Layer Events within the NTAB”. AEROSE is supported by the NOAA Educational Partnership Program Grant NA17AE1625, NOAA Grant NA17AE1623, and the NOAA Educational Partnership Program for Minority-Serving Institutions under Cooperative Agreement NA16SEC4810006. The Naval Research Laboratory—Marine Meteorology Division (NRL-MMD) in Monterey, CA has been funded by NOAA’s Joint Polar Satellite System (JPSS) Proving Ground and Risk Reduction (PGRR) program to study NUCAPS skill over the NATB and northern Africa deserts. The PGRR program was established to improve the interaction between researchers and users of satellite data to develop new and optimized ways to use satellite data to improve natural hazard monitoring, such as the Saharan dust; this includes monitoring the Saharan Air Layer air mass, which contains heavy dust concentrations.

Acknowledgments

The authors would like to thank the JPSS Proving Ground Sounding Initiative for continued support and collaboration. The authors appreciate the continuous interactions and user support with Ernesto Rodriguez, the Science Operations Officer (SOO) at the National Weather Service Weather Forecast Office in San Juan, Puerto Rico. AEROSE works in collaboration with the NOAA PIRATA Northeast Extension (PNE) project and is supported by the NOAA Center for Atmospheric Sciences and Meteorology (NCAS-M) at Howard University, the Joint Polar Satellite System (JPSS), and NOAA/ NESDIS/STAR. We also want to acknowledge Philippe Goloub for the following for providing us with AERONET profiles at the Cape Verde site located in Figure 11.

Conflicts of Interest

The authors declare no conflict of interest.

Appendix A

Table A1. List of acronyms and their descriptions.
AcronymExpansionBrief Description
AERONETAErosol RObotic NETworkFederation of ground-based remote sensing aerosol networks
AEROSESaharan dust AERosols and Ocean Science ExpeditionsTrans-Atlantic field campaigns conducted onboard the NOAA Ship Ronald H. Brown designed to explore African air mass outflows and their impacts on climate, weather, and environmental health
ATMSAdvanced Technology Microwave SounderSatellite hyperspectral microwave sounder
AVMPatmospheric vertical moisture profileEnvironmental data records of moisture soundings retrieved by NUCAPS
AVTPatmospheric vertical temperature profileEnvironmental data records of temperature soundings retrieved by NUCAPS
AWIPS-IIAdvanced Weather Interactive Processing SystemMeteorological display and analysis package developed and operated by the National Weather Service (second version)
CALIPSO-CALIOPCloud-Aerosol Lidar and Infrared Pathfinder Satellite Observation—Cloud-Aerosol Lidar with Orthogonal PolarizationTwo-wavelength (532 nm and 1064 nm) polarization-sensitive lidar that provides high-resolution vertical profiles of aerosols and clouds.
CAPEConvective Available Potential EnergyMeasure of the amount of energy available for atmospheric convection
CO, HNO3, O3, CH4, SO2Carbon Monoxide, Nitric acid, Ozone,
Methane, Sulfur Dioxide
Trace gases sensed by NUCAPS
CrISCross-track Infrared SounderSatellite hyperspectral Infrared sounders
EDREnvironmental Data RecordsWeather products produced by NOAA for operational use to NWS and for research applications
FORField Of RegardTotal area that can be captured by a satellite sensor
GFSGlobal Forecast System (GFS)National Centers for Environmental Prediction (NCEP) weather forecast model that generates data for atmospheric and land-soil variables
GRUANGlobal Climate Observing System (GCOS) Reference Upper-Air NetworkInternational reference observing network of sites measuring essential climate variables above Earth’s surface
IRInfraRedPart of electromagnetic spectrum that ranges in wavelength from 750 nm to 1 mm
JPSSJoint Polar Satellite SystemNOAA section focusing on low earth orbiting satellites and operations
LCLLifting Condensation LevelLevel in atmosphere at which a parcel becomes saturated. It can be used as a reasonable estimate of cloud base height when parcels experience forced (very convective) ascent
LEOLow earth orbiting satellitesSatellites that orbit around Earth with a period of 128 min or less (making at least 11.25 orbits per day) and an eccentricity less than 0.25
MetOpMeteorological Operational satelliteEuropean low earth orbiting satellites that monitor the climate and improve weather forecasts.
MWMicroWavePart of electromagnetic spectrum that ranges in wavelength from 1 mm to 1 m
NOAA-20NOAA low earth orbiting satellite Named JPSS-1 prior to launch, is first of NOAA latest generation of U.S. polar-orbiting, non-geosynchronous, environmental satellites called the Joint Polar Satellite System.
NPROVS NOAA Products Validation System
NTABNorth Tropical Atlantic BasinAtlantic ocean basin (open water) that stretches between the US and Caribbean Islands eastward to Africa, north the equator
NUCAPSNOAA Unique Combined Atmospheric Processing SystemAlgorithm used to process temperature and moisture soundings from hyperspectral infrared and microwave sounders
PM, PM10, PM2.5Particle MeasurementsParticle Measurements in general (PM), the size of 10 μm PM10) or 2.5 μm (PM2.5)
RAOBRAwinsonde
OBservation
Aatmospheric sounding consisting of a helium-filled balloon that carries an instrument that measures temperature, pressure, moisture, and winds
SALSaharan Air LayerElevated air mass that originates over the African desert that often carries Saharan dust over the tropical Atlantic Ocean
SNPPSuomi National Polar-orbiting PartnershipJPSS prior to launch is US low earth orbiting satellite that started the next generation of JPSS high resolution and fidelity satellites
VIIRSVisible Infrared Imaging Radiometer SuiteSensor onboard the JPSS series of satellites that are applied toward operational environmental monitoring and numerical weather forecasting

References

  1. Prospero, J.M.; Delany, A.C.; Delany, A.C.; Carlson, T.N. The discovery of African dust transport to the Western Hemisphere and the Saharan air layer: A history. Bull. Am. Meteorol. Soc. 2021, 102, E1239–E1260. [Google Scholar] [CrossRef]
  2. Lara, M.; Akinbami, L.; Flores, G.; Morgenstern, H. Heterogeneity of childhood asthma among Hispanic children: Puerto Rican children bear a disproportionate burden. Pediatrics 2006, 117, 43–53. [Google Scholar] [CrossRef] [PubMed]
  3. Ortiz-Martinez, M.; Rivera-Ramírez, E.; Méndez-Torres, L.; Jiménez-Vélez, B.D. Role of Chemical and Biological Constituents of PM10 from Saharan Dust in the Exacerbation of Asthma in Puerto Rico; University of Puerto Rico-Medical Sciences Campus: San Juan, Puerto Rico, 2010. [Google Scholar]
  4. Kotsyfakis, M.; Zarogiannis, S.G.; Patelarou, E. The health impact of Saharan dust exposure. Int. J. Occup. Med. Environ. Health 2019, 32, 749–760. [Google Scholar] [CrossRef] [PubMed]
  5. Divakarla, M.G.; Pryor, K.; Ho, S.P.; Barnet, C.; Tan, C.; Wilson, M.; Nalli, N.; Zhu, T.; Warner, J.; Wang, T.; et al. NUCAPS Atmospheric Composition and Trace Gas Products: Performance, Recent Advances, and Future Improvements. In Proceedings of the 102nd American Meteorological Society Annual Meeting, AMS, Virtual, 23–27 January 2022. [Google Scholar]
  6. Susskind, J.; Barnet, C.D.; Blaisdell, J.M. Retrieval of atmospheric and surface parameters from AIRS/AMSU/HSB data in the presence of clouds. IEEE Trans. Geosci. Remote Sens. 2003, 41, 390–409. [Google Scholar] [CrossRef]
  7. Smith, N.; Barnet, C.D. Uncertainty Characterization and Propagation in the Community Long-Term Infrared Microwave Combined Atmospheric Product System (CLIMCAPS). Remote Sens. 2019, 11, 1227. [Google Scholar] [CrossRef]
  8. Bloch, C.; Knuteson, R.O.; Gambacorta, A.; Nalli, N.R.; Gartzke, J.; Zhou, L. Near-real-time surface-based CAPE from merged hyperspectral IR satellite sounder and surface meteorological station data. J. Atmos. Ocean. Tech. 2019, 58, 1613–1631. [Google Scholar] [CrossRef]
  9. Maddy, E.S.; Barnet, C.D. Vertical Resolution Estimates in Version 5 of AIRS Operational Retrievals. IEEE Trans. Geosci. Remote Sens. 2008, 46, 2375–2384. [Google Scholar] [CrossRef]
  10. Weaver, G.M.; Smith, G.M.; Smith, N.; Berndt, E.B.; White, K.D.; Dostalek, J.F.; Zavodsky, B.T. Addressing the Cold Air Aloft Aviation Challenge with Satellite Sounding Observations. J. Oper. Meteor. 2019, 7, 138–152. [Google Scholar] [CrossRef]
  11. Nalli, N.R.; Gambacorta, A.; Liu, Q.; Barnet, C.D.; Tan, C.; Iturbide-Sanchez, F.; Reale, T.; Sun, B.; Wilson, M.; Borg, L.; et al. Validation of atmospheric profile retrievals from the SNPP NOAA-Unique Combined Atmospheric Processing System. Part 1: Temperature and moisture. IEEE Trans. Geosci. Remote Sens. 2018, 56, 180–190. [Google Scholar] [CrossRef]
  12. Esmaili, R.B.; Smith, N.; Berndt, E.B.; Dostalek, J.F.; Kahn, B.H.; White, K.; Barnet, C.D.; Sjoberg, W.; Goldberg, M. Adapting Satellite Soundings for Operational Forecasting within the Hazardous Weather Testbed. Remote Sens. 2020, 12, 886. [Google Scholar] [CrossRef] [Green Version]
  13. Nalli, N.R.; Barnet, C.D.; Reale, T.; Liu, Q.; Morris, V.R.; Spackman, J.R.; Joseph, E.; Tan, C.; Sun, B.; Tilley, F.; et al. Satellite sounder observations of contrasting tropospheric moisture transport regimes: Saharan air layers, Hadley cells, and atmospheric rivers. J. Hydrometeorol. 2016, 17, 2997–3006. [Google Scholar] [CrossRef]
  14. Moulin, C.; Gordon, H.R.; Banzon, V.F.; Evans, R.H. Assessment of Saharan dust absorption in the visible from SeaWiFS imagery. J. Geophys. Res. Atmos. 2001, 106, 18239–18249. [Google Scholar] [CrossRef]
  15. Di Sarra, A.; Di Iorio, T.; Cacciani, M.; Fiocco, G.; Fua, D. Saharan dust profiles measured by lidar at Lampedusa. J. Geophys. Res. Atmos. 2001, 106, 10335–10347. [Google Scholar] [CrossRef]
  16. Kalluri, S. Exploring the Future of Infrared Sounding: Outcomes of a NOAA-NESDIS Virtual Workshop. Bull. Am. Meteorol. Soc. 2022. [Google Scholar] [CrossRef]
  17. Berndt, E.; Smith, N.; Burks, J.; White, K.; Esmaili, R.; Kuciauskas, A.; Duran, E.; Allen, R.; LaFontaine, F.; Szkodzinski, J. Gridded satellite sounding retrievals in operational weather forecasting: Product description and emerging applications. Remote Sens. 2020, 12, 3311. [Google Scholar] [CrossRef]
  18. Winker, D.M.; Vaughan, M.A.; Omar, A.; Hu, Y.; Powell, K.A.; Liu, Z.; Hunt, W.H.; Young, S.A. Overview of the CALIPSO Mission and CALIOP Data Processing Algorithms. J. Atmos. Oceanic Technol. 2009, 26, 2310–2323. [Google Scholar] [CrossRef]
  19. Nalli, N.R.; JosEph, E.; Morris, V.R.; Barnet, C.D.; Wolf, W.W.; Wolfe, D.; Minnett, P.J.; Szczodrak, M.; Izaguirre, M.A.; Lumpkin, R.; et al. Multiyear observations of the tropical Atlantic atmosphere: Multidisciplinary applications of the NOAA Aerosols and Ocean Science Expeditions. Bull. Am. Meteorol. Soc. 2011, 92, 765–789. [Google Scholar] [CrossRef]
  20. Morris, V.; Clemente-Colón, P.; Nalli, N.R.; Joseph, E.; Armstrong, R.A.; Detrés, Y.; Goldberg, M.D.; Minnett, P.J.; Lumpkin, R. Measuring trans-Atlantic aerosol transport from Africa. Eos Trans. Am. Geophys. Union 2006, 87, 565–571. [Google Scholar] [CrossRef]
  21. Kawai, Y.; Oshima, M.K.K.; Hori, M.E.; Inoue, J. Comparison of Vaisala radiosondes RS41 and RS92 launched over the oceans from the Arctic to the tropics. Atmos. Meas. Tech. 2017, 10, 2485–2498. [Google Scholar] [CrossRef]
  22. Jensen, M.P.; Holdridge, D.J.; Survo, P.; Lehtinen, R.; Baxter, S.; Toto, T.; Johnson, K.L. Comparison of Vaisala Radiosondes RS41 and RS92 at the ARM Southern Great Plains Site. Atmos. Meas. Tech. 2016, 9, 3115–3129. [Google Scholar] [CrossRef] [Green Version]
  23. Sun, B.; Reale, A.; Schroeder, S.; Pettey, M.; Smith, R. On the accuracy of Vaisala RS41 versus RS92 upper-air temperature observations. J. Atmos. Ocean. Tech. 2019, 36, 635–653. [Google Scholar] [CrossRef]
  24. Sun, B.; Calbet, X.; Reale, A.; Schroeder, S.; Bali, M.; Smith, R.; Pettey, M. Accuracy of Vaisala RS41 and RS92 upper tropospheric humidity compared to hyperspectral satellite infared measurements. J. Remote Sens. 2021, 13, 173. [Google Scholar] [CrossRef]
  25. Sun, B.; Reale, A.; Pettey, M.; Smith, R. NOAA Products Validation System. In Field Measurements for Passive Environmental Remote Sensing; Chapter 16 of the book; Nalli, N., Liu, M., Borg, L., Eds.; Elsevier: Amsterdam, The Netherlands, 2022. [Google Scholar]
  26. Holbein, B.N.; Eck, T.F.; Shuster, I.; Tanner, D.; Buys, J.P.; Seltzer, A.; Vermonter, E.; Reagan, J.A.; Kaufman, Y.J.; Nakajima, T.; et al. AERONET—A federated instrument network and data archive for aerosol characterization. Remote Sens. Environ. 1998, 66, 1–16. [Google Scholar] [CrossRef]
  27. Iturbide-Sanchez, F.; da Silva, S.R.S.; Liu, Q.; Pryor, K.L.; Pettey, M.E.; Nalli, N.R. Toward the Operational Weather Forecasting Application of Atmospheric Stability Products Derived from NUCAPS CrIS/ATMS Soundings. IEEE Trans. Geosci. Remote Sens. 2018, 56, 4522–4545. [Google Scholar] [CrossRef]
  28. Riemer, N.; Doherty, O.M.; Hameed, S. On the variability of African dust transport across the Atlantic. Geophys. Res. Lett. 2006, 33, L13814. [Google Scholar] [CrossRef]
  29. Maddy, E.S.; DeSouza-Machado, S.; Nalli, N.R.; Barnet, C.D.; Strow, L.L.; Wolf, W.W.; Xie, H.; Gambacorta, A.; King, T.S.; Joseph, E.; et al. On the effect of dust aerosols on AIRS and IASI operational level 2 products. Geophys. Res. Lett. 2012, 39, L10809. [Google Scholar] [CrossRef]
  30. Luo, B.; Minnett, P.J.; Zuidema, P.; Nalli, N.R.; Akella, S. Saharan dust effects on North Atlantic sea-surface skin temperatures. J. Geophys. Res. Ocean. 2021, 126, e2021JC017282. [Google Scholar] [CrossRef]
Figure 1. Map of Ron Brown cruise during March 2019 where the blue crosses depict Ron Brown RAOB locations along its eastward path during 3–17 March while the red crosses depict the westward and returning path during 17–29 March. Annotations of Leg 1 and Leg 3 depict the region where the Ron Brown cruised through non-dust region. Leg 2 indicates the path where the Ron Brown cruised through the dust region. The lower right panel provides the zoomed region (outlined by the black box on the left map) of the dusty environment (yellow shade) offshore of Northwest Africa.
Remotesensing 14 04261 g001
Figure 2. A general flow chart of the NUCAPS retrieval algorithm, which consists of an MW-only and a combined IR + MW retrieval. Bolded steps are discussed in this paper.
Remotesensing 14 04261 g002
Figure 3. Global Forecast System (GFS) 850 hPa analysis chart for (a) 8 March 00 UTC and (b) 24 March 00 UTC. Black line segment covers the Ron Brown (RB) track for each day. Charts were obtained from the University of Wyoming, Wyoming Weather Web, courtesy of Larry Oolman.
Remotesensing 14 04261 g003
Figure 4. (a) S-NPP true color plots of non-dust conditions throughout the NTAB during the outbound (left panel, 8 March) and inbound (right panel, 24 March) paths of the Ron Brown cruise. The red arrows indicate the path segment for each day. The orange/red circles are locations when RAOB was launched. (b) RAOB and NUCAPS skew-T plots for each Ron Brown position in true color images. Orange arrows point from the location of the Ron Brown in the image to corresponding skew-T plot. Solid red and blue lines are temperature and dew point temperature profiles from RAOBs; wind barbs are from RAOBs. The dark blue and dark red plots are temperature and dew point temperature profiles from NUCAPS. The sun glint region is annotated by the transparent yellow arc.
Remotesensing 14 04261 g004
Figure 5. Northern Hemisphere Global Forecast System (GFS) 850 hPa analysis chart for (a) 13 March 00 UTC and (b) 18 March 00 UTC. Black line segment covers the Ron Brown (RB) track for each day. Charts were obtained from the University of Wyoming, Wyoming Weather Web, courtesy of Larry Oolman.
Remotesensing 14 04261 g005
Figure 6. AERONET plots of AOD during 11–14 March over Capo Verde. The legend provides color contours for each of the instrument wavelengths (in nm). Times are UTC.
Remotesensing 14 04261 g006
Figure 7. AERONET plots of AOD during 18 March over Capo Verde. The legend provides color contours for each of the instrument wavelengths (in nm). Times are UTC.
Remotesensing 14 04261 g007
Figure 8. CALIPSO-CALIOP measurements for (a) 13 March 03 UTC and (b) 18 March 02:30 UTC. CALIPSO overpasses are shown above each image with short black lines defining the north and south extent of the dust. For each image, the black dashed lines indicate the general tops of the dust layer, while short back vertical lines indicate the horizontal boundaries of the Saharan dust.
Remotesensing 14 04261 g008
Figure 9. Same as Figure 4 but for the (a) 13 March and (b) 18 March. In this case, the Ron Brown (RB) was embedded within the dusty environment offshore of Northwest Africa.
Remotesensing 14 04261 g009
Figure 10. Left: Similar GFS 850 hPa synoptic map as in Figure 3 and Figure 5 but for 25 August 2019. Right: SNPP VIIRS true color image during early afternoon of 26 August 2019. Heavy dust concentrations embedded within the SAL can be seen flowing from NW Africa into the Atlantic basin. Sun glint is annotated. Dust and SAL region in both panels are annotated in orange.
Remotesensing 14 04261 g010
Figure 11. Similar to Figure 8, but for 25 August 2019.
Remotesensing 14 04261 g011
Figure 12. Skew-T plots from left to right: (a) RAOB from Tenerife on 25 August, 12 UTC, (b) SNPP NUCAPS at 13 UTC, and (c) NOAA-20 NUCAPS at 14 UTC. Dashed red lines correspond to the upper and lower bounds of the SAL layer. RAOB skew-T plot is courtesy of U. of Wyoming Atmospheric Soundings—Wyoming Weather Web (https://weather.uwyo.edu/upperair/sounding.html) accessed on 3 March 2022.
Remotesensing 14 04261 g012
Figure 13. Spline plot of hand-held Microtops sunphotometer solar-spectrum AOD measurements at 0.5 μm. Measurements were conducted onboard the Ron Brown during the AEROSE campaign throughout March 2019. The three legs of the cruise are annotated in the figure; the description for each leg is illustrated in Figure 1.
Remotesensing 14 04261 g013
Figure 14. Bulk statistics for NOAA-20 NUCAPS temperature and water vapor during Leg 1 (non-dust region, see Figure 1) of the AEROSE campaign during 3–11 March 2019. Top panels: Temperature and water vapor biases; Bottom panels: Corresponding temperature and water vapor RMS errors. Temperature values are in degrees Kelvin (K), while water vapor values are in percent and calculated by taking the difference between satellite and RAOB (ground truth) measurements. Note that in the water vapor RMS panel in the lower right, the bar at 618 hPa was calculated at 240%, beyond the graph’s limits.
Remotesensing 14 04261 g014
Figure 15. Same as Figure 13 but for Leg 2 (dust region, see Figure 1) of the AEROSE campaign during 12–21 March 2019.
Remotesensing 14 04261 g015
Figure 16. Same as Figure 13 but for Leg 3 (non-dust region, see Figure 1) of the AEROSE campaign during 22–29 March 2019.
Remotesensing 14 04261 g016
Figure 17. Overview (3–29 March 2019) of near-surface-based lifting condensation levels (LCL) throughout the NTAB between (1) RAOBs in red and (2) NUCAPS in blue (SNPP and NOAA-20).
Remotesensing 14 04261 g017
Table 1. Information for RAOB/NUCAPS skew-T plots for the four case study days described in Section 3.1.
DatesNUCAPS Overpass
Times (UTC)
RAOB Launch
Times (UTC)
Ron Brown Positions Relative to RAOB Launches
SNPPNOAA-20 LatitudeLongitude
8 March
(non-dust)
04:1605:0804:3523.52°N49.37°W
15:3016:2115:5022.88°N47.25°W
24 March
(non-dust)
04:1705:0803:0423.77°N50.35°W
16:2116:2115:5824.59°N52.86°W
13 March
(dust)
02:4303:3402:2629.30°N29.06°W
15:3614:4514:1820.37°N26.82°W
18 March
(dust)
02:5003:4202:2612.00°N23.09°W
13:5814:5014:2914.46°N23.44°W
Table 2. JPSS Level 1 requirements for NUCAPS measurement uncertainty. Values retrieved from JPSS Program Level 1 Requirements Supplement—Final, Version 2.10, 25 June 2014, NOAA/NESDIS.
Atmospheric Vertical Temperature Profile (AVTP)
cloud-free to partly cloudy
thresholdobjective
Surface to 300 hPa1.6 K0.5 K
Atmospheric Vertical Moisture Profile (AVMP)
cloud-free to partly cloudy
thresholdobjective
Surface to 600 hPagreater of 20% or 0.2 gkg−110%
Publisher’s Note: MDPI stays neutral with regard to jurisdictional claims in published maps and institutional affiliations.

