Abstract
Floods threaten the sustainable development of areas with a high probability of hazard. A typical analytic hierarchy process (pixel-based AHP) based flood hazard estimation method may ignore the similar threat caused by neighborhood cells at the sub-watershed scale. This study proposed an extended watershed-based Zonal Statistical AHP for flood hazard estimation: Constraining converging related indicators by the sub-watersheds (WZSAHP-RC) model to improve this gap. Before calculating the flood hazard index, the proposed model uses the sub-watershed derived by the multiple flow direction method as a based unit to calculate the maximum zonal statistical value of runoff converging indicators. Moreover, taking the Chaohu basin of Anhui in China as the case study, the validation flooding ground-truthing was constructed from GF-3, and Landsat OLI images of the flood event from 20 July to 24 July 2020, which is the biggest flood recorded by the Zhongmiao station, which recorded a new water level, 0.82 m higher than the historical record. Compared with the validation, the results indicated the proposed method could improve the correct ratio by 38% (from 22% to 60%) and the fit ratio by 17% (from 18% to 35%) when considering the predicted flood hazard levels of “High” and “Very High” as flooded areas. Moreover, the flood hazard map derived by WZSAHP-RC demonstrated greater consistency in the flooded districts filtered by Baidu News than the pixel-based AHP. It revealed that considering two- or even multi-dimensional homogeneity may help to improve the accuracy of flood hazard maps on a catchment scale.
1. Introduction
Flooding is a common phenomenon occurring worldwide, related to climatic conditions, geography, the environment, human activities, and other factors. Flooding is a natural event with great destructive power and a common challenge for human society [1,2]. The underlying surface is a formation environment for floods, and it is also the leading site for human activity. As economic development and urbanization are promoted, more surfaces that were previously natural are being replaced by impermeable surfaces. The increase in impervious surfaces may cause an increase in the surface runoff and a decrease in the time between the start of a flood and the flood peak [3]. These adverse hydrological effects may cause an increase in extreme rainstorm events in the future. Continuous excessive rainfall will cause the water level of rivers, lakes and reservoirs to rise sharply, bringing severe threats to flood-prone areas [4].
China is one of the countries frequently disturbed by flood and waterlogging events. It was reported that 641 out of 654 Chinese cities were exposed to frequent floods [5]. Taking China’s third largest catchment—the Yangtze River, as an example, the areas in the middle and lower reaches of this estuary experience plum floods every spring. In 2020, there were five floods whose discharge or water level reached the flood warning level for the Yangtze River. In the flood season of July 2020, seven floods occurred across several provinces. According to the Ministry of Emergency Management of China, as of 13 August 2020, the floods had affected 63.46 million people and caused a direct economic loss of 178.96 billion CNY [6]. Different human settlements might experience an extra loss level in the same hazard [7]. The combination of climate change and increasing urbanization brings tremendous challenges to planning and managing cities for sustainability [4]. Meanwhile, the feedback loop of flood protection and awareness in communities affects their planning and development in the long term [8]. To mitigate urban floods, accurate flood hazard estimation corresponding to patterns of urbanization is a policy objective.
Flood hazard distribution is the dominant factor in flood risk estimation. Compared with the aim of flood risk mapping to identify the exposures of communities and socio-economic places in extreme rainfall events, flood hazard maps focus on the flooded area distribution determined by natural features, such as flow converging, geological permeation, and under-lying surface storage space. AHP is a typical multi-objective-decision-making method widely used in flood hazard estimation. Models, such as analytic hierarchy process (AHP) [9], Bayesian models [10], fuzzy comprehensive evaluation [11,12], and hybrid models between bivariate statistical [13], artificial neural networks and boosting algorithms [14] have been deployed in flood hazard estimation. Bayesian models need measurements and statistical data from historical flood events. Fuzzy methods and swarm intelligence can be supervised classifications, but need samples from historical flood events. Flood hazard estimation via the AHP method does not rely directly on historical records, and it has the advantage of being easy to use and accurate.
The essential flood hazard estimation via AHP describes the individual heterogeneity features of under-lying surface areas [15,16]. As the geology information system (GIS) develops, flood hazard estimation can detail flood hazards involving pixel-scale indicators. For example, Abdouli et al. [17] adopted AHP to map the flooding potential on the Arabian Gulf coast using data that include land use, soil type and antecedent moisture. Wu et al. [18] estimated flood vulnerability via AHP using rainfall intensity and duration, elevation, slope, land use, and population density. However, these pixel-based AHP are difficult, considering terrain connectivity thus leading to the possibility of ignoring flood hazard consistency caused by neighborhood pixels.
A watershed is a natural terrain edge of water converging through the terrain. Sub-watershed reflects a group of pixels with common flow paths to combine rainwater to the same outlet (e.g., rivers, lakes, and wetlands). As in the hydrology and hydrodynamic model, a sub-watershed was usually considered a basic unit, such as SWAT, SWMM, etc. However, these models always rely on detailed input parameters (e.g., rainfall, evaporation, topography, soil, river, and drainage information), are computationally demanding, often simulate the specific rainfall-flood process, and are widely used in flood forecasting. For flood hazard estimation, especially in data-scarce or large-scale areas, the detailed parameters of the hydrology/hydrodynamic model desired cannot be satisfied.
During a flood event, the continuous rainwater converging along the flow path can be considered source flooding, bringing similar threats to pixels at sub-watershed scales [3]. The flood hazard of cells is more dependent on the maximum risk level of neighborhood cells on a sub-watershed scale rather than the individual terrain features or hydrological characteristics of each cell [19]. Therefore, using sub-watershed as a basic unit to estimate flood hazards may consider the hydrological influence introduced by adjacent pixels. Thus, it may increase the estimation accuracy of the flood hazard map.
This study aims to present a new flood hazard estimation method of using the sub-watershed as a constrain unit to express the homogeneity of flood hazards introduced by a group of converging pixels. The proposed model, termed WZSAHP-RC, adopts multiple flow directions (MFD) derived sub-watershed [20] as a basic unit to constrain runoff, converging related indicators by the maximum zonal statistical method, while other hydrological-formation indicators are also calculated by pixels. Taking the Chaohu basin of Anhui, China, as an example, the flood hazard maps derived from the proposed model were validated by the flooded areas extracted from remote sensing images captured during a real-world flood event in July 2020. Furthermore, the influences of using single flow direction and multiple flow direction algorithms to delimitate a sub-watershed and the adopting minimum area threshold for a sub-watershed were also discussed.
This paper is organized as follows: In Section 2, the primary data sources and the methodology will be described. Subsequently, the results and the significant findings are presented in Section 3. Then, the influence of sub-watershed delimitation methods and function constraining factors of the proposed model will be discussed in Section 4. At last, some conclusions and the limitations of this study are provided in Section 5.
2. Materials and Methods
2.1. Study Area
The Chaohu basin is in the range of Anhui province, China. It is located at the intersection of the Yangtze River catchment and Huaihe River catchment, draining rainwater from the upstream Huaihe River to Chaohu and finally flowing into the Yangtze River. This study selected 11 counties surrounding Chaohu Lake to analyze the flood hazard distribution (Figure 1). These chosen districts implemented a 10-km buffer analysis to avoid the many small-scale sub-watersheds occurring at the edge of specific areas. The boundary was considered the range of the study area.
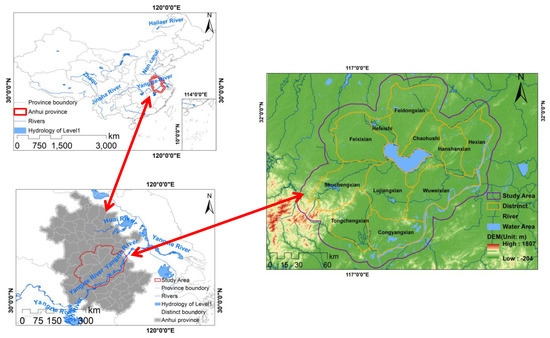
Figure 1.
The geographical location of the study area and the DEM of the study area (according to the China basic geographic information, 2008 version).
The terrain surrounding the Chaohu basin is characterized as a “butterfly” pattern, which leads to most areas along with the water system of the Chaohu basin having a high possibility of flooding every flood period. The terrain of the Chaohu basin contains five major terrain types: low mountains, hilly land, hill land, plains (lakeside and wavy plains) and water areas. The elevation in the northwest and southeast is higher than in other areas of the study area; the middle region has a relatively lower elevation than other areas. Lujiang city and Wuwei city are at relatively lower elevations. Therefore, they are exposed to a high risk of flooding. Improving the accuracy of flood hazard estimation in the Chaohu basin will support future flood risk management and thus help protect the local economy.
2.2. Materials
Primary data sources and their detailed information are presented in Table 1. The geographic information system (GIS) vector map of specific and hydrological information was used in this study. The digital elevation model (DEM) data were used to divide sub-watersheds and calculate slopes. The impermeable surface products were used to extract land-used type and hydrological infiltration information. The images include the SAR (synthetic aperture radar) image of the GF-3 and the optical image of the Landsat 8 OLI image. The GF-3 captured on 24 July 2020, was used to extract flooded areas. The Landsat 8 OLI image shot on 20 July 2020, was used to extract former flood areas. Moreover, the flooding information searched in Baidu News was used to construct the validation of flooded towns and villages. The final used tiles of impervious surface production and the validation dataset were described as in Appendix A.

Table 1.
The main data materials used in this study.
- GIS Vector maps—Geographic information. This study used the vectorized county and town boundaries released in 2008. The administrative districts served as geographic constraints to filter Baidu News flood reports. The hydrological layers, including rivers, streams, and lakes (levels 1 to 5), were compared with water bodies classified from images.
- DEM—ASTER GDEM V2 dataset. The DEM dataset adopted is ASTER GDEM V2. This study area covers a total of nine scenes. The horizon resolution of the DEM dataset is 30 m, and the vertical resolution is 1 m. The projection is WGS_1984_UTM_Zone_50N. As shown in Figure 1, the range of elevation was −204~1807 m, and they were the original value of DEM in the study area.
- GRID of Remote sensing production—Land information. This study adopted China’s impermeable surface grid product (2 m) [21]. The 18 tiles for Hefei, Luan, Anqing, Wuhu, Maanshan, Chuzhou, and Huainan cities were used to prepare the land use and hydrological indicators.
- Images—Extracting flooded area. As remote sensing develops, more and more images of multiple spatial resolutions, considerable time, multiple angles, and multiple carrying platforms can be used for urban underlying surface observation [22]. The flooded areas extracted from remote sensing images can construct the flood hazard ground-truthing dataset. This study collected the used optical image of Landsat 8 OLI of 30 m resolution shot on 20 July 2020, and the SAR of GF-3 Fine Stripmap II (FSII) model of 10 m resolution shot on 24 July 2020. The pre-processing of Landsat 8 OLI was performed in ENVI 5.3, and included radiometric calibration, and atmosphere correction; the water bodies were extracted by the maximum likelihood method. The pre-processing of the GF-3 SAR image was implemented in PolSAR Pro 5.2 and GAMMA and included speckle filtering, radiometric calibration, terrain correction and geocoding. The water bodies in GF-3 were classified basing the threshold segmentation method corresponding to the water bodies in Landsat 8 OLI. The validation experiments were constructed to establish the intersecting area’s ground truth range considering the temporal differences between these two images. The permanent water bodies extracted from China’s impermeable surface product were excluded from the final validation ground truth of the flood areas.
- Baidu News—Filtering flood and dike rupture information. The damage information from floods and dikes of flood events in July 2020 was used to verify the accuracy of the flood hazard estimation in the Chaohu basin. We used an internet context searching and capturing tool named “Octopus” (Available online: https://www.bazhuayu.com (accessed on 20 July 2020)) to collect information from the Baidu News website (Available online: https://news.baidu.com (accessed on 20 July 2020)). The keywords were used to filter Baidu News, including “flood” and “waterlogging”, combined with the names of the county in the range of the study area.
2.3. Methods
The technical workflow used in this study is illustrated in Figure 2. After the primary data sources were pre-processed, the flood hazard criteria were constructed. Moreover, the flood hazard involving indicators grouped by the rainfall-runoff production and the flow converging related indicators were prepared. According to the proposed WZSAHP-RC model, the maximum zonal statistical method will constrain the converging associated indicators. Then, the pixel-based AHP flood hazard index and the sub-watershed-based WZSAHP-RC flood hazard index will be calculated. Then, the two kinds of flood hazard maps will be classified as five levels according to the Nature Break slice method in terms of flood hazard indexes. Finally, the validation process will be implemented.
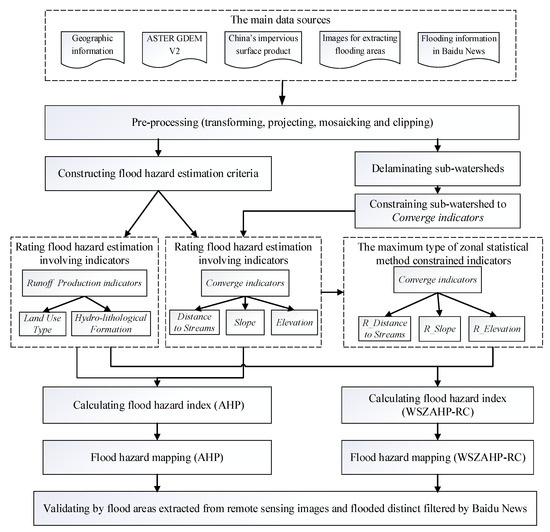
Figure 2.
The overall workflow of our study.
The primary data sources and the pre-processing processes were described in Section 2.2. The proposed watershed-based zonal statistic AHP model will be introduced in Section 2.3. Moreover, to further detail the multiple flow direction algorithm and the single flow direction algorithm influence, the sub-watershed division method based on the D8 and MFD algorithms will be introduced in Section 2.4. Finally, the flood hazard validating approach will be supplied in Section 2.5.
2.3.1. Flood Risk Estimating Method
A sub-watershed is a physical range, and it indicates rainwater converging along a section of a digital stream flowing out through the same outlet. The sub-watershed pixels reflect the same runoff outlet along the common converging path. Moreover, the pixels in a sub-watershed can be considered to share the same storage of surface runoff rainwater at the sub-watershed scale. Therefore, in this study, the sub-watershed was adopted as a basic unit to constrain runoff converging related indicators by the maximum zonal statistical method to consider that the spatial connectivity brought similar flood hazards at the sub-watershed scale. The structure of traditional AHP (Figure 3a) and the flood hazard estimation process among pixel-based AHP (Figure 3b) and the proposed WZSAHP-RC (Figure 3c) are shown in Figure 3.
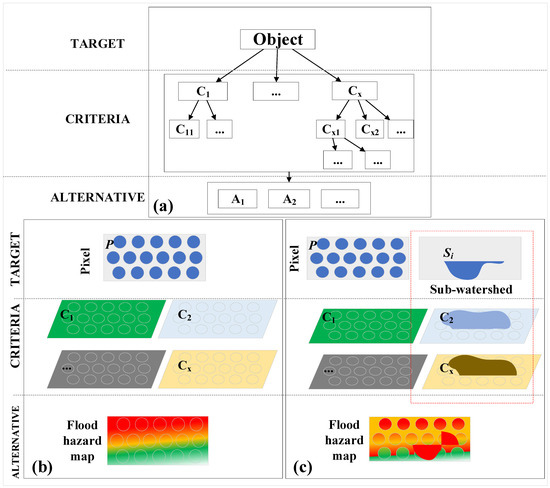
Figure 3.
The logical structure of flood hazard estimation methods: (a) The general structure of AHP, (b,c) are diagrams of ordinary AHP and WZSAHP-RC.
Figure 3a shows the structure diagram of the AHP method, its estimation target is recorded as “object”, and its criteria are , and the criterion can be constructed in multiple layers as needed. The estimating index can determine its final alternative set . The AHP model is widely used in flood hazard estimation to integrate a Geographic Information System (GIS) and remote sensing. AHP is composed of three levels: target, criteria, and alternatives. The target layer refers to the evaluation unit; the criteria (with single or multiple layers) consist of several clusters that reflect different aspects of the target; the alternative is composed of the estimation results set. The AHP-based flood hazard estimation model can be defined as follows:
where matrix represents the pixels in the study area, with a size of , is the flood hazard estimation indicators, and each of the indicators is a raster layer, with a size of .
A comparative matrix of criteria and calculated weights is constructed. According to the AHP model, the positive pairwise comparison matrix usage value 1 to 9 indicates the relative importance of the two indices. Its largest eigenvalue and corresponding eigenvectors can be used as weight vectors to represent the established hierarchic evaluation structure [23]. The hierarchic evaluation structure can be calculated as follows:
where the comparison matrix , with a size of , is used to determine the importance order among criteria (in Equation (1)). is the eigenvector corresponding to the largest eigenvalue of , is the weight vector corresponding to the normalization value of the eigenvector .
The consistency ratio was calculated in Equation (3) to calculate the judgment matrix criteria as logically consistent [23]. The pairwise comparison matrix can be accepted if its consistency ratio is less than 0.1 (a consistency ratio of 0 indicates that the judgment matrix is entirely consistent).
where is the consistency ratio, is the consistency index, is a statistic random index, the average of randomly generated pairwise comparison matrix of similar size, is the largest eigenvalue of the comparison matrix, and is the number of indicators used in criteria.
Figure 3b shows that the common AHP model adopts the pixel as a basic unit. The final estimation index can be calculated by accumulating the pairwise cumulative indices and weights.
Figure 3c is a diagram of the proposed WZSAHP-RC model. The constrain runoff converging related indices, such as Slope, Elevation, and Distance from streams, can constrain sub-watersheds and thus help identify neighborhood hazards using the following formulas:
where is the sub-watershed division raster, is the constraint sub-watershed as a statistical zonal unit, to update the corresponding indicator . The size of is also ; is calculated using the descriptive statistics of indicator for each sub-watershed , is the statistical method including the majority, maximum and median.
The final flood hazard index is calculated using the pairwise cumulative criteria and weights following Equation (6). As the Natural Break method can maintain slight variance within groups and significant variance among indexes, it is widely used to partition the final flood hazard map [15,16,24,25,26]. Therefore, the final flood hazard map can be derived by classifying the flood hazard index into {“very low”, “low”, “moderate”, “high”, and “very high”} by the Nature Break method.
where is the flood hazard index, calculated by the cumulative sum of criteria and its corresponding weight . The criteria can be grouped as the sub-watershed constraint indices and the original indices .
2.3.2. Constructing Flood Hazard Estimation Criteria
This study adopted five indices , where C1 = Slope, C2 = Elevation, C3 = Distance from streams, C4 = Hydro-lithological formations, C5 = Land use type, referring to [25] to construct flood hazard estimation criteria. The former three indicators, the “Slope”, “Elevation”, and “Streams”, affect the path of rainwater runoff convergence. They reflect the geological flood hazard factors. The “Hydro-lithological formations” and the “Land-use type” affect infiltrability and the roughness of the underlying surface. Thus, the “Hydro-lithological formations” and the “Land-use type” are grouped as runoff production indicators. As in AHP-based flood risk estimation, the weighting definition would influence the accuracy of the final flood hazard distribution. Ekmekcioğlu and Koc et al. [11,12,27] adopted the fuzzy-AHP to increase the reasonable weighting definition. The comparison matrix defined, referred to [25], as shown in Table 2.
Table 2.
The judgment matrix of criteria. C1 = Slope, C2 = Elevation, C3 = Distance from streams, C4 = Hydro-lithological formations, C5 = Land use type.
In the judgment matrix, the maximum eigenvalue is = 5.133. As the criteria number is 5, the obtain random index value is as = 1.12 from a lookup table. Thus, the consistency index of the judgment matrix is: . Therefore, the final consistency ratio can be calculated as . Since the value is less than 0.1, the judgment matrix used to derive the weight matrix can be accepted. The process of weighting criteria is calculated as:
where is the matrix of used flood hazard estimation criteria. The corresponding indicators are: , is the flood risk index, is the judgment matrix comparing between two indicators, and the weight vector is calculated according to Equation (2).
As in the WZSAHP-RC model, the descriptive statistics were calculated based on the value of runoff converging indices, including “Slope”, “Elevation”, and “Distance from streams”. Moreover, the flood hazard index can be expressed as:
where is the flood risk index, is weight, is the criteria as defined according to Equation (7), is the criterion calculated using the descriptive statistics values of the sub-watershed , according to Equation (5).
2.3.3. Rating Flood Hazard Estimation Involving Indicators
The original flood hazard estimation involving indicators needs to be rated uniformly. The values of “Slope” and “Elevation” are numeric, with a natural pattern distribution. Therefore, the natural break method reclassified these two indicators into uniform classes. The value of “Land-use type” and “Hydro-lithological formation” are category words. They were ranked according to the infiltration and rainfall-runoff production ability corresponding with levels of 1–5. The “Distance from streams” adopted specific ranges of Euclidean distance from streams to represent flood hazard levels. The ranked flood hazard estimation indicators are listed in Table 3.
Table 3.
The classes and rating of factors in flood hazard estimation.
- Slope. The slope is the main factor influencing the rainwater flow path. The slope range is 0°–81°, classified as six classes by the Natural Break method, the angles (°) of “0”, “0–2”, “2–6”, “6–12”, “12–20”, and “>20” were labeled as 5, 4, 3, 2, 1 and 0, respectively.
- Elevation. The elevation influences flood risk distribution. It seems that cells with low elevation are highly likely to suffer flood hazards. The elevation range is −204–1490 m, they were classified into five types by the Natural Break method, the elevations (m) of “−204–12”, “12–23”, “23–46”, “46–152”, and “>152” were labeled as 5, 4, 3, 2 and 1, respectively.
- Distance from streams. Streams are the source of flood risks. The distance from streams reveals the potential risk. In this study, the streams were extracted using the D8 algorithm, and the stream levels were labeled by the STRAHLER method. For specific streams, far away cells had lower flood risks than nearby cells. According to Table 3, six types of distance from streams were defined, including the water bodies ranked into five classes, and the distance from streams of levels 1–5 were classified as 0–4.
- Land use types. The land-use types determine the rainfall-runoff production. The ranked vegetation, soil, building, road and water were 1, 2, 3, 4 and 5, respectively.
- Hydro-lithological formations. The hydro-lithological formations influence the infiltration performed by rainfall-runoff production. Hydro-lithological formations were grouped by water, impervious surface, and permeable surface, and they were rated as 4, 3, and 1, respectively.
2.4. Watershed Delaminating
2.4.1. Pre-Processing DEM for Watershed Division
A DEM was the primary data used to derive the watersheds but needed to be enriched with hydrological information before delaminating the sub-watersheds. Kenny et al. [28] found that integrating hydrological streams with a DEM can improve the accuracy of extracting digital drainage. Zhang et al. [29] pointed out that delimiting a watershed and constraining a DEM by water bodies can reduce the uncertainty created when calculating water flow direction. Thus, hydrological features, including streams, rivers, and lakes, were used to update the elevation in a corresponding cell of a DEM.
Hydrological features can be recognized by their shapes. Constructed water bodies, such as rice paddies and ponds always have regular symmetrical shapes. Naturally occurring hydrological elements, such as lakes and even artificial elements, such as reservoirs, always extend along a terrain. The bodies of these hydrological elements are irregular and with long perimeters. Other hydrological features, such as streams, rivers and ditches always have long flow paths, so their shapes appear as long and narrow rectangles. Therefore, the defined natural water body index termed Steady Water Index (SWI) is expressed as Equation (9) to identify hydrological features. For example, since their shapes are like long and narrow rectangles, and river and stream elements, when the value SWI is 200, the ratio of the longer edge and the shorter edge is approximately 10,000. This ratio can represent most rivers and streams.
where is the steady water index. The and are the perimeter and area of the water bodies, respectively. Referring to the study area, it suggests the value of SWI should be set as between 6 to 200. At the same time, the water area threshold is also used to identify hydrological features. As the minimum area of lakes in the study area is about 70,000 m2, the water polygons with a spatial coverage larger than 78 cells (as pixel resolution is 30 m, this is about 70,200 m2) were regarded as natural water elements.
2.4.2. Delaminating Sub-Watershed by D8 Algorithm
The D8 algorithm is a typical single flow direction (SFD) method in the watershed division. It is termed via its theory of using the maximum drop of elevation from the neighborhood of eight pixels to obtain the candidate flow outlet of central pixels. Then, the flow accumulation can be determined through the single flow path. Moreover, the sub-watershed was divided by the minimum area threshold according to the accumulation value of flowing pixels.
The hydrology tool in ArcGIS 10.3 is based on the D8 algorithm and was used to segment sub-watersheds in this study. The area threshold of the sub-watershed is a vital parameter in defining watershed schemes. According to Baidu News, the threshold was determined according to the area of flooded parcels. The threshold of 200 hectares (ha) was marked according to the report from the network of China Radio [30], “The Wuwei county released flood water to village parcels with the area of smaller than 30,000 mu (~200 hectares) along dikes”. The threshold of 667 ha came from Xinhua news [31], “Hefei city flooded nine village parcels with the area of larger than 100,000 mu (~667 hectares) along dikes”. There were six area thresholds defined in the sub-watershed division, as shown in Table 4:
Table 4.
Area threshold used in delimitation watersheds via D8 algorithm.
As shown in Table 4, four kinds of area thresholds were defined according to the area threshold of 667. Two types of area thresholds were determined according to 200.
2.4.3. Delaminating Sub-Watershed by MFD Algorithm
The multiple flow direction (MFD) algorithm was also used to divide sub-watersheds. Thus, the influence of flood hazard estimation introduced by sub-watershed division derived by SFD and MFD can be compared.
MFD determines the flow direction according to elevation drops between a target cell and adjacent cells. If there are several alternative outflow directions, MFD will choose them as the outlets and distribute the flow accumulation by calculating the average water value of the central cell. The MFD algorithm may reduce the randomness when setting the flow direction as one of the potential outlets in flat areas. The MFD algorithm calculates flow direction as Equation (10) and derives sub-watershed by tracing the flow-in cells.
where is the flow direction of the current cell, it records the potential flow directions in a continuous value between 1–255 by accumulating the potential flow directions; is the index of the eight adjacent cells, starting from the east, southeast, west, and so on, in a clockwise order; is the elevation of the central cell; is the elevation of the adjacent cells.
The MFD algorithm traces the connected flat cells and sets them as the seed of a new sub-watershed. Searching the seeds from the sink areas, all the pixels flowing into the seed cells will be defined as belonging to the same sub-watershed. The scope of a certain sub-watershed will grow until the size is larger than the area threshold, and then the cells will be recorded as a new sub-watershed. Thus, the algorithm can keep the connected flat cells in the same sub-watershed, while the area threshold will determine the sub-watershed of the in-flowing neighborhood cells. The MFD algorithm was programmed by C#, and the sub-watershed delimitation result by the MFD algorithm is submitted as in Supplementary Materials.
2.5. Flood Risk Validating Method
In this study, the accuracy of flood hazard estimation results derived from the proposed model was quantitatively evaluated by flooded areas extracted from the GF-3 and Landsat 8 OLI images. The flood hazard estimation is always a five classify issue. Each pixel in the study area is ranked as one of the elements in the level set {“very low“, “low”, “moderate”, “high“, and “very high”}. Then, the five flood hazard levels were classified into two groups: the positive and the negative groups. Moreover, for each pixel where its flood hazard belongs to the positive group; it will be considered as a predicted flooded pixel. Otherwise, it is regarded as a predicted dry pixel. Following the former literature [32,33], the correct and fit ratios were used to assess flood hazard estimation accuracy. The correct ratio and fit ratio are calculated as follows:
where is the correct ratio, and is the fit ratio. represents the pixels considered as predicted flood areas. represents the ground-truthing flood areas extracted from GF-3 and Landsat 8 OLI images.
The definition of flood hazard positive and negative groups is a critical process for constructing a validation dataset. From the view of classification, this definition means determining the classification threshold. This study defined two kinds of positive group and negative group, as follows:
- ➢
- Validation 1: {positive group: “very high”, “high”, “moderate”;negative group: “very low”, “low”};
- ➢
- Validation 2: {positive group: “very high”, “high”;negative group: “very low”, “low”, “moderate”}.
To further distinguish the flood hazard estimation result from the better-matched validation group, the F1-score is additionally used as an indicator. The F1-score is used to distinguish the combined accuracy among the used methods. The F1-score is a comprehensive indicator in binary segmentation problems. More excellent classification usually has a higher value of F1-score in binary segmentation problems. Moreover, the value of the F1-score is expected to be 0.6~0.8 or higher. It can be calculated according to Equation (13):
where is the F1-score, is the precision rate, is the recall rate, is the cells with truthing status predicted as positive in the validation dataset, is the cells with false status expected as positive in the validation dataset, and is the cells with false status predicted as negative in the validation dataset.
The flood hazard estimation is a five-type classification issue. Its comparison matrix was constructed following Table 5. As in large-scale flood hazard estimation, the ratio of predicted flood area is always small compared with the range of study area. Moreover, in this study, the proposed method considered the flood hazard level of all the water areas (the normal range of transport and storage water, such as rivers, lakes and so on) was “very high”. In order to focus on the estimation of the consistency of predicted flood hazard pixels with the ground-truthing flood areas, the validation ground-truthing dataset was constructed by excluding the pixels of normal water body range in rivers, lakes, ponds, and reservoirs. The excluded water bodies were identified according to Equation (9).
Table 5.
The classes and rating of factors in flood hazard estimation.
It is known that the precision, recall, and F1-score indicators in Equation (13) were widely used in the estimation binary segmentation classifier. Moreover, the correct ratio (shown in Equation (11)) and the fit ratio (shown in Equation (12)) were widely used indicators reflecting the flood hazard estimation accuracy. It can be found that both correct ratio and fit ratio focus on the estimation of the consistency of predicted flood areas with the ground-truthing flood pixels. Moreover, the correct ratio is the same as the recall indicator (the R in Equation (13)):
As in flood estimation, precision is important, but the value of recall is more important. Moreover, the fit ratio can be expressed as Equation (15), which can reflect the overestimation of predicting flood pixels.
3. Results
This session describes the experimental results, including the sub-watershed division results and the flood hazard map derived by the proposed method.
3.1. The Sub-Watershed Derived by DEM Using MFD and D8 Algorithms
In this paper, the hydrology layer collected in geographic information (1:1 million) was used to burn in DEM. Using the hydrology information enforced DEM, the raster of sub-watersheds can be delimitated via the MFD and D8 algorithms (Figure 4).
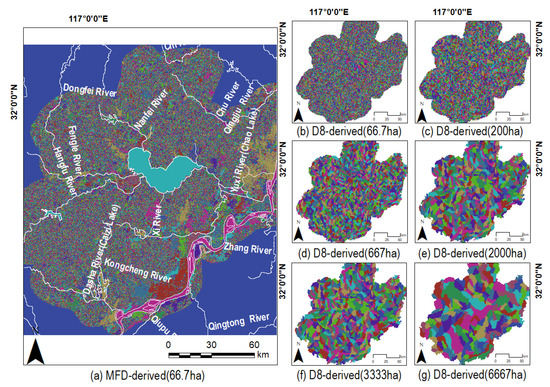
Figure 4.
The sub-watersheds derived via MFD (a) and D8 (b–g). The area threshold used in the MFD-derived subwatershed is 66.7 ha, and the area thresholds used in the D8-derived subwatershed as shown in (b–g) are 66.7 ha, 200.0 ha, 667.0 ha, 2000.0 ha, 3333.0 ha and 6667.0 ha, respectively.
In Figure 4a, the MFD algorithm used to delimitate sub-watersheds was programmed by C#. The MFD algorithm adopts pixels in sink areas as seeds, traces the flow direction raster and identifies all the converging pixels consisting as a whole of sink areas. When delimitating sub-watersheds, all the pixels in the sink area and those pixels in the eight directions flowing towards to sink areas would be kept in the same sub-watershed as the sink area. Otherwise, the converging pixels would be classified as several sub-watersheds according to the flow order adjacent to the labeled sub-watershed in the same sink area. In this study, the maximum area threshold of the MFD algorithm adopted 66.7 ha to delimitate sub-watersheds.
The sub-watersheds produced by the D8 algorithm with different area thresholds were mapped in Figure 4b–g. The hydrological tool of ArcGIS 10.3 is programmed basing the D8 algorithm. The hydrology tool was used to delimitate sub-watersheds. The main process contained calculating flow direction, calculating flow accumulation, extracting stream, making stream link, and delimitating sub-watersheds. The definition of area threshold determines the process of extracting the stream. Only pixels with an area of flow accumulation larger than the area threshold will be extracted as separate streamlines. The streamline would identify the sub-watersheds derived stream link while considering the stream links as pours. In this study, the used area thresholds in Figure 4b–g were 66.7 ha, 200.0 ha, 667.0 ha, 2000.0 ha, 3333.0 ha and 6667.0 ha, respectively.
As in Figure 4a, the flat area, especially the water bodies, was kept in the same sub-watershed. This indicates that the MFD algorithm can keep connecting flat areas as a whole. While in the D8 algorithm, all the flat areas and water bodies were treated as pixels to divide sub-watershed. The defined area threshold represents the maximum number of pixels converging in upstream water. Thus, as in Figure 4b–g, the flat area, the water areas and corresponding connected neighborhood pixels were sliced as sub-watersheds, and most of the sub-watershed areas seemed to be similar. Moreover, as the area threshold increases from Figure 4b–g, the number of sub-watersheds was reduced.
3.2. The Flood Hazard Map Derived by the Proposed Method
The actual flood areas (Figure 5a), the flood hazard map derived by the proposed method (Figure 5b), and part of the detailed flood area distribution (Figure 5c,d) were shown in Figure 5. Especially for the detailed flood area, the overlayer vector map of flooded towns and villages is filtered from Baidu News. Furthermore, Table 6 listed the comparison matrix of elements corresponding to flood areas, and dry areas with predicted flood hazard pixels.
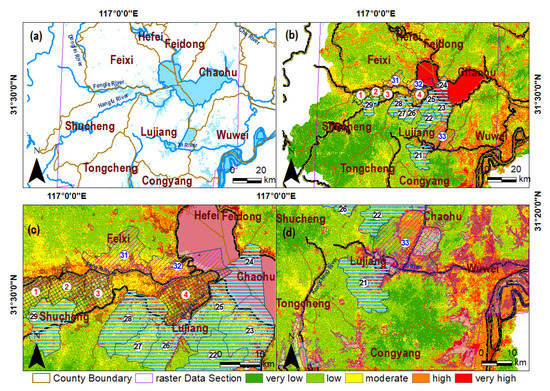
Figure 5.
The flood hazard distribution is derived from the proposed method. Subfigure (a) was the real-world flooded areas extracted by remote sensing in July 2020 in the Chaohu basin. Subfigure (b) was the flood hazard distribution estimated by the proposed model. Subfigure (c) was the detailed hazard view of the Fengle river and the Hangfu River, and subfigure (d) was the clear hazard view of the Xi River.
Table 6.
The comparison matrix and correct ratio, fit ratio, F1-score of flood hazard and flooded areas distribution.
Table 6 demonstrated that when considering the flood hazard pixels of {“very high”, “high”, and “moderate”} derived by the proposed method as Positive results, the Correct ratio, Fit ratio and F1-Score were 87%, 43%, and 0.597, respectively. When considering the flood hazard pixels of {“very high”, and “high”} derived by the proposed method as a Positive result, the Correct ratio, Fit ratio and F1-Score were 60%, 35%, and 0.523, respectively. Moreover, according to the F1-score, the flood hazard estimation result using validation 1 has higher consistency with flood areas extracted by remote sensing images.
As shown in Figure 5a, there were plenty of flooded areas near the north beach of the Fengle River in Feixi city. There were flooded areas distributed at the south beach of the Fengle River and the north beach of the Hangfu River in Shucheng city. Moreover, the flooded regions of Lujiang city were located in the south part of the Hangfu River and Xi River. Moreover, the flood areas of Wuwei city were scattered in the northern region of the Xi River. Moreover, in the northwest of Chaohu, there were some flooded areas near the Nanfei River in Feidong county. In the northeast of Chaohu, there was some flooded area near the Tuohao River in Chaohu city.
Figure 5b–d shows flooding hazard distribution overlayered by breaking points, flooded town/villages, or actively flood areas, which were searched from Baidu News. Moreover, as in Figure 5b–d, the breaking points corresponding to the towns were 1—Taoxi town, 2—Bolin village, 3—Qianrenqiao town, and 4—Tongda town. Moreover, in the area of the flooding point, the related towns were 21—Nihe town, 22—Yefushan town, 23—Shengqiao town, 24—Zhongmiao street, 25—Baishan town, 26—Shitou town, 27—Jinniu town, 28—Guohe town, and 29—Chengguan town. Moreover, in the active flood area, the corresponding towns were 31—Union dike of Shatan, Fengle town, 32—Union dike of Binhe & Union dike of Jiangkouhe, Sanhe town, and 33—Union dike of Peigang, Baihu town.
As shown in Figure 5c,d, the flood hazard map derived by the proposed method almost covered the areas, including the active drainage areas (No. 31, No. 32, and No. 33), the dike broken areas (No. 1, No. 2, No. 3, and No. 4), and the under submerged flooded areas (No. 21~No. 29). The flood hazard map derived by the proposed method contained part of the flooded district. The phenomenon indicated that the proposed method had higher consistency with flooded areas caused by broken and active drainage than natural flooding areas.
3.3. The Flood Hazard Distribution via AHP and the Proposed Models
The flood hazard distribution derived by pixel-based AHP and sub-watershed-based WZSAHP-RC were illustrated in Figure 6.
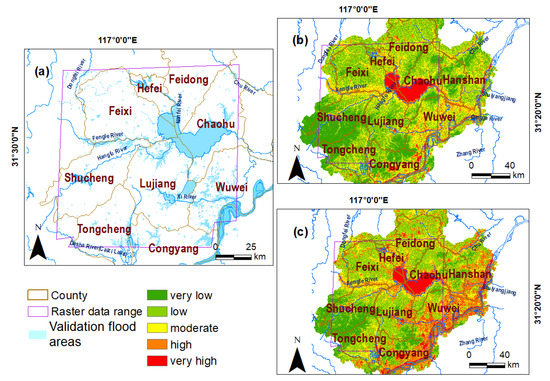
Figure 6.
Differences in ground-truthing flooded areas compared with expected flooded areas from the AHP and the proposed model. (a) was the distribution of validation flood area, (b) was from the original pixel-based AHP, while (c) was from the proposed model.
Compared with the flood hazard map derived by AHP (Figure 6c), the areas were classified as higher hazards via the proposed method (Figure 6b), especially those pixels located along the Fengle river, the Hangfu river, the Zhao river, and the Yangtze River. Moreover, in the areas near the north beach of the Yangtze River, the flood hazard levels derived by the proposed model were higher than the AHP model.
Table 7 listed the validation results of Correct ratio, Fit ratio, and F1-Score derived by AHP and WZSAHP-RC models. Compared with the AHP model, when considering pixels of “very high”, “high”, and “moderate” as predicted flooding areas, the correct ratio and fit ratio calculated by the WZSAHP-RC model increased by 16% and 6%, respectively. Moreover, when considering pixels of “very high” and “high” as predicted flooding areas, the correct ratio and fit ratio calculated by the WZSAHP-RC model were increased by 34% and 17%, respectively.
Table 7.
The correct ratio, fit ratio and F1-score were calculated by the pixel-based AHP method and the proposed sub-watershed-based WZSAHP-RC method.
3.4. The Flood Hazard Results Estimated by Constraining Different Converging Indicators
Figure 7 mapped the flood hazard map derived by AHP (Figure 7a) and WZSAHP-RC using MFD-derived sub-watersheds (Figure 7b–m).
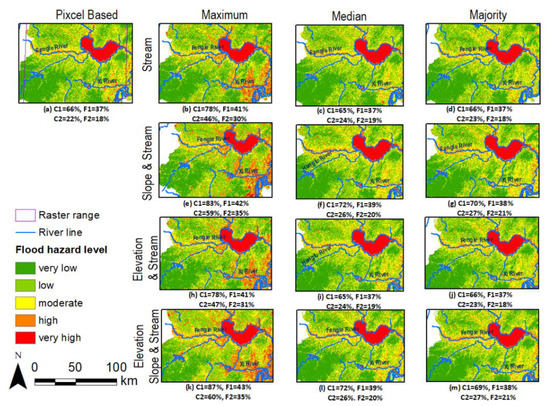
Figure 7.
Flood hazard levels from pixel-based AHP (a), while (b–m) show flood hazard levels derived by WZSAHP-RC using different indicators and zonal statistics.
The C1 and F1 represented the correct ratio and fit ratio considering “very high”, “high”, and “moderate” as predicted flooded pixels, and the C2 and F2 represented the correct ratio and fit ratio considering “very high” and “high” as predicted flooded pixels. The range of permanent water bodies was colored blue. The flood hazard levels from low to high were colored with dark green, light green, yellow, orange, and red. For the subfigures of WZSAHP derived flood hazard maps, those in the same row constrained the same kinds of indicators (including {“Distance from Streams”}, {“Slope”, “Distance from Streams”}, {“Elevation”, “Distance from Streams”}, {“Elevation”, “Slope”, “Distance from Streams”}). The sub-figures in the same column adopted the same zonal statistical method (e.g., maximum, median, majority), e.g., Figure 7b–d used the MFD-derived sub-watershed to constrain the “Distance from Streams” by the maximum, median, and majority zonal statistical methods, respectively.
As in Figure 7, when using the maximum type of zonal statistical method via the MFD-derived sub-watershed to constrain all kinds of combinations of converging related indicators, the correct ratio and fit ratio could keep being increased, considering {“high”, “very high”, “moderate”} or {“very high”, “high”} as predicted flooding areas.
Using the sub-watershed derived by MFD as a basic unit to constrain different kinds of converging indicators, we obtain the other distribution of the flood hazard index. Figure 8 shows the combined curve plots and bar graphs relating the AHP and the WZSAHP constrained sub-watershed to various converging indicators.
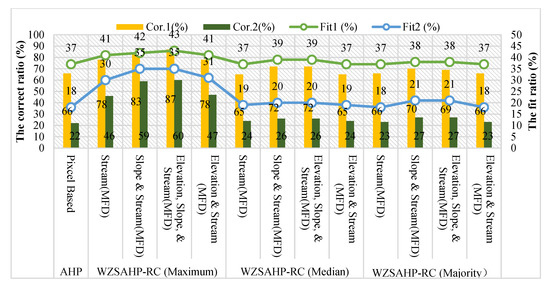
Figure 8.
The correct ratio and fit ratio values of pixel-based AHP and sub-watershed-based WZSAHP-RC models constrain different kinds of converging related indicators.
As shown in Figure 8, the quality estimation correct ratio and fit ratio demonstrated that all the used constrain sub-watershed-based indicators via the maximum zonal statistical method could be improved. Moreover, for the median and majority zonal statistical methods, the correct and fit ratios derived by the WZSAHP-RC model via the constraining sub-watershed to {“Distance from Streams”}, {“Slope”, “Distance from Streams”}, {“Elevation”, “Distance from Streams”} or {“Elevation”, “Slope”, “Distance from Streams”} had a higher value than pixel-based AHP model. As in maximum, median, and majority zonal statistical methods, it could be observed that the correct ratio and fit ratio would be higher as the constraining indicators contain the “Distance from Streams” indicator. This phenomenon demonstrated the proposed WZSAHP-RC model—using MFD-derived subwatershed as a basic unit to constrain converging related indicators will steadily improve the flood hazard estimation correct ratio and fit ratio.
Figure 9 demonstrated the distribution of the flood hazard index calculated by pixel-based AHP and sub-watershed-based WZSAHP-RC. All the subfigures in Figure 9 mapped the scatter points (X, Y) in terms of the index of flood hazard indexes . The represented flood hazard index is calculated by the WZSAHP-RC model, and the represented flood hazard index is derived by the AHP model.
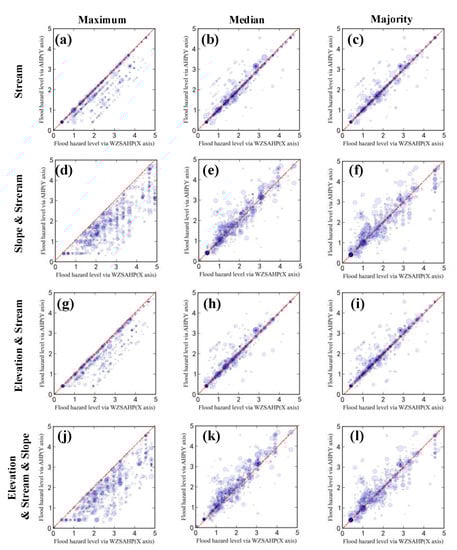
Figure 9.
Scatter diagrams of flood hazard index derived by WZSAHP-RC via MFD delimitated sub-watershed as X-axis and flood hazard index derived by AHP as Y-axis. The converged indicator in (a–c), (d–f), (g–i), and (j–l) were the same, and the sub-figures in the same column used the same type of zonal statistical method.
The scatter diagrams used the water areas extracted by remote sensing images as truth values to filter the flood hazard index’s raster values. Moreover, the subfigures were sampled using a moving grid window with a size of to obtain the values at the range of the column and row of water areas. Moreover, the unique index points were used to obtain the value of the flood hazard indexes. The scatters diagrams were drawn using a transparent circle with a variable radius , which adopted 0.1 as the value of transparency and used two times the number of pair points having the same values as the variable radius.
For the influence of the zonal statistical method, as shown in Figure 9 the scatter distribution pattern of using median and majority types of zonal statistical methods seemed to be similar. The same results could be observed. Only in the subfigures of flood hazards estimated using the maximum zonal statistical method (Figure 9a,d,g,j), all the scatter points were distributed on the lower diagonal side, and this indicated that the WZSAHP model using a maximum zonal statistical method to constrain converging related indicators would increase the flood hazard index.
For the influence of constraining indicators, it indicated that as constrained “Stream or Elevation & Stream”, the scatter points distribution in all kinds of zonal statistical methods seemed to be more concentrated than restrained {“Slope”, “Distance from Streams”} or {“Elevation”, “Slope”, “Distance from Streams”}. Therefore, the spatial distribution of sample points demonstrated that the WZSAHP-RC constrained by {“Slope”, “Distance from Streams”} or {“Elevation”, “Slope”, “Distance from Streams”} would perform better in distinguishing flood hazard index, which means they might have a higher correct ratio and fit ratio. This phenomenon indicated that the efficient method needs to map a higher flood hazard index and make the flood hazard index distribution a dispersing pattern.
3.5. The Flood Hazard Results Estimated by Using D8-Derived Sub-Watershed with Different Area Thresholds as Basic Units
The flood hazard maps derived by AHP (Figure 10a) and using WZSAHP-RC via D8-derived sub-watersheds using different kinds of area thresholds (as listed in Table 3) were illustrated in Figure 10b–s.
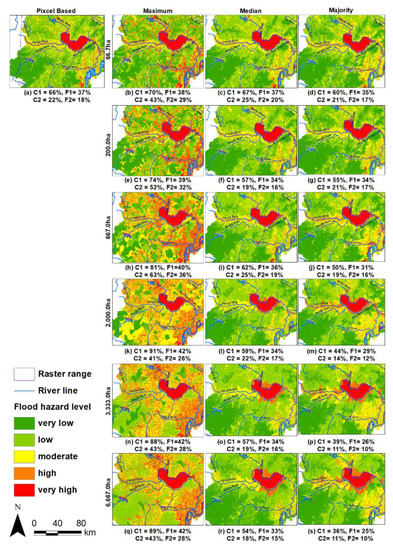
Figure 10.
Flood risk levels from pixel-based AHP (a) and sub-watershed based AHP using D8-derived sub-watershed to constrain converging related indicators, such as Elevation, Slope and Distance from Streams (b–s).
The labeled correct ratio and fit ratio corresponding to the validation 1 of {“very high”, “high”, “moderate”} were recorded as C1 and F1, and the validation 2 of {“very high”, “high”} were marked as C2 and F2, respectively. The range of permanent water and the flood hazard levels were colored as same as in Figure 7.
As in Figure 10b–s, subfigures in the same row adopted the same threshold area, and subfigures in the same column used the same statistical method. Moreover, using the maximum type of zonal statistical method to constrain flood converging related indicators, indicated that the correct ratio and fit ratio could keep increasing, considering {“very high”, “high”, “moderate”} or {“very high”, “high”} as predicted flooding areas.
The flow path and the area threshold determined the final sub-watershed division results. The correct ratio and fit ratio derived by the six kinds of area threshold (as described in Table 4) using the proposed method and D8-derived sub-watershed to constrain “Slope” and “Distance from streams” were compared in Figure 11.
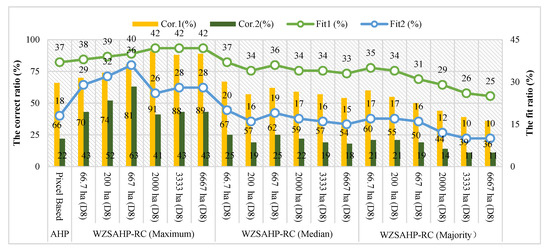
Figure 11.
The correct ratio and fit ratio values of pixel-based AHP and the WZSAHP-RC using D8 derived sub-watershed to constrain converging related indicators.
As shown in Figure 11, while in the validation of considering “high” and “very high” as predicted flooding areas, the inflection point could be observed as the area threshold of 2000 ha. It indicated that the correct ratio and fit ratio derived by D8-based WZSAHP-RC (always using the maximum zonal statistical method) were consistently higher than pixel-based AHP, but the increasing of correct ratio and fit ratio derived by D8-based WZSAHP-RC would be influenced by the definition of area threshold for sub-watershed delimitating. For the median and majority zonal statistical methods, the correct and fit ratios seemed to fluctuate as the area threshold changed.
Figure 12 aimed to distinguish the scatter diagrams of flood hazard index distributions calculated by the AHP and the WZSAHP-RC using the D8 derived sub-watershed as basic units to constrain “Slope” and “Distance from streams” by the maximum, median, and majority zonal statistical methods.
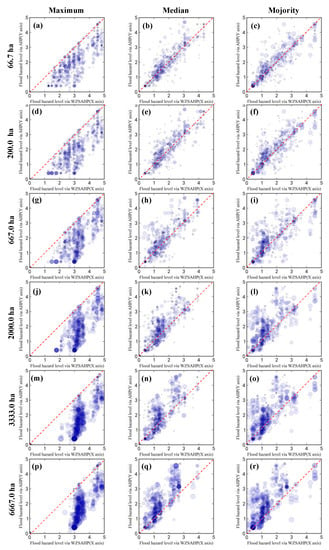
Figure 12.
Scatter diagrams of flood hazard indexes distribution sampled by WZSAHP-RC via D8 delimitated sub-watershed a basic unit (WZSAHP-RC-D8) and AHP methods. The subfigures (a–r) used the flood hazard index derived by WZSAHP-RC-D8 as X-axis and using flood hazard index derived by AHP as Y-axis.
In Figure 12, the scatter point pairs and sampling and mapping methods were the same as in Figure 9. The subfigures in the same row adopted the same area threshold determined sub-watershed as a basic unit. The subfigures in the same column used the same zonal statistical method. For example, as the scatter points in Figure 12a, the represented flood hazard index was calculated by the proposed model using a D8-derived sub-watershed with an area threshold of 66.7 ha, and the represented flood hazard index was derived by the AHP model. The scatter was mapped according to the moving sampling grid window of size via the flood hazard index raster derived by the AHP and WZSAHP-RC methods. Moreover, the converging related indicators were used to derive , which was calculated by the maximum type of zonal statistical method.
As in Figure 12a–i, it could be found that the spatial distribution of sampled point pairs was determined by the zonal statistical method. Moreover, the area threshold in the cluster of 66.7 ha, 200 ha and 667 ha were more similar to each other; in the area threshold defined as 2000 ha, 3333 ha, and 6667 ha, their scatter distribution pattern seemed to be more similar. This phenomenon also revealed that the flood hazard index changing trend using the D8-derived sub-watershed as a basic unit would have a point of inflection. Moreover, this suggested that the use of WZSAHP-RC via the D8-based sub-watershed as a basic unit should take care of the proper area threshold for sub-watershed delimitation.
3.6. The Validation of Using the Global River Widths from Landsat (GRWL) as Streams
The Global River Widths from the Landsat (GRWL) database was the first global compilation of river planform geometry at a constant-frequency discharge [34]. It is highly recognized by academics as a worldwide product. In this subsection, the GRWL was used to construct the “Distance from streams” indicator (Figure 13); additionally, the flood hazard distribution derived by pixel-based AHP and the proposed WZSAHP-RC method were compared (Figure 14 and Figure 15). Moreover, the WZSAHP-RC uses sub-watershed to constrain the “Slope”, “Elevation”, and “Distance from streams” indicators. The used “Slope” and “Elevation” were as same as in Section 3.4 and Section 3.5. Only the “Distance from streams” was constructed according to the vector stream map supported by the GRWL database.
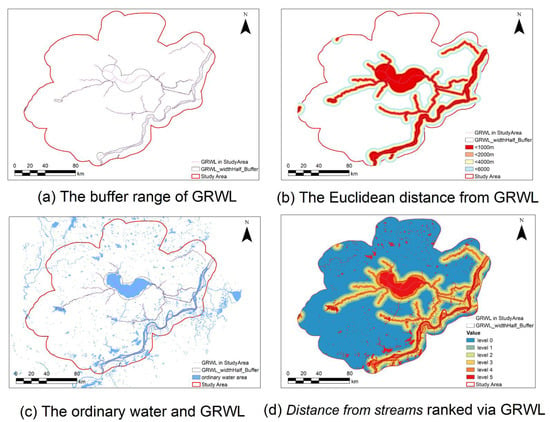
Figure 13.
The GRWL distribution and the GRWL-based Distance from streams indicator in the study area. Figure (a) was the GRWL vectors and corresponding buffer results basing the attribute value of the width, figure (b) was the Euclidean distance from the GRWL buffer border, and figure (c) was the ordinary water bodies overlying the GRWL buffer layer and the ranked “Distance from streams” indicator in figure (d) was derived by GRWL and normal water range.
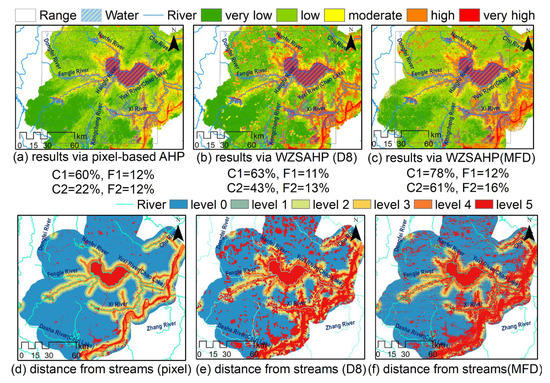
Figure 14.
The flood hazard distribution derived by pixel-based AHP, the WZSAHP-RC using D8-derived and MFD to classify sub-watersheds as basic units. (a–c) were the flood hazard distribution basing pixel-based AHP, WZSAHP via D8-derived sub-watershed, and WZSAHP via MFD derived sub-watershed, respectively. (d–f) were the GRWL derived distance from streams distribution using pixel-based AHP, WZSAHP via D8-derived sub-watershed, and WZSAHP via MFD derived sub-watershed, respectively.
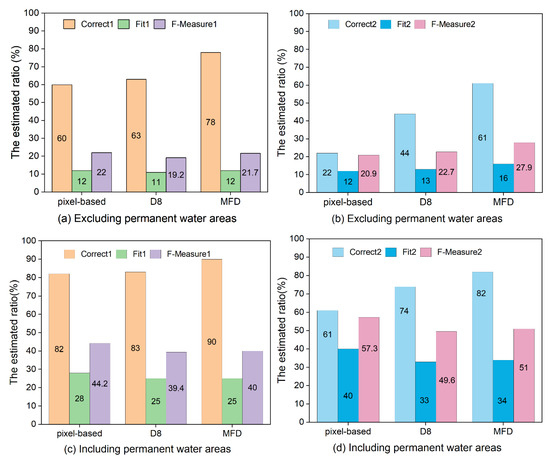
Figure 15.
The correct ratio, fit ratio and F-measure basing the validation dataset excluding permanent water areas and including permanent water areas. (a,b) were the validation ratio using floodwater areas excluding permanent water areas. In contrast, (c,d) was the validation ratio using all water areas on flood days.
The GRWL vector is the shape of hydrology lines, and the width was recorded in the attribute table. The hydrology polygon was constructed using the width’s value to build buffer areas on both sides of the hydrology lines (Figure 13a). Then, according to the ranking definition of the level 5 digital stream in Table 3, the calculation of Euclidean distance from the GRWL buffer range was implemented using distances of 1000 m, 2000 m, 4000 m, and 6000 m, respectively (Figure 13b). The level “Distance of streams” of pixels in the range of regular water areas (Figure 13c) was ranked as 5, and the pixels in the range of Euclidean distance from GRWL of <1000 m, 1000 m~2000 m, 2000 m~4000 m, 4000 m~6000 m, and >60,000 m were classified as 4, 3, 2, 1, 0, respectively (Figure 13d).
Based on the ranked “Distance from streams” derived by GRWL, the flood hazard distribution estimated by pixel-based AHP demonstrated the proposed WZSAHP-RC method using the D8-derived and MFD derived sub-watersheds as units (Figure 14). The validation dataset was constructed as in Section 3.4 and Section 3.5. The correct ratio and fit ratio indicated that the WZSAHP-RC using the MFD sub-watershed as the basic unit (Figure 14c) performed better than using the pixel-based AHP (Figure 14c) and the WZSAHP-RC using the sub-watershed derived by D8 as units (Figure 14c). Figure 14d–f was the used distance from streams indicator in the pixel-based AHP, WZSAHP-RC using the D8 derived sub-watersheds and MFD derived sub-watershed. As in Figure 14e,f, the neighborhood pixels of those with high levels would be higher, especially using D8-derived sub-watershed as basic units.
Figure 15 shows the further comparison of statistical results using a different method to construct validation flood areas. There are flood areas on a land surface that use water areas, excluding permanent water areas as a validation range (Figure 15a,b) and flood areas in all regions which contain land surface and common water areas, such as lakes, and rivers (Figure 15c,d). The results indicated that as constructed validation using water areas excluding permanent water areas, the correct ratio and fit ratio of WZSAHP-RC could consistently outperform pixel-based AHP.
As shown in Figure 15b,d, the F1-measures value was higher than in Figure 15a,c). This phenomenon revealed that validation dataset 2 (which adopted “high” and “very high” as predicted flooded areas) was more suitable than validation dataset 1 (which adopted “moderate”, “high”, and “very high” as indicated flooded areas).
4. Discussion
In this section, the influence and the usage of the proposed WZSAHP-RC model were discussed. The sub-watershed delimitation methods and their influences on the proposed model were discussed in Section 4.1. The converging involving indicator choices in AHP-based flood hazard related estimation, and the influence on the proposed method is discussed in Section 4.2.
4.1. The Sub-Watershed Delimitation Methods and the Related Influences in the Proposed Model
The contribution of the proposed model revealed using sub-watershed as a basic unit to constrain converging related indicators can improve flood hazard estimation correct ratio and fit ratio. Thus, the sub-watershed delimitation is very important. Usually, the sub-watershed delimitated by DEM could be grouped as SFD and MFD algorithms. The accuracy influence of delimitation methods and the attention points in SFD-based and MFD-based sub-watershed delimitations should be discussed.
Point 1. The influence of DEM accuracy for MFD and SFD methods.
DEM is the primary material for sub-watershed delimitation. The accuracy of DEM is limited by the accuracy of the original captured data quality, the precision of the DEM producing process, and the related resolution format transformation. Therefore, to obtain higher consistency with the real-terrain DEM data, one method is to derive a hydrology data enforced DEM dataset.
Normal water distribution reflected the terrain in low-lying areas and the potential risk locations. The range of normal water can be used to improve the accuracy of DEM and used as auxiliary data to calculate flood hazard estimation involving indicators, such as “Distance from streams” and “Hydro-lithological formations”.
In this study, the SWI index was used to improve the water areas. The essential feature of the SWI was extracting water areas by the defined thresholds to extract those elements with corresponding area and length relations. The RivaMap is a convenient engine to extract river centerlines by Landsat images, a geometric parameter of the multiscale singularity index to distinguish lakes and rivers effectively [35]. Figure 16 revealed the distribution of the normal water range extracted by the SWI and the multiscale singularity index of the RivaMap. Figure 16b,d indicated that the SWI derived water was cleaner than the RivaMap. However, the SWI derived result had a better effect and was beneficial to the accuracy of former potential water bodies supported by the impervious surface production. The RivaMap relay on the input Landsat image derived MNDWI index, and the RivaMap engine might calculate the multiscale singularity index automatically. Then, using the general Natural Break method could distinguish the final water map. Therefore, as in a large area of research, the easily used RivaMap engine might be a good choice to extract the textural characteristics of rivers and lakes.
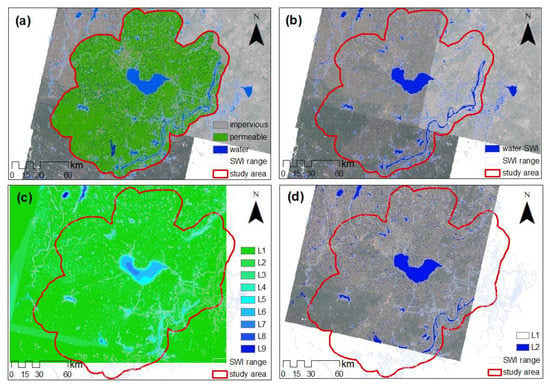
Figure 16.
The normal water range extract by the proposed SWI and the RivaMap. (a) was the range of water bodies extracted by SWI overlay the distribution of the impervious surface production, (b) was the water body and range areas of SWI, and (c,d) were the distributions of the multiscale singularity index of RivaMap classified by nature break method as nine types and two types.
Moreover, there were some refined river extraction [36] and automatic channel network extraction methods [37]. These methods rely on detailed indicators of remote sensing images and DEM. As in a small area range of study areas, they were using the precise hydrology information extraction method, which might be better to derive more detailed and near real-time water systems than the released geology information.
Point 2. The critical points of the MFD delimitation method.
In this study, the used MFD algorithm [20] adopts pixels in sink areas as seeds, traces the flow direction raster and identifies all the converging pixels consisting of whole sink areas. When delimitating sub-watersheds, all the pixels in the sink area and those in the eight directions totally flowing towards sink areas would be kept in the same sub-watershed as the sink area. Otherwise, the converging pixels would be classified as several sub-watersheds according to the flow order adjacent to the labeled sub-watershed in the same sink area.
Point 3. The critical points of the SFD delimitation method.
The D8 algorithm is one of the classical SFD algorithms. The result (in Section 3.5) indicated that the area threshold of the D8-based sub-watershed would influence the final estimation results. Therefore, for D8-based sub-watershed delimitation, exploring the proper area threshold is very important. In this study, the result indicated that 667 ha is a point of inflection. This might be influenced by some special environment factors, such as the study area scale, the flat terrain features and the special validation event. The proper area threshold should be further explored in a specific study case. Thus, the high efficiency of sub-watershed delimitation is very important. High-efficient extraction of drainage networks from digital elevation models constrained by enhanced flow enforcement from known river maps proposed a ConstrainedDNE tool to extract drainage networks [38]. It could auto delimitate sub-watershed as several grades of the version, only relying on the given DEM and streamlines.
However, [38] expected to use an outside prepared stream to determine the sub-watershed by back-tracing the outlet of rivers. For one aspect, it is not easy to prepare data. As collecting fully covered stream information in the real world at a sub-watershed scale is relatively easy, the study area may consist of several sub-watersheds. The data requirement of fully covered and high quality makes using the suggested method difficult. For another aspect, it is difficult to fully match the survey streamlines to the used DEM. As in the large-area study case, the public used DEM is always produced by satellite-based InSAR surveying. The production of DEM might not be as high quality as local survey data because the surveyed streamlines are always investigated by local departments. Thus, DEM could use corresponding essential survey points to derive higher accuracy of results.
4.2. The Choice of Converging Indicators and the Related Influences in the Proposed Model
The AHP model is a traditional method used in flood hazard estimation. Thus, it is significant to discuss the possible reasons why and the function of how the converging indicators play a role in the proposed WZSAHP-RC model.
Point 1. The function converging indicators in this study.
In this study, the converging related indicators contain “Slope”, “Elevation”, and “Distance from Streams”. The results in Figure 8 and Figure 9 revealed that when using MFD-derived sub-watershed to constrain indicators {“Distance from Streams”}, or {“Elevation”, “Distance from Streams”}, or {“Slope”, “Distance from Streams”}, or {“Elevation”, “Slope”, “Distance from Streams”}, the proposed WZSAHP-RC model derived correct ratio and fit ratio were demonstrated to be higher than the derived by pixel-based AHP method. Constraining indicators {“Elevation”, “Slope”, “Distance from Streams”} performed best, and followed by {“Slope”, “Distance from Streams”}, {“Elevation”, “Distance from Streams”}, and {“Distance from Streams”}.
The essential of constraining sub-watershed to specific indicators means properly considering the hydrology converging influence on individual pixels. In the research of [39], the similar indicator “Distance from drainage network” matched with the “Distance from streams” of this study. It explained that the “Distance from drainage network” is influenced by the converging indicator “drainage density” and the runoff production indicator (such as “ground water depth”, and “land use”, etc.). The indicator “Slope” also has a significant influence on the indicator “drainage density” and “ground water depth”. Those findings confirmed that the indicator “Distance from streams” could reflect other indicators directly or indirectly. Thus, constraining sub-watershed to “Distance from streams” might influence converging and runoff production indicators.
Point 2. The converging indicators are used in the related flood hazard estimation.
In the flood probability estimation based on geo-environment indicators [40], the weight of indicator order is demonstrated as “slope”, “distance to rivers”, “altitude” (referring to the “elevation”), and then followed by the “terrain ruggedness index” (TRI) and “drainage density”. Moreover, in the study of prioritization of sub-watershed flood probability based on physical, hydrological, and climatological parameters [41], the high-risk sub-watersheds have higher “permeability” and “rainfall” and greater “drainage network density” at a shorter “distance from rivers”. In [42], the flood hazard estimation in the vicinity of the main channels of the Kifisos and Ilisos Rivers indicated that the highest flood hazard areas were total covered “streams”, expansion of “impermeable formations” and “intense urbanization”. As in the referenced flood probability and flood hazard estimation research, the distance from “streams”, “rivers”, or “drainage networks” is taken seriously.
In the flood susceptibility mapping research basing the statistical model [43], “distance from streams”, “elevation”, and “slope” were important indicators in the occurrence of floods, and the “rainfall”, “terrain wetness index” (TWI) and “land cover type” also influenced indicators on flood sensitivity. Moreover, the flood susceptibility mapping based machine learning research [44] found the relative importance order of indicators were “slope angle”, “distance from rivers”, “land use”, “TWI”, “elevation”, and other indicators. For flash flood susceptibility estimation [45], the slope was the essential indicator that occurred and developed floods. Thus, it was assigned the highest weight and followed by the factors of “land use”, “lithology”, and “profile curvature”. Therefore, these works of literature all considered the “slope”, “distance from ‘streams’ or ‘rivers’”, “elevation” as essential indicators, and some research assigned “slope” the highest weight.
Point 3. The choices of digital streams and GRWL to construct “Distance from streams”.
The choice of using a proper stream also needs to be discussed. DEM can be used to produce digital streams, and there is some mature globe-scale hydrology production, such as GRWL. The digital streams extracted from DEM were used as basic streams to construct “Distance from streams” in this study.
The GRWL production contains the width of large-scale lakes and rivers, while the digital streams focus on distinguishing terrain converging characters (Figure 17). As described in Section 3.4 and Section 3.6, the proposed WZSAHP-RC method using sub-watershed delimitated by MFD as basic units could improve the correct ratio and fit ratio compared to the pixel-based AHP using both streams to derive the “Distance from streams” indicator. Moreover, for WZSAHP-RC method, when using digital streams (Figure 7k), the final estimated flood hazard distribution had a higher correct ratio and fit ratio (C1 = 87%, F1 = 43%, C2 = 60%, F2 = 35%) than using GRWL (C1 = 78%, F1 = 12%, C2 = 61%, F2 = 16%) (Figure 14c). Therefore, it could be concluded that using the DEM derived digital stream was more suitable for constructing “Distance from streams” than GRWL at the basin scale. As in the larger scale, such as catchments or regional areas, more experiments should be conducted in the future.
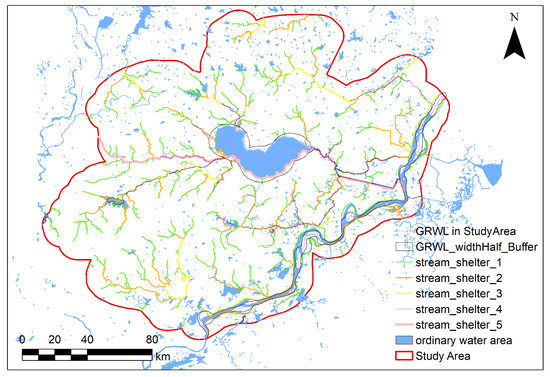
Figure 17.
The distribution of GRWL in the study areas, overlaid by the digital streams derived by DEM, and the common water area in the study area.
5. Conclusions
In this study, as the traditional pixel-based AHP method failed to capture the hydrological features caused by neighborhood pixels, a sub-watershed-based extended AHP model named WZSAHP-RC was proposed. Taking the Chaohu Basin of Anhu, China, as an example, the correct ratio and fit ratio of the proposed method were validated using the real-flood areas extracted from remote sensing compared with the pixel-based AHP method. When using {“very high”, “high”, “moderate”} as predicted in flooded areas, the results indicated that the correct ratio and fit ratio derived by the WZSAHP-RC could improve by 21% (from 66% to 87%) and 6% (from 37% to 43%), respectively. Moreover, when using {“very high”, and “high”} as predicted flooded areas, the correct ratio and fit ratio could increase by 38% (from 22% to 60%) and 17% (from 18% to 35%), respectively. Moreover, in comparison with flood towns filtered by Baidu News, the proposed method had higher consistency with dikes broken and active drainage flooded areas than the pixel-based AHP method.
Furthermore, the correct ratio and fit ratio could be improved using the proposed WZSAHP-RC method to constrain part of converging related indicators by the MFD-derived or D8-derived sub-watershed as a basic unit. When using a D8-derived sub-watershed as a basic unit, the correct ratio and fit ratio were also demonstrated to be increased compared to the pixel-based AHP model. Still, the area threshold of delimitating sub-watershed would influence the increasing value.
Despite the success of the proposed WZSAHP-RC model, we need to acknowledge its limitations. The validation flood is the period from 20 to 24 July 2020 in the Chaohu basin, which is the biggest in recent years, but this is validated by one case, and maybe other places or flood events, would produce different results. Furthermore, it indicated that the area threshold of delimitating sub-watershed would influence the correct ratio and fit ratio increment of WZSAHP-RC. Future research needs to reveal the usability of different terrain character study areas and quantitatively analyze the effective area threshold range of the delimitating sub-watershed for the proposed method. Meanwhile, the potential of flooding and the company risk is a combined effect function by flood hazard, exposure, and vulnerability. Flood hazard estimation needs not only to consider the spatial heterogeneity but also needs to consider the effect of spatial homogeneity. This study demonstrated the space connections between sub-watershed and flood hazard estimation. The flood exposure and vulnerability estimation also need to explore the affiliate effects in horizontal and vertical geological space in detail, even extending to the link affecting the multi-dimensional social-economic environment.
Supplementary Materials
The following supporting information can be downloaded at: https://www.mdpi.com/article/10.3390/rs14102465/s1. These data include the rating dataset of flood risk involve of indicators, the watersheds delimitated by the D8 (with area threshold of 667 ha, 200.0 ha, 667.0 ha, 2000.0 ha, 3333.0 ha, and 6667 ha) and MFD algorithms, and the water body of natural boundary and during validating flood period.
Author Contributions
Conceptualization, H.Z. and Z.S.; methodology, H.Z., Z.S. and J.S.; software, H.Z.; validation, Z.S., J.S. and J.Y.; formal analysis, J.S. and J.Y.; investigation, X.H.; writing—original draft preparation, H.Z.; writing—review and editing, X.H., J.S. and J.Y.; visualization, J.Y. All authors have read and agreed to the published version of the manuscript.
Funding
This research was funded by the National Key R&D Program of China, grant number 2018YFB2100501, the Fundamental Research Funds for the Central Universities, grant number 2042021kf0007, the open grants of the state key laboratory of severe weather, grant number 2021LASW-A17, the Open Fund of Hubei Luojia Laboratory, grant number 220100009, the Shenzhen Science and technology Innovation Key project, grant number JCYJ20200109150833977, in part by the National Natural Science Foundation of China under Grants 42090012, Sichuan Science and Technology Program, grant number 2022YFN0031, Zhuhai industry university research cooperation project of China, grant number ZH22017001210098PWC, 03 special research and 5G project of Jiangxi Province in China, grant number 20212ABC03A09, and Zhizhuo Research Fund on Spatial-Temporal Artificial Intelligence, grant number ZZJJ202202. The authors would like to thank the anonymous reviewers and editors for their comments, which helped us improve this article significantly.
Data Availability Statement
Not applicable.
Acknowledgments
Author thank sincerely to teacher Stephen McClure of Wuhan University for his work in improving this manuscript.
Conflicts of Interest
The authors declare no conflict of interest.
Appendix A. The Used Tiles of Impermeable Surface Product and the Flooded Town Derived from Baidu News
As shown in Section 2.2, the 18 tiles (Table A1) of China’s impermeable surface product (2 m) in Hefei, Luan, Anqing, Wuhu, Maanshan, Chuzhou, Huainan cities were used to prepare the land use and hydrological indicators.
Table A1.
Tiles of China’s impermeable surface product (2 m) were used in the study area.
Table A1.
Tiles of China’s impermeable surface product (2 m) were used in the study area.
| District | Data Tiles | Districts | Data Tiles |
|---|---|---|---|
| Anqing | R1C1, R1C2 | Luan | R1C2, R3C2 |
| Chizhou | R1C1, R1C2 | Maanshan | R1C1, R1C2 |
| Chuzhou | R2C1, R2C2 | Tongling | R1C1 |
| Hefei | R1C2, R1C2, R2C1, R2C2 | Wuhu | R1C1, R2C1 |
| Huainan | R2C1 |
As shown in Section 2.2, the retrieved raw flood event-related news were manually cleaned up to derive the final validating dataset of flood town (Table A2) and active breaking dikes for excessive drainage rainwater in the Chaohu basin (Table A3).
Table A2.
The flood- and damage-relevant information from Baidu News in the study area.
Table A2.
The flood- and damage-relevant information from Baidu News in the study area.
| Date | City | Flooded Town (Village) | Broken Location |
|---|---|---|---|
| 19 July 2020 | Shuchengxian, Liuan city | Taoxi town | Fengle River (Longtan River) |
| Blinding (Bolin, Jiehe village) | Fenagle (Bolin Reach) | ||
| Qianrenqiao town (Shuxin, Xingfeng, Tonggui, Huangcheng, Wanghe, Sanchahe, Qiandashan etc. villages) | Hangfu, Qiandashan rivers | ||
| Chengguan town (Taiping village) | Sanli, Zhanggongdang, Zhucao Rivers | ||
| 22 July 2020 | Lujiangxian, Hefei city | Tongda town (Xuejiayu, Guyu, Lianhe, Yongxing, Shifeng, Changfeng villages) | Shidayu |
| Baishan town (Baishan, Daiqiao, Shilian, Jinsheng, Jiulian, Xingang villages) | |||
| Not clear | Shengqiao town, Yefushan town, Shitou town, Jinniu town, Guohe town, Nihe town, Baihu town |
Table A3.
Flooding area distribution caused by active dam breaking.
Table A3.
Flooding area distribution caused by active dam breaking.
| Date | City | Flooded Land | Mitigation Pressure |
|---|---|---|---|
| 19 July 2020 | Quanjiaoxian, Chuzhou city | Dike of Huangcao district 2 and 3 | Chu River |
| 26 July 2020 | Feixixian, Hefei city | Union dike of Jiangkouhe, Yandian Xiang Union dike of Binhu, Sanhe Town Union dike of Shatan, Fengle Town | Chaohu |
| 27 July 2020 | Lujiangxian, Hefei city | Union dike of Peigang, Baihu Town | Chaohu |
References
- Wheater, H.S. Flood hazard and management: A UK perspective. Philos. Trans. R. Soc. A Math. Phys. Eng. Sci. 2006, 364, 2135–2145. [Google Scholar] [CrossRef] [PubMed]
- Teng, J.; Jakeman, A.J.; Vaze, J.; Croke, B.F.W.; Dutta, D.; Kim, S. Flood inundation modelling: A review of methods, recent advances and uncertainty analysis. Environ. Model. Softw. 2017, 90, 201–216. [Google Scholar] [CrossRef]
- Shao, Z.; Fu, H.; Li, D.; Altan, O.; Cheng, T. Remote sensing monitoring of multi-scale watersheds impermeability for urban hydrological evaluation. Remote Sens. Environ. 2019, 232, 111338. [Google Scholar] [CrossRef]
- Bertilsson, L.; Wiklund, K.; Tebaldi, I.D.M.; Rezende, O.M.; Verol, A.P.; Miguez, M.G. Urban flood resilience—A multi-criteria index to integrate flood resilience into urban planning. J. Hydrol. 2019, 573, 970–982. [Google Scholar] [CrossRef]
- Jiang, Y.; Zevenbergen, C.; Ma, Y. Urban pluvial flooding and stormwater management: A contemporary review of China’s challenges and “sponge cities” strategy. Environ. Sci. Policy 2018, 80, 132–143. [Google Scholar] [CrossRef]
- Chinanews. In 2020, the Flood Disaster Caused 63.46 Million People with Direct Economic Losses of 178.96 Billion Yuan. Available online: https://www.chinanews.com.cn/cj/shipin/cns-d/2020/08-13/news865240.shtml (accessed on 30 December 2021).
- Xu, W.; Zhong, M.; Hong, Y.; Lin, K. Enhancing community resilience to urban floods with a network structuring model. Saf. Sci. 2020, 127, 104699. [Google Scholar] [CrossRef]
- Barendrecht, M.H.; Viglione, A.; Blöschl, G. A dynamic framework for flood risk. Water Secur. 2017, 1, 3–11. [Google Scholar] [CrossRef]
- Haider, H.; Ghumman, A.R.; Al-Salamah, I.S.; Ghazaw, Y.; Abdel-Maguid, R.H. Sustainability evaluation of rainwater harvesting-based flood risk management strategies: A multilevel decision-making framework for arid environments. Arab. J. Sci. Eng. 2019, 44, 8465–8488. [Google Scholar] [CrossRef]
- Han, S.; Coulibaly, P. Bayesian flood forecasting methods: A review. J. Hydrol. 2017, 551, 340–351. [Google Scholar] [CrossRef]
- Ekmekcioğlu, Ö.; Koc, K.; Özger, M. District based flood risk assessment in Istanbul using fuzzy analytical hierarchy process. Stoch. Environ. Res. Risk Assess. 2021, 35, 617–637. [Google Scholar] [CrossRef]
- Ekmekcioğlu, Ö.; Koc, K.; Özger, M. Stakeholder perceptions in flood risk assessment: A hybrid fuzzy AHP-TOPSIS approach for Istanbul, Turkey. Int. J. Disaster Risk Reduct. 2021, 60, 102327. [Google Scholar] [CrossRef]
- Ali, S.A.; Parvin, F.; Pham, Q.B.; Vojtek, M.; Vojteková, J.; Costache, R.; Linh, N.T.T.; Nguyen, H.Q.; Ahmad, A.; Ghorbani, M.A. GIS-based comparative assessment of flood susceptibility mapping using hybrid multi-criteria decision-making approach, naïve Bayes tree, bivariate statistics and logistic regression: A case of Topľa basin, Slovakia. Ecol. Indic. 2020, 117, 106620. [Google Scholar] [CrossRef]
- Costache, R.; Pham, Q.B.; Avand, M.; Thuy Linh, N.T.; Vojtek, M.; Vojteková, J.; Lee, S.; Khoi, D.N.; Thao Nhi, P.T.; Dung, T.D. Novel hybrid models between bivariate statistics, artificial neural networks and boosting algorithms for flood susceptibility assessment. J. Environ. Manag. 2020, 265, 110485. [Google Scholar] [CrossRef]
- Ouma, Y.; Tateishi, R. Urban flood vulnerability and risk mapping using integrated multi-parametric AHP and GIS: Methodological overview and case study assessment. Water 2014, 6, 1515–1545. [Google Scholar] [CrossRef]
- Chakraborty, S.; Mukhopadhyay, S. Assessing flood risk using analytical hierarchy process (AHP) and geographical information system (GIS): Application in Coochbehar district of West Bengal, India. Nat. Hazards 2019, 99, 189–216. [Google Scholar] [CrossRef]
- Abdouli, K.A.; Hussein, K.; Ghebreyesus, D.; Sharif, H.O. Coastal runoff in the United Arab Emirates—The hazard and opportunity. Sustainability 2019, 11, 5406. [Google Scholar] [CrossRef] [Green Version]
- Wu, Z.; Shen, Y.; Wang, H. Assessing urban areas’ vulnerability to flood disaster based on text data: A case study in Zhengzhou city. Sustainability 2019, 11, 4548. [Google Scholar] [CrossRef] [Green Version]
- Zhang, H.; Cheng, X.; Jin, L.; Zhao, D.; Zheng, K. A method for estimating urban flood-carrying capacity using the VIS-W underlying surface model: A case study from Wuhan, China. Water 2019, 11, 2345. [Google Scholar] [CrossRef] [Green Version]
- Zhang, H.; Cheng, X.; Jin, L.; Zhao, D.; Feng, T.; Zheng, K. A method for dynamical sub-watershed delimitating by no-fill digital elevation model and defined precipitation: A case study of Wuhan, China. Water 2020, 12, 486. [Google Scholar] [CrossRef]
- Shao, Z.; Pan, Y.; Diao, C.; Cai, J. Cloud detection in remote sensing images based on multiscale features-convolutional neural network. IEEE Trans. Geosci. Remote Sens. 2019, 57, 4062–4076. [Google Scholar] [CrossRef]
- Shao, Z.; Wu, W.; Li, D. Spatio-temporal-spectral observation model for urban remote sensing. Geo-Spat. Inf. Sci. 2021, 24, 372–386. [Google Scholar] [CrossRef]
- Saaty, T.L. Decision making—the analytic hierarchy and network processes (ahp/anp). J. Syst. Sci. Syst. Eng. 2004, 13, 1–35. [Google Scholar] [CrossRef]
- Fernández, D.S.; Lutz, M.A. Urban flood hazard zoning in Tucumán Province, Argentina, using GIS and multicriteria decision analysis. Eng. Geol. 2010, 111, 90–98. [Google Scholar] [CrossRef]
- Bathrellos, G.D.; Skilodimou, H.D.; Chousianitis, K.; Youssef, A.M.; Pradhan, B. Suitability estimation for urban development using multi-hazard assessment map. Sci. Total Environ. 2017, 575, 119–134. [Google Scholar] [CrossRef] [PubMed]
- Papaioannou, G.; Vasiliades, L.; Loukas, A. Multi-criteria analysis framework for potential flood prone areas mapping. Water Resour. Manag. 2015, 29, 399–418. [Google Scholar] [CrossRef]
- Koc, K.; Ekmekcioğlu, Ö.; Özger, M. An integrated framework for the comprehensive evaluation of low impact development strategies. J. Environ. Manag. 2021, 294, 113023. [Google Scholar] [CrossRef]
- Kenny, F.; Matthews, B.; Todd, K. Routing overland flow through sinks and flats in interpolated raster terrain surfaces. Comput. Geosci. 2008, 34, 1417–1430. [Google Scholar] [CrossRef]
- Zhang, H.; Cheng, X.; Zhao, D.; Ma, H. Analyzing the contribution of high resolution water range in dividing catchment based on D8 algorithm. In Proceedings of the IGARSS 2018—2018 IEEE International Geoscience and Remote Sensing Symposium, Valencia, Spain, 23–27 July 2018; IEEE: Valencia, Spain, 2018. [Google Scholar]
- Network, C.R. Wuwu Anhui Released Two Orders in the Early Morning: All People Located in Inner River Small Than 200 ha Must Evacuate. Available online: https://baijiahao.baidu.com/s?id=1672632563586115896&wfr=spider&for=pc (accessed on 21 April 2021).
- XinhuaNews. Chaohu Flood Drainage: Adopt 9 Dikes of Area Larger Than 666 ha and Transfer More Than 140,000 People. Available online: https://baijiahao.baidu.com/s?id=1673508617349741514&wfr=spider&for=pc (accessed on 21 April 2021).
- Alfieri, L.; Salamon, P.; Bianchi, A.; Neal, J.; Bates, P.; Feyen, L. Advances in pan-European flood hazard mapping. Hydrol. Process 2014, 28, 4067–4077. [Google Scholar] [CrossRef]
- Bates, P.; De Roo, A. A simple raster-based model for flood inundation simulation. J. Hydrol. 2000, 236, 54–77. [Google Scholar] [CrossRef]
- Allen, G.H.; Pavelsky, T.M. Global extent of rivers and streams. Science 2018, 361, t636. [Google Scholar] [CrossRef] [Green Version]
- Isikdogan, F.; Bovik, A.; Passalacqua, P. RivaMap: An automated river analysis and mapping engine. Remote Sens. Environ. 2017, 202, 88–97. [Google Scholar] [CrossRef]
- Li, D.; Wang, G.; Qin, C.; Wu, B. River extraction under bankfull discharge conditions based on sentinel-2 imagery and DEM data. Remote Sens. 2021, 13, 2650. [Google Scholar] [CrossRef]
- Isikdogan, F.; Bovik, A.; Passalacqua, P. Automatic channel network extraction from remotely sensed images by singularity analysis. IEEE Int. Geosci. Remote Sens. Symp. 2015, 12, 2218–2221. [Google Scholar] [CrossRef]
- Wu, T.; Li, J.; Li, T.; Sivakumar, B.; Zhang, G.; Wang, G. High-efficient extraction of drainage networks from digital elevation models constrained by enhanced flow enforcement from known river maps. Geomorphology 2019, 340, 184–201. [Google Scholar] [CrossRef]
- Souissi, D.; Zouhri, L.; Hammami, S.; Msaddek, M.H.; Zghibi, A.; Dlala, M. GIS-based MCDM—AHP modeling for flood susceptibility mapping of arid areas, southeastern Tunisia. Geocarto. Int. 2020, 35, 991–1017. [Google Scholar] [CrossRef]
- Avand, M.; Moradi, H.; Lasboyee, M.R. Spatial modeling of flood probability using geo-environmental variables and machine learning models, case study: Tajan watershed, Iran. Adv. Space Res. 2021, 67, 3169–3186. [Google Scholar] [CrossRef]
- Avand, M.; Khiavi, A.N.; Khazaei, M.; Tiefenbacher, J.P. Determination of flood probability and prioritization of sub-watersheds: A comparison of game theory to machine learning. J. Environ. Manag. 2021, 295, 113040. [Google Scholar] [CrossRef]
- Bathrellos, G.D.; Karymbalis, E.; Skilodimou, H.D.; Gaki-Papanastassiou, K.; Baltas, E.A. Urban flood hazard assessment in the basin of Athens Metropolitan city, Greece. Environ. Earth Sci. 2016, 75, 319. [Google Scholar] [CrossRef]
- Yariyan, P.; Avand, M.; Abbaspour, R.A.; Torabi Haghighi, A.; Costache, R.; Ghorbanzadeh, O.; Janizadeh, S.; Blaschke, T. Flood susceptibility mapping using an improved analytic network process with statistical models. Geomat. Nat. Hazards Risk 2020, 11, 2282–2314. [Google Scholar] [CrossRef]
- Costache, R.; Țîncu, R.; Elkhrachy, I.; Pham, Q.B.; Popa, M.C.; Diaconu, D.C.; Avand, M.; Costache, I.; Arabameri, A.; Bui, D.T. New neural fuzzy-based machine learning ensemble for enhancing the prediction accuracy of flood susceptibility mapping. Hydrol. Sci. J. 2020, 65, 2816–2837. [Google Scholar] [CrossRef]
- Costache, R.; Pham, Q.B.; Arabameri, A.; Diaconu, D.C.; Costache, I.; Crăciun, A.; Ciobotaru, N.; Pandey, M.; Arora, A.; Ali, S.A.; et al. Flash-flood propagation susceptibility estimation using weights of evidence and their novel ensembles with multicriteria decision making and machine learning. Geocarto. Int. 2021, 1–33. [Google Scholar] [CrossRef]
Publisher’s Note: MDPI stays neutral with regard to jurisdictional claims in published maps and institutional affiliations. |
© 2022 by the authors. Licensee MDPI, Basel, Switzerland. This article is an open access article distributed under the terms and conditions of the Creative Commons Attribution (CC BY) license (https://creativecommons.org/licenses/by/4.0/).