
Characterizing the Topographic Changes and Land Subsidence Associated with the Mountain Excavation and City Construction on the Chinese Loess Plateau

Abstract
1. Introduction
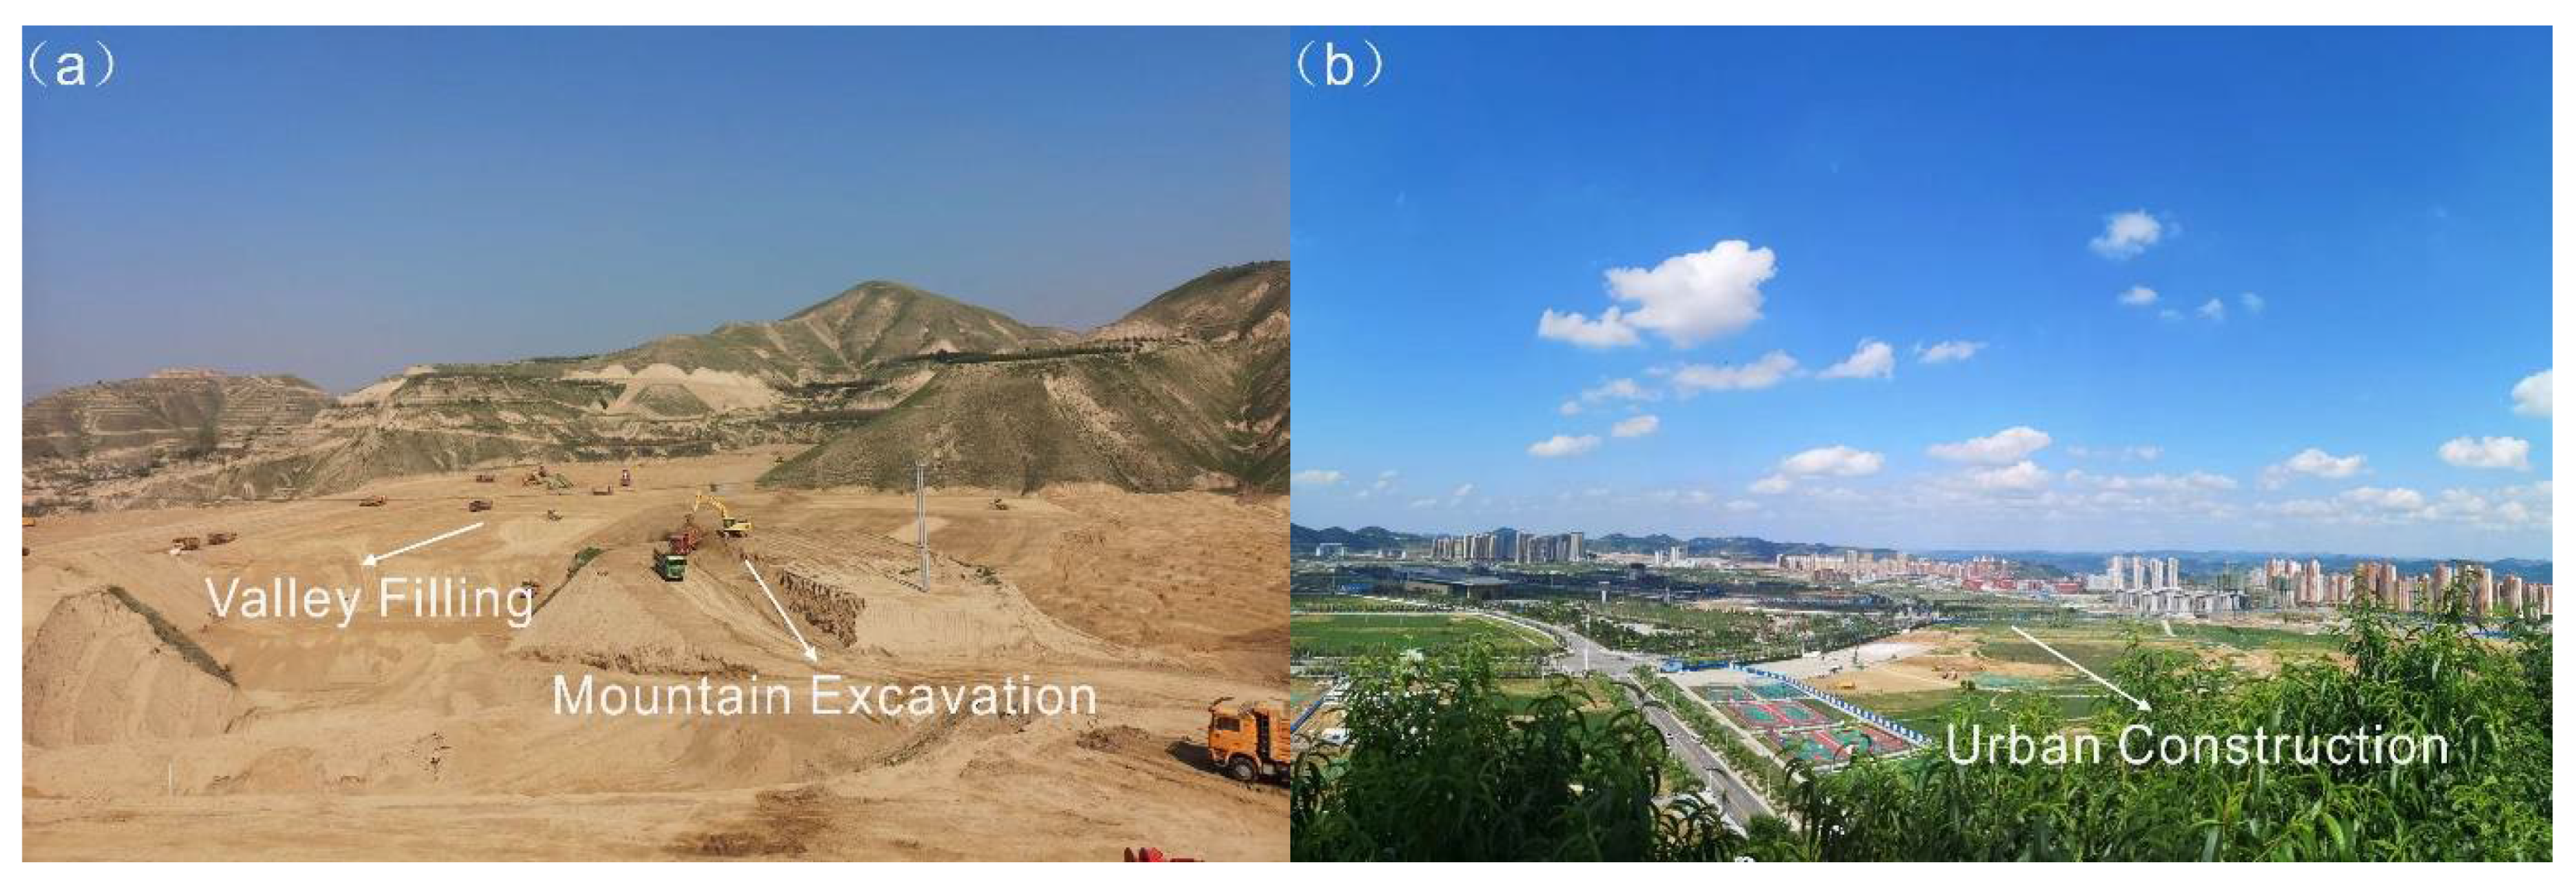
2. Study Area
3. Data and Methods
3.1. Datasets
3.1.1. ZY-3 Satellite Images
3.1.2. SAR Data and Ancillary Data
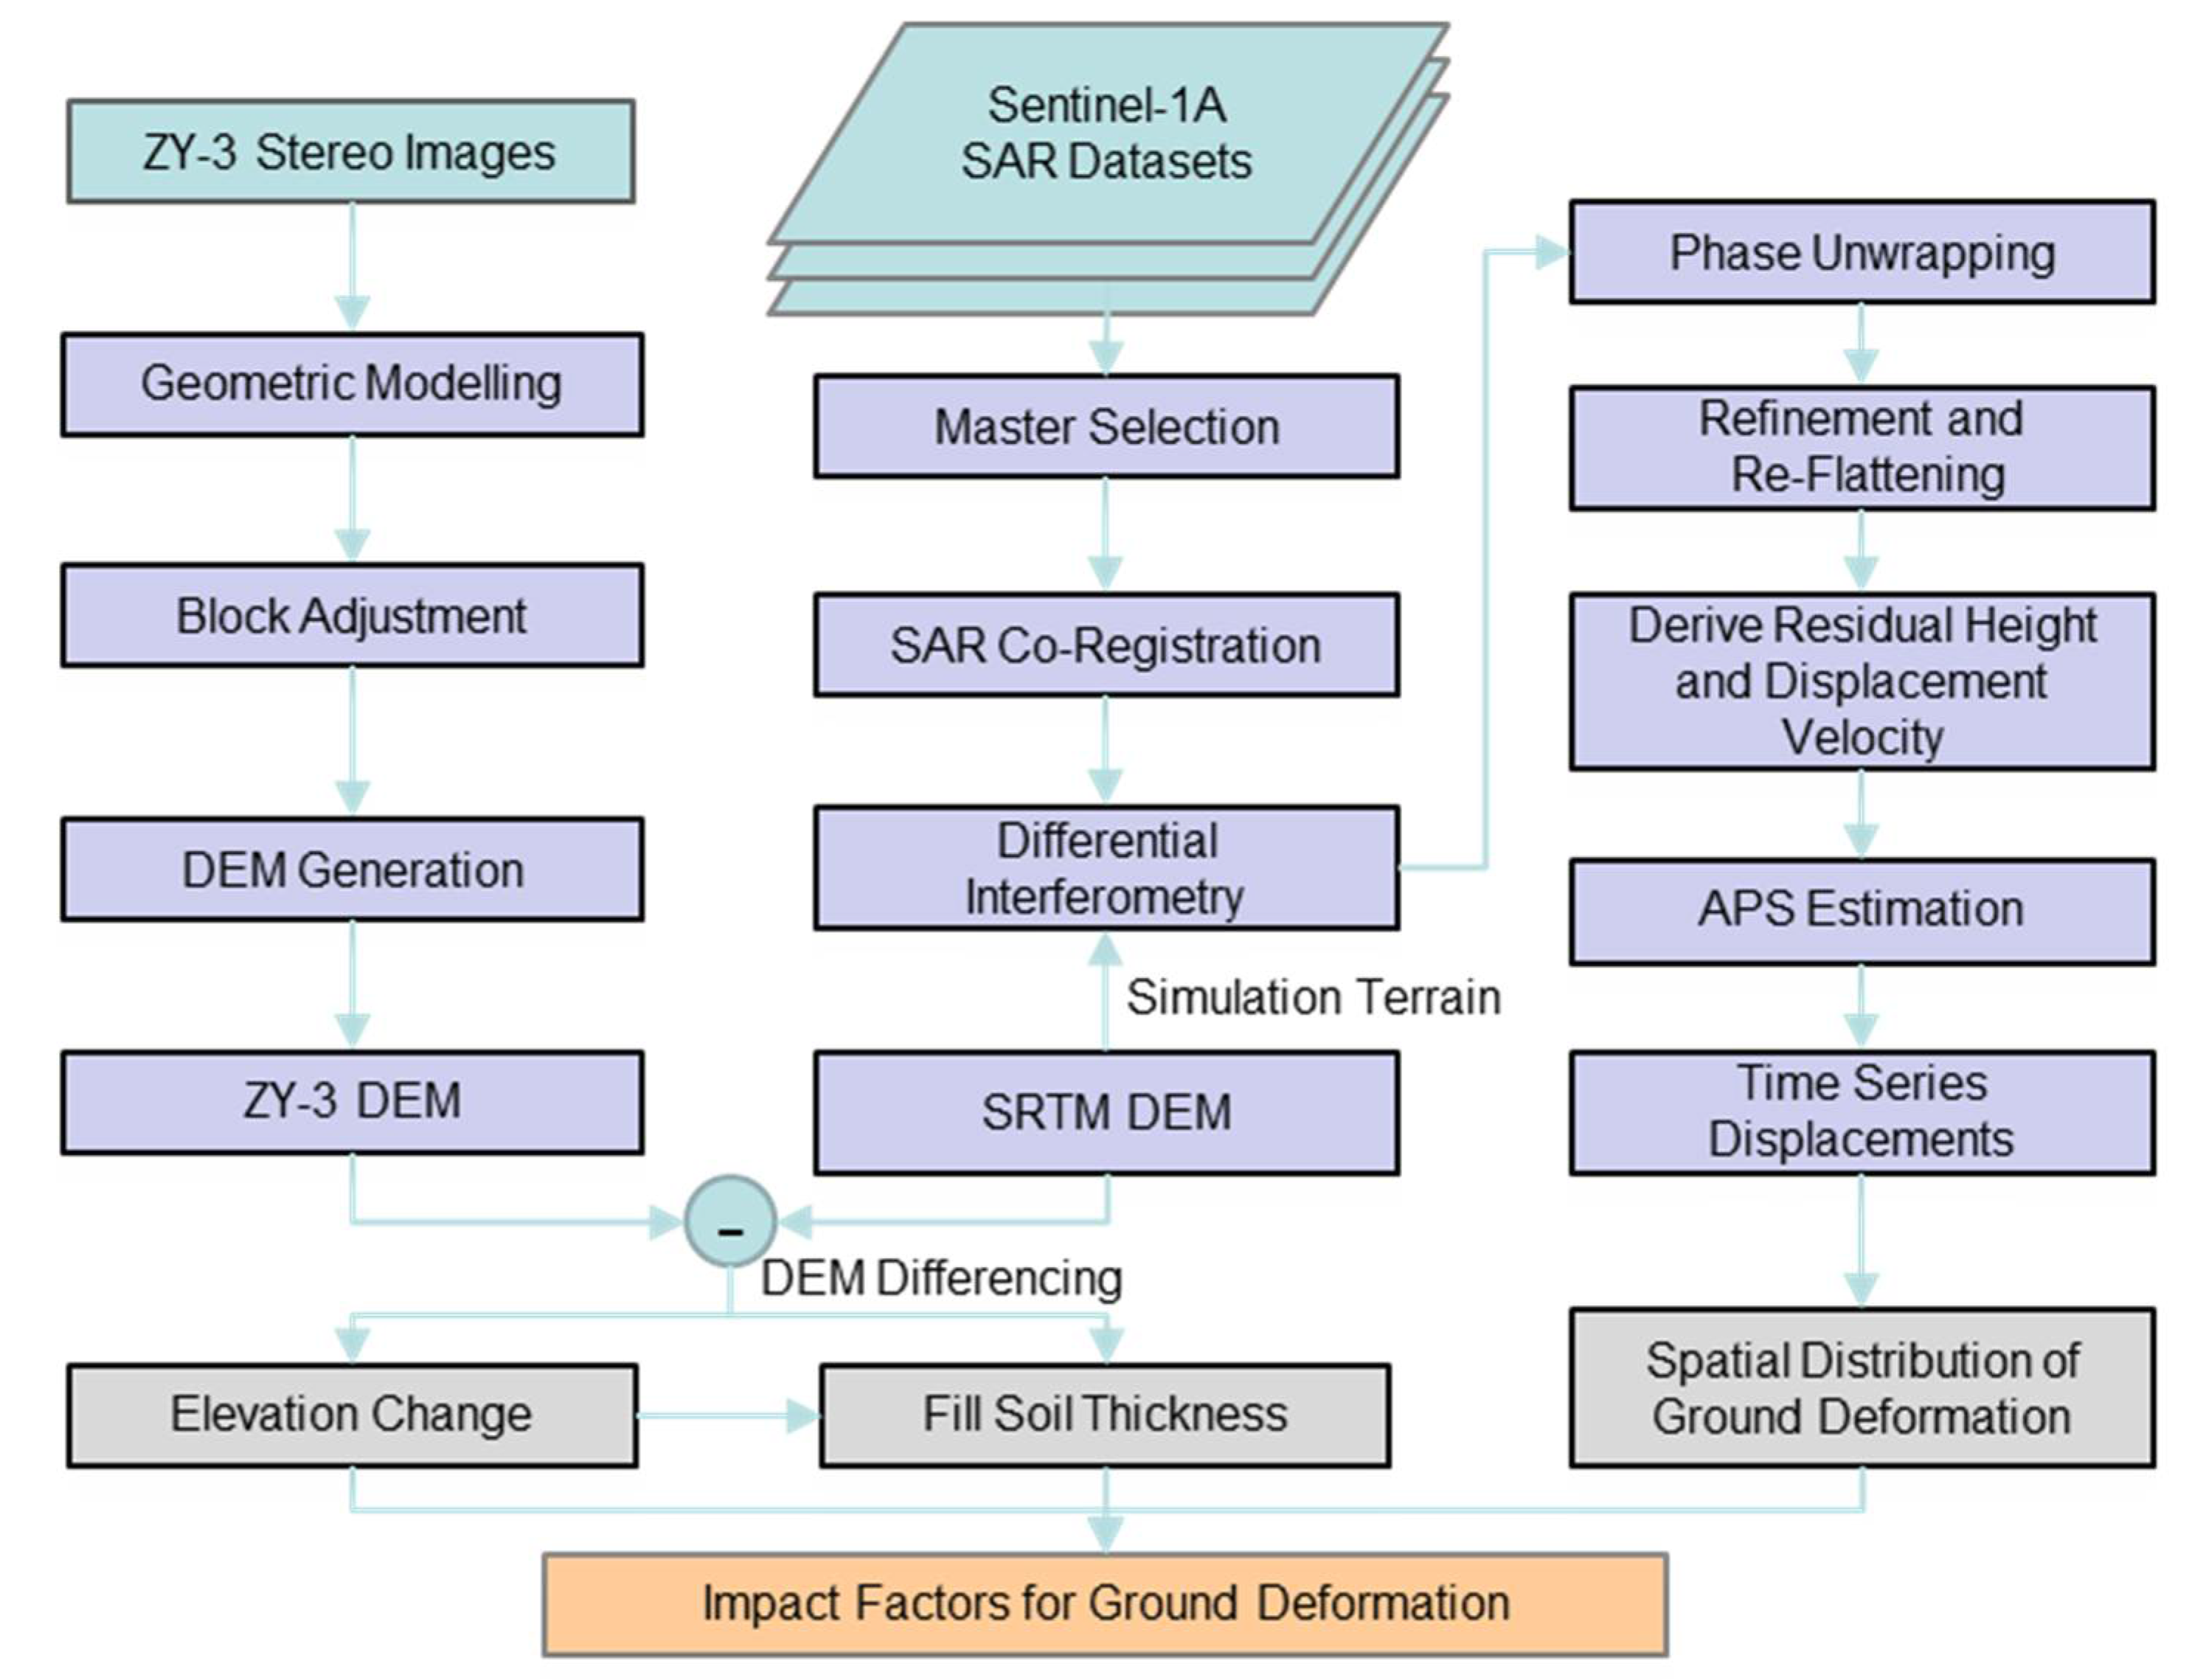
3.2. Methods
3.2.1. Topographic Change Calculation
3.2.2. InSAR-Derived Deformation Rates
4. Results and Analyses
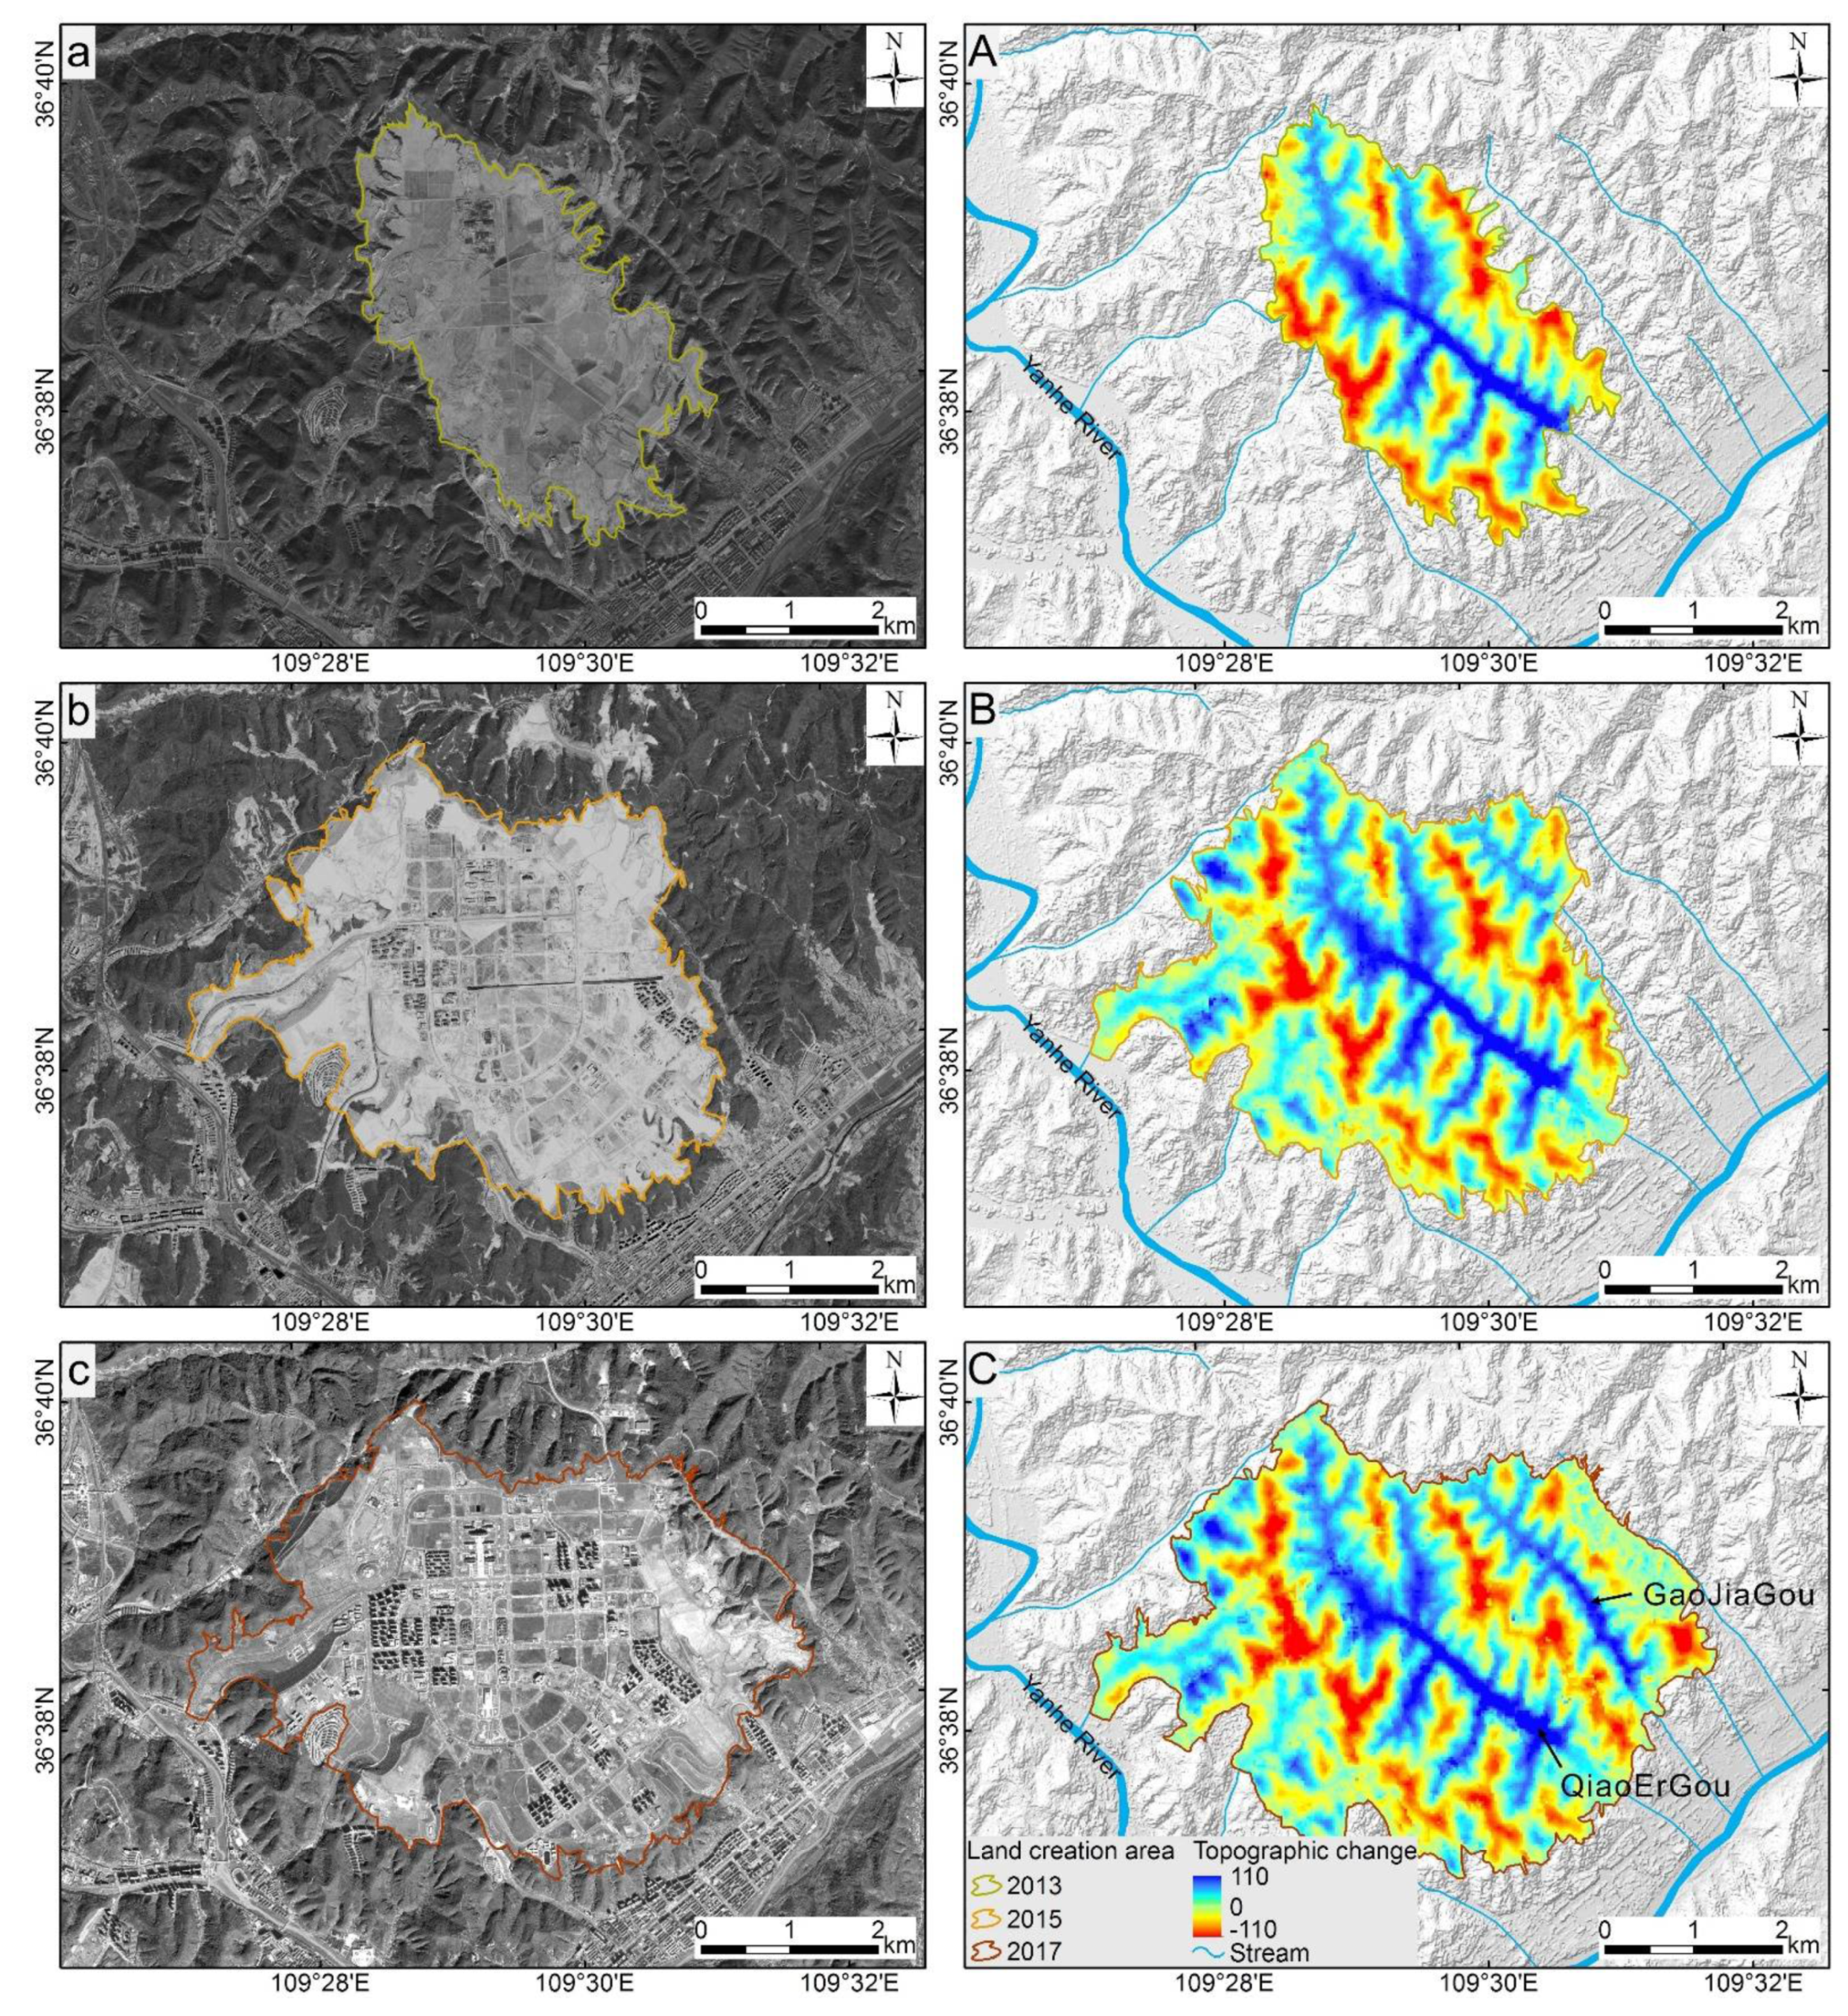
4.1. Topographic Changes in YND
4.1.1. Spatial Evolution of the Topographic Changes
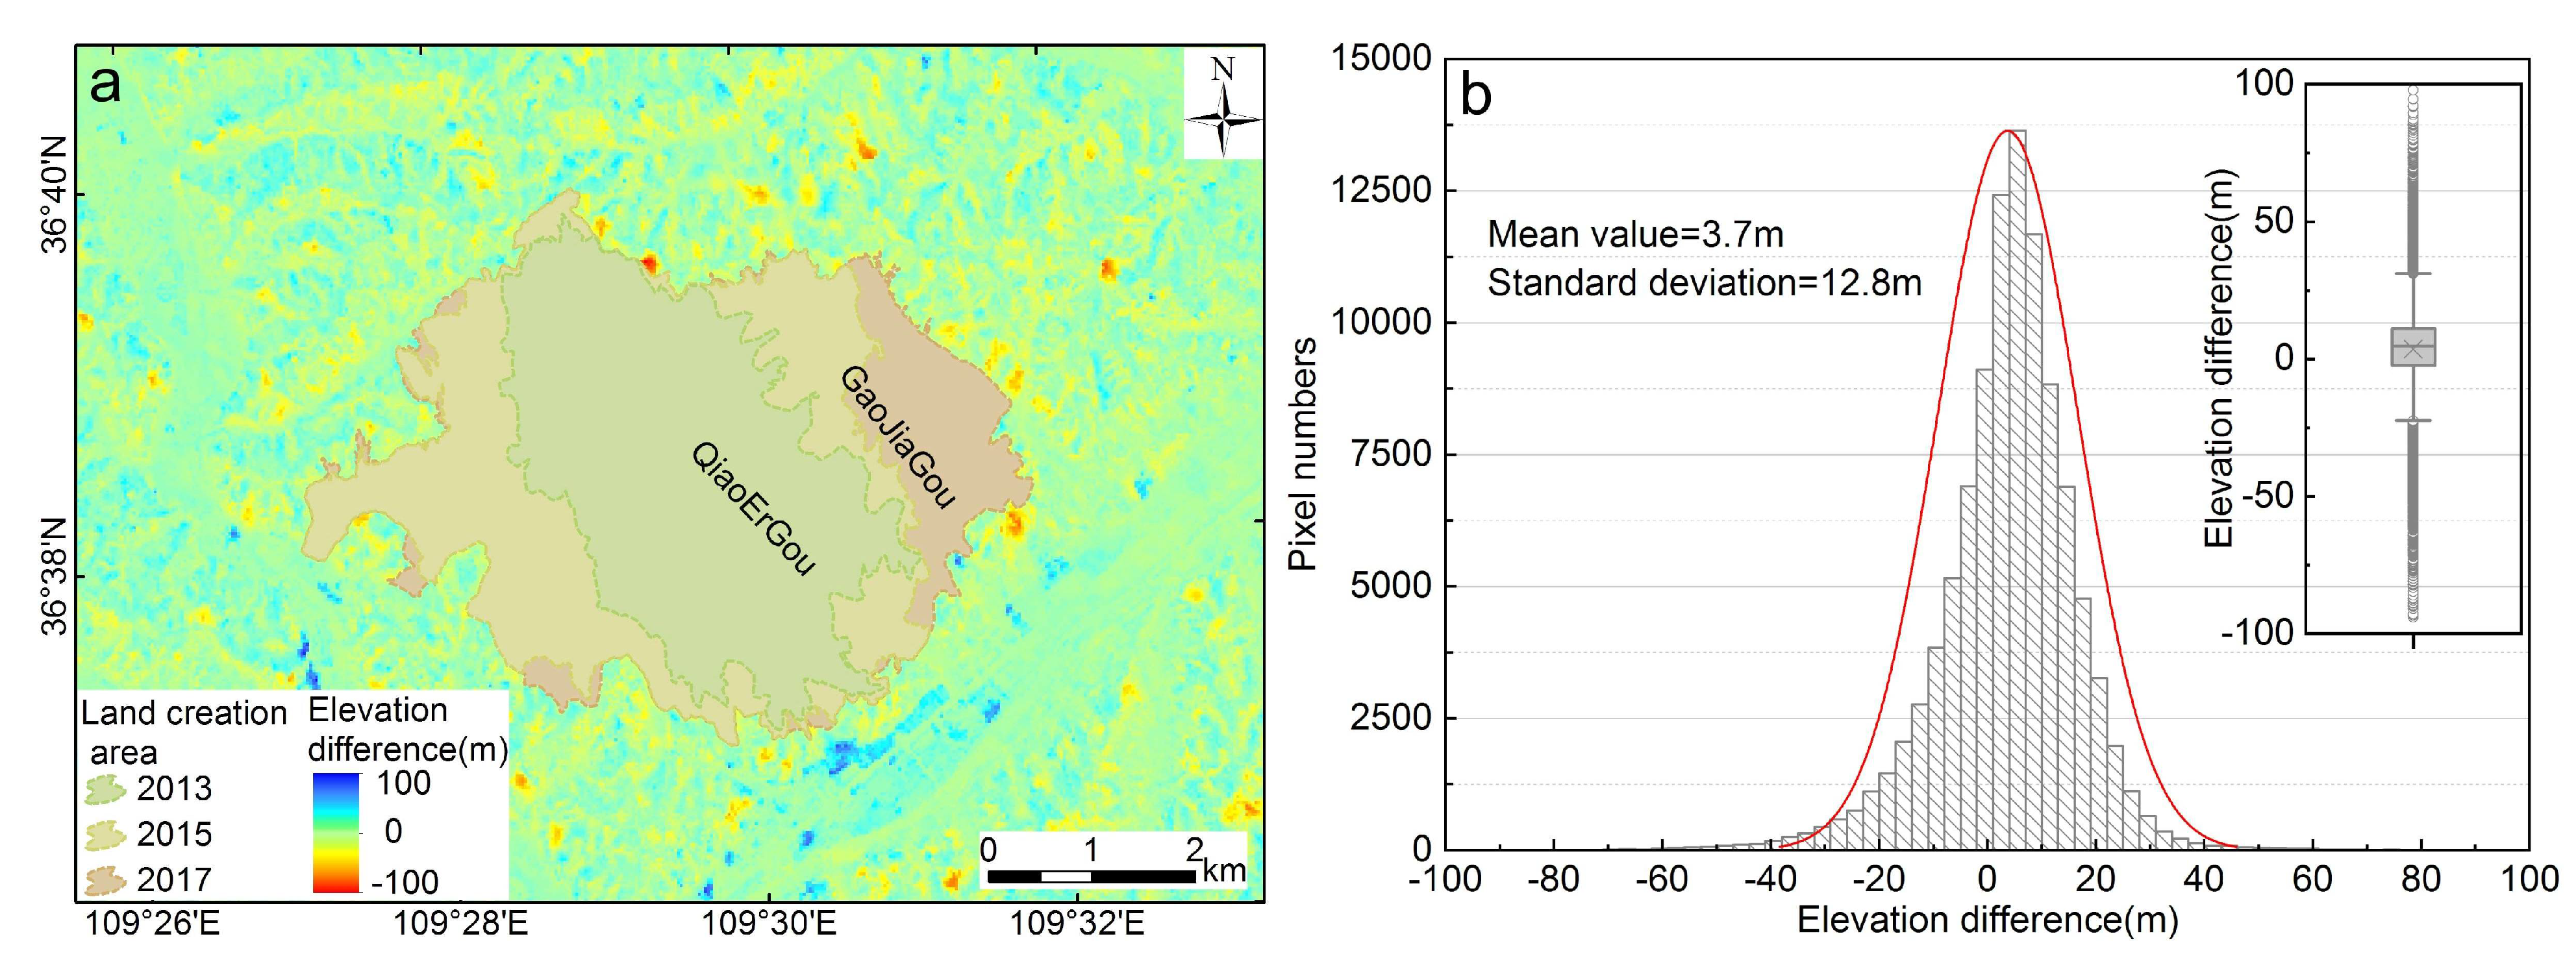
4.1.2. Uncertainty Characterization
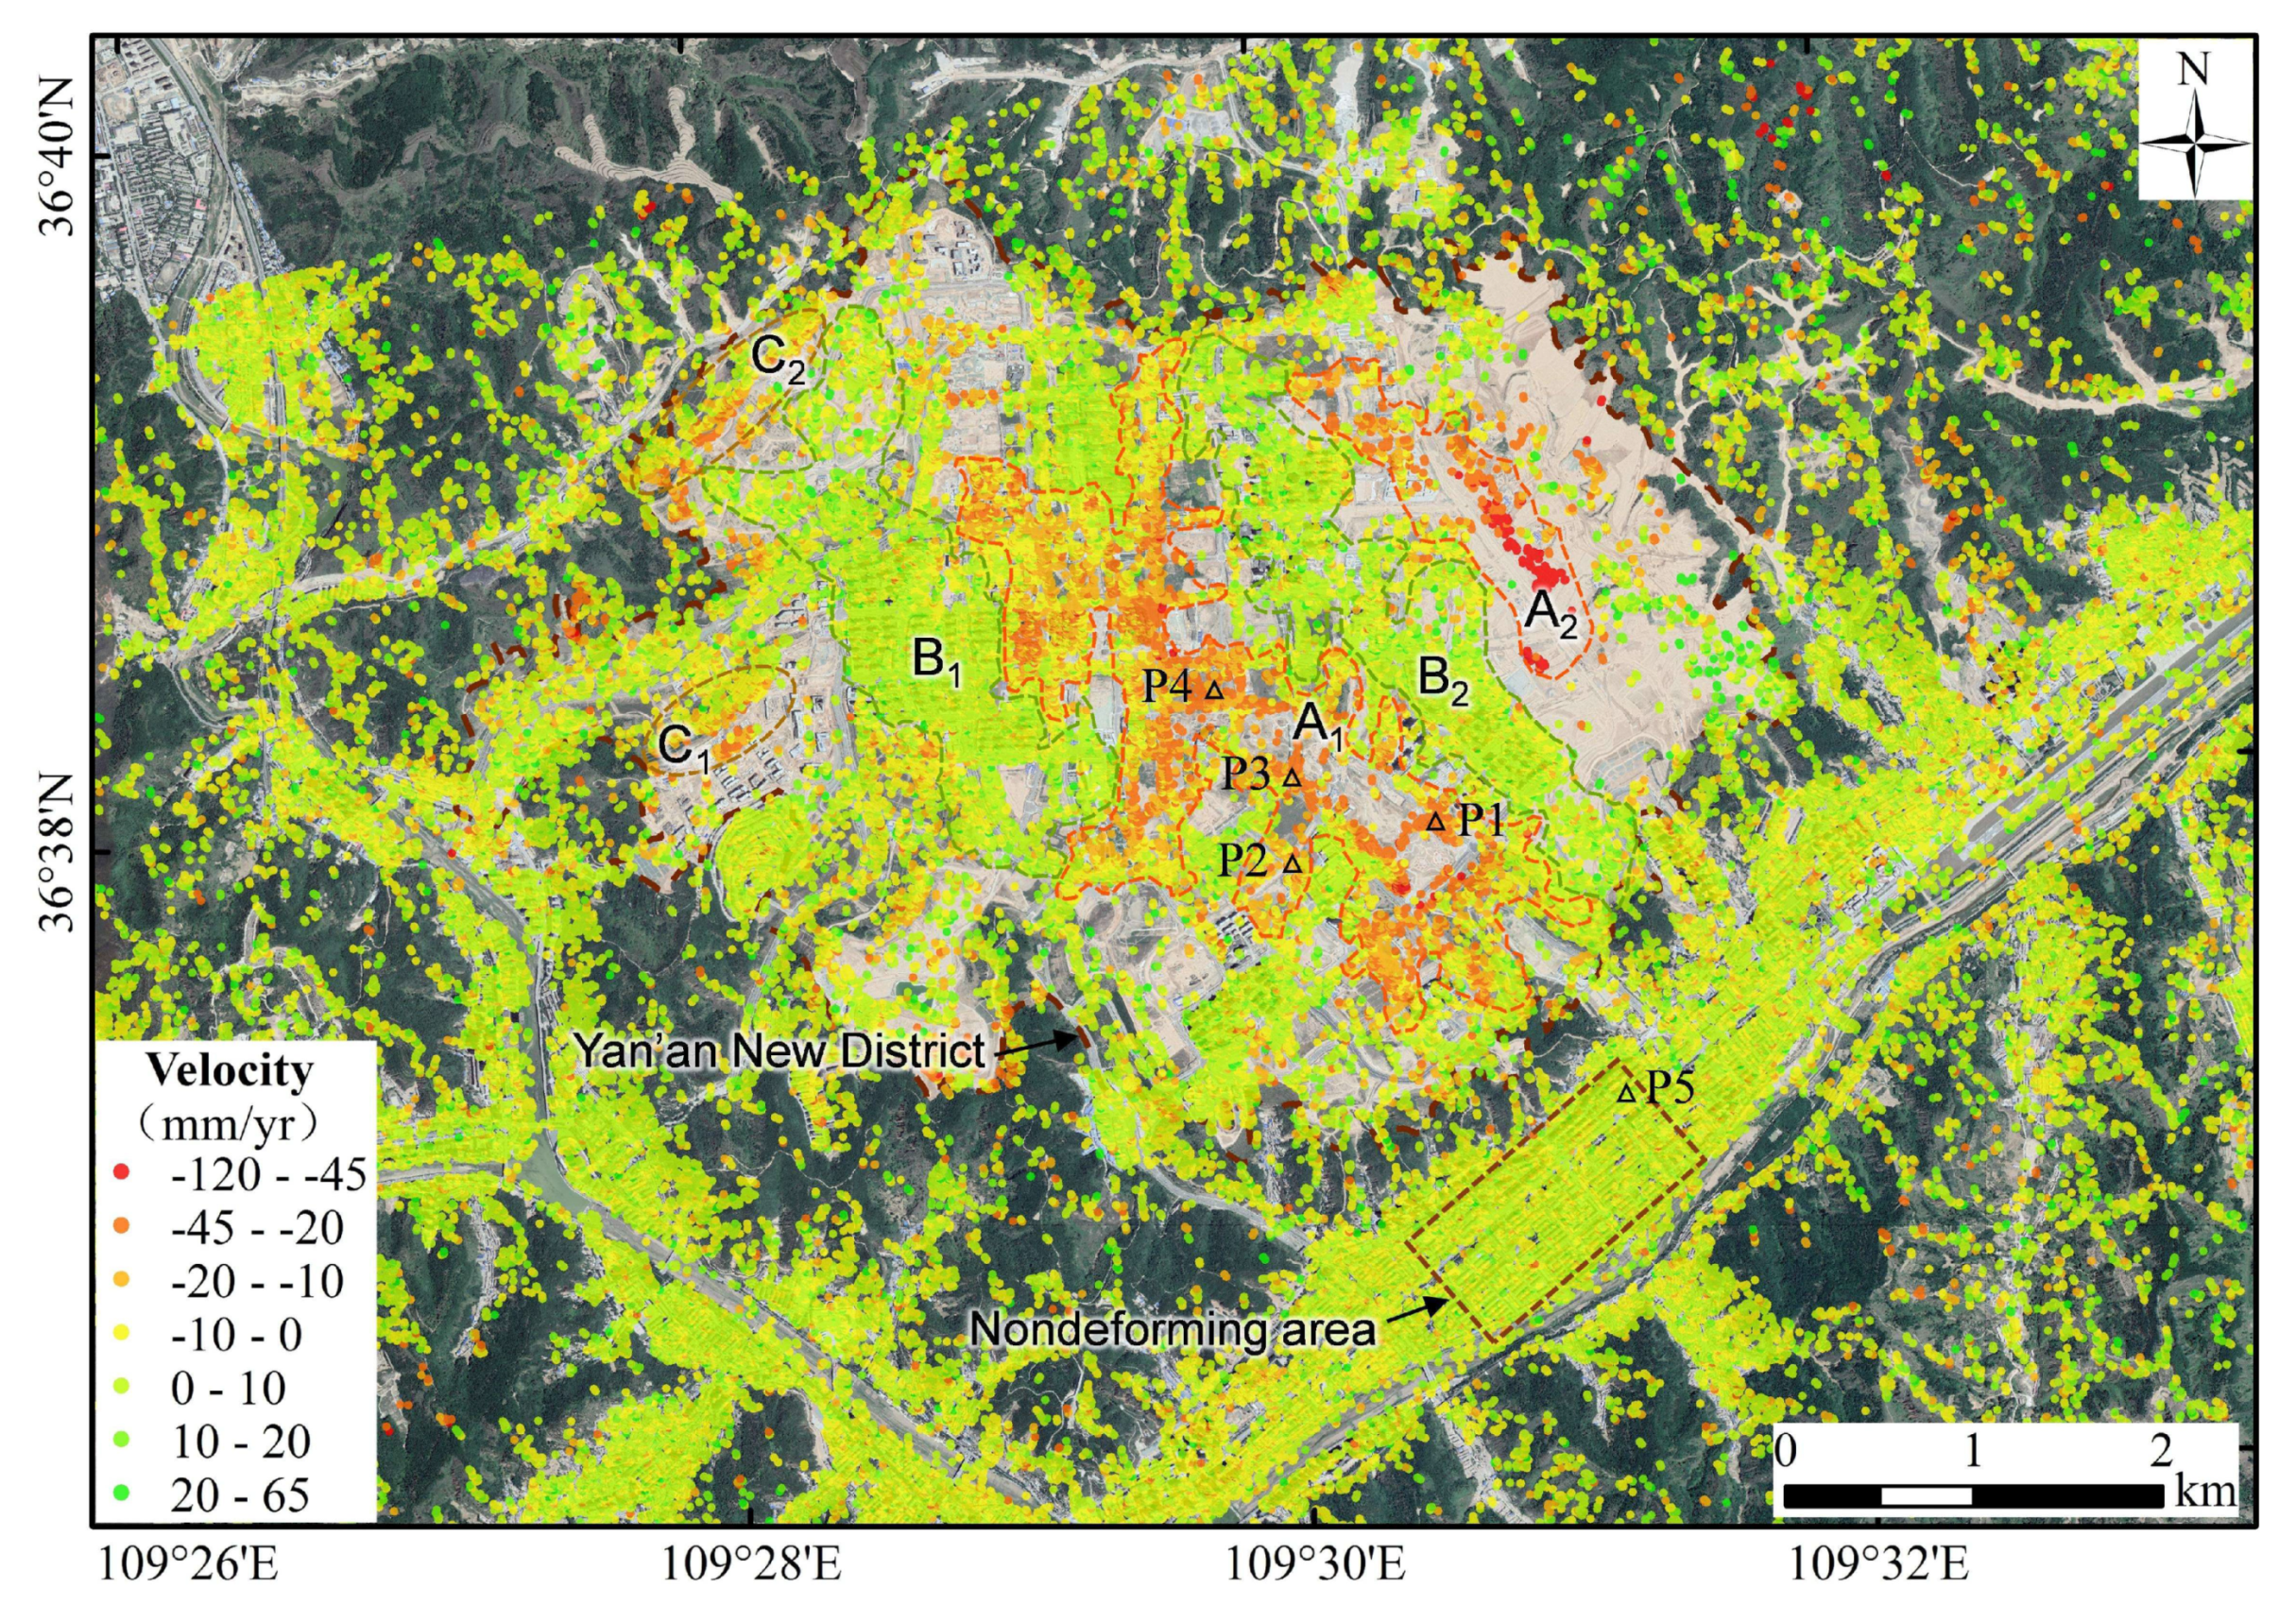
4.2. Ground Deformation of YND
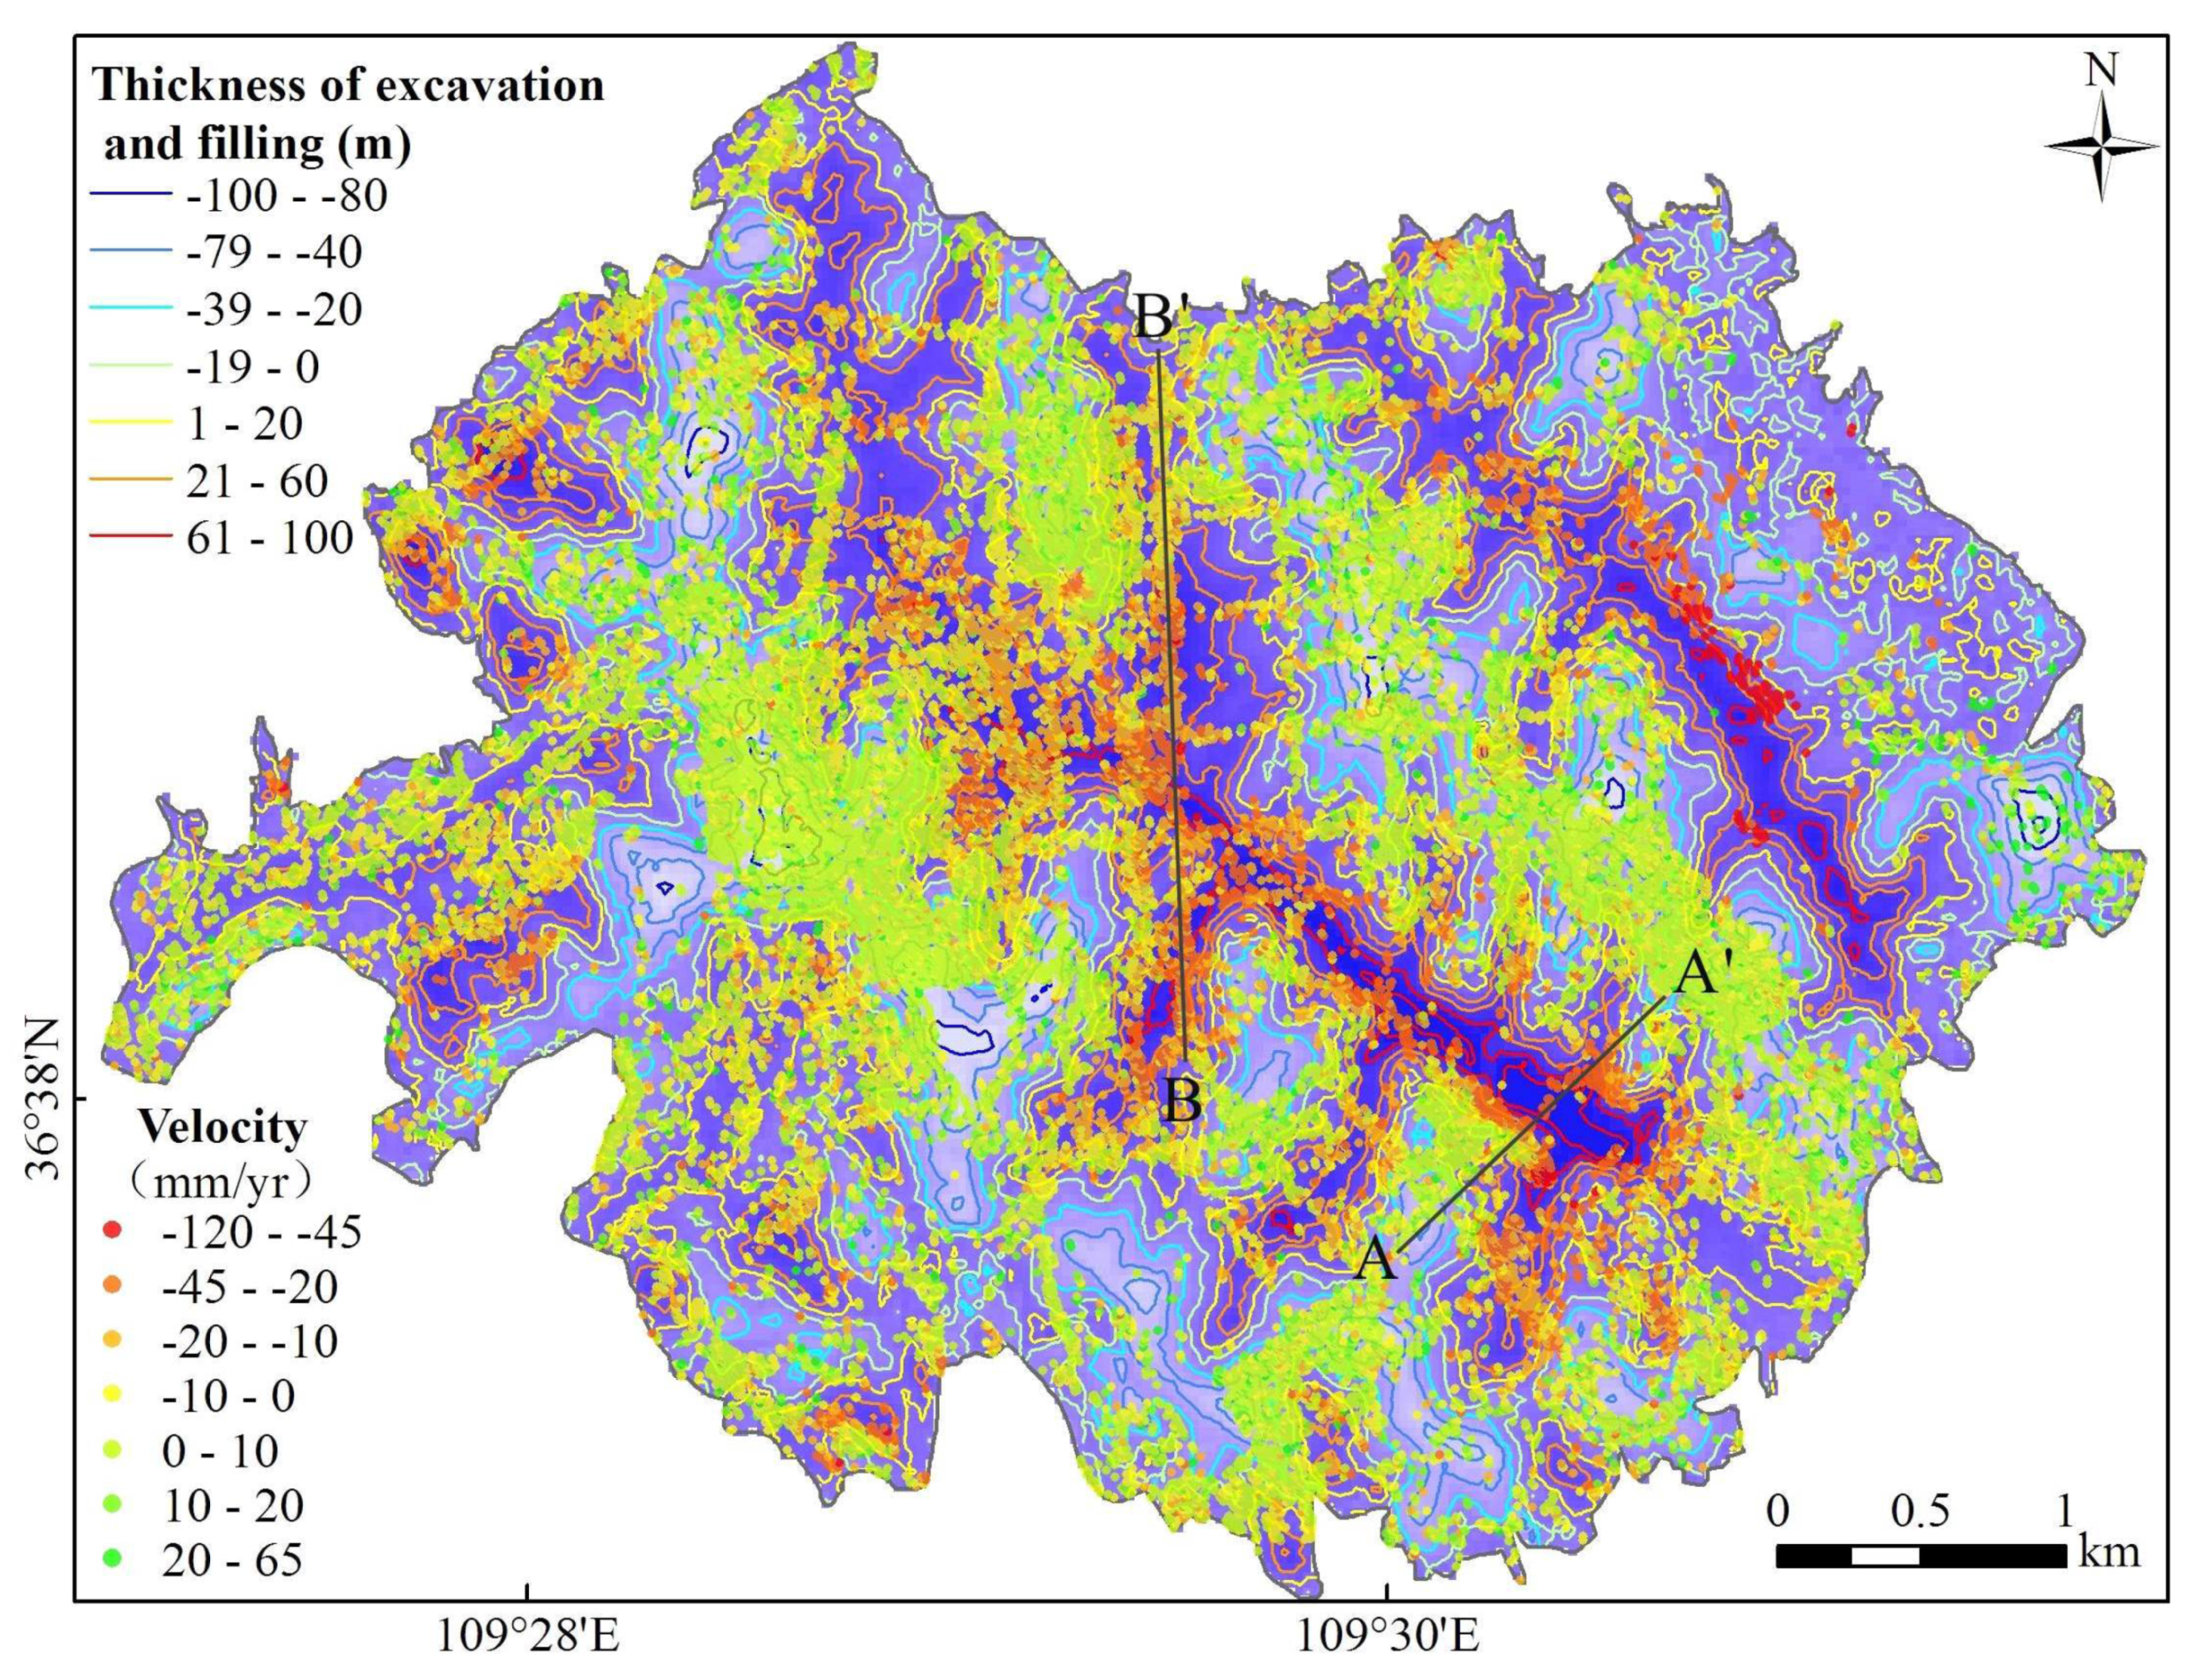
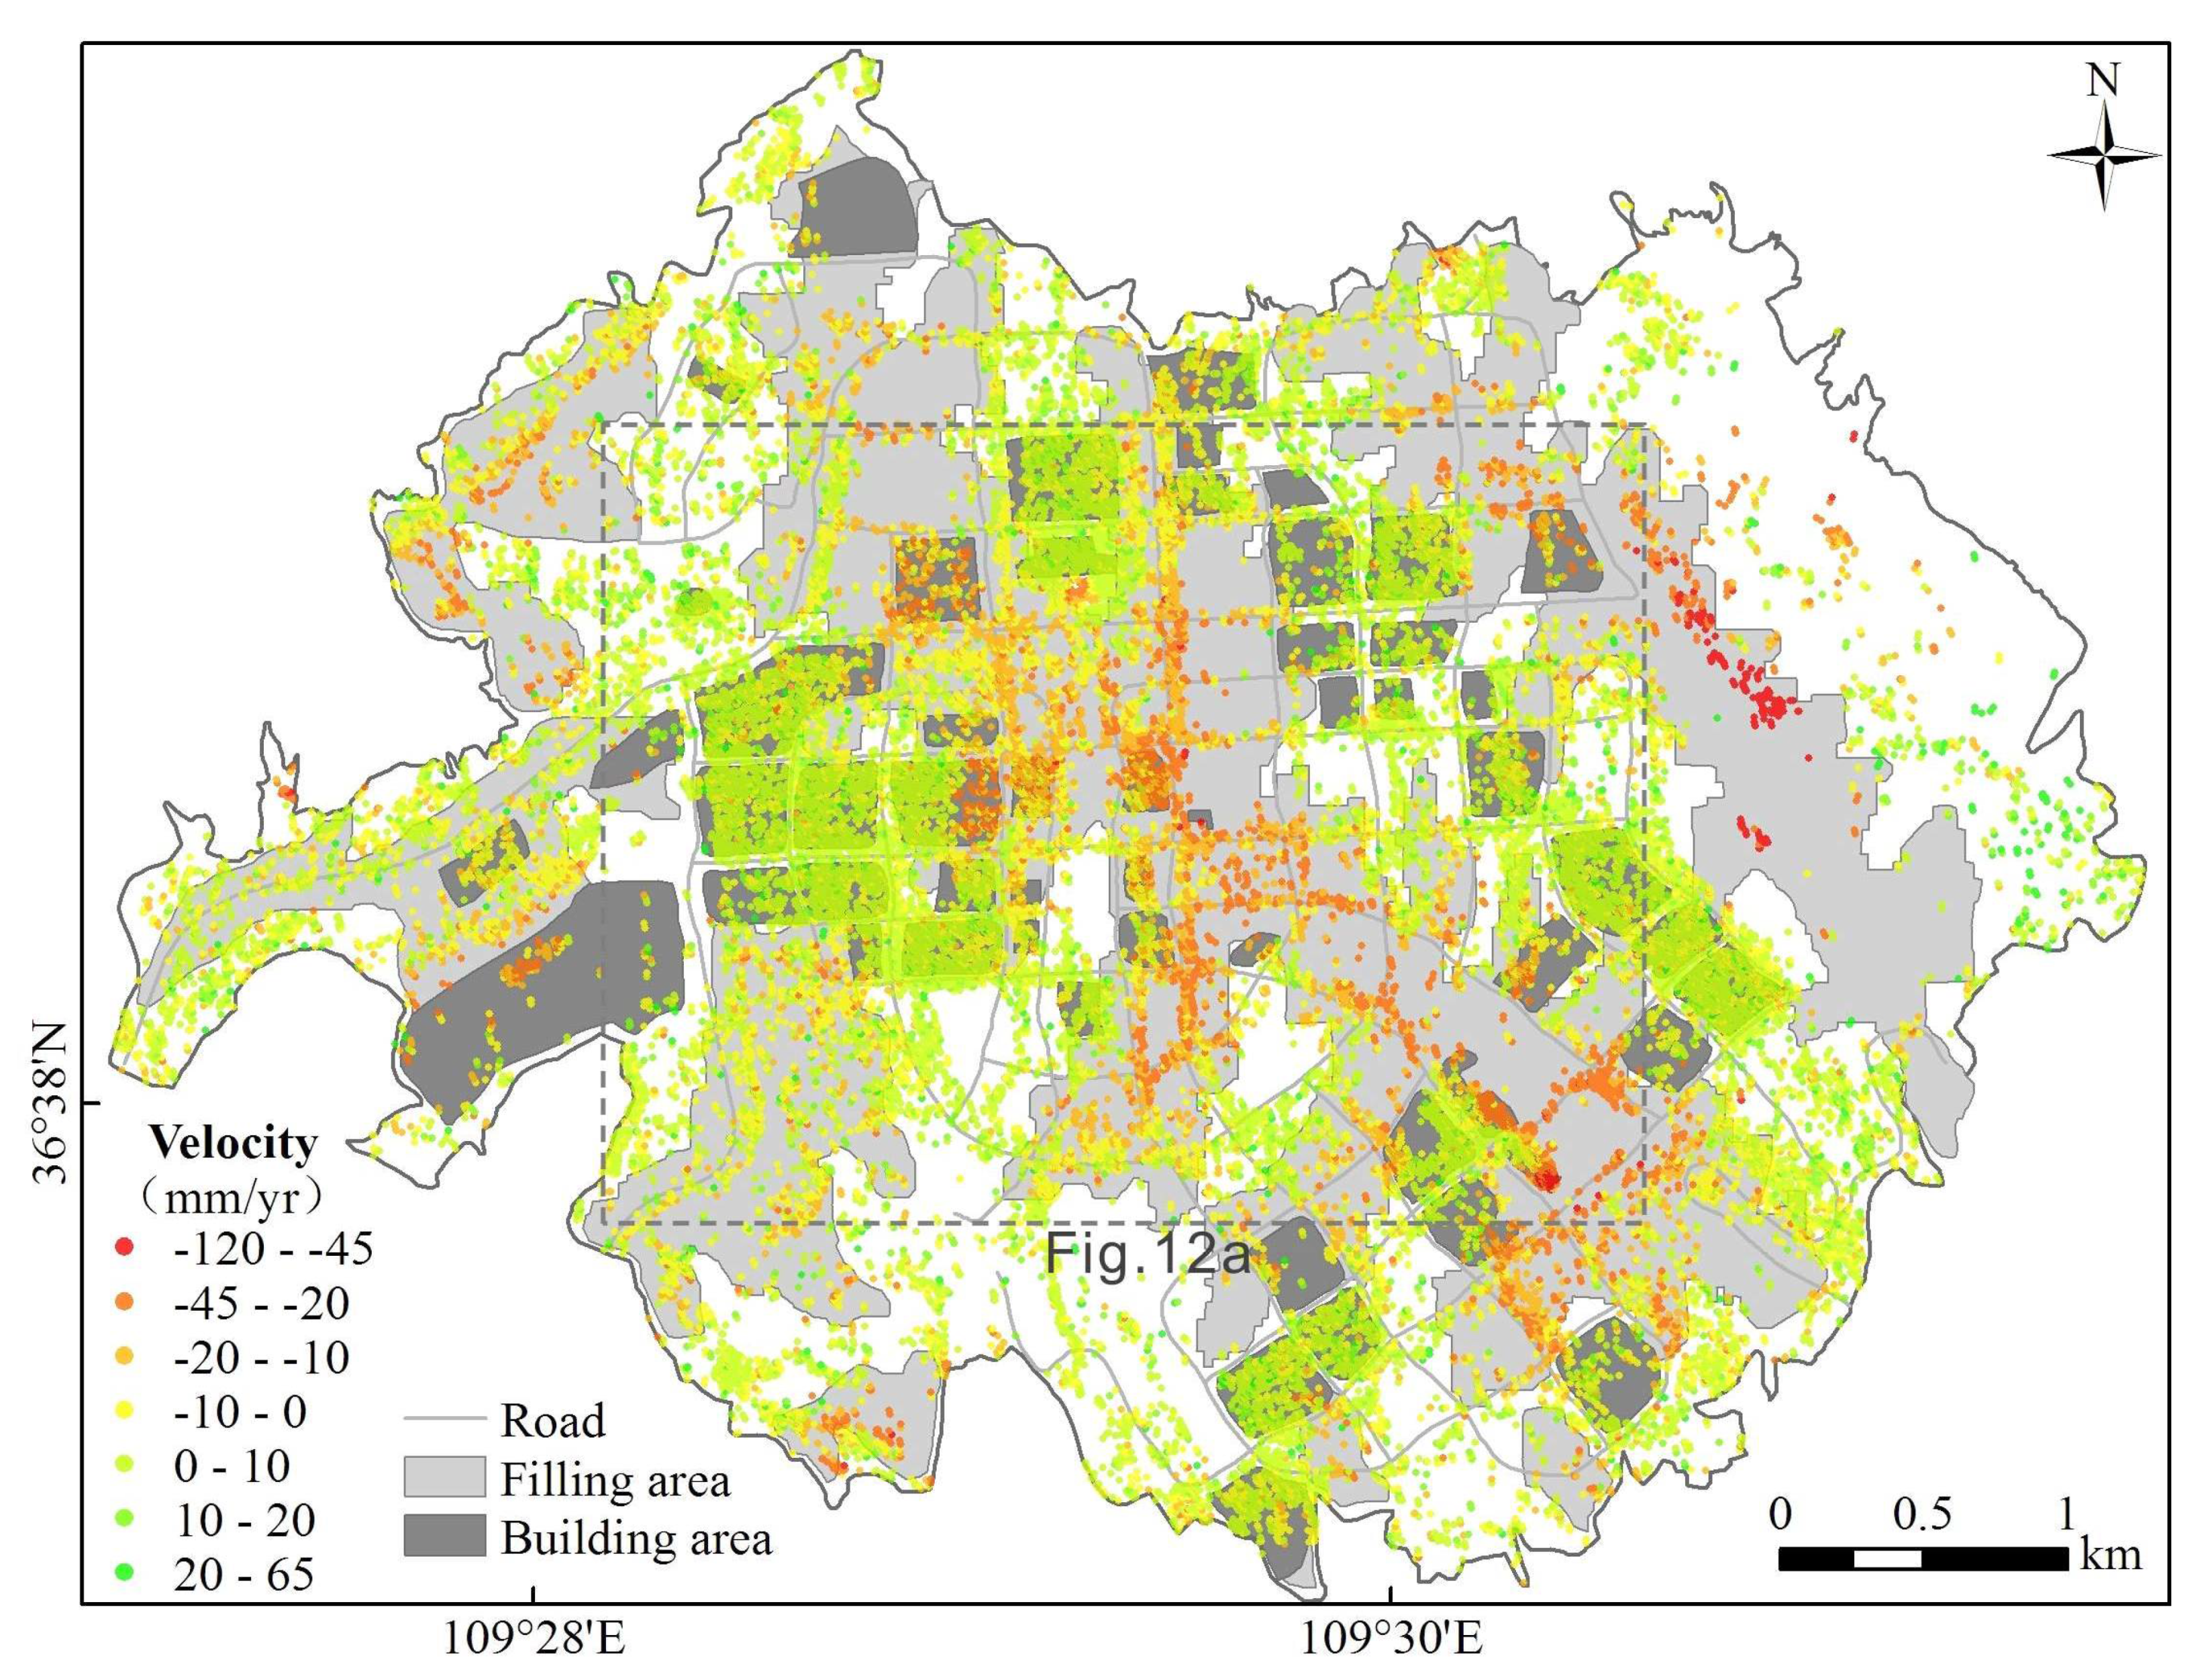
4.2.1. Spatial Pattern
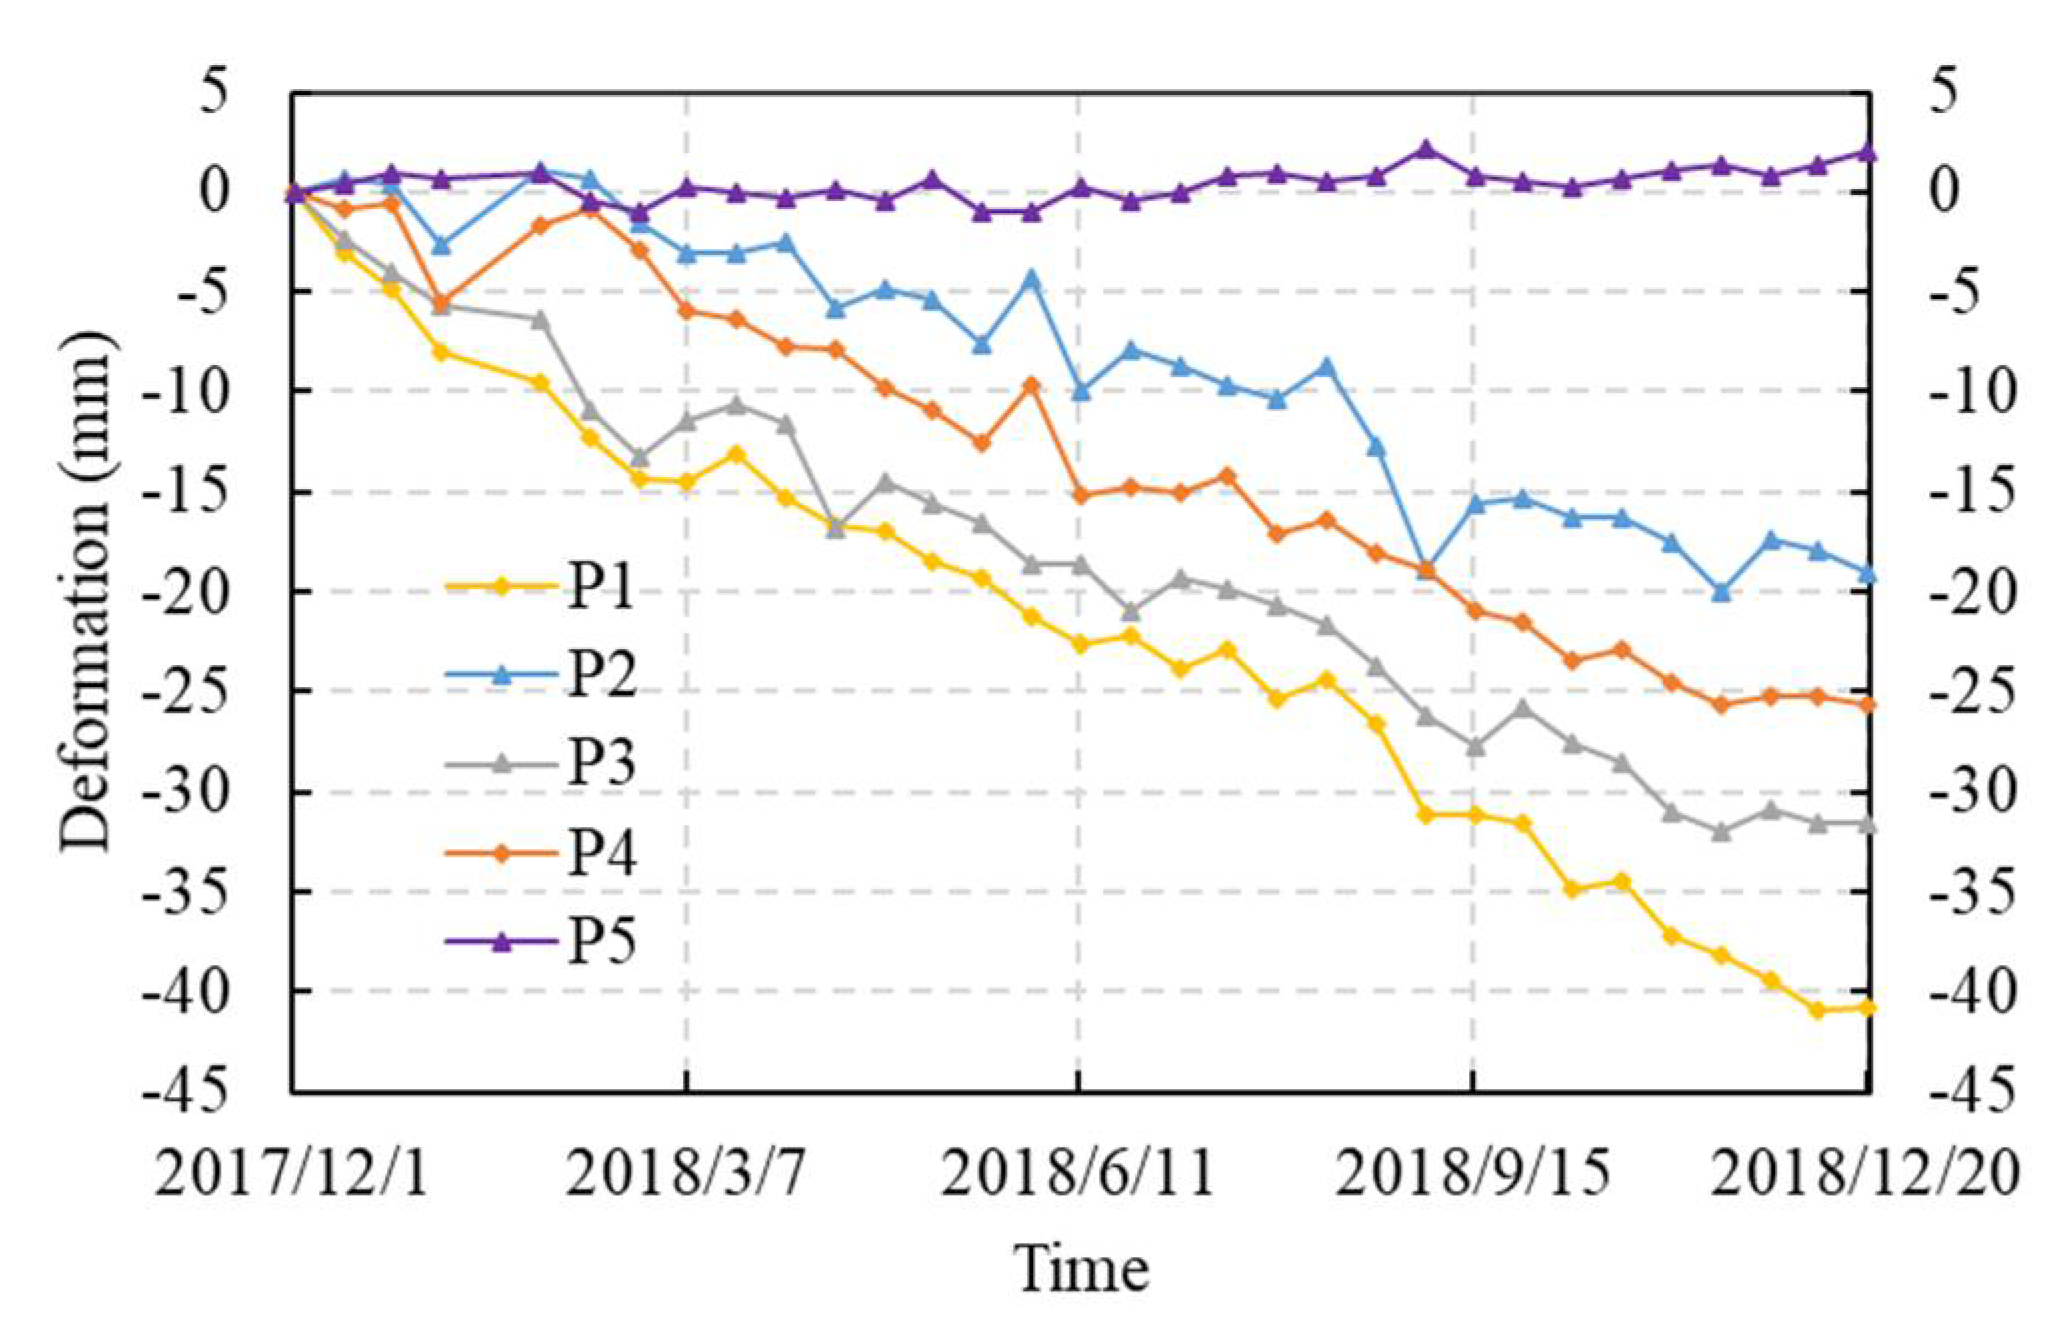
4.2.2. Temporal Evolution
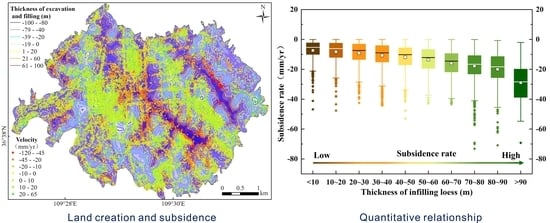
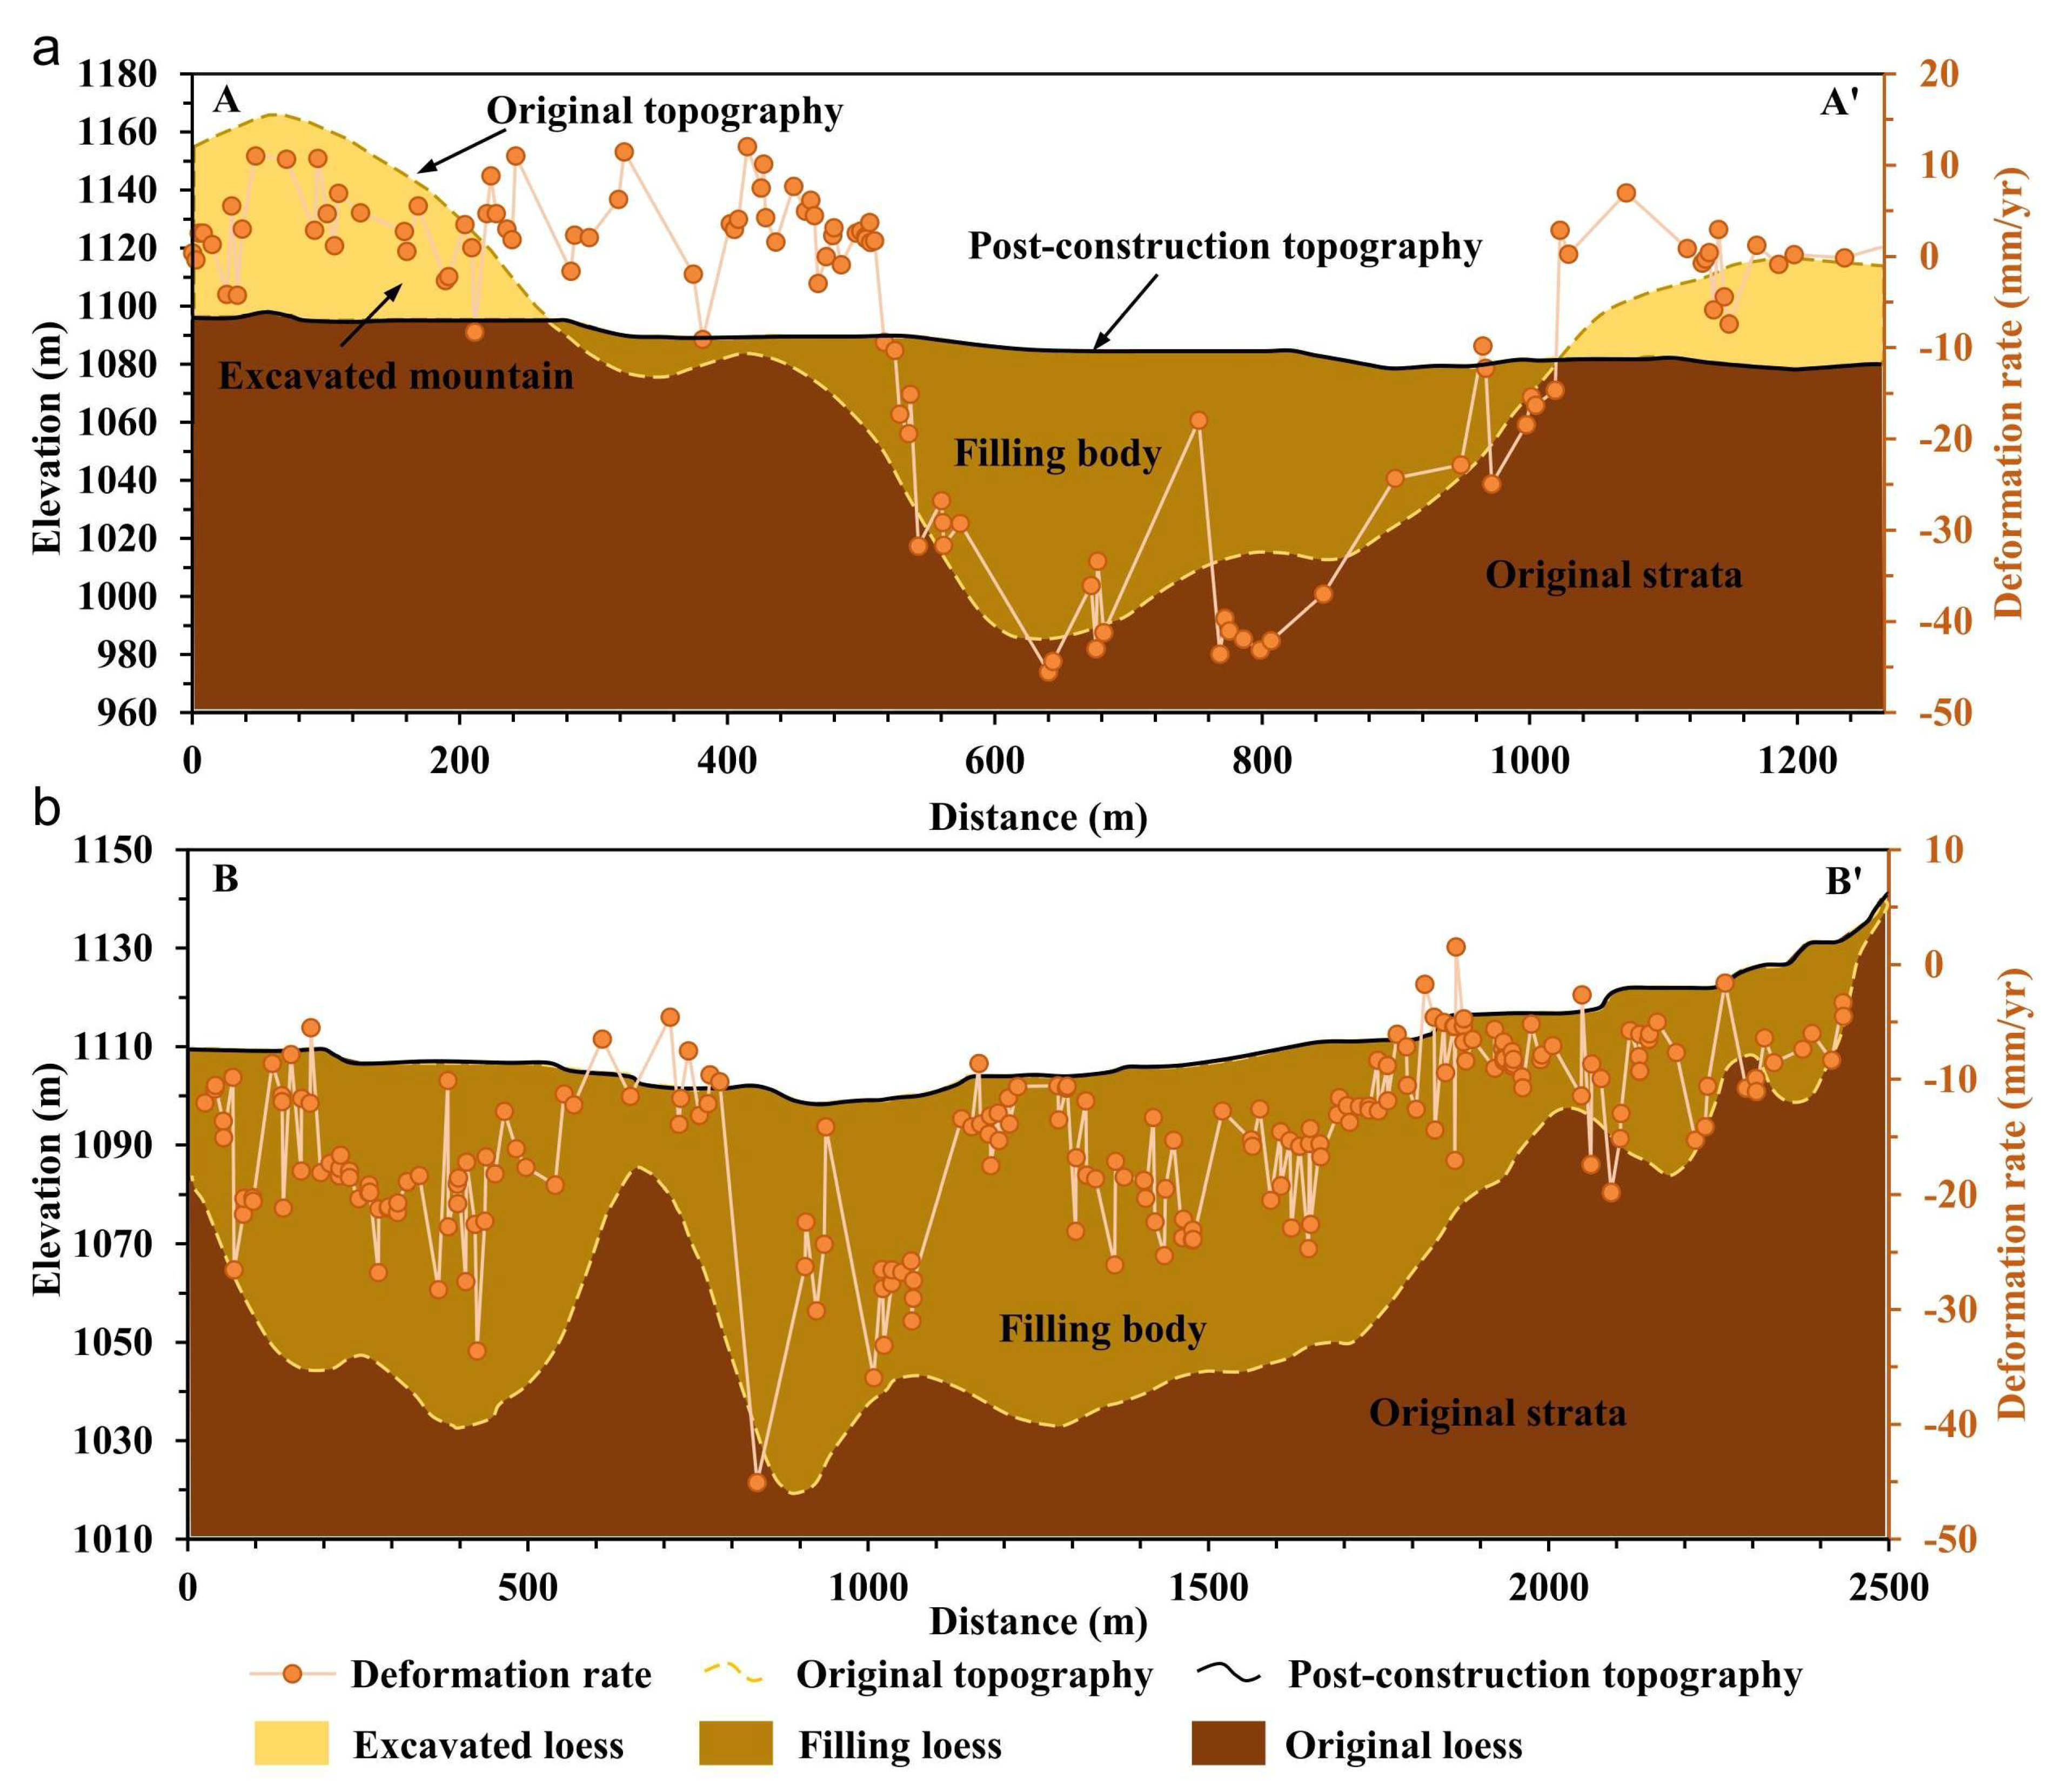
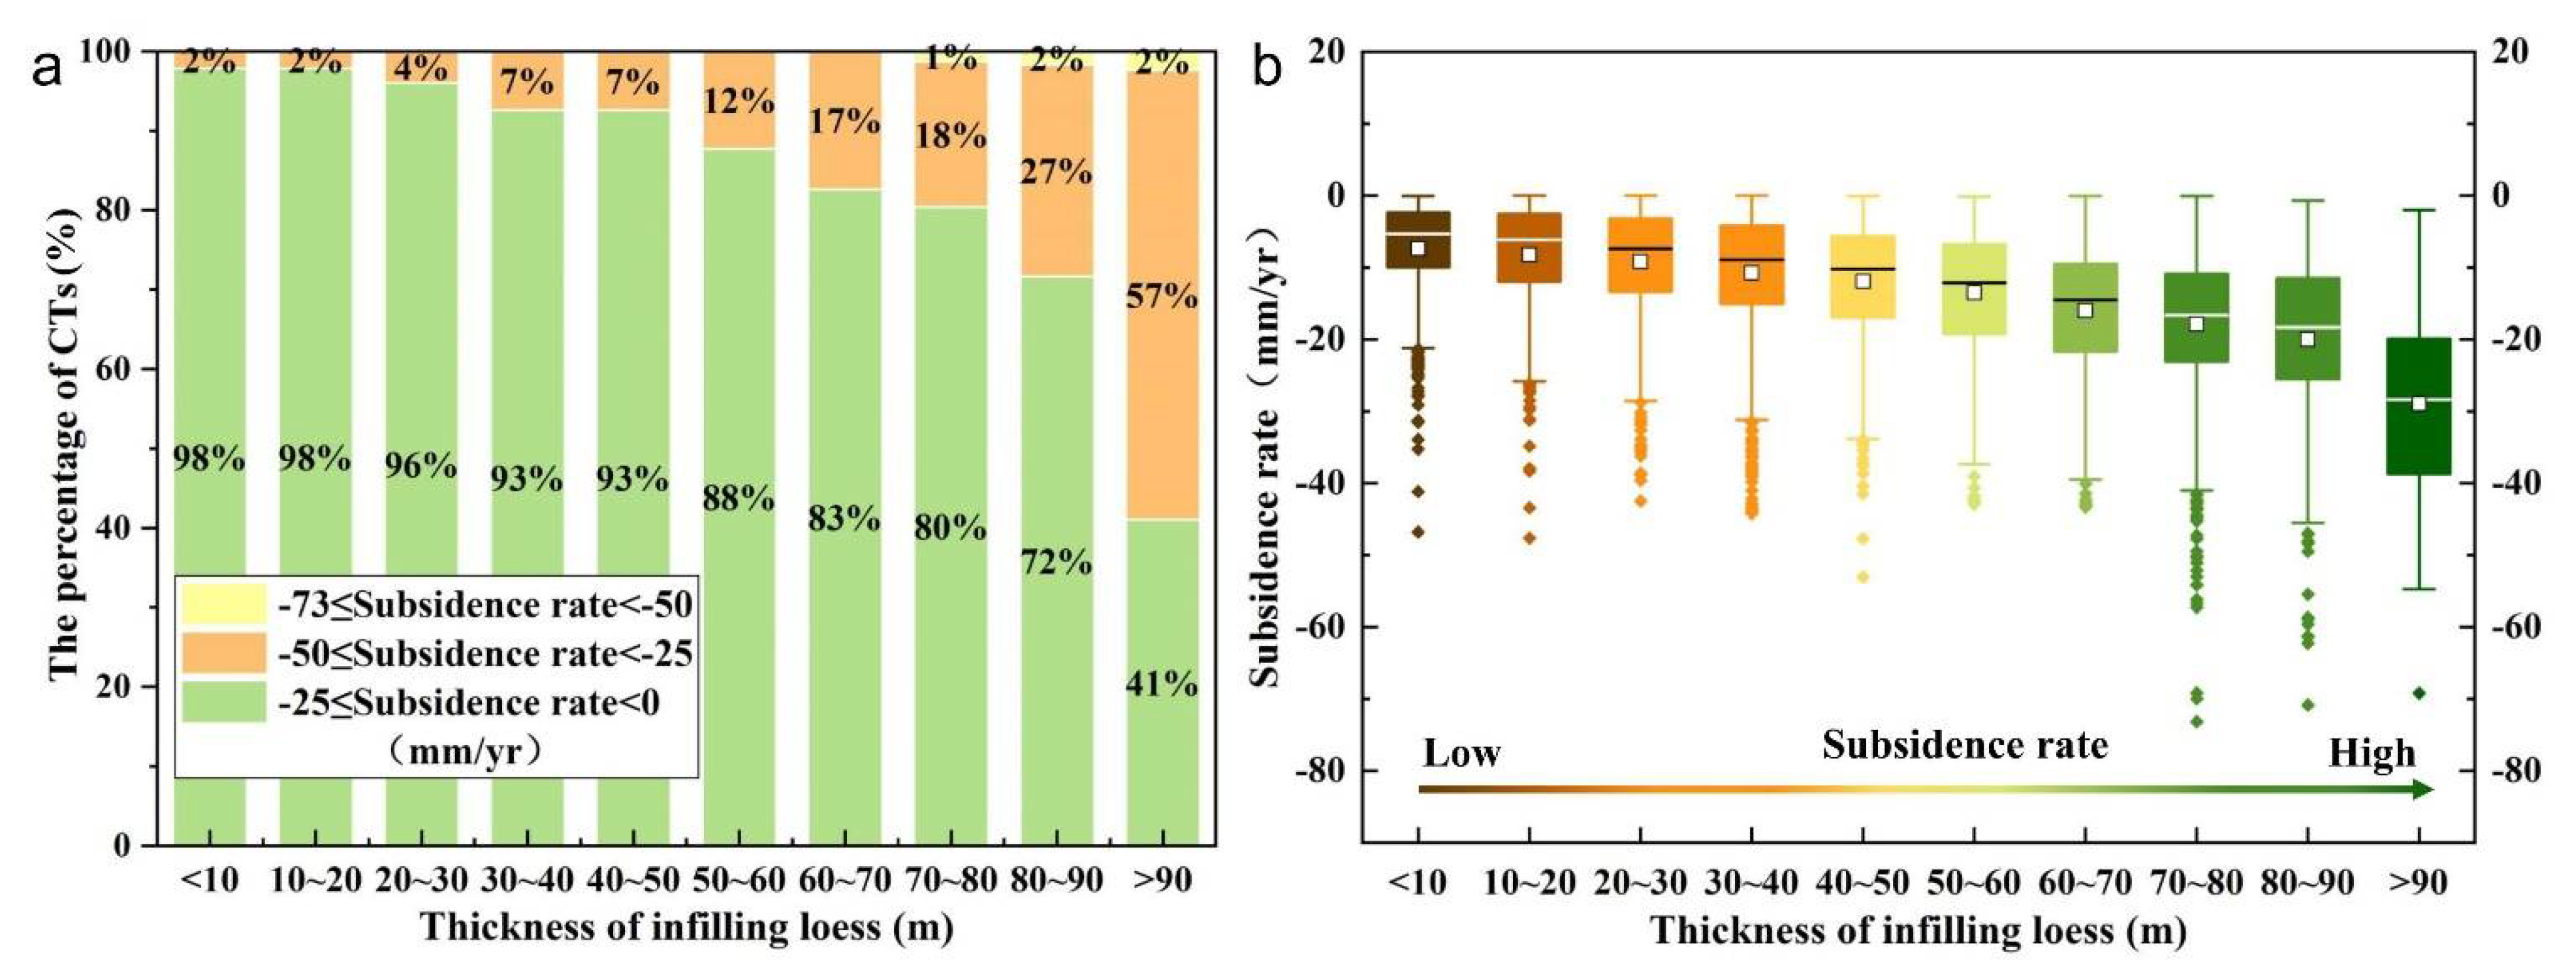
4.3. Relationships between the Topographic Changes and Land Subsidence
5. Discussion
5.1. Subsidence and the MECC Project
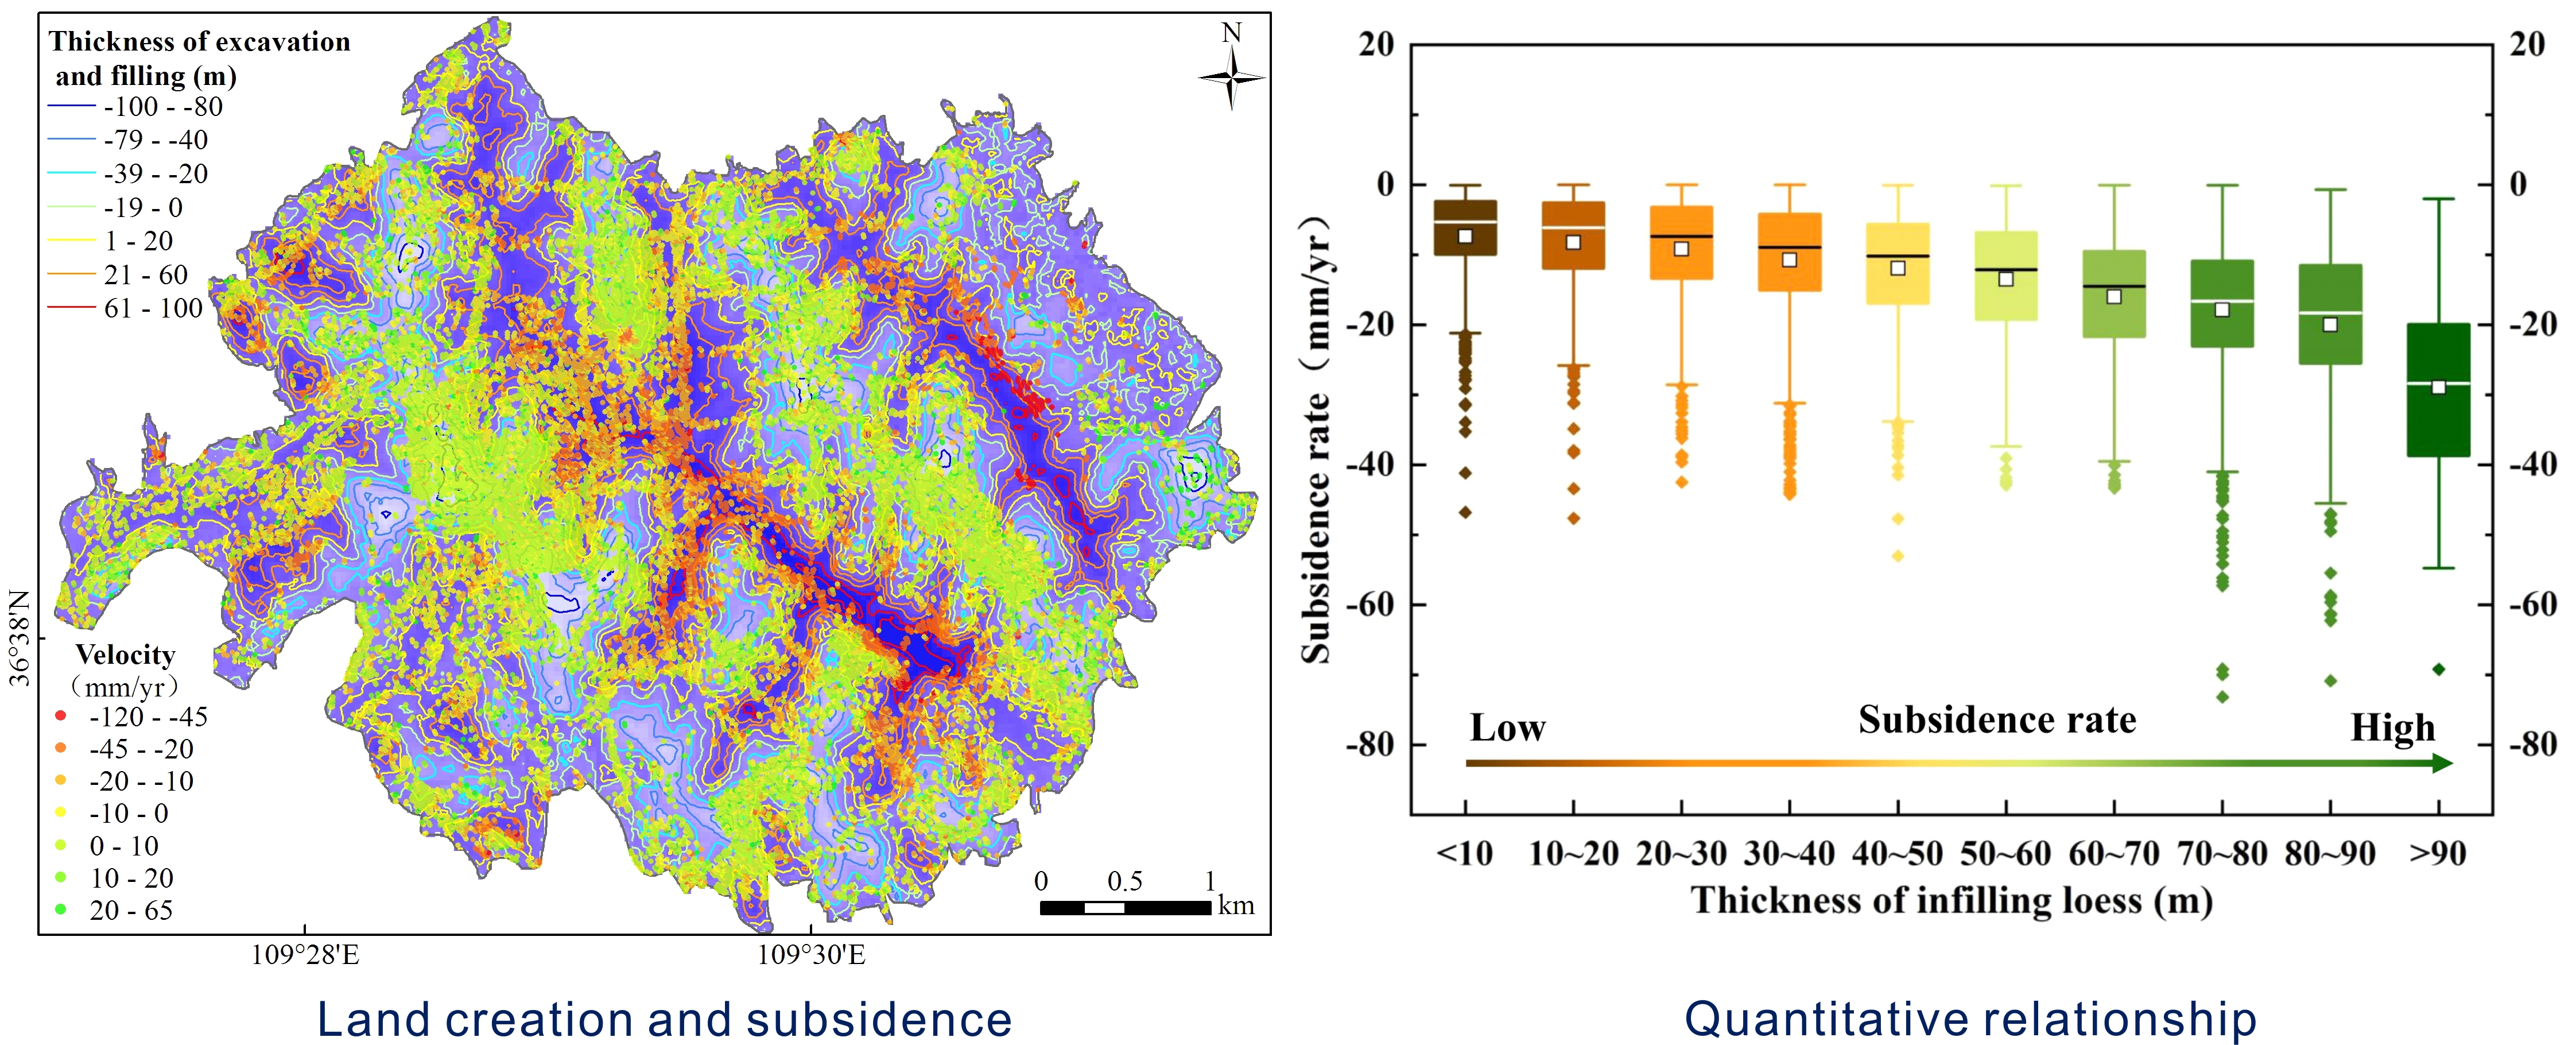
5.1.1. Effect of Large-Scale Land Creation and Urban Construction
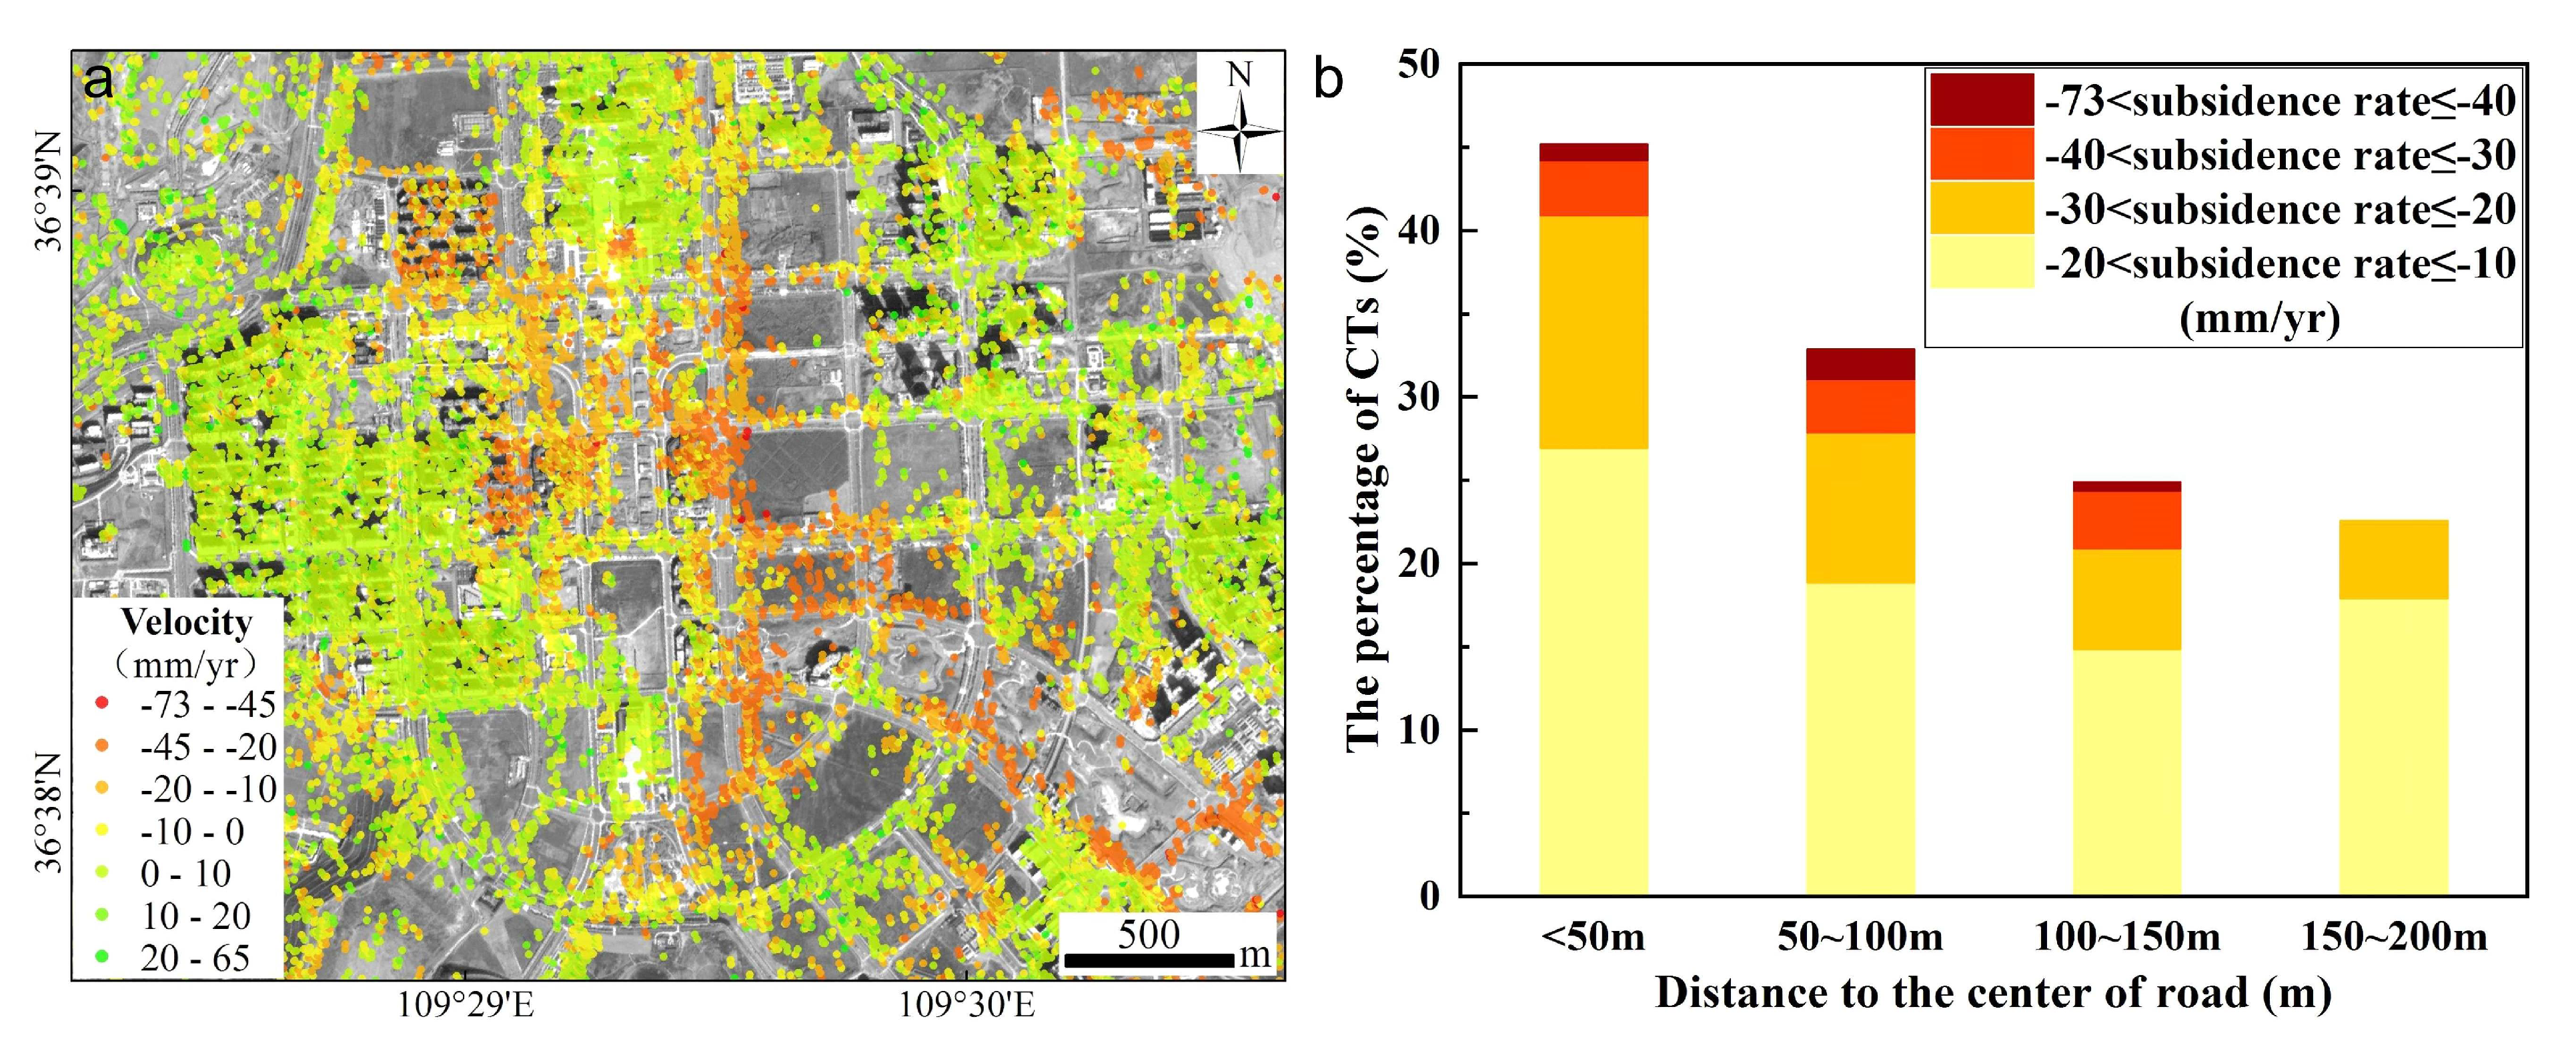
5.1.2. Relationship between the Land Subsidence and Road Network
5.2. Natural Drivers of Subsidence
5.3. Implications and Limitations
6. Conclusions
Author Contributions
Funding
Acknowledgments
Conflicts of Interest
Abbreviations
References
- Liu, T. Loess and the Environment; Science Press: Beijing, China, 1985. (In Chinese) [Google Scholar]
- Li, P.; Qian, H.; Wu, J. Accelerate research on land creation. Nature 2014, 510, 29–31. [Google Scholar] [CrossRef] [PubMed]
- Kou, P.; Xu, Q.; Yunus, A.P.; Dong, X.; Pu, C.; Zhang, X.; Jin, Z. Micro-topographic assessment of rill morphology highlights the shortcomings of current protective measures in loess landscapes. Sci. Total Environ. 2020, 737, 139721–139731. [Google Scholar] [CrossRef] [PubMed]
- Chen, W.; Xu, Q.; Zhao, K.; Zhou, X.; Li, S.; Wang, J.; Wang, X.; Xu, J. Spatial analysis of land-use management for gully land consolidation on the Loess Plateau in China. Ecol. Indic. 2020, 117, 106633–106649. [Google Scholar] [CrossRef]
- Wu, Q.; Jia, C.; Chen, S.; Li, H. SBAS-InSAR based deformation detection of urban land, created from mega-scale mountain excavating and valley filling in the Loess Plateau: The case study of Yan’an City. Remote Sens. 2019, 11, 1673. [Google Scholar] [CrossRef]
- Juang, C.H.; Dijkstra, T.; Wasowski, J.; Meng, X. Loess geohazards research in China: Advances and challenges for mega engineering projects. Eng. Geol. 2019, 251, 1–10. [Google Scholar] [CrossRef]
- Ge, M.; Li, N.; Zhang, W.; Zheng, J.; Zhu, C. Settlement behavior and inverse prediction of post-construction settlement of high filled loess embankment. Chin. J. Rock Mech. Eng. 2017, 36, 745–753. [Google Scholar] [CrossRef]
- Guo, L.; Li, J.; Li, Z.W.; Wu, L.X.; Li, X.; Hu, J.; Li, H.L.; Li, H.Y.; Miao, Z.L.; Li, Z.Q. The Surge of the Hispar Glacier, Central Karakoram: SAR 3-D Flow Velocity Time Series and Thickness Changes. J. Geophys. Res. Solid Earth 2020, 125, 1–24. [Google Scholar] [CrossRef]
- Rateb, A.; Abotalib, A.Z. Inferencing the land subsidence in the Nile Delta using Sentinel-1 satellites and GPS between 2015 and 2019. Sci. Total Environ. 2020, 729, 138868. [Google Scholar] [CrossRef] [PubMed]
- Xu, Q.; Zhao, K.; Liu, F.; Peng, D.; Chen, W. Effects of land use on groundwater recharge of a loess terrace under long-term irrigation. Sci. Total Environ. 2021, 751, 142340–142354. [Google Scholar] [CrossRef] [PubMed]
- Ren, S.; Menenti, M.; Jia, L.; Zhang, J.; Zhang, J.; Li, X. Glacier mass balance in the Nyainqentanglha mountains between 2000 and 2017 retrieved from ZiYuan-3 stereo images and the SRTM DEM. Remote Sens. 2020, 12, 864. [Google Scholar] [CrossRef]
- Ma, P.; Wang, W.; Zhang, B.; Wang, J.; Shi, G.; Huang, G.; Chen, F.; Jiang, L.; Lin, H. Remotely sensing large- and small-scale ground subsidence: A case study of the Guangdong–Hong Kong–Macao Greater Bay Area of China. Remote Sens. Environ. 2019, 232, 111282–111299. [Google Scholar] [CrossRef]
- Yang, C.; Lu, Z.; Zhang, Q.; Zhao, C.; Peng, J.; Ji, L. Deformation at longyao ground fissure and its surroundings, north China plain, revealed by ALOS PALSAR PS-InSAR. Int. J. Appl. Earth Obs. Geoinf. 2018, 67, 1–9. [Google Scholar] [CrossRef]
- Atzori, S.; Antonioli, A.; Tolomei, C.; De Novellis, V.; De Luca, C.; Monterroso, F. InSAR full-resolution analysis of the 2017–2018 M>6 earthquakes in Mexico. Remote Sens. Environ. 2019, 234, 111461–111470. [Google Scholar] [CrossRef]
- Confuorto, P.; Di Martire, D.; Infante, D.; Novellino, A.; Papa, R.; Calcaterra, D.; Ramondini, M. Monitoring of remedial works performance on landslide-affected areas through ground- and satellite-based techniques. Catena 2019, 178, 77–89. [Google Scholar] [CrossRef]
- Li, M.; Zhang, L.; Ding, C.; Li, W.; Luo, H.; Liao, M.; Xu, Q. Retrieval of historical surface displacements of the Baige landslide from time-series SAR observations for retrospective analysis of the collapse event. Remote Sens. Environ. 2020, 240, 111695–111705. [Google Scholar] [CrossRef]
- Carlà, T.; Intrieri, E.; Raspini, F.; Bardi, F.; Farina, P.; Ferretti, A.; Colombo, D.; Novali, F.; Casagli, N. Perspectives on the prediction of catastrophic slope failures from satellite InSAR. Sci. Rep. 2019, 9, 14137–14145. [Google Scholar] [CrossRef] [PubMed]
- Cigna, F.; Tapete, D. Present-day land subsidence rates, surface faulting hazard and risk in Mexico City with 2014–2020 Sentinel-1 IW InSAR. Remote Sens. Environ. 2021, 253, 112161–112179. [Google Scholar] [CrossRef]
- Colesanti, C.; Ferretti, A.; Prati, C.; Rocca, F. Monitoring landslides and tectonic motions with the Permanent Scatterers Technique. Eng. Geol. 2003, 68, 3–14. [Google Scholar] [CrossRef]
- Ferretti, A.; Prati, C.; Rocca, F. Permanent scatterers in SAR interferometry. IEEE Trans. Geosci. Remote Sens. 2001, 39, 8–20. [Google Scholar] [CrossRef]
- Ferretti, A.; Prati, C.; Rocca, F. Nonlinear subsidence rate estimation using permanent scatterers in differential SAR interferometry. IEEE Trans. Geosci. Remote Sens. 2000, 38, 2202–2212. [Google Scholar] [CrossRef]
- Berardino, P.; Fornaro, G.; Lanari, R.; Sansosti, E. A new algorithm for surface deformation monitoring based on small baseline differential SAR interferograms. IEEE Trans. Geosci. Remote Sens. 2002, 40, 2375–2383. [Google Scholar] [CrossRef]
- Castellazzi, P.; Garfias, J.; Martel, R.; Brouard, C.; Rivera, A. InSAR to support sustainable urbanization over compacting aquifers: The case of Toluca Valley, Mexico. Int. J. Appl. Earth Obs. Geoinf. 2017, 63, 33–44. [Google Scholar] [CrossRef]
- Figueroa-Miranda, S.; Tuxpan-Vargas, J.; Ramos-Leal, J.A.; Hernández-Madrigal, V.M.; Villaseñor-Reyes, C.I. Land subsidence by groundwater over-exploitation from aquifers in tectonic valleys of Central Mexico: A review. Eng. Geol. 2018, 246, 91–106. [Google Scholar] [CrossRef]
- Corbau, C.; Simeoni, U.; Zoccarato, C.; Mantovani, G.; Teatini, P. Coupling land use evolution and subsidence in the Po Delta, Italy: Revising the past occurrence and prospecting the future management challenges. Sci. Total Environ. 2019, 654, 1196–1208. [Google Scholar] [CrossRef]
- Solari, L.; Ciampalini, A.; Raspini, F.; Bianchini, S.; Moretti, S. PSInSAR analysis in the pisa urban area (Italy): A case study of subsidence related to stratigraphical factors and urbanization. Remote Sens. 2016, 8, 120. [Google Scholar] [CrossRef]
- Hu, L.; Dai, K.; Xing, C.; Li, Z.; Tomás, R.; Clark, B.; Shi, X.; Chen, M.; Zhang, R.; Qiu, Q.; et al. Land subsidence in Beijing and its relationship with geological faults revealed by Sentinel-1 InSAR observations. Int. J. Appl. Earth Obs. Geoinf. 2019, 82, 101886–101895. [Google Scholar] [CrossRef]
- Yu, H.; Gong, H.; Chen, B.; Liu, K.; Gao, M. Analysis of the influence of groundwater on land subsidence in Beijing based on the geographical weighted regression (GWR) model. Sci. Total Environ. 2020, 738, 139405–139418. [Google Scholar] [CrossRef] [PubMed]
- Qu, F.; Zhang, Q.; Lu, Z.; Zhao, C.; Yang, C.; Zhang, J. Land subsidence and ground fissures in Xi’an, China 2005–2012 revealed by multi-band InSAR time-series analysis. Remote Sens. Environ. 2014, 155, 366–376. [Google Scholar] [CrossRef]
- Wang, T.; Zhang, G.; Li, D.; Tang, X.; Jiang, Y.; Pan, H.; Zhu, X.; Fang, C. Geometric accuracy validation for ZY-3 satellite imagery. IEEE Geosci. Remote Sens. Lett. 2014, 11, 1168–1171. [Google Scholar] [CrossRef]
- Dong, Y.; Chen, W.; Chang, H.; Zhang, Y.; Feng, R.; Meng, L. Assessment of orthoimage and DEM derived from ZY-3 stereo image in Northeastern China. Surv. Rev. 2016, 48, 247–257. [Google Scholar] [CrossRef]
- Ni, W.; Sun, G.; Ranson, K.J.; Pang, Y.; Zhang, Z.; Yao, W. Extraction of ground surface elevation from ZY-3 winter stereo imagery over deciduous forested areas. Remote Sens. Environ. 2015, 159, 194–202. [Google Scholar] [CrossRef]
- Zhou, P.; Tang, X.; Wang, Z.; Cao, N.; Wang, X. Vertical accuracy effect verification for satellite imagery with different GCPs. IEEE Geosci. Remote Sens. Lett. 2017, 14, 1268–1272. [Google Scholar] [CrossRef]
- Soliman, A.; Han, L. Effects of vertical accuracy of digital elevation model (DEM) data on automatic lineaments extraction from shaded DEM. Adv. Space Res. 2019, 64, 603–622. [Google Scholar] [CrossRef]
- Zhang, Y.; Meng, X.M.; Dijkstra, T.A.; Jordan, C.J.; Chen, G.; Zeng, R.Q.; Novellino, A. Forecasting the magnitude of potential landslides based on InSAR techniques. Remote Sens. Environ. 2020, 241, 111738–111751. [Google Scholar] [CrossRef]
- Wasowski, J.; Bovenga, F. Investigating landslides and unstable slopes with satellite Multi Temporal Interferometry: Current issues and future perspectives. Eng. Geol. 2014, 174, 103–138. [Google Scholar] [CrossRef]
- Sun, H.; Zhang, Q.; Zhao, C.; Yang, C.; Sun, Q.; Chen, W. Monitoring land subsidence in the southern part of the lower Liaohe plain, China with a multi-track PS-InSAR technique. Remote Sens. Environ. 2017, 188, 73–84. [Google Scholar] [CrossRef]
- Chen, G.; Zhang, Y.; Zeng, R.; Yang, Z.; Chen, X.; Zhao, F.; Meng, X. Detection of land subsidence associated with land creation and rapid urbanization in the Chinese Loess Plateau using time series InSAR: A case study of Lanzhou New District. Remote Sens. 2018, 10, 270. [Google Scholar] [CrossRef]
- Mario Costantini, T. A novel phase unwrapping method based on network programming. IEEE Trans. Geosci. Remote Sens. 1998, 36, 813–821. [Google Scholar] [CrossRef]
- Shi, X.; Xu, Q.; Zhang, L.; Zhao, K.; Dong, J.; Jiang, H.; Liao, M. Surface displacements of the Heifangtai terrace in Northwest China measured by X and C-band InSAR observations. Eng. Geol. 2019, 259, 105181–106193. [Google Scholar] [CrossRef]
- Meldebekova, G.; Yu, C.; Li, Z.; Song, C. Quantifying ground subsidence associated with aquifer overexploitation using space-borne radar interferometry in Kabul, Afghanistan. Remote Sens. 2020, 12, 2461. [Google Scholar] [CrossRef]
- Jiang, M.; Zhang, F.; Hu, H.; Cui, Y.; Peng, J. Structural characterization of natural loess and remolded loess under triaxial tests. Eng. Geol. 2014, 181, 249–260. [Google Scholar] [CrossRef]
- Rendell, H.M. Comparison between naturally consolidated and laboratory consolidated loess. Eng. Geol. 1988, 25, 229–233. [Google Scholar] [CrossRef]
- Jiang, L.; Lin, H. Integrated analysis of SAR interferometric and geological data for investigating long-term reclamation settlement of Chek Lap Kok Airport, Hong Kong. Eng. Geol. 2010, 110, 77–92. [Google Scholar] [CrossRef]
- Liu, Y.; Li, Y. Environment: China’s land creation project stands firm. Nature 2014, 511, 410. [Google Scholar] [CrossRef] [PubMed]


| Data | Parameters | Description |
|---|---|---|
| ZY-3 | Spatial resolution (m) | Nadir (2.5) Forward (3.5) Backward (3.5) |
| Swath Width (km) | 52 | |
| Sentinel-1A | Band | C |
| Wavelength (cm) | 5.6 | |
| Orbit direction | Ascending | |
| Mean Incidence angle (°) | 33.9 | |
| Resolution (m) of Rg × Az | 5 × 20 | |
| Polarization | VV | |
| Number of images | 32 | |
| Date period | December 2017 to December 2018 | |
| Shuttle radar topography mission (SRTM) | Resolution (m) | 30 |
| Google Earth | Resolution (m) | 0.48 |
| Land Creation Region | Completion Time | Fill Area (km2) | Mean Thickness (m) | Maximum Thickness (m) |
|---|---|---|---|---|
| Qiaoergou | 17 November 2013 | 5.9 | 36 | 108 |
| Gaojiagou | 13 October 2017 | 2.1 | 31 | 81 |
| Location | P1 | P2 | P3 | P4 |
|---|---|---|---|---|
| Velocity (mm/yr) | −35.2 | −20.1 | −29.2 | −23.7 |
| Field investigation photos |  |  |  |  |
Publisher’s Note: MDPI stays neutral with regard to jurisdictional claims in published maps and institutional affiliations. |
© 2021 by the authors. Licensee MDPI, Basel, Switzerland. This article is an open access article distributed under the terms and conditions of the Creative Commons Attribution (CC BY) license (https://creativecommons.org/licenses/by/4.0/).
Share and Cite
Pu, C.; Xu, Q.; Zhao, K.; Jiang, Y.; Hao, L.; Liu, J.; Chen, W.; Kou, P. Characterizing the Topographic Changes and Land Subsidence Associated with the Mountain Excavation and City Construction on the Chinese Loess Plateau. Remote Sens. 2021, 13, 1556. https://doi.org/10.3390/rs13081556
Pu C, Xu Q, Zhao K, Jiang Y, Hao L, Liu J, Chen W, Kou P. Characterizing the Topographic Changes and Land Subsidence Associated with the Mountain Excavation and City Construction on the Chinese Loess Plateau. Remote Sensing. 2021; 13(8):1556. https://doi.org/10.3390/rs13081556
Chicago/Turabian StylePu, Chuanhao, Qiang Xu, Kuanyao Zhao, Yanan Jiang, Lina Hao, Jialiang Liu, Wanlin Chen, and Pinglang Kou. 2021. "Characterizing the Topographic Changes and Land Subsidence Associated with the Mountain Excavation and City Construction on the Chinese Loess Plateau" Remote Sensing 13, no. 8: 1556. https://doi.org/10.3390/rs13081556
APA StylePu, C., Xu, Q., Zhao, K., Jiang, Y., Hao, L., Liu, J., Chen, W., & Kou, P. (2021). Characterizing the Topographic Changes and Land Subsidence Associated with the Mountain Excavation and City Construction on the Chinese Loess Plateau. Remote Sensing, 13(8), 1556. https://doi.org/10.3390/rs13081556