Article

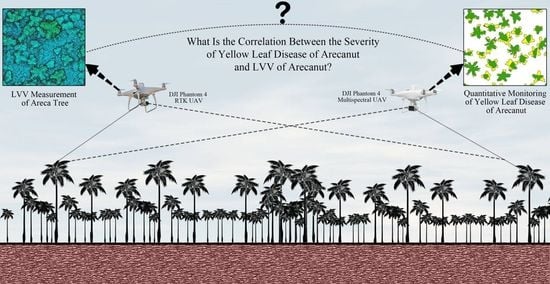
Remote Sensing Detecting of Yellow Leaf Disease of Arecanut Based on UAV Multisource Sensors

1
Key Laboratory of Genetics and Germplasm Innovation of Tropical Special Forest Trees and Ornamental Plants, Ministry of Education, College of Forestry, Hainan University, Haikou 570228, China
2
Sanya Nanfan Research Institute, Hainan University, Sanya 572022, China
3
Intelligent Forestry Key Laboratory of Haikou City, College of Forestry, Hainan University, Haikou 570228, China
*
Author to whom correspondence should be addressed.
Remote Sens. 2021, 13(22), 4562; https://doi.org/10.3390/rs13224562
Submission received: 20 October 2021 / Revised: 9 November 2021 / Accepted: 10 November 2021 / Published: 13 November 2021
(This article belongs to the Special Issue Remote Sensing and Smart Forestry)

Abstract

:
Unmanned aerial vehicle (UAV) remote sensing technology can be used for fast and efficient monitoring of plant diseases and pests, but these techniques are qualitative expressions of plant diseases. However, the yellow leaf disease of arecanut in Hainan Province is similar to a plague, with an incidence rate of up to 90% in severely affected areas, and a qualitative expression is not conducive to the assessment of its severity and yield. Additionally, there exists a clear correlation between the damage caused by plant diseases and pests and the change in the living vegetation volume (LVV). However, the correlation between the severity of the yellow leaf disease of arecanut and LVV must be demonstrated through research. Therefore, this study aims to apply the multispectral data obtained by the UAV along with the high-resolution UAV remote sensing images to obtain five vegetation indexes such as the normalized difference vegetation index (NDVI), optimized soil adjusted vegetation index (OSAVI), leaf chlorophyll index (LCI), green normalized difference vegetation index (GNDVI), and normalized difference red edge (NDRE) index, and establish five algorithm models such as the back-propagation neural network (BPNN), decision tree, naïve Bayes, support vector machine (SVM), and k-nearest-neighbor classification to determine the severity of the yellow leaf disease of arecanut, which is expressed by the proportion of the yellowing area of a single areca crown (in percentage). The traditional qualitative expression of this disease is transformed into the quantitative expression of the yellow leaf disease of arecanut per plant. The results demonstrate that the classification accuracy of the test set of the BPNN algorithm and SVM algorithm is the highest, at 86.57% and 86.30%, respectively. Additionally, the UAV structure from motion technology is used to measure the LVV of a single areca tree and establish a model of the correlation between the LVV and the severity of the yellow leaf disease of arecanut. The results show that the relative root mean square error is between 34.763% and 39.324%. This study presents the novel quantitative expression of the severity of the yellow leaf disease of arecanut, along with the correlation between the LVV of areca and the severity of the yellow leaf disease of arecanut. Significant development is expected in the degree of integration of multispectral software and hardware, observation accuracy, and ease of use of UAVs owing to the rapid progress of spectral sensing technology and the image processing and analysis algorithms.

Graphical Abstract

1. Introduction

Areca (Areca catechu L.) is a perennial evergreen tree of the palm family that has been planted in China for several years. The Hainan Province is the primary producer of areca in China, and accounts for 99% of the country’s total production. In addition to being a tropical landscaping tree species, areca is also an important southern medicine resource in China; it is listed as the first of the four southern medicines (Areca, Amomum villosum, Alpinia oxyphylla, Morinda officinalis) and has exceptionally high medicinal value. 2019 Hainan areca planting analysis report shows that the areca industry is the second pillar of the tropical crop industry in the Hainan Province after natural rubber and is the primary source of income for nearly 2.3 million farmers Hainan Province. It is crucial in implementing the rural revitalization strategy, strengthening and optimizing tropical characteristics, efficient agriculture, and the construction of the national ecological civilization pilot zone in Hainan. The yellow leaf disease of arecanut, which was first discovered in 1981 in the medicinal plant farm in Tunchang County, Hainan Province, is a devastating infectious disease that has severely damaged the production and cultivation of areca and has become the biggest limiting factor of production in the Hainan Province. The frequency of this disease is increasing every year and the incidence rate of the severely affected areca orchards is as high as 90%. The yield is reduced by 10–20% in mild cases and by 50–60% in severe cases, resulting in the destruction of seeds in the local area and the loss of harvest, severely hindering the development of the rural economy.
Unmanned aerial vehicle (UAV) remote sensing technology has been extensively developed in recent years as UAVs present several advantages in the field of agricultural pest monitoring owing to their compact size, high flexibility, low cost, simple operation, fast image acquisition speed, and the ability to carry multiple sensors [1]. Liu et al. [2] employed a UAV hyperspectral remote sensor to obtain the reflectance spectrum of the rice canopy and established a regression model to estimate the degree of blade crimp and monitor the damage caused by the leaf rollers to rice. The best R-value of the regression model was 0.81, and the root mean square error (RMSE) was 14.21%. Marston et al. [3] determined the correlation between the UAV multispectral reflectance and aphid population density, and monitored plant stress caused by soybean aphids using UAV multispectral images. Liu et al. [4] used the hyperspectral images obtained through a UAV to establish a damage diagnosis model to determine the damage caused by pine shoot beetles to Yunnan pine. The highest accuracy of the diagnosis model (R2) was 0.854, and the RMSE was 42.70%. Severtson et al. [5] used UAVs to obtain the rape crown surface reflectance data to determine the correlation between rapeseed potassium deficiency and the susceptibility of green peach aphids.
The UAV images were used to identify and classify the potassium-deficient rapeseed; the classification accuracy of the UAV images with a spatial resolution of 65 mm was between 72% and 100%, and the classification accuracy of the UAV images with a spatial resolution of 8 mm was between 69% and 94%. Zhang et al. [6] proposed a spectral-spatial classification framework based on UAV hyperspectral images, to provide support for pest loss assessment, which integrated the support vector machine (SVM) with an edge-preserving filter (EPF) to automatically extract the tree crown damaged by Dendrolimus tabulaeformis; the overall classification accuracy of this method is 93.17%. The above studies demonstrate that UAV remote sensing technology provides a fast and efficient means of monitoring crop diseases and pests; however, most of the approaches proposed by these studies are qualitative expressions of crop disasters. Additionally, the monitoring accuracy of the UAV technology for crop diseases and pests presented by the existing methods must also be improved.
The yellow leaf disease of arecanut in the Hainan Province is similar to a plague, with an incidence rate of up to 90% in severely affected areas. The qualitative expression of this disease is not conducive to the assessment of its severity and yield. Therefore, it is necessary to quantitatively analyze each areca tree and effectively improve the monitoring accuracy of the yellow leaf disease of arecanut. This process can help in increasing the assessment accuracy of the disease severity and yield of areca, and can also play an important role in the future control of the yellow leaf disease of arecanut.
Furthermore, a correlation has been observed between the damage to the crop caused by disease and pests, and the change in the living vegetation volume (LVV). However, the correlation between the severity of the yellow leaf disease of arecanut and the LVV has not yet been proven by research. Fei et al. [7] used 92,978 plots of data to quantify the mortality of the host trees and estimate the LVV loss of the forest caused by the invasion of non-native pest species. Tipping et al. [8] observed that the damage caused by Lophodiplosis trifida Gagné (Diptera: cecidomyidae) reduced the height of Melaleuca seedlings by 10.1%, the LVV of leaves by 42%, the LVV of wood by 42.7%, and the LVV of roots by 30.3%. Petro et al. [9] analyzed the effects of Tanzanian Leptocybe invasa infection on the growth and LVV of Eucalyptus grandis and eucalyptus. They discovered that the degree of the LVV loss in infected seedlings on the stems and leaves was significantly higher than that on the seedling roots, and the impact on the LVV of Eucalyptus grandis was higher than that of eucalyptus. UAV remote sensing technology is a widely used method to monitor the LVV of plants. Kachamba et al. [10] used the measured data of 107 forest reserve sample plots to evaluate the application ability of the LVV data obtained from UAV images in the LVV estimation, and reported that the UAV remote sensing technology presents great potential in terms of cost reduction and LVV estimation. Batistoti et al. [11] applied the UAV photogrammetry technology to estimate the height of a tree canopy and proposed a LVV green estimation formula for the Brazilian savanna (Cerrado) grass-based on the UAV canopy height. Niu et al. [12] verified the application potential of consumer-grade UAV RGB images in estimating the LVV of corn by obtaining the vegetation index and plant height from the UAV RGB images. Therefore, UAV remote sensing technology can be employed to accurately estimate the LVV of areca and establish a relationship model between the severity of the yellow leaf disease of arecanut and the LVV. Thus, the correlation between the severity of the yellow leaf disease of arecanut and the LVV can be obtained for the first time.
This study aims to apply the multispectral data obtained by using a UAV along with high-resolution UAV remote sensing images to monitor the severity of the yellow leaf disease of arecanut through five machine learning algorithms (Figure 1). The traditional qualitative expression of the yellow leaf disease of arecanut is thus transformed into a quantitative expression of the disease in each areca tree. A suitable algorithm is established to improve the quantitative expression accuracy of the yellow leaf disease of arecanut in each tree through a comparative analysis of five machine learning algorithms. Lastly, the LVV of a single areca tree is measured using the UAV structure from motion (SfM) technology. A model is established to determine the correlation between the severity of the yellow leaf disease of arecanut and the LVV.

2. Materials and Methods

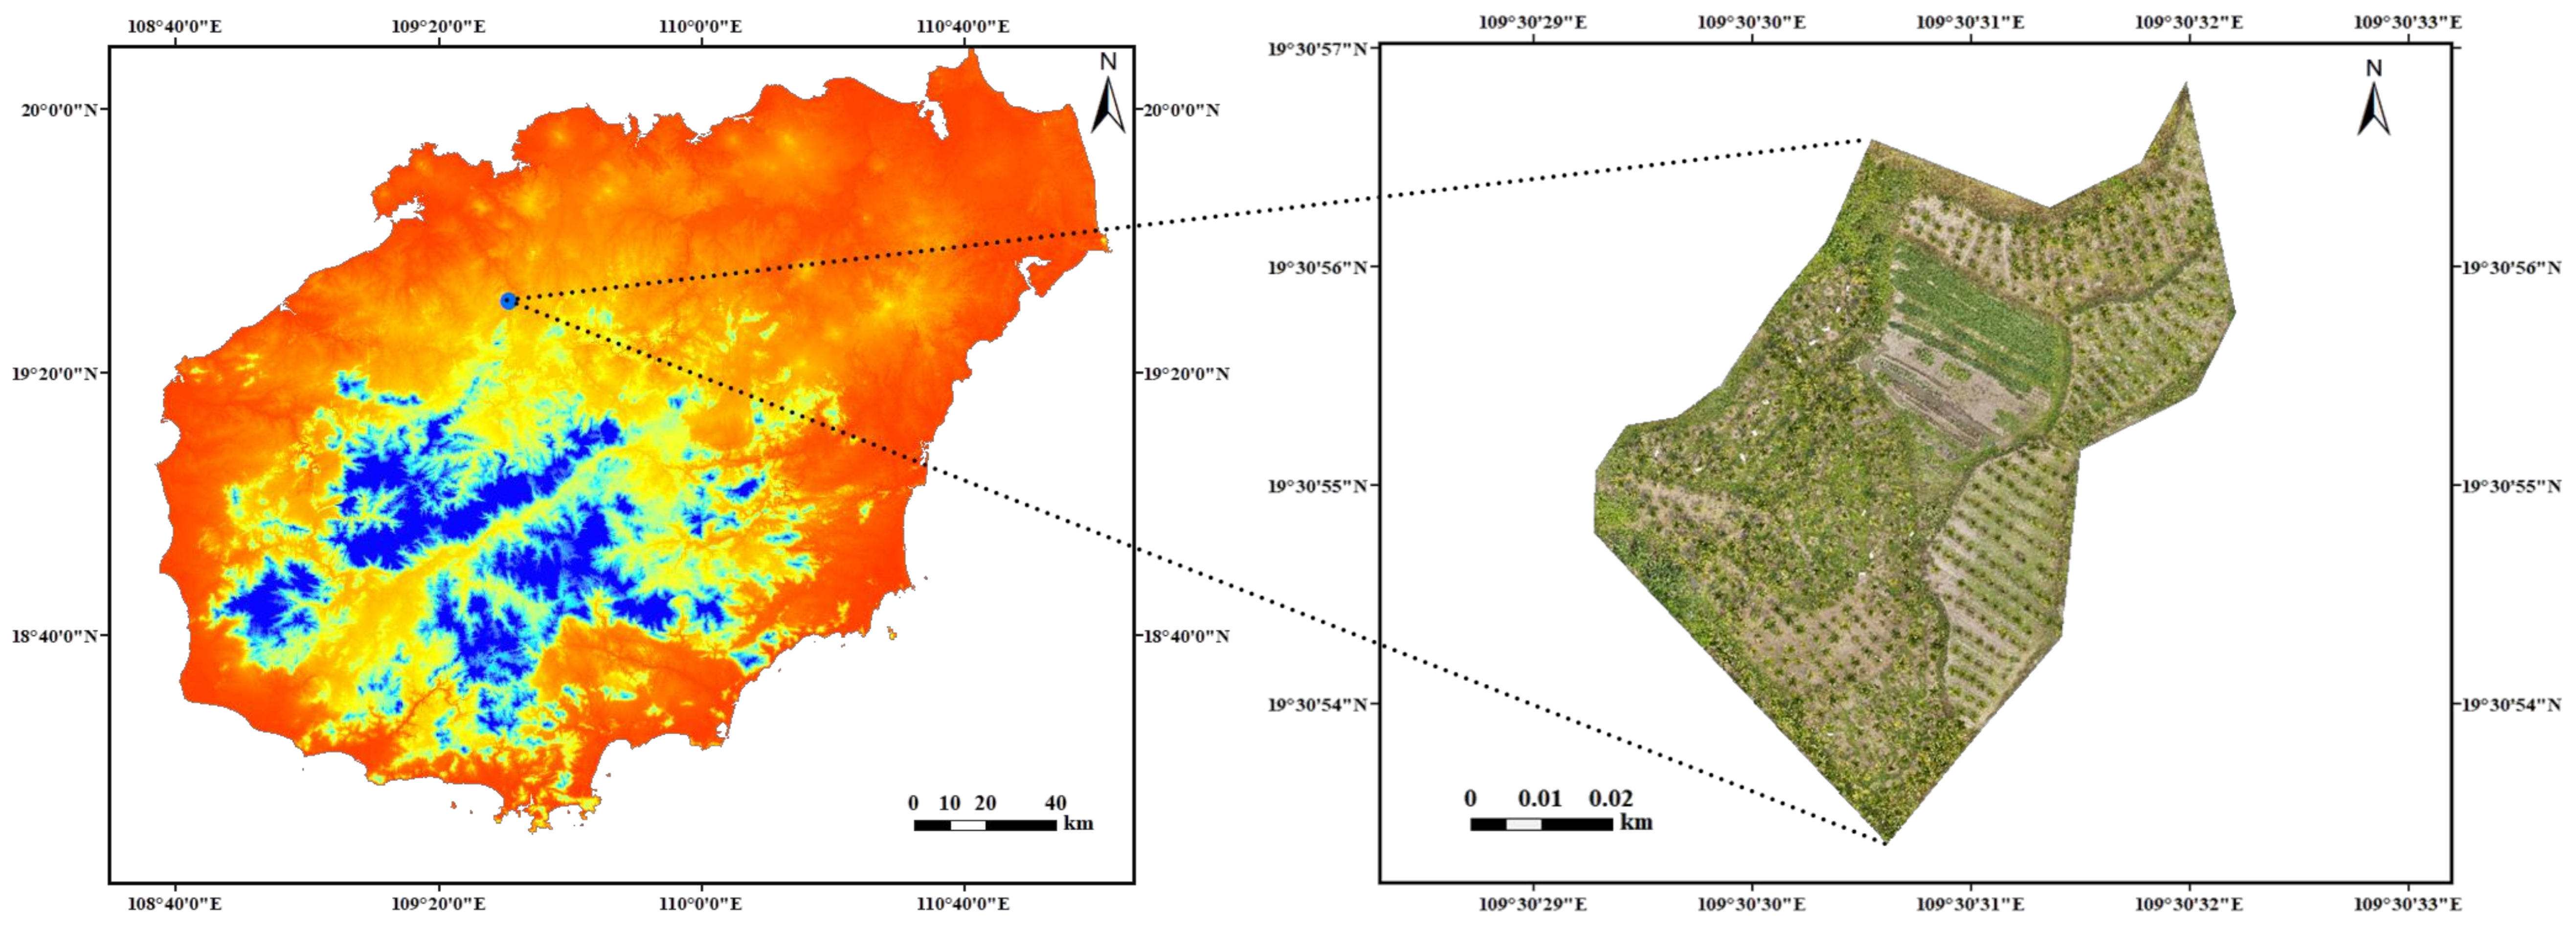
2.1. Overview of the Research Area

The target research area is located in the areca forest (19°30′54.03″N, 109°30′31.81″E) in the Dading village, Nada Town, Danzhou City, Hainan Province (Figure 2); it has an area of 0.35 hm2. The Hainan Province (left of Figure 2) is located at the southernmost end of China and the northern edge of the tropic regions and has a tropical monsoon climate with abundant rainfall and annual precipitation between 1000 and 2600 mm, with both heavy and light rainy seasons. The research area (right of Figure 2) has an average altitude of approximately 130 m, with sufficient sunshine and abundant rainfall; there is no intense heat in summer and no severe cold in winter. The annual average temperature is 23.1 °C and the annual average rainfall is approximately 1823 mm. The area has a tropical monsoon climate and is one of the least affected areas in the Hainan Province.

2.2. Data Sources

The UAV multispectral data was acquired on 20 March 2021. The flight platform is the DJI Phantom 4 multispectral quadrotor UAV (Shenzhen DJI Innovation Technology Co., Ltd., Shenzhen, China), which adopts the TimeSync time synchronization system. This system can synchronize the flight control, camera, and an RTK clock system at the microsecond level to achieve a camera imaging time with a millisecond error and real-time compensation for the position of the center point of each camera lens and the center point of the antenna combined with the device attitude information, to ensure that the image can obtain more accurate position information. The UAV is equipped with six 1/2.9-inch CMOS sensors, including one color sensor for visible light imaging and five monochrome sensors for multispectral imaging, with an effective pixel size of 2.08 million for each sensor. The integrated multispectral imaging system can simultaneously obtain the data of five bands, including the red-light band (central wavelength 650 nm), green light band (central wavelength 560 nm), the blue light band (central wavelength 450 nm), the near-infrared band (central wavelength 840 nm), and red-edge band (central wavelength 730 nm). During the flight, the weather was sunny, the lighting conditions were good, and the ground wind speed was less than grade 4, meeting the requirements of aerial photography. The designed flight height was 10 m and the flight area was 0.89 hm2; the number of main flight lines was 33, the angle of the main route was 54°, the total length of the route was 2.79 km, the heading overlap rate was 70%, the side overlap rate was 60%, and the pan-tilt angle was −90°. The shooting mode captured photographs at equal time intervals along the route; the shooting interval was 2.0 s, the flight speed was 1 m/s, the flight time was 55 min, and a total of 1399 original aerial photos were obtained.
The UAV remote sensing image data was acquired on 23 March 2021. The flight platform was a DJI Phantom 4 RTK four-rotor UAV (Shenzhen DJI Innovation Technology Co., Ltd., Shenzhen, China). The aircraft has a built-in RTK module with strong anti-magnetic interference ability and accurate positioning ability and adopts the 3D five-way flight photogrammetry; it can provide real-time centimeter-level positioning data, and can significantly improve the absolute accuracy of the image metadata. The UAV is equipped with a 1-inch 20 megapixel CMOS sensor. The mechanical shutter supports high-speed flight shooting, which can eliminate the rolling shutter effect and can effectively improve the mapping accuracy. During the flight, the weather was sunny, the lighting conditions were good, and the ground wind speed was less than grade 4, meeting the requirements of aerial photography. The designed flight height was 40 m and the flight area was 1.06 hm2. The route comprises one orthophoto route and four inclined routes. The orthophoto course overlap rate was 80%, the orthophoto side overlap rate was 70%, the oblique course overlap rate was 80%, the oblique side overlap rate was 70%, and the oblique PTZ angle was −60°. The shooting mode was set to timing shooting, the flight speed was 3 m/s, the flight time was 55 min, and a total of 1237 high-resolution UAV images were obtained.
The acquired UAV images were processed by DJI Terra (Shenzhen DJI Innovation Technology Co., Ltd., Shenzhen, China) software. DJI Terra is an application software that provides independent route planning, flight aerial photography, two-dimensional multispectral reconstruction, two-dimensional orthophoto imaging, and 3D model reconstruction. The image data obtained by the DJI spirit phantom 4 RTK four-rotor UAV can be visualized to generate a high-precision and high-quality 3D point cloud model based on the real-time reconstruction algorithm of the DJI. The built-in 3D measurement function of the software can realize the volume measurement of a 3D point cloud, and can provide accurate measurement and data support for further analysis and decision-making.

2.3. Data Preprocessing

The two-dimensional multispectral reconstruction of aerial photographs is required to obtain the areca vegetation index. This process was carried out in the DJI Terra software, which can calculate each individual vegetation index (NDVI, OSAVI, LCI, GNDVI, and NDRE) and generate a multispectral vegetation index. The calculation formula for each vegetation index is presented in Table 1.
The SfM 3D point cloud reconstruction and measurement process was carried out on the original UAV image using the DJI Terra software to obtain the LVV data of areca in the research area. The steps of the SfM algorithm are as follows: (1) homonymous feature extraction and matching of dense images; (2) using the feature points of the same name for image relative orientation and calculating the external orientation elements; (3) generation of sparse point cloud by aerotriangulation and iterative bundle adjustment; (4) a dense point cloud is obtained based on sparse point cloud encryption [14]. The digital orthophoto map (DOM), digital surface model (DSM), and areca 3D point cloud models in the research area were obtained following SfM 3D point cloud reconstruction. The 3D point cloud data are registered with the DOM in the research area based on the WGS1984 coordinates, and the 3D point cloud volume of each areca was measured to obtain the LVV data of the areca in the research area.
Lastly, a single areca crown of the areca forest is extracted through the Color Slices tool using the ENVI 5.3 (ITT Visual Information Solutions, Circle Boulder, CO, USA) software. The extracted crown images of 603 areca trees are imported into the ArcGIS 10.5 (Environmental Systems Research Institute, Redlands, CA, USA) software and 57 areca plants are randomly selected, along with 200 sample points on the crown surface of each areca plant, as the sample data. Data records are created by analyzing the research area and observing the crown yellowing phenomenon of the 57 areca plants, using expert analysis and the ArcGIS 10.5 software to determine whether 11,400 sample points fall within the yellow leaf disease of arecanut category so as to provide basic data for the machine learning algorithm modeling.

2.4. Machine Learning Methods

The back-propagation neural network (BPNN), decision tree (DT), naïve Bayes, support vector machine (SVM), k-nearest-neighbor (k-NN) classification are selected based on the MATLAB (MathWorks, Natick, MA, USA) software platform to establish the prediction models for the yellow leaf disease of arecanut. The internal and external prediction accuracy of each method are compared and analyzed, and the optimal machine learning algorithm is selected.

2.4.1. BPNN Algorithm Model

The BPNN is one of the most widely used neural networks [15]; it is a multilayer feedforward neural network that is trained based on the error backpropagation algorithm (Figure 3). The training of the BPNN is divided into three parts: feedforward input training mode, error calculation, and backpropagation, and weight update [16]. It is based on the gradient descent method, which minimizes the error mean square error between the actual and expected output value. The specific implementation process of the BPNN on the MATLAB software is as follows: (1) Input data is divided into training set and test set; (2) The mapminmax function is used to normalize the data; (3) The newff (inputn, outputn, hiddennum) function is used to construct the network; (4) The network parameters are set and the train (net, inputn, outputn) function is used for network training; (5) The trained model is used for network simulation, the error between the predicted value and the true value is calculated, and the recognition accuracy is obtained. In this study, while using the BPNN algorithm to establish the prediction model of the yellow leaf disease of arecanut, the number of training times was set to 1000, the learning rate was 0.01, and the minimum error of the training target was 10−6. In addition, the cross-validation method is used to divide the dataset into five folds, and the accuracy of each fold is estimated to prevent overfitting.

2.4.2. DT Algorithm Model

The decision tree algorithm model is a classification or regression model established in the form of a tree structure [17]. Each internal node of the tree structure represents a different selected feature. The first node is called the root node, and the nodes that represent other characteristics before reaching the final node of the structure are called the leaf nodes. The leaf node represents the target class or classification label, which is the final decision or prediction made after following the path from the root to the leaf (classification rule) [17,18]. The main advantages of DT are as follows: (1) missing data can be accommodated; (2) the data do not need to conform to a normal distribution; (3) outliers have almost no effect on the final classification; (4) categorical data and numerical data can be used as predictors; (5) Transforming predictors have no effect on the tree structure [19]. In this study, when using the DT algorithm to establish the prediction model of yellow leaf disease of arecanut, the Gini diversity index was selected as the splitting criterion, the maximum splitting number was set to 100, and the system default values were used for other parameters. In addition, the cross-validation method is used to divide the dataset into five folds, and the accuracy of each fold is estimated to prevent overfitting.

2.4.3. Naïve Bayes Algorithm Model

The naïve Bayes algorithm model is a probabilistic graphical model in the category of supervised learning proposed based on Bayes’ theorem and assume that the characteristic conditions are independent of each other, is often used to solve classification or regression problems [17]. Naïve Bayes classification is based on the premise that the feature words are directly independent of each other, learning the joint distribution probability from input to output in the known training set; based on the learned model, X is input and the output, Y with the highest probability, is obtained after verification. The commonly used naïve Bayes classification models include the Gaussian naïve Bayes model, polynomial naïve Bayes model, and Bernoulli naïve Bayes model. The Gaussian naïve Bayes model was used in this study to establish the prediction model for the yellow leaf disease of arecanut by using the naïve Bayes algorithm, and the system default values were used for the parameters. Additionally, the cross-validation method is used to divide the dataset into five folds, and the accuracy of each fold is estimated to prevent overfitting.

2.4.4. SVM Algorithm Model

The SVM algorithm model is a two-class model based on traditional theoretical statistical methods. It is based on a linear classifier with the largest interval defined in the feature space, which classifies the data instances by constructing a linear separation hyperplane (Figure 4) [20]. In this study, a linear SVM classifier was implemented when using the SVM algorithm to establish a prediction model of the yellow leaf disease of arecanut. It presents a lower computational complexity and requires less time to train the SVM. This study uses the SVM algorithm to establish a prediction model of the yellow leaf disease of arecanut to obtain better accuracy. The linear function was selected as the kernel function, the kernel scale was set to automatic, the frame scale level was set to 1, and the system default values were used for other parameters. Additionally, the cross-validation method is used to divide the dataset into five folds, and the accuracy of each fold is estimated to prevent overfitting.

2.4.5. k-NN Classification Algorithm Model

The k-NN classification algorithm is one of the most widely used algorithms in pattern recognition and data mining. It is based on analogical learning, which is learning achieved by comparing a specific test set with a set of similar training sets, and determining the category of the sample to be classified based on the category of the nearest sample or several samples; the nearest neighbor refers to a single or multidimensional feature vector used to describe the nearest neighbor samples [21]. In a sample space, if most of the k-NN samples belong to one category, then the target sample also belongs to the same category [22]. In this study, the number of neighbors was set to 1, the distance metric was Euclidean, the distance weight was equal distance, and the system default values were used for other parameters. Additionally, the cross-validation method is used to divide the dataset into five folds, and the accuracy of each fold is estimated to prevent overfitting.

2.5. Establish the Correlation Model between the LVV of Areca and the Severity of the Yellow Leaf Disease of Arecanut

The areca plants in the research area were divided into three areas based on different planting times (Figure 5) to model the LVV and the severity of the yellow leaf disease of arecanut, respectively. In each area, 4/5 areca data are randomly selected, and IBM SPSS Statistics 26 (IBM International Business Machines Corporation) is implemented to use the severity of the yellow leaf disease of arecanut as the model-independent variable, and the LVV of areca as the model-dependent variable for nonlinear fitting. The equation is presented in (Model 1), where W represents the LVV of a single areca tree (m3), Y represents the severity of the yellow leaf disease of a single areca tree, and a and b are the model parameters.
W = a × Y b

3. Results

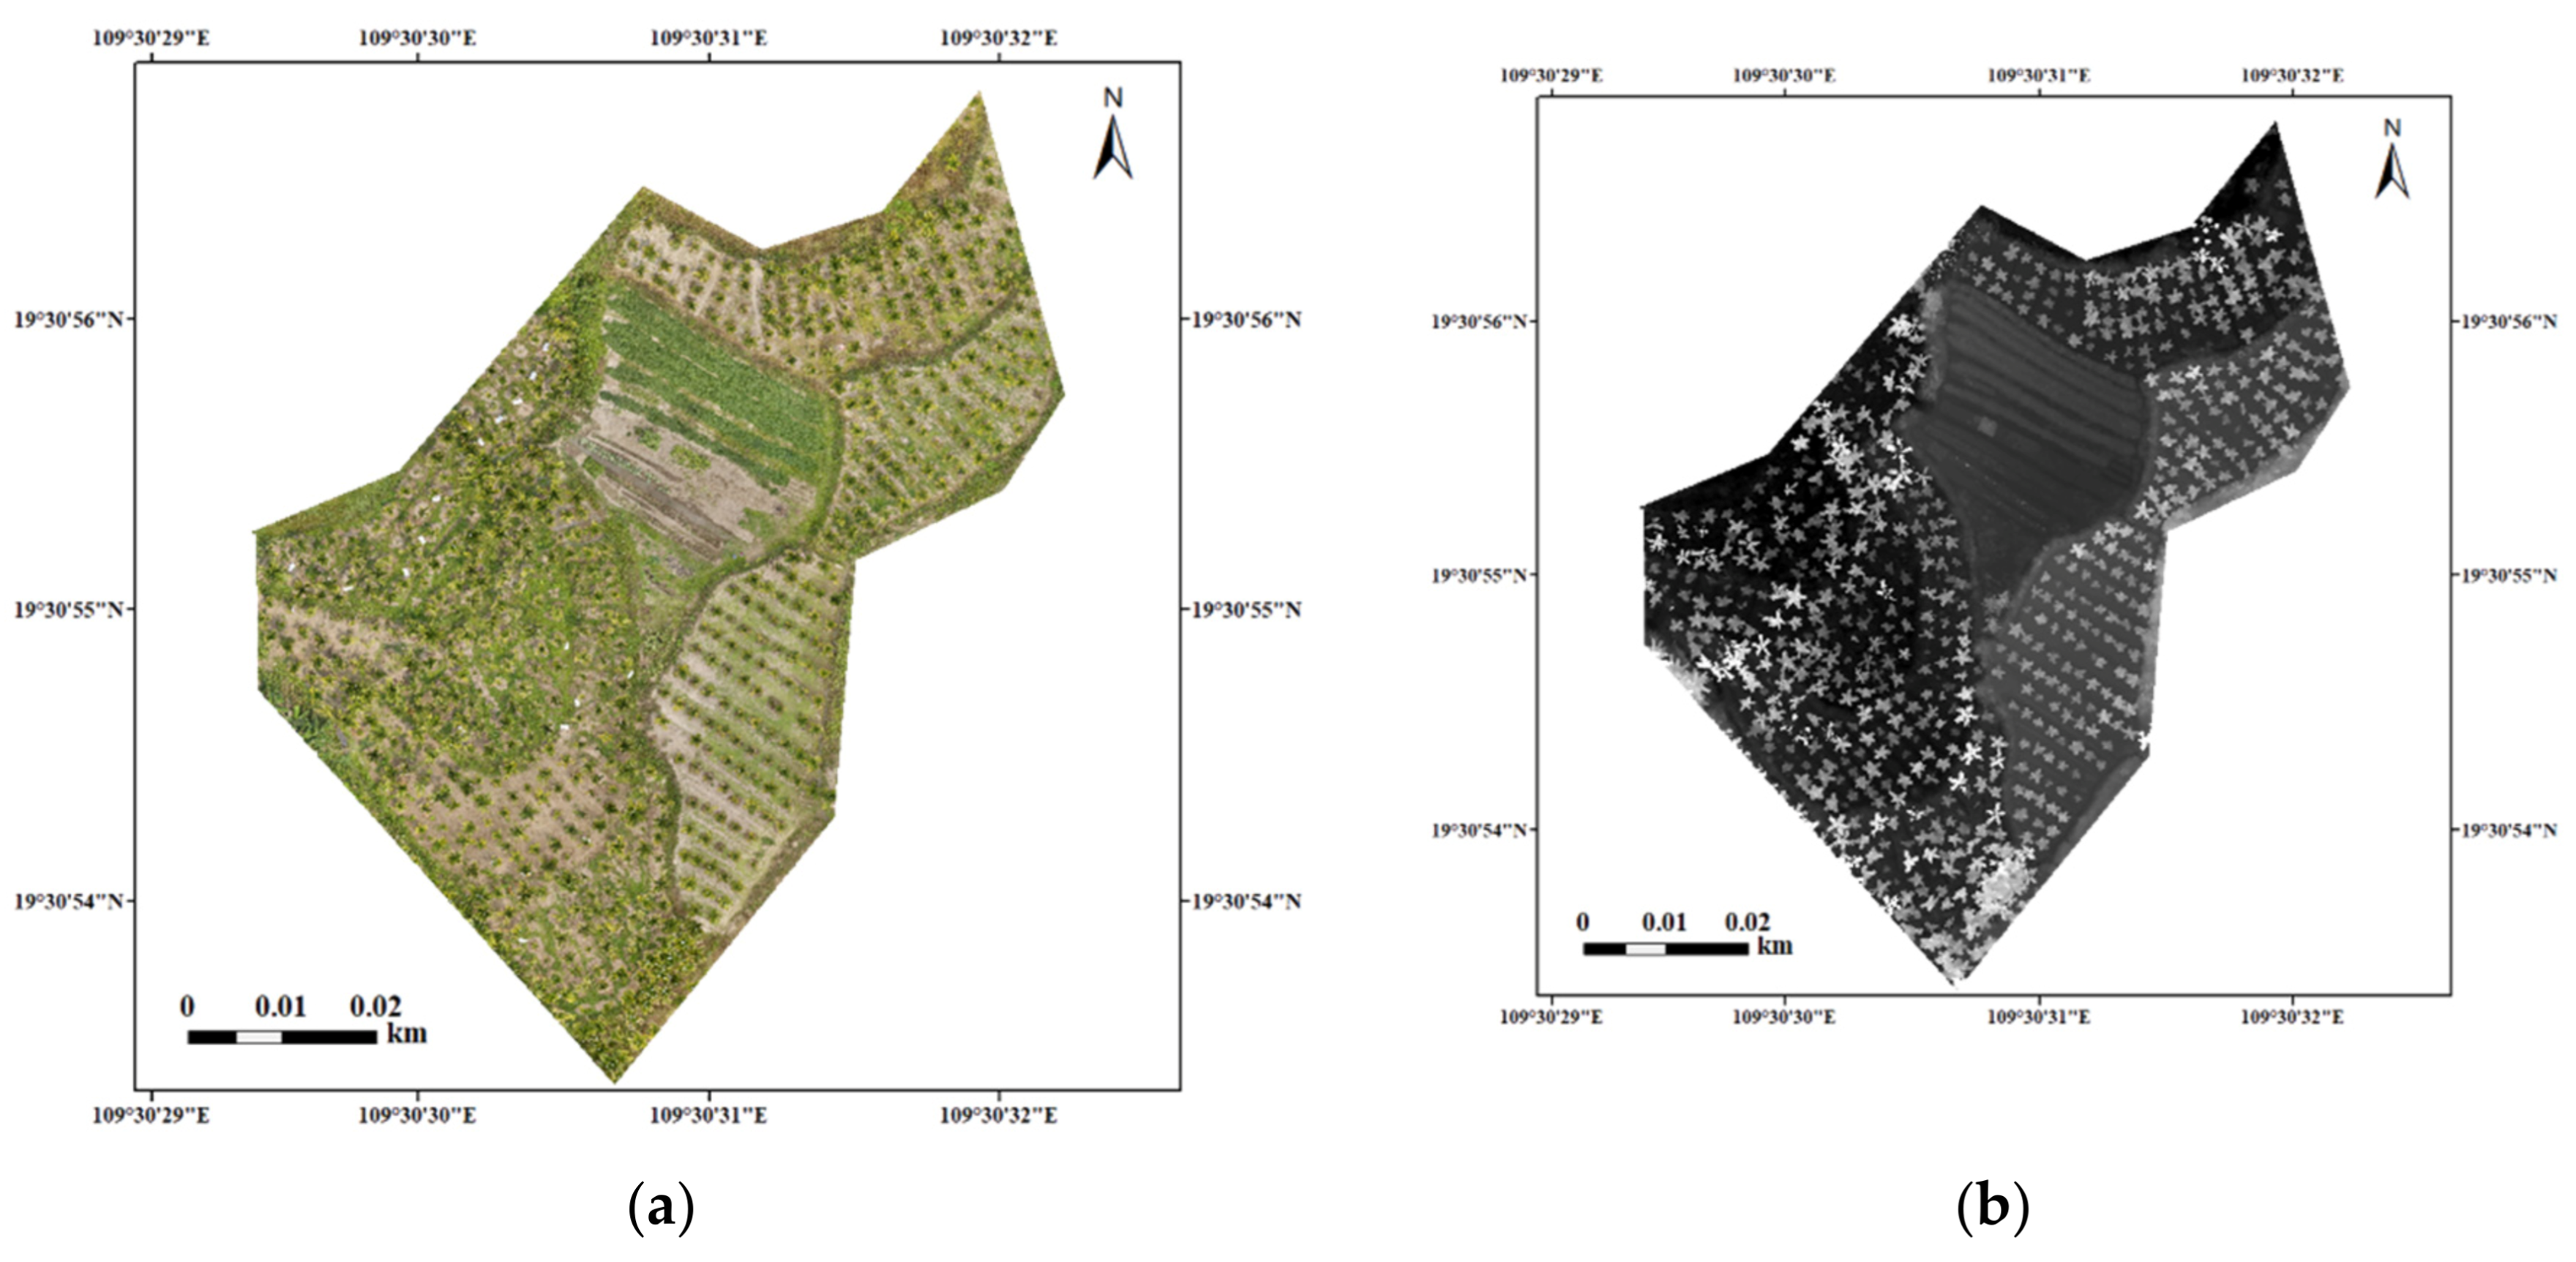
3.1. Two-Dimensional Multispectral Vegetation Index Reconstruction and SfM LVV Point Cloud Reconstruction Results

The DJI Terra software is used to import 1399 original aerial photographs, perform two–dimensional multispectral reconstruction of the original aerial photographs, calculate the five vegetation indexes (NDVI, OSAVI, LCI, GNDVI, NDRE), and generate the areca forest vegetation index (Figure 6). The optimized camera radial distortion parameters are −0.41188091, 0.32349655, and −0.27189150, and the optimized camera tangential distortion parameters are 0.00004505 and 0.00044043. The RMSE between the calculated image position and the position recorded in the image is 0.619 m. Based on the calculation, the NDVI value of areca forest in the study area was determined to be −0.364–0.983, the OSAVI value was −0.107–0.590, the LCI value was −0.988–0.800, the GNDVI value was −0.320–0.967, and the NDRE value was −0.412–0.751. If the index is close to 1, it indicates that the chlorophyll content is high, and the growth of areca is good. If the index is close to 0, it indicates that there is almost no chlorophyll in the areca leaves, and the growth of areca is not good. Based on the visual effect, LCI, GNDVI, and NDRE indexes have a good effect on yellow leaf disease of arecanut, whereas NDVI and OSAVI indexes have an average effect. Furthermore, the overall visual evaluation of the areca forest yellow leaf disease based on the five vegetation indexes demonstrated that the disease was more serious in the southeastern part of the research area.
The DJI Terra software is used to import 1237 high-resolution UAV images, perform orthorectification and image mosaic on the UAV images, and obtain DOM and DSM in the research area with a spatial resolution of 0.01 m (Figure 7). The optimized camera radial distortion parameters are −0.28180304, 0.12019049, and −0.03154244, and the optimized camera tangential distortion parameters are 0.00001891 and −0.00006844. The RMSE between the calculated image position and the position recorded in the image was 0.031 m. The 3D point cloud model of the areca plants in the research area with high point cloud density was obtained by SfM 3D point cloud reconstruction of the UAV images (Figure 8). The 3D point cloud volume of each areca tree in the research area was measured to obtain the LVV data of each areca in the study area and draw its distribution diagram (Figure 9). The LVV of areca in the study area lies between 0.12–16.88 m3, as shown in the figure. The growth of areca in the southwestern region of the research area was better, and the LVV was the highest, with the majority being above 8.38 m3. The growth of areca in the southeastern region of the research area is poor, and the LVV is the lowest, with the majority being below 8.38 m3.

3.2. The Prediction Results of Different Machine Learning Algorithms for the Yellow Leaf Disease of Arecanut

Five machine learning algorithms, including the BPNN, DT, naïve Bayes, SVM, and k-NN classification are used to establish the prediction model of the yellow leaf disease of arecanut for 603 areca plants, based on the MATLAB software platform. A total of 11,400 samples randomly selected by ArcGIS from 57 areca plants were used as the sample set, of which 4/5 were used as the training set (9200) and 1/5 were used as the test set (2200). The specific sample numbers of each category were as follows: 3555 training samples and 841 test samples in the yellowing area, and 5645 training samples and 1359 test samples in the normal area. Table 2 presents the classification accuracy of each model. The results demonstrate that the classification accuracy of the training set of the BPNN algorithm was the highest, at 92.00%. The classification accuracies of the training set of the DT, naïve Bayes, SVM, and k-NN classification algorithms were relatively low, at 87.10%, 86.30%, 87.80%, and 83.80%, respectively. The five algorithms were tested using the test set data. The results indicate that the classification accuracy of the BPNN algorithm and the SVM algorithm test set was the highest, at 86.57% and 86.30%, respectively, which were slightly higher than those of the other three machine learning algorithms. The classification accuracies of the test set of the DT, naïve Bayes, and k-NN classification algorithms were 84.73%, 83.63%, and 81.20%, respectively.
It is observed that the classification effect of the BPNN algorithm is better than that of the other four algorithms based on the comparison of the classification accuracies of the BPNN, DT, naïve Bayes, SVM, and k-NN classification algorithms. This is primarily attributed to the fact that the BPNN has good nonlinear mapping ability and generalization ability; it also presents good classification ability in classifying the yellow leaf disease of arecanut, and can accurately classify the samples in the yellowing area. However, the DT algorithm tends to have more numerical features in the classification results for data with inconsistent sample sizes in each category. The naïve Bayes algorithm must be converted for nonlinear features; it is prone to under-fitting, resulting in reduced accuracy. The SVM algorithm is very sensitive to the choice of parameters and kernel functions. The k-NN classification algorithm has a high degree of data correlation. It is difficult to ensure accuracy in the case of errors in the k-NN classification algorithm data. These errors led to the reduction of the accuracy of classification of the four algorithms when classifying the samples on each areca tree, and the overall classification effect was affected.
The spatial distribution of the severity of the yellow leaf disease of arecanut is plotted in Figure 10 using the five types of yellow leaf disease of arecanut prediction models (BPNN, DT, naïve Bayes, SVM, and k-NN classification algorithms) established previously. The results demonstrate that the spatial distribution pattern of the yellow leaf disease of arecanut obtained by the severity of yellow leaf disease of arecanut prediction model based on the five machine learning algorithms is essentially identical. The severity of the yellow leaf disease of arecanut greater than 50% was relatively higher in the central part of the southeastern and southern regions of the areca forest in the northeast and had a concentrated distribution. In the western part of the research area, the severity of the yellow leaf disease of arecanut (>50%) was relatively lower and was evenly distributed. However, the spatial distribution maps generated by the five algorithms indicated a variation in the local areas.
The severity of the yellow leaf disease of arecanut greater than 50% in the western region of the areca forest, in the spatial distribution map predicted by the BPNN, DT, and SVM algorithms is essentially identical, as shown in Figure 10, and the severity greater than 50% in the spatial distribution map predicted by the naïve Bayes algorithm is higher. The spatial distribution map predicted by the k-NN classification algorithm demonstrates that the severity of the yellow leaf disease of arecanut is less than 50%. The severity of the yellow leaf disease of arecanut greater than 50% in the southeastern region of the areca forest in the spatial distribution map predicted by the BPNN, DT, SVM, and k-NN classification algorithms is essentially identical, and the severity of greater than 50% in the spatial distribution map predicted by the naïve Bayes algorithm is higher. The severity of the yellow leaf disease of arecanut greater than 50% in the northeastern region of the areca forest in the spatial distribution map predicted by the BPNN, SVM, and k-NN classification algorithms is essentially, and the severity of the yellow leaf disease of arecanut greater than 50% in the spatial distribution map predicted by the DT algorithm and naïve Bayes algorithm is higher.

3.3. Fitting Results of Areca LVV and the Severity of the Yellow Leaf Disease of Areca Model

The fitting parameters for each region are listed in Table 3. The model fitting formulas of the three regions are WA = 0.804 × Y−1.091; WB = 0.798 × Y−0.933; WC = 0.424 × Y−0.914, and the fitting correlation coefficients, R, of each model are 0.614, 0.516, and 0.609, respectively. A comparative analysis was performed between the actual LVV and the estimated LVV of the remaining 1/5 of areca in each area of the study area to verify the accuracy of the model, and the accuracy of the three models was evaluated, as shown in Figure 11. The model fitting bias of region A was 0.306 m3, the relative Bias was 13.452%, the RMSE was 0.895 m3, and the relative root mean square error (RRMSE) was 39.324%. The model fitting bias of region B was 0.016 m3, the relative Bias was 1.529%, the RMSE was 0.371 m3, and the RRMSE was 35.155%. The model fitting bias of region C was −0.256 m3, the relative Bias was −10.776%, the RMSE was 0.827 m3, and the RRMSE was 34.763%. The model fitting effect of each region was good, and the prediction accuracy of the model was high. Thus, it is demonstrated that the severity of the yellow leaf disease of arecanut is strongly correlated with its LVV under the condition of the same age.

4. Discussion

4.1. Analysis of the Relationship between LVV of Areca and the Severity of the Yellow Leaf Disease of Arecanut

The yellow leaf disease of arecanut is an infectious and destructive disease that adversely affects areca production; it is the most severe, widespread, harmful, and dangerous disease and is extremely difficult to control. The damage and the resultant yellowing caused to the areca are typically attributed to combination of diseases and pests [23]. The infection of the areca plants caused by pathogens results in yellowing, whereas insects gnaw on the leaves or the branches of the plants, and can also carry various pathogens [24,25], thus increasing the severity of the yellow leaf disease of arecanut. Additionally, most instances of the yellow leaf disease of arecanut are related to improper crop cultivation and management. For example, excessive use of herbicides and fertilizers [26] can damage the soil components and the areca roots, resulting in an increase in the incidence rate of the areca. The inefficient control of water required for the areca crop, drought damage caused by long-term non-irrigation, or waterlogging caused by excessive irrigation [27,28] can also cause the yellow leaf disease of arecanut. The yellow leaf disease of arecanut is primarily caused by the reduction of the LVV of areca, owing to the following reasons: (1) The pathogens which are attributed to the yellow leaf disease of arecanut cause the loss of chlorophyll in the areca leaves [29], causing them to become smaller, yellow, wither, and even fall off. If the infection is serious and if not treated in time, it will damage the whole plant. The death of the areca plant reduces its LVV. (2) The pest infestation that causes the yellowing of the areca promotes the growth of other pests, which increases their population and results in simultaneous attacks by various pests and their pathogens [24,30], further reducing the LVV of areca. (3) The stand structure of the areca forest is simple; it has a single species, and the resistance to pests and natural disasters is low [31,32]. Once yellowing occurs in a single plant, the entire areca forest will be affected, and becomes susceptible to more pests and diseases, thus reducing the areca productivity [33], and resulting in severe loss of the LVV of areca.

4.2. Application Potential of Machine Learning Algorithm in Yellow Leaf Disease of Arecanut Monitoring

Machine learning algorithms have been widely applied in plant pest monitoring owing to the development of artificial intelligence technology. The machine learning algorithm used in this study is effective in the quantitative expression of the severity of the yellow leaf disease of arecanut, which comprises the following three aspects.
  • Precision aspect. The DT, naïve Bayes, random forest (RF), AdaBoost, and SVM algorithms combined with statistical methods (logistic regression) (classifier) can predict the degree of damage caused by pests, but their accuracy is low [34]. The logical model tree, RF, SVM, simple logistic regression, multilayer perceptron, and AdaBoost algorithms can classify the species and gender of the pests, but the performance of the RF and SVM algorithms is low [35]. Furthermore, the machine learning model combined with the temperature and humidity conditions can predict the probability of pest occurrence, but the prediction accuracy is only 76.5% [36]. The prediction accuracy of plant diseases combined with machine learning algorithms and visible light data is also low. Therefore, this study uses UAV multispectral data to obtain the NDVI, OSAVI, LCI, GNDVI, and NDRE and five other cropping indexes, and introduces five algorithm models, i.e., BPNN, DT, naïve Bayes, SVM, and k-NN classification, to compare and analyze the severity of the yellow leaf disease of arecanut. The resultant classification accuracy can exceed 85%.
  • Refinement aspect. The network-based visual plant disease recognizer can identify plant diseases such as dysplasia, wilt, and necrosis, by uploading images and defining recognition rules [37]. The automatic identification of plant diseases can be realized through the pretreatment of plant diseases, segmentation of diseased leaf area, feature calculation based on gray level co-occurrence matrix, feature selection, and classification [38]. The combination of UAV remote sensing technology and machine learning technology can divide the crop health assessment area into bare land with a large number of damaged plants, transition areas with reduced plant density, and healthy canopy areas [39]. The severity assessment of the plant diseases and pests is primarily qualitative, and the degree of refinement is low. Therefore, this study compares and analyzes the prediction accuracy of five machine learning algorithms and selects the most appropriate machine learning algorithm, i.e., the BPNN algorithm. The severity of the yellow leaf disease of arecanut is combined with the areca vegetation index, and is expressed as the percentage of the yellowing area (in percentage) of the areca crown of a single areca plant, so that the severity of the yellow leaf disease of arecanut lies within a quantitative expression of 0–100%. Subsequently, the algorithm performs fine monitoring and evaluation of the severity of the yellow leaf disease of arecanut.
  • Intellectualization aspect. RGB images acquired by UAVs with optical sensors are used to detect the plants damaged by diseases and pests and provide data for forest management [40]. The model based on the RGB images is applied for the recognition of plant leaves to analyze the possibility of pest attack and automatically detects the stage of the pest attack [41]. In this study, multispectral UAV was used to monitor the severity of the yellow leaf disease of arecanut. The multispectral data can provide more accurate directional information of the areca growth status when compared to the visible light data. Additionally, the vegetation index can be calculated by accurately collected multispectral data and the areca growth status can be expressed more accurately and intelligently.

4.3. Limitations in Monitoring the Severity of the Yellow Leaf Disease of Arecanut

Although this study is effective for the quantitative expression of the severity of the yellow leaf disease of arecanut, there are still some limitations in the monitoring process of the severity of the yellow leaf disease of arecanut, which must be further analyzed and improved.
  • The process of the extraction of a single areca crown from the areca forest by the gray segmentation method using the ENVI 5.3 software faces problems such as incomplete crown extraction, or it is difficult to distinguish an areca plant with a small crown from grass. Zhang et al. [6] proposed a spectral-spatial classification framework based on UAV hyperspectral images, which combines an SVM with an edge preserving filter to automatically extract tree crowns damaged by pine caterpillars. Wu et al. [42] used high-resolution lidar data to detect, extract, and characterize a single tree crown with multiple geometric and topological characteristics. This method has been applied in the Medicine Bow National Forest Park in the southwestern region of Laramie, Wyoming, and in the HJ Andrews Experimental Forest in the Cascade Mountains, Oregon. The results indicated that the overall accuracy of crown extraction in the two research areas reached 94.21% and 75.07%, respectively. The aforementioned studies indicate that in the future, the crown width of a single areca plant can be extracted by using a UAV to obtain the plant hyperspectral images or the LVV structure data of areca can be obtained by using high-resolution lidar, to improve the extraction accuracy of the crown width of a single areca plant.
  • Errors can be easily introduced in the LVV measurement data of areca while using the DJI Terra software for each plant due to the overlap of some areca crowns or due to the loss of some areca 3D point clouds. Laser radar technology presents a new method of measuring the LVV of plants. Johnson [43] combined the laser radar predicted LVV data with traditional forest inventory data to estimate the overall LVV of forests. Li et al. [44] used airborne laser radar technology to simulate the aboveground LVV in the arid shrub grassland landscape, along with the vegetation vertical structure information obtained from laser radar with the LVV data measured on the ground and trained the RF regression model to predict the LVV of corn. The R2 of the total LVV was 0.74, and the RMSE was 141 g/m2. Kankare et al. [45] used airborne laser radar to measure the 3D structure of forest vegetation, and used the geometric and statistical point measurements derived from the airborne laser scanning point cloud data as the explanatory variables to establish the linear models of total LVV of trees, dry wood, living branches, and total canopy. The RMSEs of the total LVV of Scots pine and Picea abies were 26.3% and 36.8%, respectively. In the future, UAV technology and laser radar technology can be combined to establish a new method for the LVV measurement of areca and improve the accuracy of the LVV measurement of a single areca plant.
  • Owing to the development of UAV technology and hyperspectral remote sensing technology, UAVs can carry hyperspectral sensors to obtain data such as crop leaf area index, biomass, and chlorophyll content, to achieve a better evaluation of the growth status of plants. Jiang et al. [46] used hyperspectral image data combined with the successive projection algorithm (SPA) to extract sensitive spectral and texture features related to mangrove pest information, and used the RF algorithm to model and visualize leaf traits under different pest severities. The results indicate that the combination of the SPA-RF model and hyperspectral images presented considerable potential in monitoring the spatial distribution of leaf traits under different pest severities. Liu et al. [2] obtained the canopy reflection spectrum of rice at the booting stage by using a hyperspectral remote sensor mounted on a UAV, and estimated the rice leaf roll rate through the multispectral index to monitor the Lerodea eufala Edwards. Therefore, in the future, UAVs equipped with hyperspectral sensors can be used to more accurately evaluate the health of a single areca plant for the monitoring of the yellow leaf disease of arecanut.
  • The modeling method used in constructing the prediction model of the yellow leaf disease of arecanut also affects the accuracy and efficiency of inversion of the severity of the yellow leaf disease of arecanut. The DT algorithm, along with the naïve Bayes, SVM, k-NN classification, and BPNN algorithms, face several problems to be solved. These include accurately determining the number of hidden layer nodes, non-convergence of the network due to the small number of nodes, poor fault tolerance, and a long learning time of the network and the phenomenon of over-fitting due to a large number of nodes. Deep learning has also made great progress in the field of plant pest monitoring due to the rapid development of artificial intelligence technology. Duarte-Carvajalino et al. [47] used algorithms such as multilayer perceptron, convolutional neural network (CNN), support vector regression, and RF to quantitatively predict the severity of potato blight. The results demonstrate that the CNN can more effectively predict the impact of potato blight on crops. Agarwal [48] combined visible near-infrared hyperspectral imaging and deep learning tools (convolutional neural networks and capsule networks) to identify the Khapra beetle. The recognition accuracy of the two models was greater than 90%. Ferentinos et al. [49] established a CNN model for plant disease detection and diagnosis using deep learning methods combined with the simple leaf images of healthy plants and diseased plants to identify the presence or absence of diseases. This demonstrates the considerable potential of deep learning for application in plant pest monitoring. Therefore, the deep learning algorithm can be used for the future monitoring of the yellow leaf disease of arecanut, to establish a model to monitor the status of the disease to improve the accuracy and efficiency of predicting its severity.

5. Conclusions

UAV multispectral remote sensing has been widely applied in agriculture, forestry, resources, ecology, environmental protection, and various other fields. This study used the UAV multisource remote sensing data to achieve a novel quantitative expression of the severity of the yellow leaf disease of arecanut, and analyzed the correlation between the LVV of areca and the severity of the yellow leaf disease of arecanut. Despite the precise, refined, and intelligent monitoring of the yellow leaf disease of arecanut achieved by this study, the accuracy of the areca crown edge extraction, the LVV measurement accuracy of areca, and the measurement of the areca crown yellowing area accuracy must still be improved. Therefore, in terms of hardware, the hyperspectral sensors must be combined with 3D laser radar in future research applications, and more deep learning algorithms must be integrated. Additionally, this study further proves that UAV multispectral remote sensing presents considerable application potential in vegetation growth monitoring, identification of the existing problems, fine classification and ground object identification, pest and disease monitoring, biomass and yield estimation, and so on. This study can be considered as the basis for the development of relevant research. The degree of integration of multispectral software and hardware, observation accuracy, and the ease of use of UAVs can be significantly developed with the future development of spectral sensing technology and image processing and analysis algorithms.

Author Contributions

Conceived the research route, Z.Q.; designed and performed the experiments, Z.Q., S.L., J.L. and X.T.; analyzed the data and wrote the main manuscript, Z.Q. and S.L. All authors have read and agreed to the published version of the manuscript.

Funding

This research was funded by “Hainan Provincial Key Research and Development Plan of China (Grant number ZDYF2021SHFZ110)”, “National Natural Science Foundation of China (Grant number 32160364)”, “Hainan Provincial Natural Science Foundation of China (Grant number 320QN185)”, “Scientific Research Staring Foundation of Hainan University (Grant number KYQD(ZR)20056)”, “Science and Technology Project of Haikou City, China (Grant number 2020-057)”, “The Fundamental Research Funds for the Central Universities, Beijing Forestry University (Grant number BFUKF202110)”, and “National College Student Innovation and Entrepreneurship Training Program of China (Grant number 202110589096)”.

Institutional Review Board Statement

Not applicable.

Informed Consent Statement

Not applicable.

Data Availability Statement

Data available in a publicly accessible repository that does not issue DOIs Publicly available datasets were analyzed in this study. This data can be found here: http://www.zixuanqiu.com/nd.jsp?id=39#_np=110_649 (accessed on 20 October 2021).

Conflicts of Interest

The authors declare no conflict of interest.

References

  1. Chu, H.; Zhang, D.; Shao, Y.; Chang, Z.; Guo, Y.; Zhang, N. Using HOG Descriptors and UAV for Crop Pest Monitoring. In Proceedings of the 2018 Chinese Automation Congress (CAC), Xi’an, China, 30 November–2 December 2018; pp. 1516–1519. [Google Scholar]
  2. Liu, T.; Shi, T.; Zhang, H.; Wu, C. Detection of Rise Damage by Leaf Folder (Cnaphalocrocis medinalis) Using Unmanned Aerial Vehicle Based Hyperspectral Data. Sustainability 2020, 12, 9343. [Google Scholar] [CrossRef]
  3. Marston, Z.P.D.; Cira, T.M.; Hodgson, E.W.; Knight, J.F.; MacRae, I.V.; Koch, R.L. Detection of Stress Induced by Soybean Aphid (Hemiptera: Aphididae) Using Multispectral Imagery from Unmanned Aerial Vehicles. J. Econ. Entomol. 2020, 113, 779–786. [Google Scholar] [CrossRef] [PubMed]
  4. Liu, M.; Zhang, Z.; Liu, X.; Yao, J.; Du, T.; Ma, Y.; Shi, L. Discriminant Analysis of the Damage Degree Caused by Pine Shoot Beetle to Yunnan Pine Using UAV-Based Hyperspectral Images. Forests 2020, 11, 1258. [Google Scholar] [CrossRef]
  5. Severtson, D.; Callow, N.; Flower, K.; Neuhaus, A.; Olejnik, M.; Nansen, C. Unmanned aerial vehicle canopy reflectance data detects potassium deficiency and green peach aphid susceptibility in canola. Precis. Agric. 2016, 17, 659–677. [Google Scholar] [CrossRef] [Green Version]
  6. Zhang, N.; Wang, Y.; Zhang, X. Extraction of tree crowns damaged byDendrolimus tabulaeformis Tsaiet Liu via spectral-spatial classification using UAV-based hyperspectral images. Plant Methods 2020, 16, 135. [Google Scholar] [CrossRef]
  7. Fei, S.; Morin, R.S.; Oswalt, C.M.; Liebhold, A.M. Biomass losses resulting from insect and disease invasions in US forests. Proc. Natl. Acad. Sci. USA 2019, 116, 17371–17376. [Google Scholar] [CrossRef] [Green Version]
  8. Tipping, P.W.; Martin, M.R.; Gettys, L.A. A gall-forming biological control agent suppresses vegetative growth of an invasive tree. Biocontrol Sci. Technol. 2016, 26, 1586–1589. [Google Scholar] [CrossRef]
  9. Petro, R.; Madoffe, S.S.; Iddi, S.; Mugasha, W.A. Impact of Eucalyptus gall wasp, Leptocybe invasa infestation on growth and biomass production of Eucalyptus grandis and E. saligna seedlings in Tanzania. Int. J. Pest Manag. 2015, 61, 220–227. [Google Scholar] [CrossRef]
  10. Kachamba, D.J.; Ørka, H.O.; Gobakken, T.; Eid, T.; Mwase, W. Biomass estimation using 3D data from unmanned aerial vehicle imagery in a tropical woodland. Remote Sens. 2016, 8, 968. [Google Scholar] [CrossRef] [Green Version]
  11. Batistoti, J.; Marcato, J.; Itavo, L.; Matsubara, E.; Gomes, E.; Oliveira, B.; Souza, M.; Siqueira, H.; Salgado, G.; Akiyama, T.; et al. Estimating Pasture Biomass and Canopy Height in Brazilian Savanna Using UAV Photogrammetry. Remote Sens. 2019, 11, 2447. [Google Scholar] [CrossRef] [Green Version]
  12. Niu, Y.X.; Zhang, L.Y.; Zhang, H.H.; Han, W.T.; Peng, X.S. Estimating Above-Ground Biomass of Maize Using Features Derived from UAV-Based RGB Imagery. Remote Sens. 2019, 11, 1261. [Google Scholar] [CrossRef] [Green Version]
  13. Yue, J.; Feng, H.; Jin, X.; Yuan, H.; Li, Z.; Zhou, C.; Yang, G.; Tian, Q. A comparison of crop parameters estimation using images from UAV-mounted snapshot hyperspectral sensor and high-definition digital camera. Remote Sens. 2018, 10, 1138. [Google Scholar] [CrossRef] [Green Version]
  14. Liu, T.; Sun, Y.; Wang, C.; Zhang, Y.; Qiu, Z.; Gong, W.; Lei, S.; Tong, X.; Duan, X. Unmanned aerial vehicle and artificial intelligence revolutionizing efficient and precision sustainable forest management. J. Clean. Prod. 2021, 311, 127546. [Google Scholar] [CrossRef]
  15. Yang, Y.; Zhu, J.; Zhao, C.; Liu, S.; Tong, X. The spatial continuity study of NDVI based on Kriging and BPNN algorithm. Math. Comput. Model. 2011, 54, 1138–1144. [Google Scholar] [CrossRef]
  16. Sehgal, S. Human activity recognition using BPNN classifier on HOG features. In Proceedings of the 2018 International Conference on Intelligent Circuits and Systems (ICICS), Phagwara, India, 19–20 April 2018; pp. 286–289. [Google Scholar]
  17. Liakos, K.G.; Busato, P.; Moshou, D.; Pearson, S.; Bochtis, D. Machine Learning in Agriculture: A Review. Sensors 2018, 18, 2674. [Google Scholar] [CrossRef] [Green Version]
  18. Rahimi, N.; Eassa, F.; Elrefaei, L. An Ensemble Machine Learning Technique for Functional Requirement Classification. Symmetry 2020, 12, 1601. [Google Scholar] [CrossRef]
  19. Wills, S.; Underwood, C.J.; Barrett, P.M.; Lautenschlager, S. Learning to see the wood for the trees: Machine learning, decision trees, and the classification of isolated theropod teeth. Palaeontology 2020, 64, 75–99. [Google Scholar] [CrossRef]
  20. Harlianto, P.A.; Adji, T.B.; Setiawan, N.A. Comparison of machine learning algorithms for soil type classification. In Proceedings of the 2017 3rd International Conference on Science and Technology-Computer (ICST), Yogyakarta, Indonesia, 11–12 July 2017; pp. 7–10. [Google Scholar]
  21. Adeniyi, D.A.; Wei, Z.; Yongquan, Y. Automated web usage data mining and recommendation system using K-Nearest Neighbor (KNN) classification method. Appl. Comput. Inform. 2016, 12, 90–108. [Google Scholar] [CrossRef] [Green Version]
  22. Li, W.; Yi, P.; Wu, Y.; Pan, L.; Li, J. A New Intrusion Detection System Based on KNN Classification Algorithm in Wireless Sensor Network. J. Electr. Comput. Eng. 2014, 2014, 240217. [Google Scholar] [CrossRef]
  23. Busby, P.E.; Canham, C.D. An exotic insect and pathogen disease complex reduces aboveground tree biomass in temperate forests of eastern North America. Can. J. For. Res. 2011, 41, 401–411. [Google Scholar] [CrossRef]
  24. van Molken, T.; Kuzina, V.; Munk, K.R.; Olsen, C.E.; Sundelin, T.; van Dam, N.M.; Hauser, T.P. Consequences of combined herbivore feeding and pathogen infection for fitness of Barbarea vulgaris plants. Oecologia 2014, 175, 589–600. [Google Scholar] [CrossRef] [Green Version]
  25. Virla, E.; Araoz, M.C.; Albarracin, E.L. Estimation of direct damage to maize seedlings by the corn leafhopper, Dalbulus maidis (Hemiptera: Cicadellidae), under different watering regimes. Bull. Entomol. Res. 2021, 111, 1–7. [Google Scholar] [CrossRef]
  26. Díaz-Pérez, J.C.; Hook, J.E. Plastic-mulched bell pepper (Capsicum annuum L.) plant growth and fruit yield and quality as influenced by irrigation rate and calcium fertilization. HortScience 2017, 52, 774–781. [Google Scholar] [CrossRef]
  27. Hoheneder, F.; Hofer, K.; Groth, J.; Herz, M.; Heß, M.; Hückelhoven, R. Ramularia leaf spot disease of barley is highly host genotype-dependent and suppressed by continuous drought stress in the field. J. Plant Dis. Prot. 2021, 128, 749–767. [Google Scholar] [CrossRef]
  28. Xiao, C.; Subbarao, K. Effects of irrigation and Verticillium dahliae on cauliflower root and shoot growth dynamics. Phytopathology 2000, 90, 995–1004. [Google Scholar] [CrossRef] [Green Version]
  29. Ni, X.; Quisenberry, S.S. Diuraphis noxia and Rhopalosiphum padi (Hemiptera: Aphididae) interactions and their injury on resistant and susceptible cereal seedlings. J. Econ. Entomol. 2006, 99, 551–558. [Google Scholar] [CrossRef] [Green Version]
  30. Petersen, M.J.; Peck, D.C. Host plant resistance of cool-season (C3) turfgrasses to above-and belowground feeding by Tipula paludosa (Diptera: Tipulidae). J. Econ. Entomol. 2013, 106, 1463–1472. [Google Scholar] [CrossRef] [Green Version]
  31. Coyle, D.R.; Nebeker, T.E.; Hart, E.R.; Mattson, W.J. Biology and management of insect pests in North American intensively managed hardwood forest systems. Annu. Rev. Entomol. 2005, 50, 1–29. [Google Scholar] [CrossRef] [Green Version]
  32. Zhao, Z.; Shi, P.; Men, X.; Ouyang, F.; Ge, F. Effects of crop species richness on pest-natural enemy systems based on an experimental model system using a microlandscape. Sci. China Life Sci. 2013, 56, 758–766. [Google Scholar] [CrossRef] [Green Version]
  33. Hansen, E.M.; Amacher, M.C.; Van Miegroet, H.; Long, J.N.; Ryan, M.G. Carbon Dynamics in Central US Rockies Lodgepole Pine Type after Mountain Pine Beetle Outbreaks. For. Sci. 2015, 61, 665–679. [Google Scholar] [CrossRef] [Green Version]
  34. Hill, M.; Connolly, P.; Reutemann, P.; Fletcher, D. The use of data mining to assist crop protection decisions on kiwifruit in New Zealand. Comput. Electron. Agric. 2014, 108, 250–257. [Google Scholar] [CrossRef]
  35. Tuda, M.; Luna-Maldonado, A.I. Image-based insect species and gender classification by trained supervised machine learning algorithms. Ecol. Inform. 2020, 60, 101135. [Google Scholar] [CrossRef]
  36. Marković, D.; Vujičić, D.; Tanasković, S.; Đorđević, B.; Ranđić, S.; Stamenković, Z. Prediction of Pest Insect Appearance Using Sensors and Machine Learning. Sensors 2021, 21, 4846. [Google Scholar] [CrossRef] [PubMed]
  37. Pertot, I.; Kuflik, T.; Gordon, I.; Freeman, S.; Elad, Y. Identificator: A web-based tool for visual plant disease identification, a proof of concept with a case study on strawberry. Comput. Electron. Agric. 2012, 84, 144–154. [Google Scholar] [CrossRef]
  38. Ahmed, N.; Asif, H.M.S.; Saleem, G. Leaf Image-based Plant Disease Identification using Color and Texture Features. arXiv 2021, arXiv:2102.04515. [Google Scholar]
  39. Puig Garcia, E.; Gonzalez, F.; Hamilton, G.; Grundy, P. Assessment of crop insect damage using unmanned aerial systems: A machine learning approach. In Proceedings of the MODSIM2015, 21st International Congress on Modelling and Simulation, Broadbeach, Australia, 29 November–4 December 2015; pp. 1420–1426. [Google Scholar]
  40. Jung, K.Y.; Park, J.K. Analysis of vegetation infection information using unmanned aerial vehicle with optical sensor. Sens. Mater. 2019, 31, 3319–3326. [Google Scholar] [CrossRef]
  41. Prabhu, Y.; Parab, J.S.; Naik, G.M. Exploration of an Image Processing Model for the Detection of Borer Pest Attack. In Proceedings of the International Conference On Computational Vision and Bio Inspired Computing, Coimbatore, India, 25–26 September 2019; pp. 589–597. [Google Scholar]
  42. Wu, B.; Yu, B.; Wu, Q.; Huang, Y.; Chen, Z.; Wu, J. Individual tree crown delineation using localized contour tree method and airborne LiDAR data in coniferous forests. Int. J. Appl. Earth Obs. Geoinf. 2016, 52, 82–94. [Google Scholar] [CrossRef]
  43. Johnson, K.D.; Birdsey, R.; Cole, J.; Swatantran, A.; O’Neil-Dunne, J.; Dubayah, R.; Lister, A. Integrating LIDAR and forest inventories to fill the trees outside forests data gap. Environ. Monit. Assess. 2015, 187, 623. [Google Scholar] [CrossRef]
  44. Li, W.; Niu, Z.; Huang, N.; Wang, C.; Gao, S.; Wu, C. Airborne LiDAR technique for estimating biomass components of maize: A case study in Zhangye City, Northwest China. Ecol. Indic. 2015, 57, 486–496. [Google Scholar] [CrossRef]
  45. Kankare, V.; Räty, M.; Yu, X.; Holopainen, M.; Vastaranta, M.; Kantola, T.; Hyyppä, J.; Hyyppä, H.; Alho, P.; Viitala, R. Single tree biomass modelling using airborne laser scanning. ISPRS J. Photogramm. Remote Sens. 2013, 85, 66–73. [Google Scholar] [CrossRef]
  46. Jiang, X.; Zhen, J.; Miao, J.; Zhao, D.; Wang, J.; Jia, S. Assessing mangrove leaf traits under different pest and disease severity with hyperspectral imaging spectroscopy. Ecol. Indic. 2021, 129, 107901. [Google Scholar] [CrossRef]
  47. Duarte-Carvajalino, J.M.; Alzate, D.F.; Ramirez, A.A.; Santa-Sepulveda, J.D.; Fajardo-Rojas, A.E.; Soto-Suárez, M. Evaluating late blight severity in potato crops using unmanned aerial vehicles and machine learning algorithms. Remote Sens. 2018, 10, 1513. [Google Scholar] [CrossRef] [Green Version]
  48. Agarwal, M.; Al-Shuwaili, T.; Nugaliyadde, A.; Wang, P.; Wong, K.W.; Ren, Y. Identification and diagnosis of whole body and fragments of Trogoderma granarium and Trogoderma variabile using visible near infrared hyperspectral imaging technique coupled with deep learning. Comput. Electron. Agric. 2020, 173, 105438. [Google Scholar] [CrossRef]
  49. Ferentinos, K.P. Deep learning models for plant disease detection and diagnosis. Comput. Electron. Agric. 2018, 145, 311–318. [Google Scholar] [CrossRef]
Figure 1. Technology roadmap.
Remotesensing 13 04562 g001
Figure 2. Overview of the research area.
Remotesensing 13 04562 g002
Figure 3. BPNN structure.
Remotesensing 13 04562 g003
Figure 4. (a) Hyperplane of linearly separable data; (b) optimum hyperplane and support vectors.
Remotesensing 13 04562 g004
Figure 5. Areca zoning in the study area.
Remotesensing 13 04562 g005
Figure 6. Areca forest vegetation index: (a) NDVI; (b) OSAVI; (c) LCI; (d) GNDVI; (e) NDRE.
Remotesensing 13 04562 g006
Figure 7. Research area: (a) DOM; (b) DSM.
Remotesensing 13 04562 g007
Figure 8. 3D point cloud of areca in the research area: (a) 3D point cloud based on RGB color rendering; (b) 3D point cloud based on elevation color rendering.
Remotesensing 13 04562 g008
Figure 9. LVV distribution of areca in the research area.
Remotesensing 13 04562 g009
Figure 10. Prediction of the severity of the yellow leaf disease of arecanut based on five machine learning algorithms: (a) prediction results of BPNN algorithm; (b) prediction results of DT algorithm; (c) prediction results of naïve Bayes algorithm; (d) prediction results of SVM algorithm; (e) prediction results of k-NN classification algorithm.
Remotesensing 13 04562 g010
Figure 11. Accuracy evaluation of LVV and yellow leaf disease of arecanut severity model: (a) evaluation results of model accuracy in areca area A; (b) evaluation results of model accuracy in areca area B; (c) evaluation results of model accuracy in areca area C.
Remotesensing 13 04562 g011
Table 1. Multispectral vegetation index [13].
Multispectral Vegetation Index.Index DescriptionFormula
Normalized Difference Vegetation Index (NDVI)NDVI is the most widely used index to determine the chlorophyll content of vegetation, which presents the growth and nutritional information of vegetation, and is suitable for monitoring the vegetation growth state and vegetation coverage.NDVI = (NIR − Red)/(NIR + Red)
Optimized Soil Adjusted Vegetation Index (OSAVI)OSAVI shows that the vegetation index is significantly affected by the soil in the early stage of vegetation growth, when the vegetation density is not high. OSAVI is based on NDVI and considers the factors of soil, which can effectively identify the chlorophyll content of plants in the early stage of growth.OSAVI = (NIR − Red)/(NIR = Red + 0.16)
Leaf Chlorophyll Index (LCI)LCI is an important index that is used to evaluate vegetation growth and yield. The chlorophyll content is one of the factors used to evaluate plant nutritional stress, disease, growth, and senescence. This index has a good effect on the determination of chlorophyll nitrogen content in vegetation.LCI = (NIR − RedEdge)/(NIR + Red)
Green Normalized Difference Vegetation Index (GNDVI)GNDVI, which replaces the red light band in NDVI with the green light band, is a surface greenness index used to demonstrate the coverage of green plant canopy. GNDVI can show the decline of biomass after vegetation is subjected to water and vegetable stress or maturity.GNDVI = (NIR − Green)/(NIR + Green)
Normalized Difference Red Edge (NDRE) IndexNDRE, which replaces the red light band in NDVI with the red-edge band. The red-edge band is a spectral region in the transition zone from the red spectrum to the near-infrared spectrum. This index has a good effect on determining the chlorophyll content of non-initial crops. The NDRE can be used to manage different variables of vegetation, such as chlorophyll and sugar content.NDRE = (NIR − RedEdge)/(NIR + RedEdge)
Note: NIR, Red, Green, and RedEdge are the multispectral indexes of near-infrared, red, green, and red-edge light bands, respectively.
Table 2. Classification accuracy of different machine learning algorithms.
Classification MethodClassification Accuracy of Training Set%Test Set Classification Accuracy
Test Set Classification Accuracy%KappaYellowing Producer’s Accuracy%Yellowing User’s Accuracy%Normal Producer’s Accuracy%Normal User’s Accuracy%
BPNN92.0086.570.7384.4784.5488.1788.12
DT87.1084.730.6986.5579.9183.3489.00
naïve Bayes86.3083.630.6791.1675.9377.8792.00
SVM87.8086.300.7286.9382.4385.8289.56
k-NN Classification83.8081.200.6280.5577.1281.7084.58
Table 3. Model fitting parameters.
Areca AreaabR
A0.804−1.0910.614
B0.798−0.9330.516
C0.424−0.9140.609
Publisher’s Note: MDPI stays neutral with regard to jurisdictional claims in published maps and institutional affiliations.

