Abstract
Runoff signatures (RS), a special set of runoff indexes reflecting the hydrological process, have an important influence on many fields of both human and natural systems by flooding, drought, and available water resources. However, the global RS changes and their causes remain largely unknown. Here, we make a comprehensive investigation of RS changes and their response to total water storage anomalies (TWSA) from GRACE satellites, atmospheric circulation, and reservoir construction by using daily runoff data from 21,955 hydrological stations during 1975–2017. The global assessment shows that (1) in recent years, the global extreme flow signatures tend to decrease, while the low and average flow signatures are likely to increase in more regions; (2) the spatial patterns of trends are similar for different RS, suggesting that the runoff distribution tends to entirely upward in some regions, while downward in other regions; (3) the trends in RS are largely consistent with that in TWSA over most regions in North America and eastern South America during 1979–2017, indicating that the GRACE-based TWSA have great potential in hydrological monitoring and attribution; (4) atmospheric circulation change could partly explain the global spatiotemporal variation patterns of RS; (5) dams have important influences on reducing the high flow signature in the catchments including dams built during 1975–2017. This study provides a full picture of RS changes and their possible causes, which has important implications for water resources management and flood and drought disaster assessment.
1. Introduction
River runoff is a crucial link in the earth’s water cycle and the most important component of available water resources; therefore, the accurate description of runoff characteristics is vital for hydrological risk assessment and water resources management [1]. Despite its importance in water resources management and flood and drought disaster assessments, unfortunately, the global spatial patterns of runoff signatures (RS) and its response to total water storage anomalies (TWSA), atmospheric circulation, and human activities remain largely unknown yet. This is primarily due to the lack of global observation data and the scarcity of indicators to comprehensively characterize runoff change [2]. Therefore, to better describe the process of runoff change, we introduce a special set of runoff indexes based on a synthetic set of daily runoff data that can fully reflect the change characteristics of river runoff, namely RS [3]. They are divided into five categories: low flow signature, high flow signature, average flow signature, flow dynamic signature, event frequency, and duration. We selected eight RS and show them in Table 1. The abbreviations used later for RS are also shown in Table 1.

Table 1.
Summary of eight runoff signatures in the 10,044 stations.
At present, most studies on runoff change analysis are limited to regional or national scales, such as these in China [4], United States [5], and Australia [3]. However, there are some limitations in the attribution investigation of runoff change at the regional scale: (1) runoff change is influenced by the local catchment microclimate and underlying surface conditions [6], and the results cannot represent the universal regular globally; (2) due to different research methods and different comparison periods, it is difficult to carry out comparative studies on large spatial scales. In recent years, a few studies have been conducted on the attribution of global runoff change [7,8,9]. However, due to the lack of observation data, researchers mostly use reconstructed data to analyze global runoff change [10,11]. These efforts have created conditions for the development of global runoff research, but the detection results are still affected by the uncertainty of simulated runoff data. In addition, these studies mostly take mean runoff as the research object, hence their results cannot comprehensively show the change characteristics of RS, such as extreme hydrological events, flood peak runoff and dry water runoff [3].
The large-scale river runoff change is the consequence of the complex interaction of climate conditions, human activity, vegetation, topography, total water storage, and other factors. Among them, total water storage, climate change, and human activities have relatively large variability, which is the main influencing factor of runoff change [12,13,14]. Therefore, we evaluate the RS variation trend from three aspects of TWSA, atmospheric circulation, and reservoir regulation. First, TWSA includes all the water components of the earth’s continental regions and is an important indicator of global climate change [15]. At present, a few studies have already explored the response of floods to TWSA. For example, Reager et al. [16] point out that gradual changes in TWSA are a prerequisite for local flood potential. However, the response of RS to TWSA is not very clear yet. Therefore, our study can provide more supporting evidence for the causes of RS change from the perspective of TWSA change based on remote sensing satellite data. Second, atmospheric circulation strongly influences precipitation variability, thus affecting runoff changes [17,18]. Some studies have concentrated on the connection between large-scale atmospheric circulation change and catchment runoff processes or extreme runoff events, embedding basin runoff processes in the global atmospheric circulation context [19]. For example, changes in catchment runoff in North America, Australia, Africa, and elsewhere have been affected by the ENSO in large part [20,21]. However, the response of global runoff variation to large-scale atmospheric circulation has not been adequately studied, especially, the possible roles of geopotential height, horizontal wind, and water vapor flux in atmospheric circulation are still unclear yet. This study reveals the action process and underlying physical mechanism of atmospheric circulation on RS through spatiotemporal variation of atmospheric variables. Third, except TWSA and atmospheric circulation, human activities on the ground such as historical water and land management also influence surface runoff and hydrological extreme events [2]. For example, the construction and operation of dams would have an impact on runoff change. Additionally, the change of surface runoff will further affect the agriculture, natural environment, fishery industry, and infrastructure construction of the local river catchment [22]. However, due to the lack of reliable reservoir models and attribution methods, little is known about the effects of dam construction and operation on runoff. Therefore, our study evaluates the effect of dams on the changing trend of RS by applying field significance resampling methods at the global scale.
Overall, the RS changes are not investigated at the global scale, and the possible mechanisms of global RS changes remain largely unknown. Hence, the scientific questions that this study attempts to solve are as follows: (1) What is the temporal and spatial variation trend of the RS globally? (2) How does the RS respond to TWSA and atmospheric circulation? (3) What is the impact of dams on RS change?
2. Materials
2.1. Runoff Signatures Data
As mentioned in the introduction, due to the lack of hydrometric gauging stations, most studies on runoff change are limited to regional or national scales. To investigate the global RS changes and their causes, a set of daily runoff data from 21,955 gauging stations globally is synthesized. The specific data sources are shown in Table 2 below [23,24,25].
Table 2.
Summary of station observations’ sources.
Considering the runoff datasets were obtained from different sources, we carried out a series of criteria to control the quality of daily flow by referring to some mature data processing methods [26]. The relevant details of the standards used in this study are as follows:
- The runoff data with more than 10 consecutive data are regarded as missing data [27].
- For each station, the data in the year with missing observations more than 10% is discarded [28].
- The station is deleted if the streamflow valid recording length is less than 10 years (not necessarily continuous) at a station during 1975–2017 (the period chosen for the research).
Finally, observations from a total of 10,044 gauging stations meet these requirements, namely dataset A. The global distribution of hydrological stations for dataset A is shown in Figure 1.

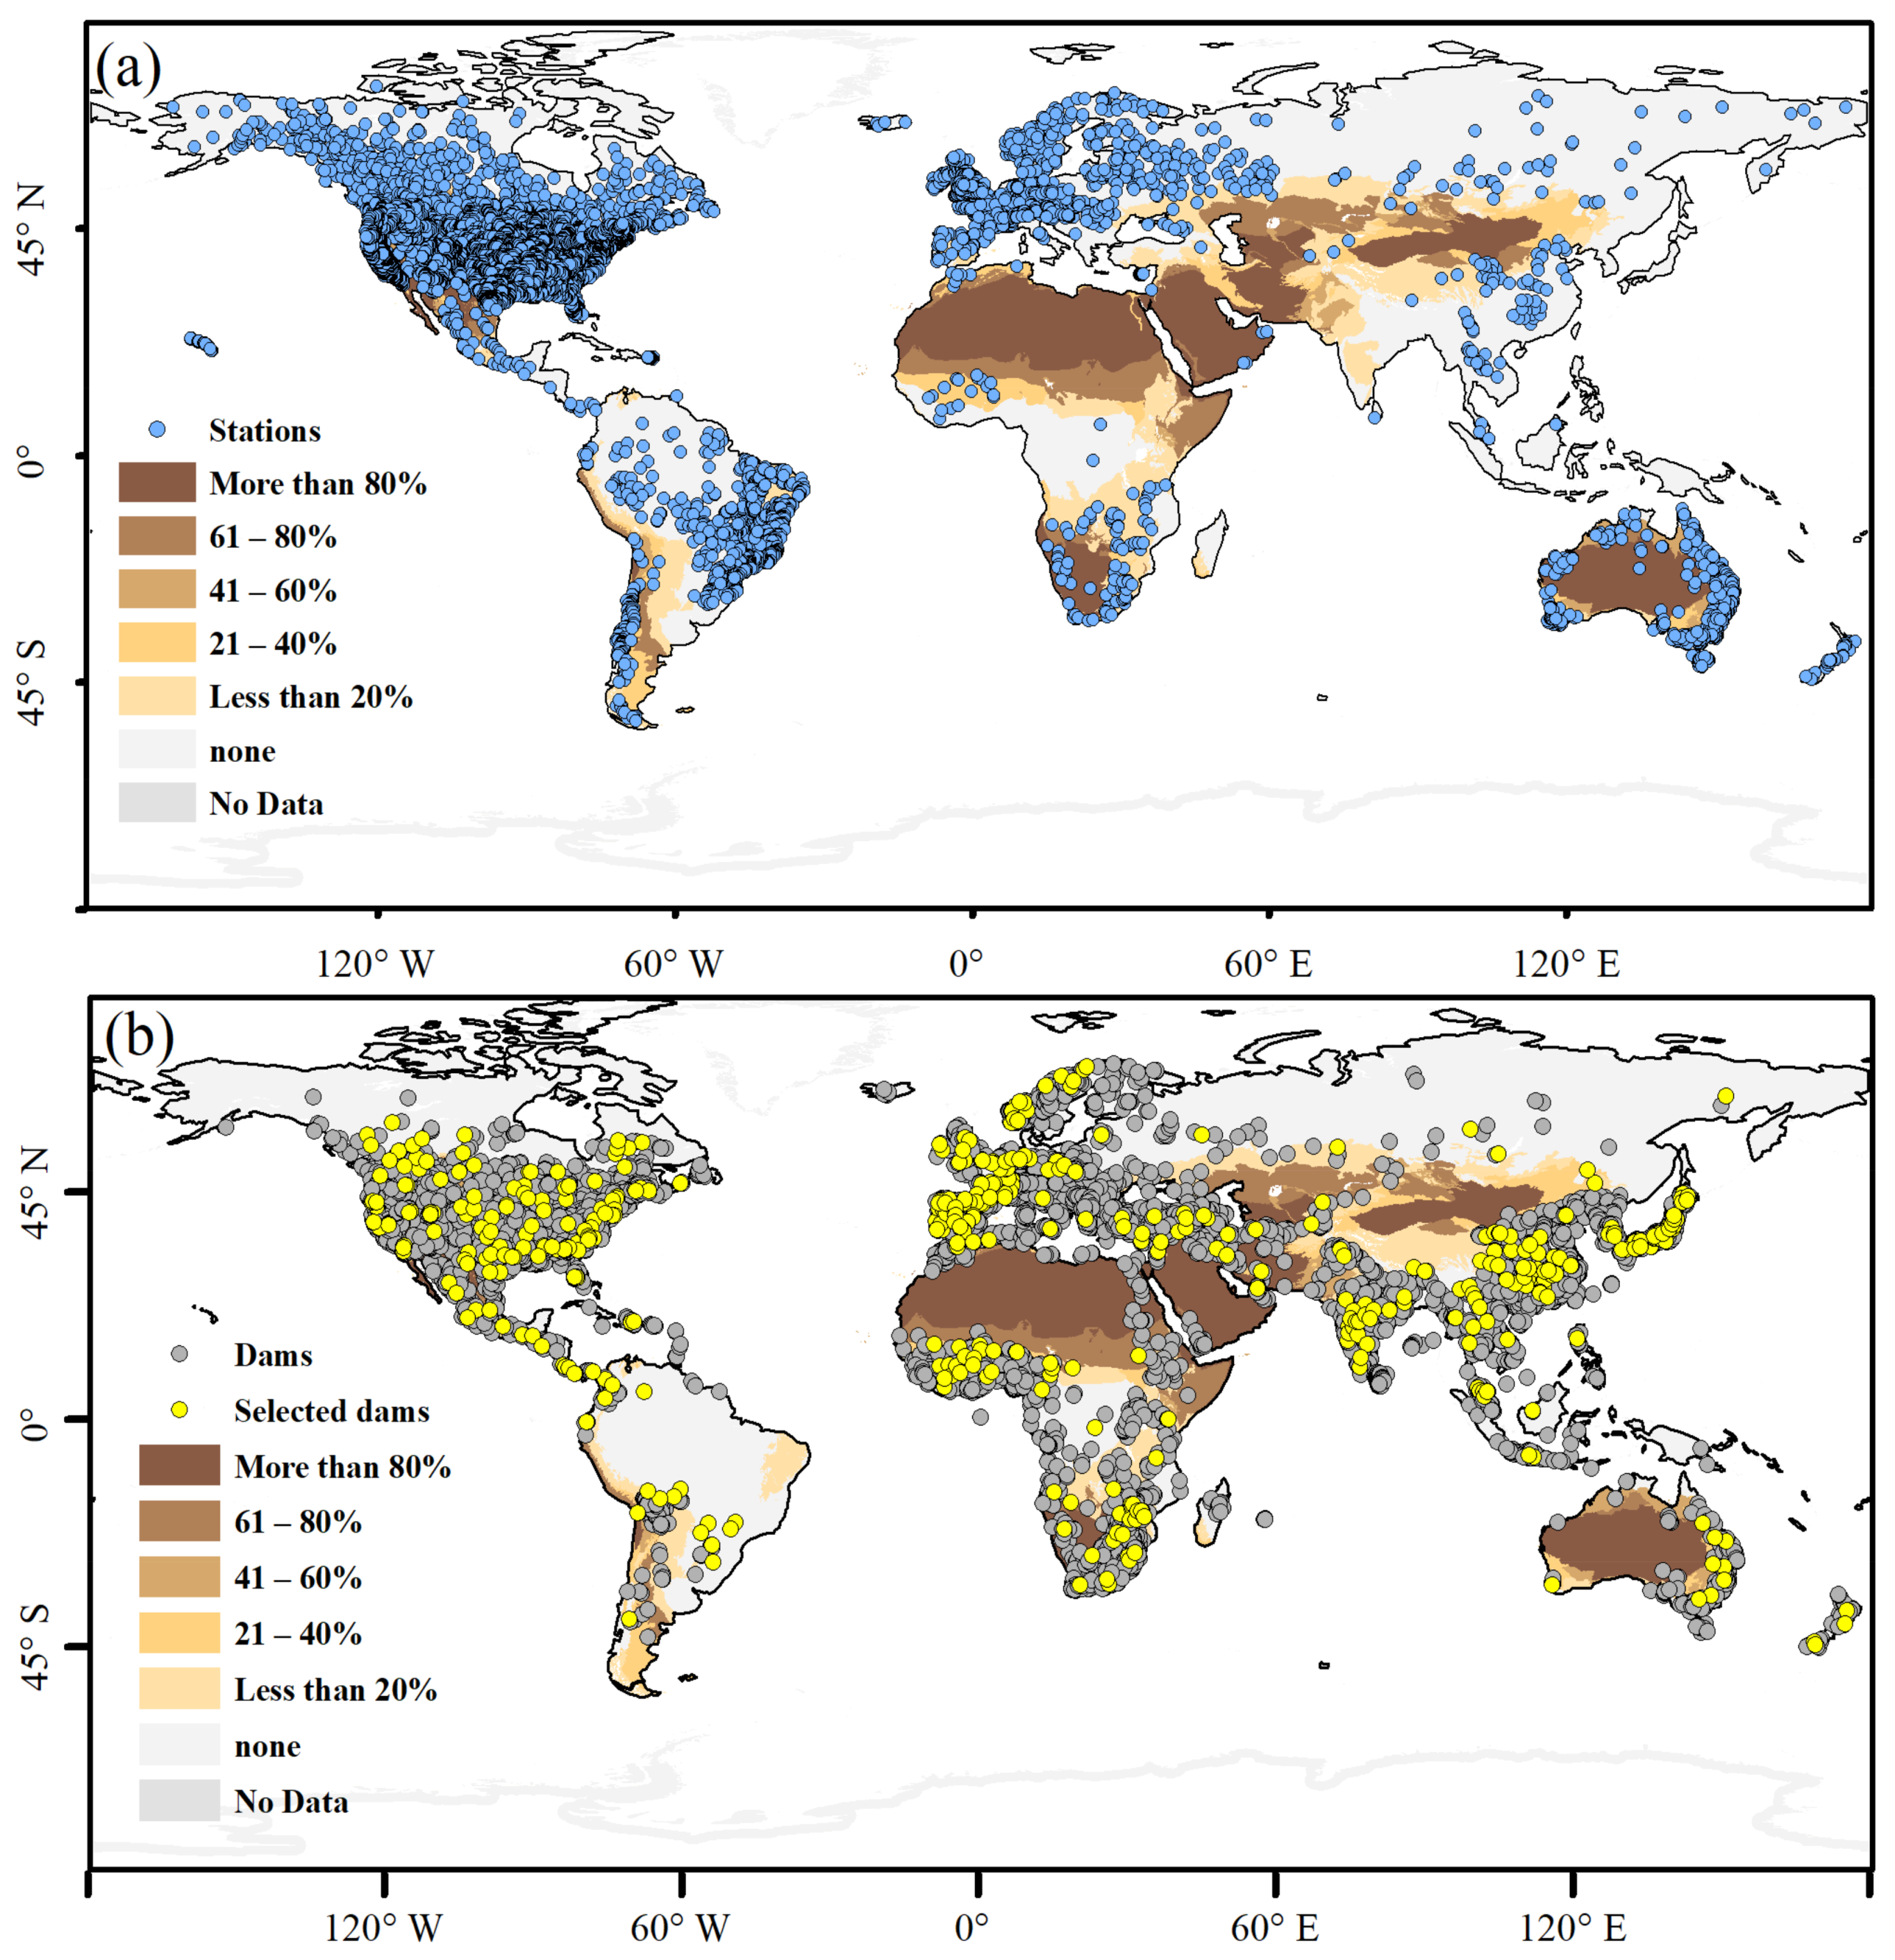
Figure 1.
The spatial distribution of hydrological stations and dams. (a) The blue points indicate the selected the hydrological stations used in this study. (b) The global distribution of the dam is at the bottom. The grey points are the collected 7320 dams in the world, and the yellow points are selected 5182 dams located in the selected catchment boundaries from 1975 to 2017. Brown areas represent the arid regions of the world, and light and dark colors represent the percentage of arid land area.
2.2. GRACE Satellite Data
Global total water storage anomalies (TWSA) have been monitored by NASA’s Gravity Recovery and Climate Experiment (GRACE) satellites via satellite gravimetry with unprecedented precision. GRACE data may be valuable for monitoring trends in the extreme runoff by providing information on both base flow stored in soil and groundwater and event flow driven by precipitation [29]. However, since the GRACE satellite was launched in 2002, the GRACE TWSA only covers the period of 2002–2017. Hence, we used a newly released reconstructed TWSA data based on GRACE observation, which covers the period of 1979–2019 with the spatial resolution of 0.5° [30]. Additionally, we assess the relationship between TWSA and RS changes by using the GRACE global monthly mass concentration blocks version RL05m from the Jet Propulsions Laboratory. To keep the same temporal resolutions, we used the common coverage periods of GRACE-based TWSA and RS in the analysis, i.e., 1979–2017. For the spatial resolutions, we also extracted the catchment-scale TWSA, and compared their trends with RS trends in the same catchment scale. The dataset could be downloaded (https://doi.org/10.5061/dryad.z612jm6bt, accessed on 4 August 2021).
2.3. Atmospheric Circulation Data
It is significant to evaluate the response of RS to atmospheric circulation. Fortunately, the Japan Meteorological Agency (JMA) has launched the Japanese global atmospheric reanalysis project, which is named the Japanese 55-year Reanalysis (JRA-55) [31]. In this study, the JRA-55 was used to explore the impacts of atmospheric circulation on RS. It covers a total of 62 years from 1958 to 2019. Monthly horizontal wind and geopotential height at 850,500, and 300 hPa level with the 2.5° × 2.5° spatial resolution and the water vapor flux with a spatial resolution of 1.25° × 1.25° was chosen to carry on attribution analysis of RS change. The reanalysis dataset could be available on the NCAR/UCAR website (https://rda.ucar.edu/, accessed on 4 August 2021).
2.4. Dams Data
To evaluate the impact of dams on RS change globally, we collected a dam dataset with a relative complete variable from the Global Reservoir and Dam Database (GRanD) (http://wp.geog.mcgill.ca/hydrolab/grand/, accessed on 4 August 2021). This database includes 7320 dams with a height greater than 15 m or storage capacity larger than 0.1 km3. It should be noted that this dataset was obtained voluntarily from various research groups around the world, which had different observation equipment, methods of data collection, and collation. Therefore, it is not realistic to provide a uniform description of the same standard for all dams globally [28]. In this dataset, there are 5182 dams built during 1975–2017. We determined the number of dams in each catchment according to the shapefiles of the catchment boundary. If there was one (or more) dam within the catchment boundary of a hydrological station, we regarded it as a dam-affected station. After this process, there were 193 dam-affected stations, named dataset A1. The remaining 9851 stations without dams were considered as dataset A2 (“no dams” group).
3. Methods
3.1. Trend Detection
The nonparametric Mann–Kendall test [32,33] was used for trend significance detection, which can exclude the interference of abnormal values and is also applicable to data with abnormal distribution or nonlinear trends. The null hypothesis of this test is that data are identically distributed and independent. At present, the Mann–Kendall test is widely used for trend examination, which can capture the overall trend of time series, including the detailed trend in recent years [9,27]. In this study, we detected spatial and temporal patterns of trends in eight RS and three large-scale environmental variables, that is, geopotential height, horizontal wind, and water vapor flux. In addition, we also examined the trends in TWSA measured by NASA’s GRACE mission globally. The significance of the trend is set as the 0.05 confidence level.
3.2. Field Significance Resampling Methods
We evaluated the significance levels for the proportion of the stations showing significant trends by applying a field significance resampling procedure [34,35,36]. The specific resampling details of the method are summarized as follows:
- Select a time series as the reference period for resampling, such as {1975, 1976, 1977, 1978, 1979, ..., 2009, 2010}, then randomly resample based on this reference to make the length of the new sequence unchanged and the order change. For example, {1980, 1996, 2003, 1975, 1986, ..., 2009, 1978}.
- The time series obtained through resampling in step (1) corresponds to the observation value of RS in the corresponding year one by one for all stations to get a new resampled dataset [37].
- Conduct the Mann–Kendall test for the time series obtained in step (2) at each station at the 0.05 significance level. Additionally, the percentages of stations with significant increase and decrease trends are calculated, respectively.
- Repeat steps (1) through (3) 2000 times to obtain a dataset that can reflect the percentage distribution of stations with significant trends.
- Calculate the 95th percentile in the dataset obtained in step (4), which represents the ratio of stations with significant trends. Additionally, the ratio of stations with significant trends in the reference observations is also calculated.
- Compare the 95th percentile with the observed percentage value, if the latter is larger, it indicates that the observed percentage value is not generated randomly but is significant. That is, the no-change null hypothesis is rejected while the observed ratio value is outside the 90% confidence interval of the resampling distribution.
4. Results
4.1. Spatial Patterns of Trends in Runoff Signatures
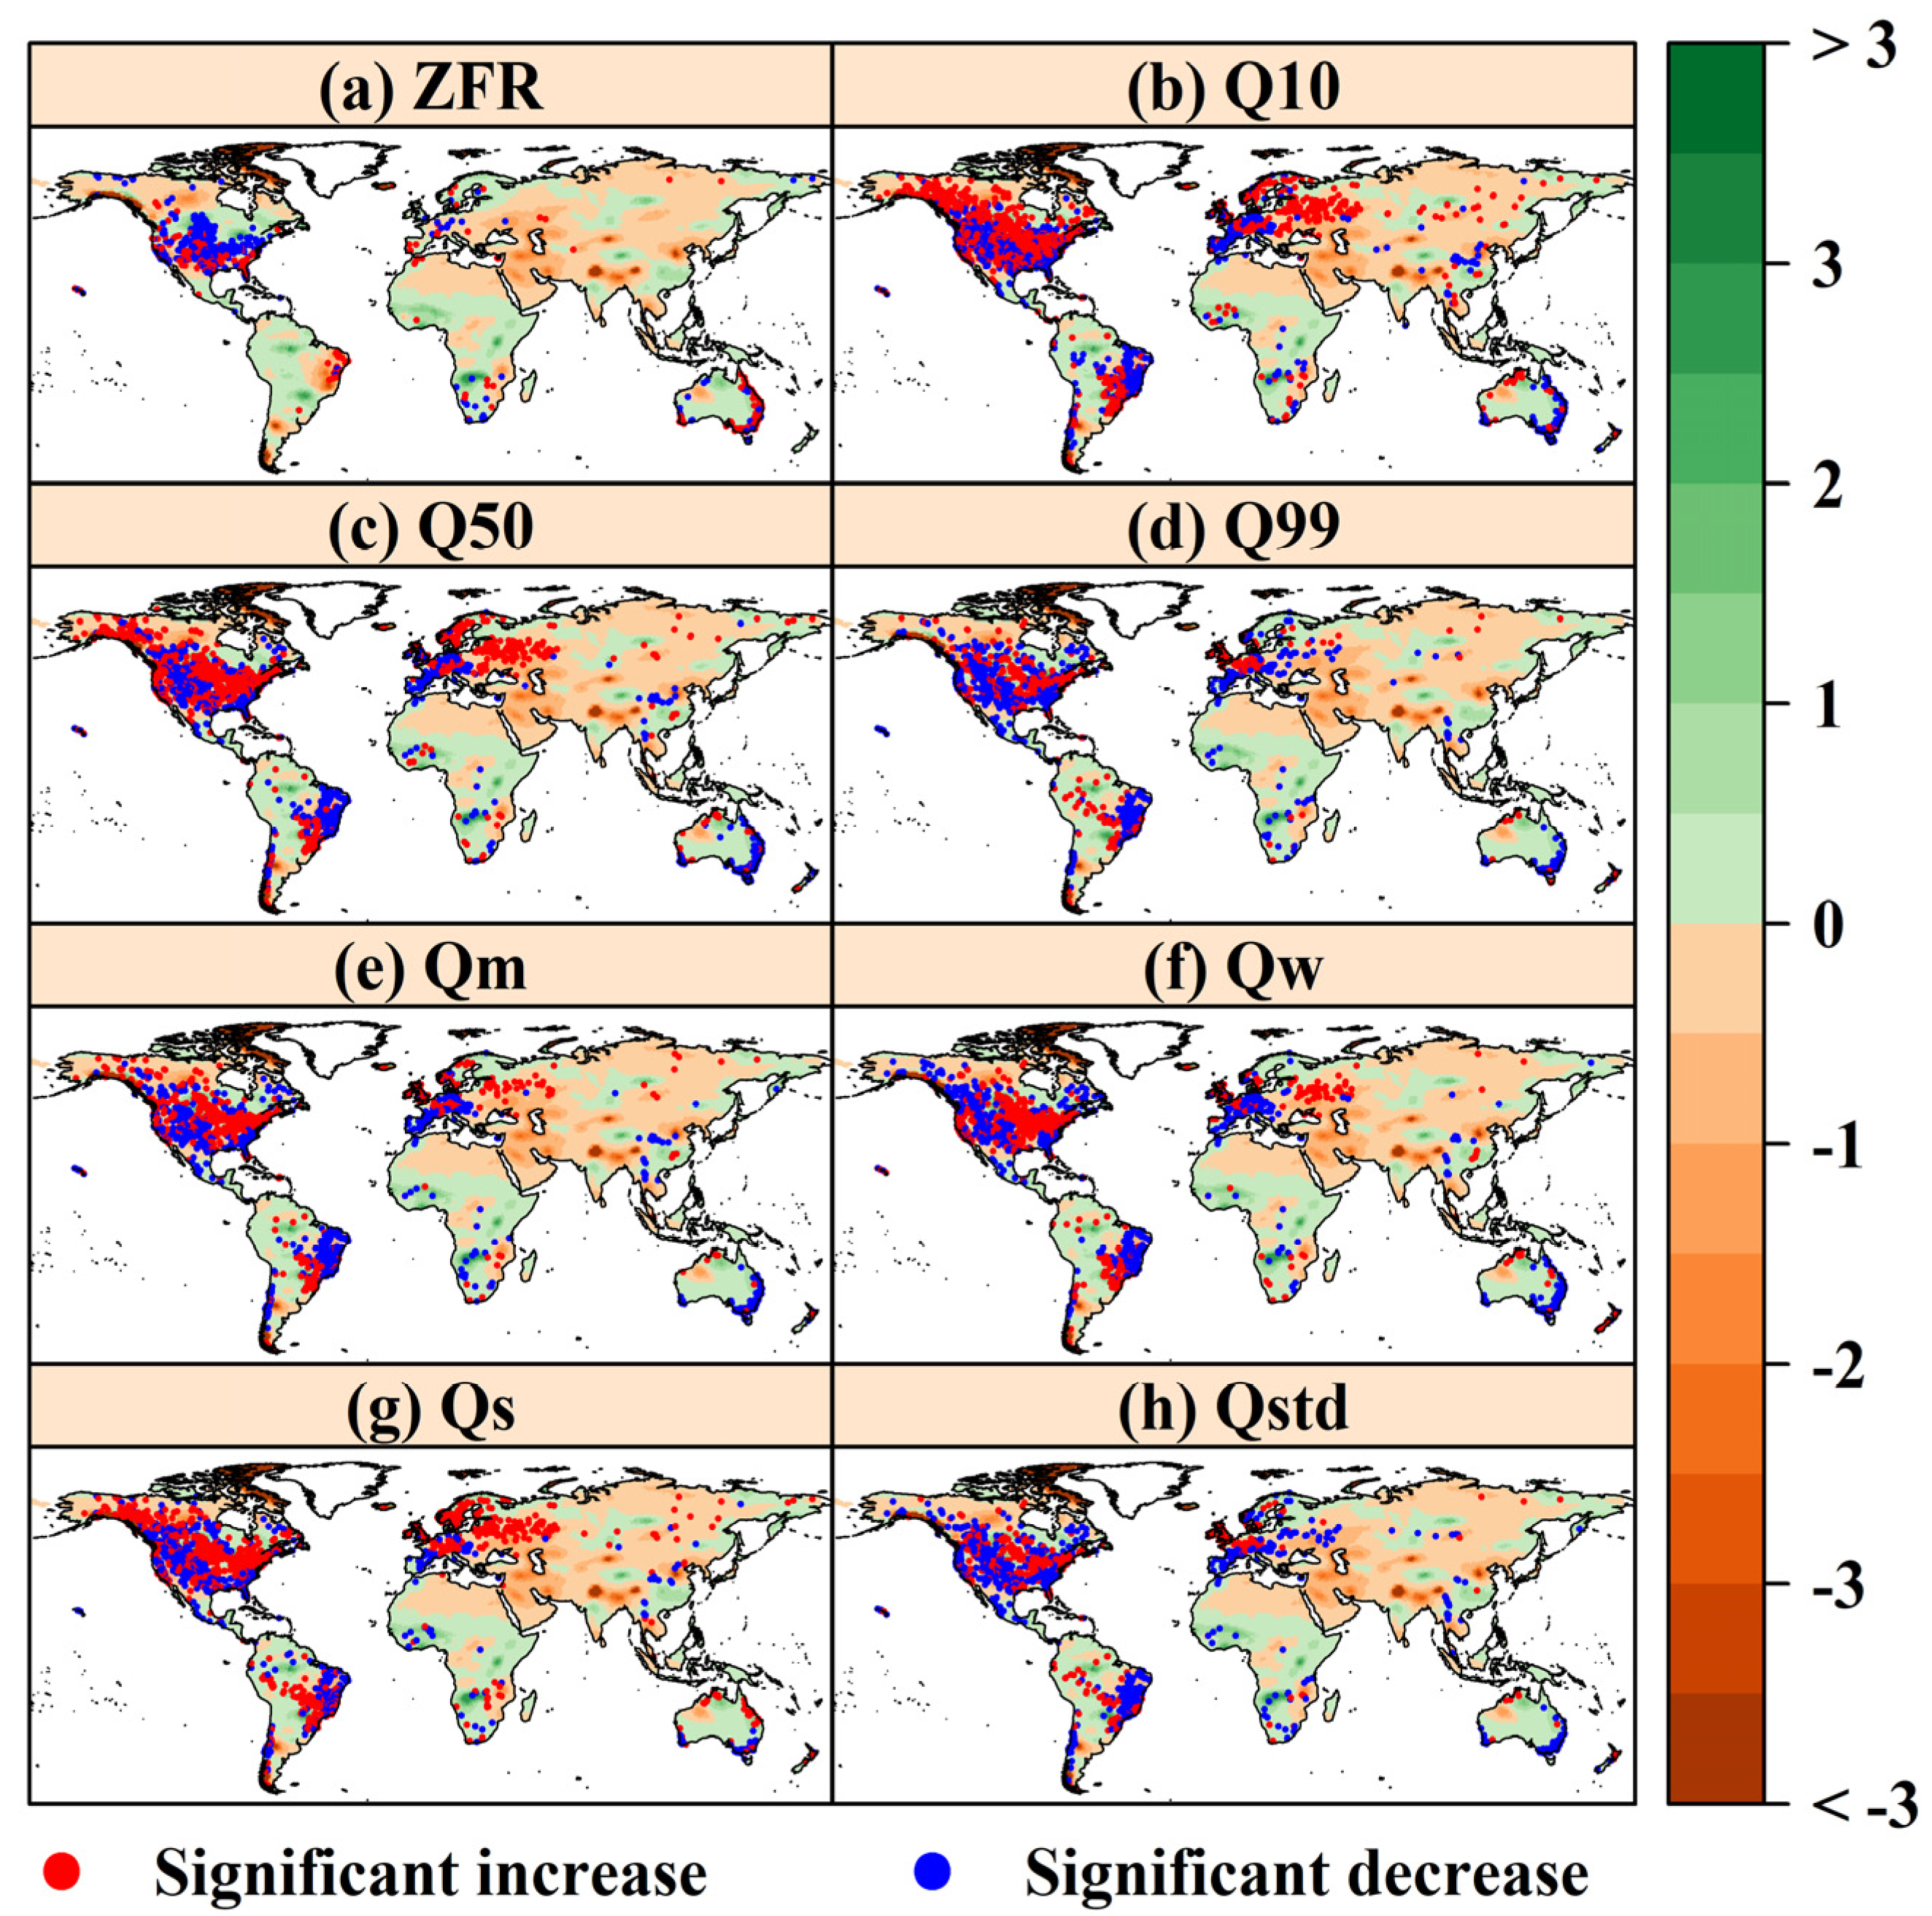
The RS trends were examined by using the Mann–Kendall test based on dataset A records during 1975–2017 at the 0.05 significance level. As shown in Figure 2, zero flow ratio (ZFR) has a significantly increasing trend (SIT) in southern North America, eastern South America, southern Europe, and eastern Oceania, while it has a significantly decreasing trend (SDT) in northern North America, central Europe, southern Africa, and northwestern Oceania. The low flow signatures, Q10 and Q50, roughly share consistent spatial patterns, with a SIT in most areas of northern North America, southeastern South America, central and northern Europe, and northern Asia, while a SDT in eastern South America, southwestern Europe, central East Asia, and eastern Oceania. Notable is the high flow signature, Q99. Its trend change direction is generally opposite to ZFR. Additionally, Q99 shows an SIT in eastern and central North America, Western Europe, and central South America while showing a SDT in southwest North America, southern Europe, eastern South America, and eastern Oceania. Interestingly, the spatial patterns of average RS, Qm, Qw, and Qs are roughly consistent, with SIT in northeastern North America, northern Europe, central and southern South America while with SDT in southwestern North America, eastern South America, southern Europe, and eastern Oceania. However, Qs is slightly different, and the stations showing a SIT in most of northern Europe and northern Oceania are denser and more abundant. The flow dynamic signature, Qstd has a SIT in northeastern North America, Western Europe, and central South America, while it has a SDT in southwestern North America, southern Europe, eastern South America, southern Africa, Southeast Asia, and southeastern Oceania.
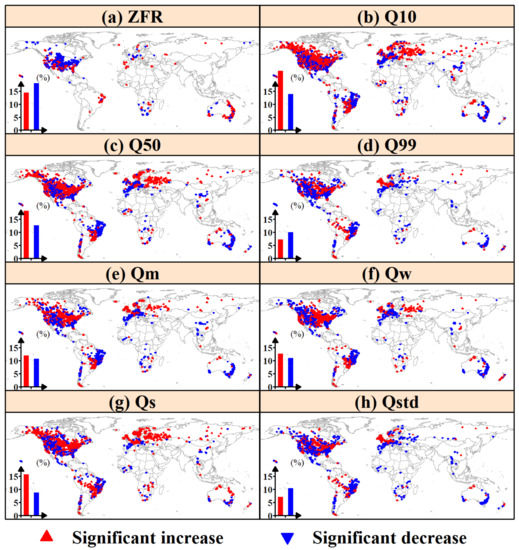
Figure 2.
Spatial patterns of trends in eight runoff signatures based on the Mann-Kendall test at the 0.05 significance level (1975–2017). The red (blue) triangle represents a significant increase (decrease). The bar chart shows the percentages of stations with significant trends.
Generally, the extreme flow signatures tend to decrease in more stations. Overall, there are 18.2% and 9.9% stations with ZFR and Q99 showing SDT, respectively, while 14.5% and 6.7% of stations showing a SIT. For low and average flow signatures, however, the number of stations with a SIT is distinctly larger than that showing a SDT. Overall, the percentages of stations with Q10, Q50, Qs showing a SIT reach 22.6%, 17.7%, 15.4%, while that showing a SDT is only 13.8%, 12.3%, 8.4%, respectively. As for average RS, Qm, and Qw, the number of stations showing a SIT is similar to that showing a SDT.
In summary: (1) the extreme RS, including ZFR and Q99, show a SDT in more stations globally, implying that the flood risk tends to decrease in more regions over the past decades; (2) in addition, more stations show a SDT for Qstd, i.e., the standard deviation of streamflow is reducing, implying that the interannual variability of streamflow tends to be more stable; (3) the change direction (positive and negative) of runoff signatures, Q10, Q50, Q99, Qm is usually consistent, which suggests that the runoff distribution tends to entirely upward in some regions, while downward in other regions. It is worth mentioning that the spatial pattern of trend in ZFR is usually contrary to that of other RS, since different to other RS, lower ZFR (zero flow ratio) represents larger runoff.
4.2. The Response of Runoff Signatures to Atmospheric Circulation
Investigation of atmospheric circulation change is an effective perspective to explain the causes and physical processes behind the RS trends [38]. Here, we explore the response of RS change to multiple atmospheric circulation indexes, including geopotential height, horizontal wind, and water vapor flux.
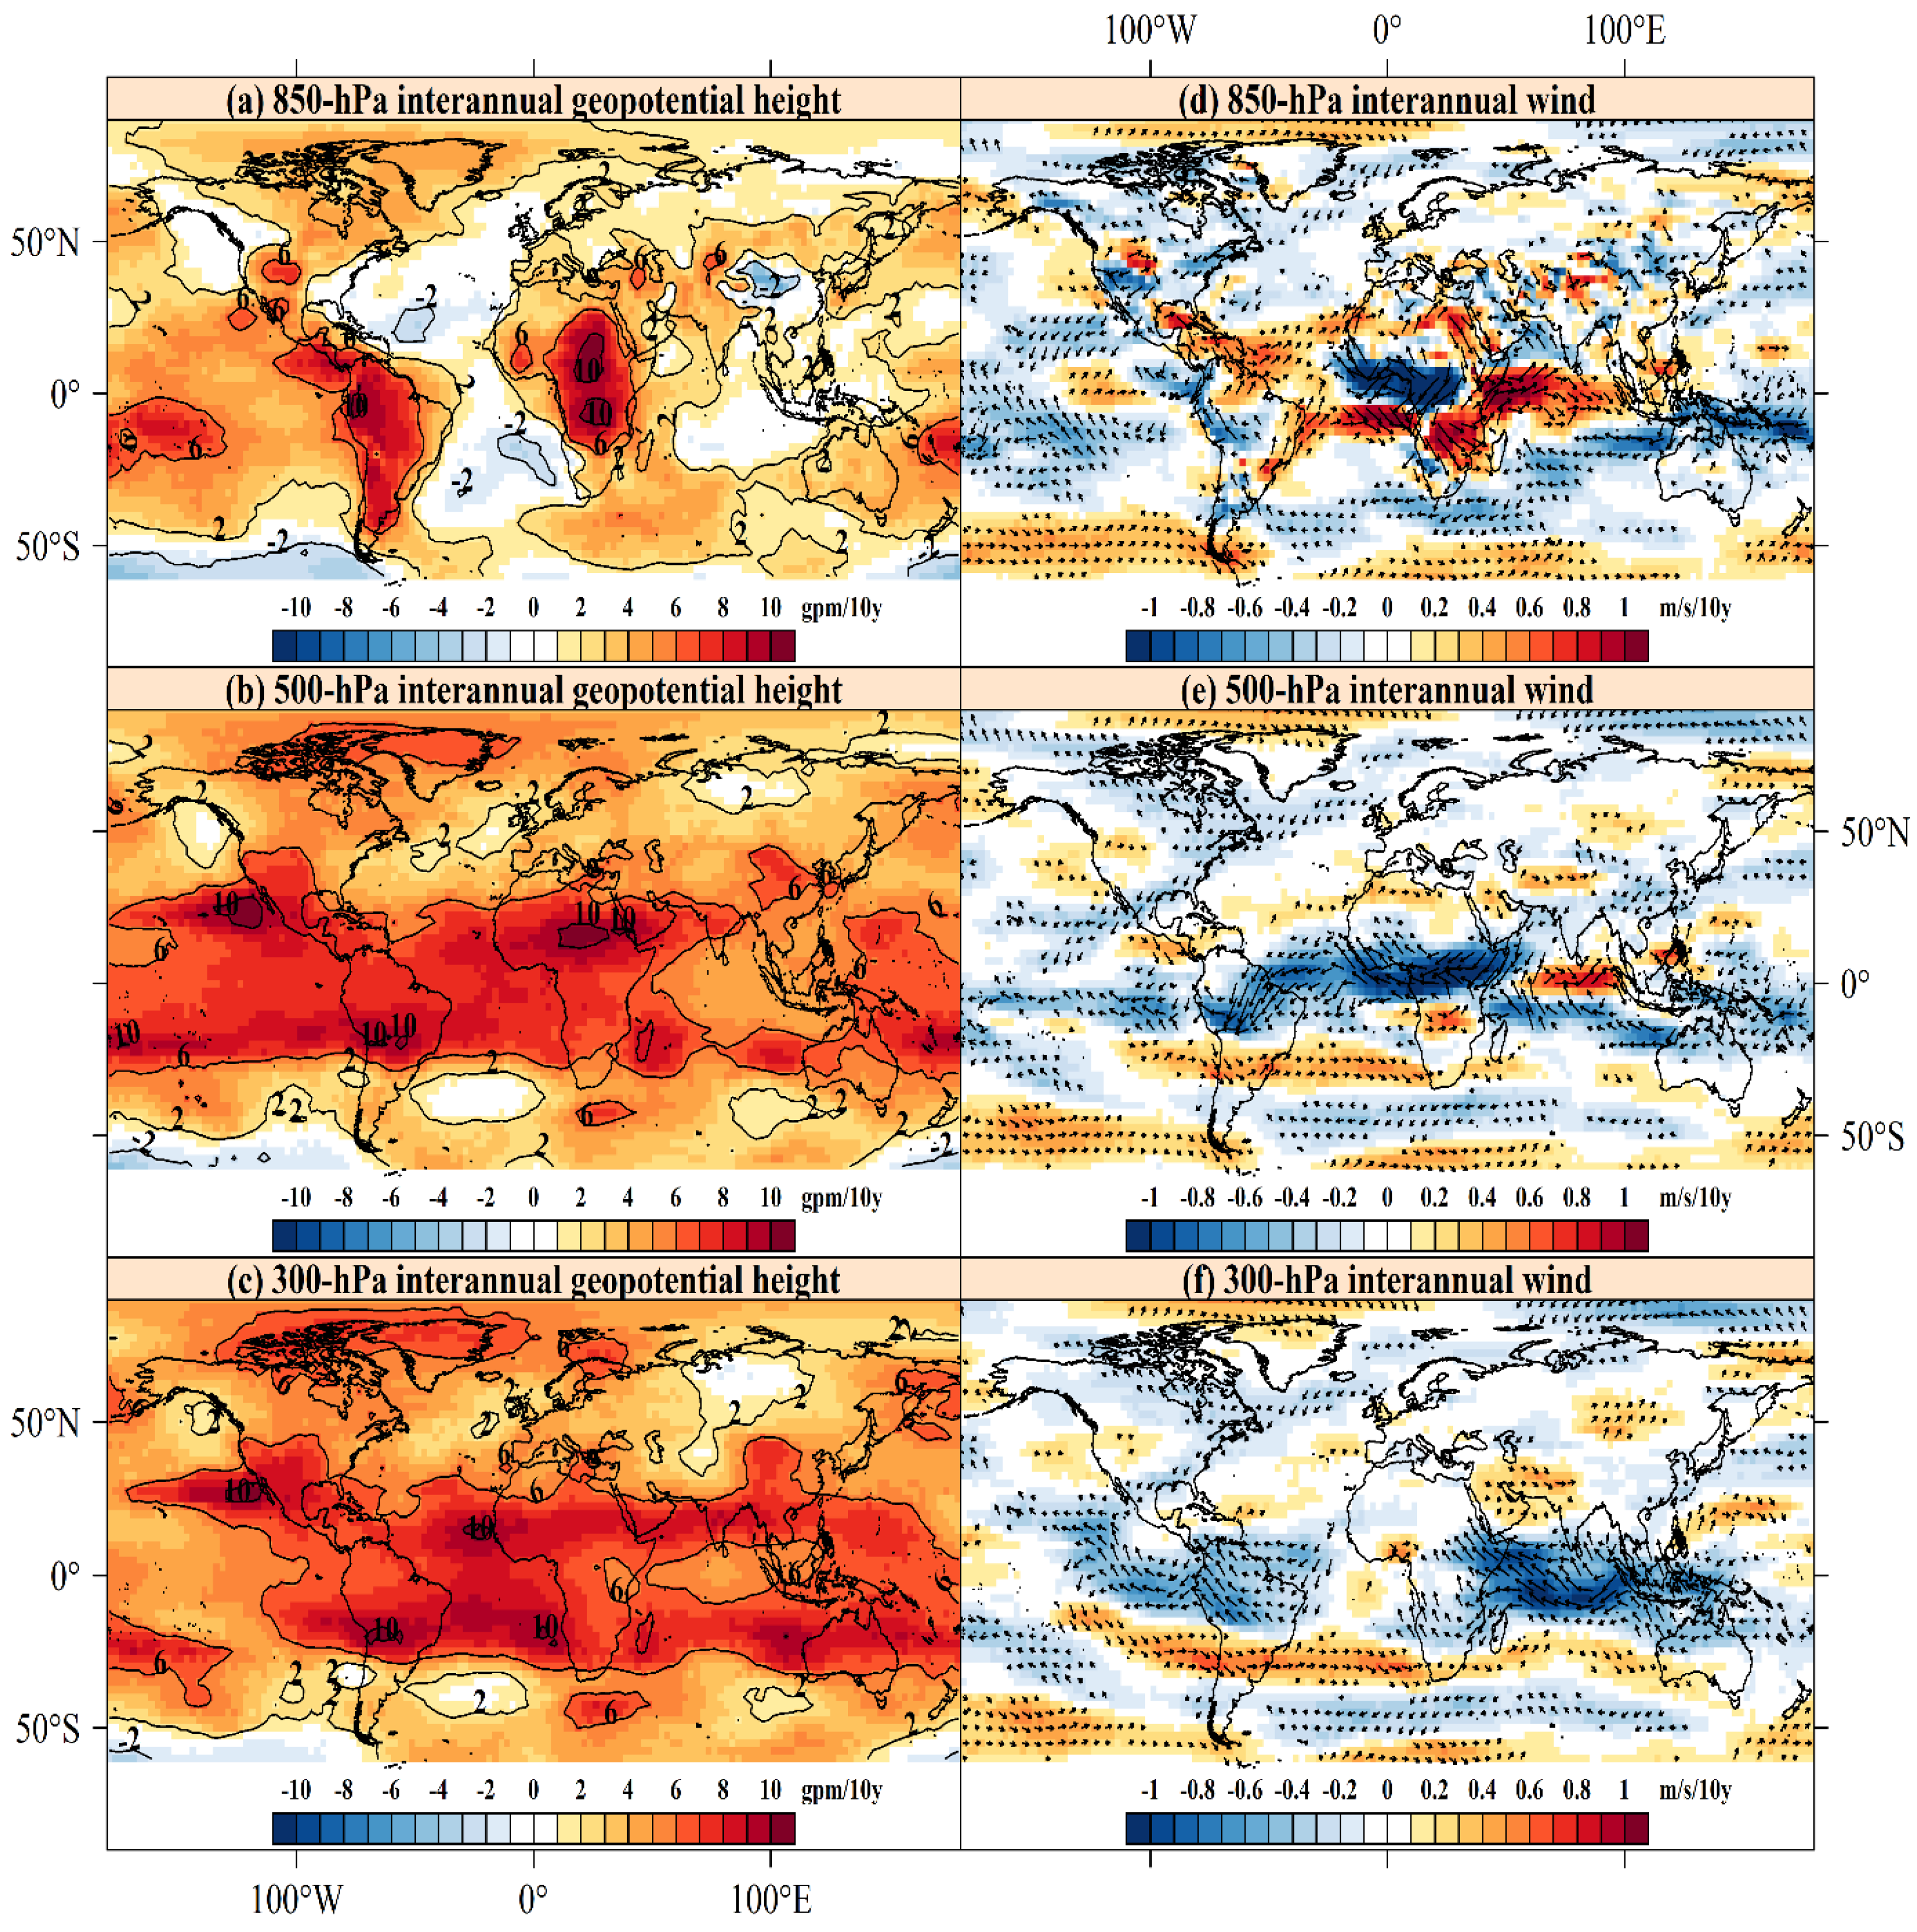
According to the different geopotential heights and horizontal wind in Figure 3, we can find that, in southwestern North America, the pressure has been increasing in recent years. Additionally, there is generation of a high-pressure center relative to the surrounding area and formation of an anticyclone at 850-hPa level with the strengthening of the prevailing downdraft. Meanwhile, due to the influence of the dry northeast trade winds from the inland, the water vapor flux is reducing, and then the precipitation is decreasing (Figure 4), thus resulting in the decreasing trend in most RS except for the ZFR. This is because a higher ZFR (zero flow ratio) means a smaller runoff, which is contrary to other RS. In contrast, in northern North America, where the prevailing westerlies are the main influence factor, it brings much warm water moisture from the northern Pacific. Compared with other regions, the increasing trend of air pressure is milder, and the vigorous updraft in the vertical structure promotes more water vapor convergence and condensation [39], which leads to the increasing trend in runoff in this region.
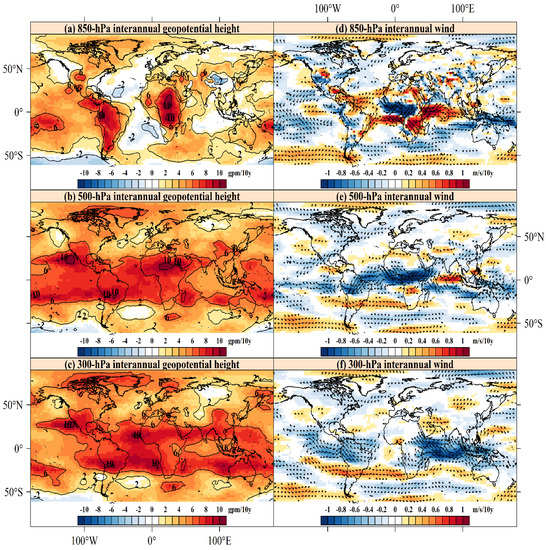
Figure 3.
Spatial patterns of annual trends in atmospheric circulation. Trends in (a–c) geopotential height and (d–f) horizontal wind at 850 (top), 500 (middle), 300 (bottom) hPa based on the Mann-Kendall test. The red (blue) shades indicate the positive (negative) trends at the 0.05 level. The arrow represents the direction of the horizontal wind and its length represents the magnitude of significance. Blank areas indicate that the trend is not significant.
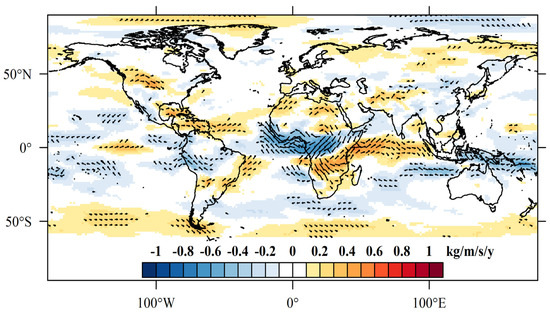
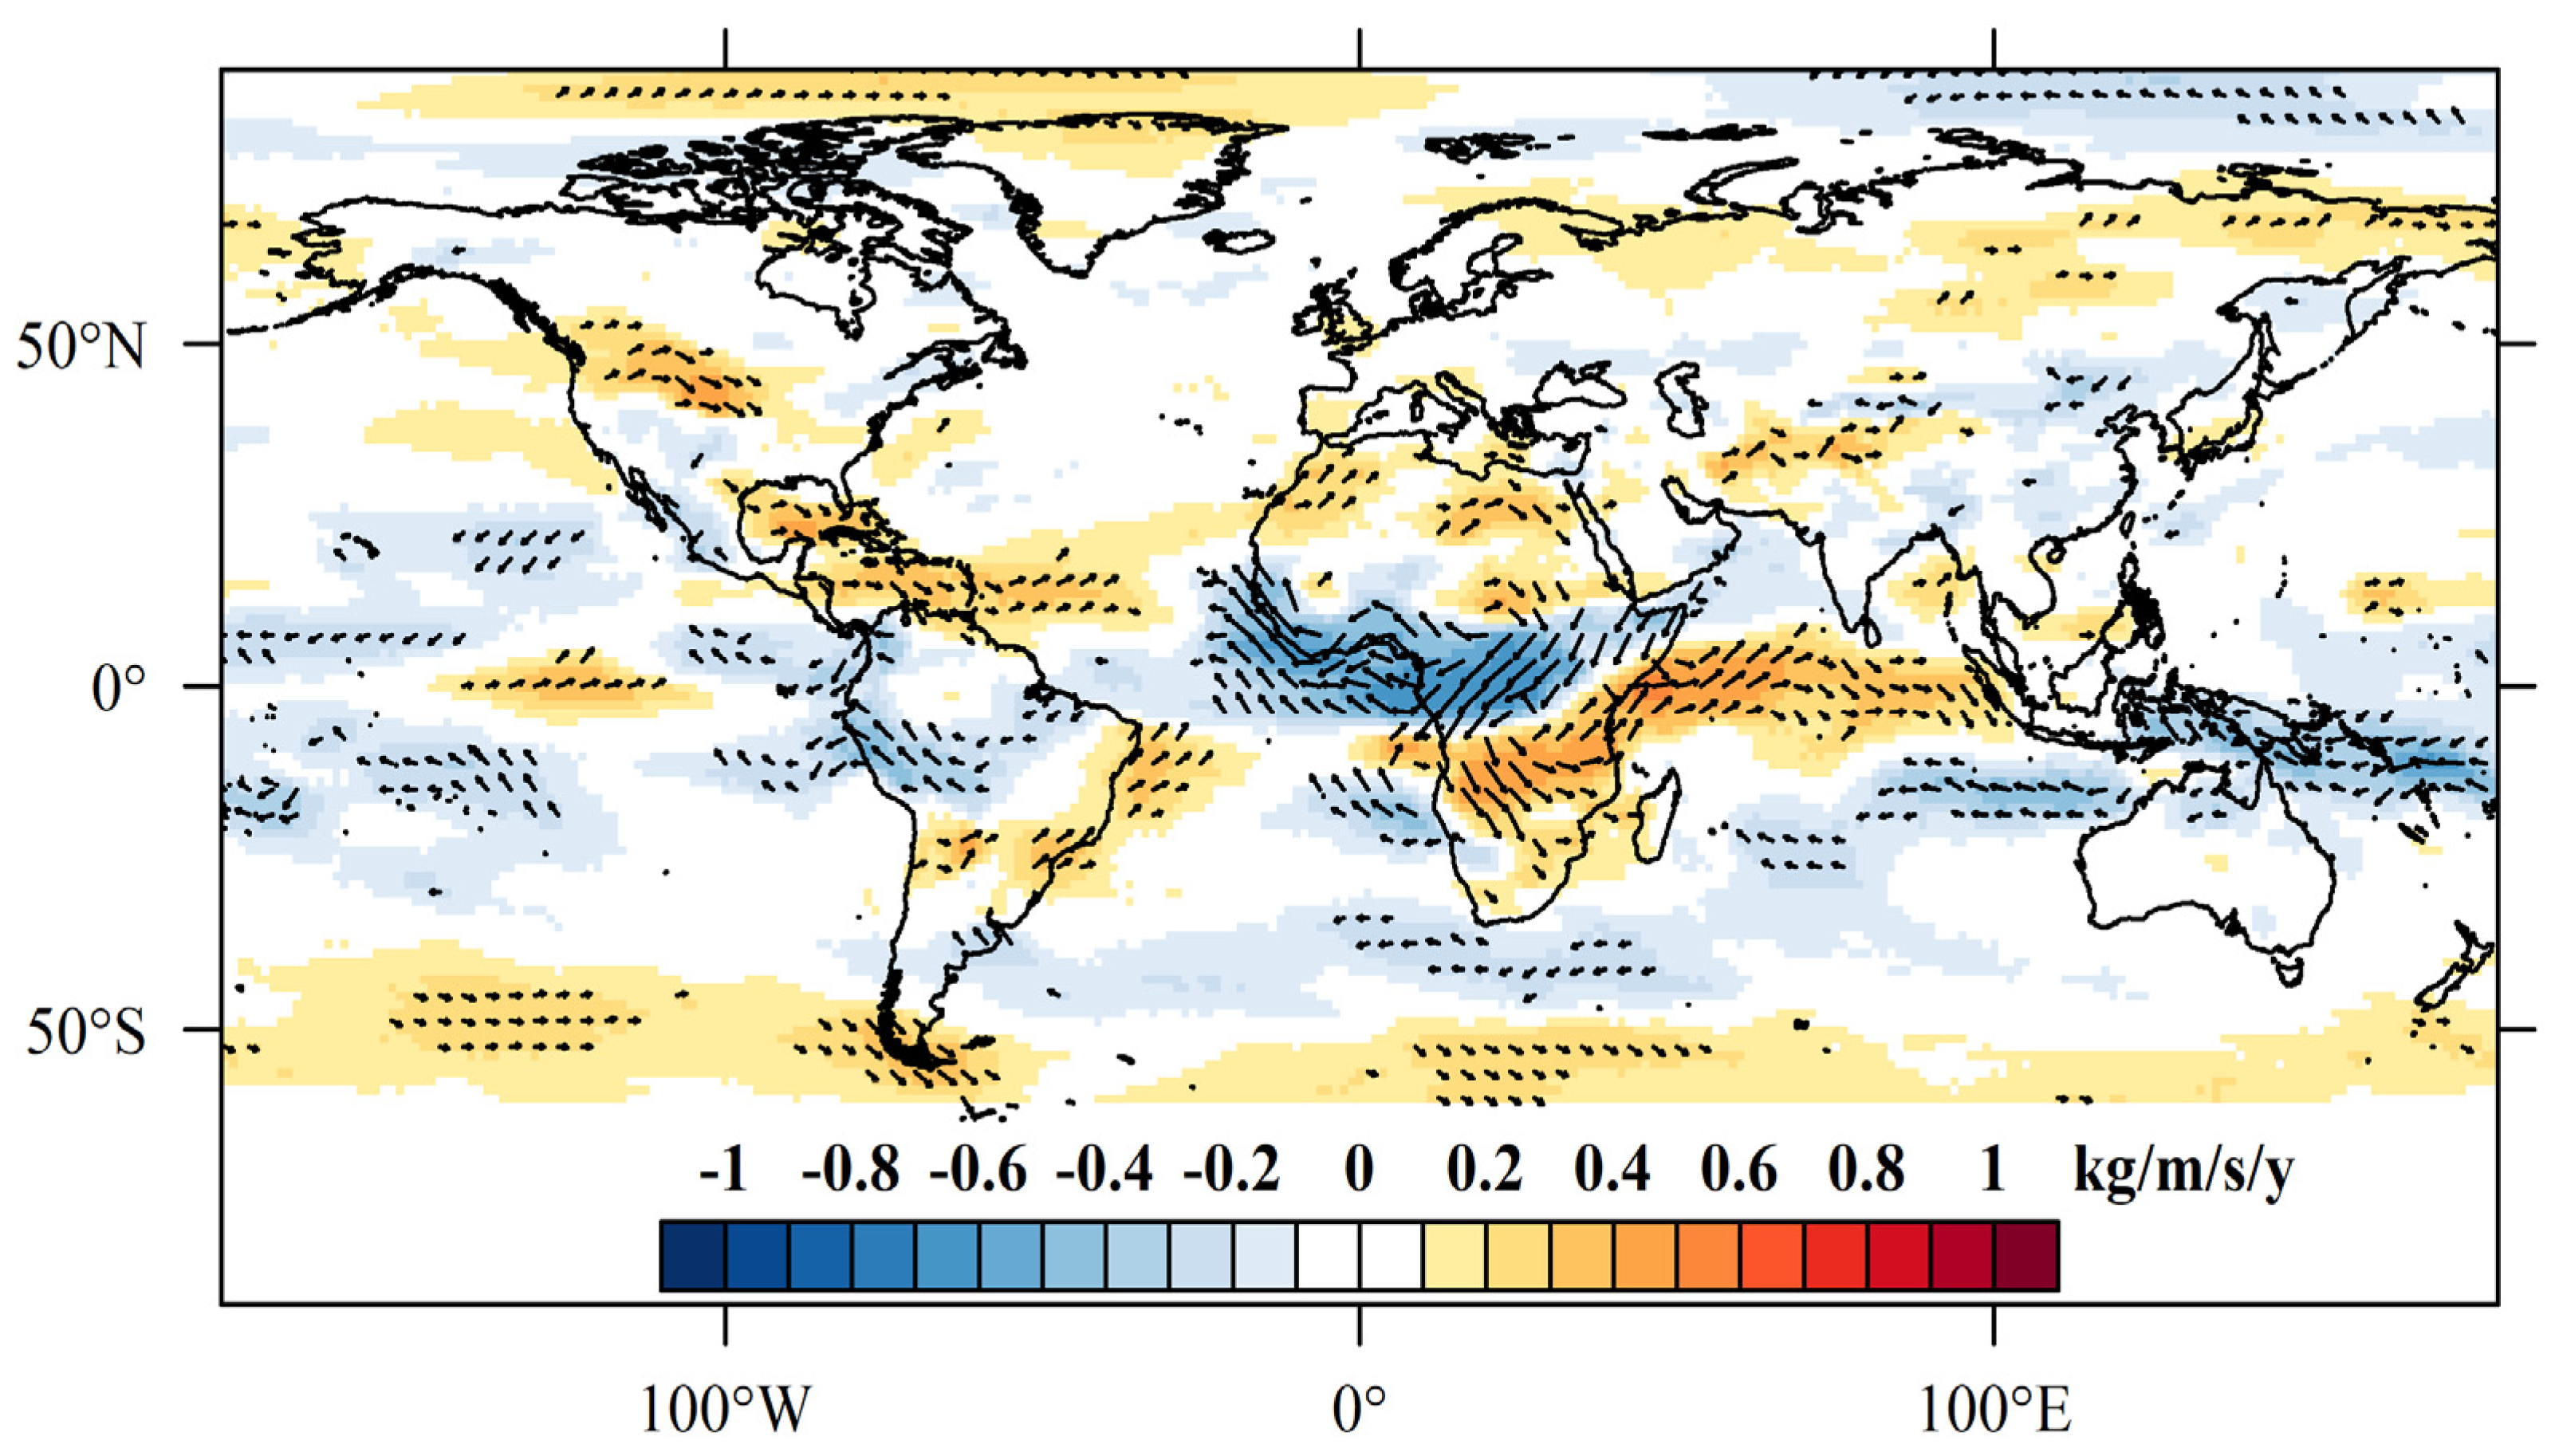
Figure 4.
Spatial patterns of annual trends of the water vapor flux during 1975–2017 based on the Mann-Kendall test. The red (blue) shades represent the degree of positive (negative) trends at the 0.05 level. The arrow represents the direction of the water vapor flux and its length represents the magnitude of significance. Blank areas indicate that the trend is not significant.
In eastern South America, it is mainly controlled by the intensive air pressure at different geopotential heights. Meanwhile, the air is becoming drier and sinks stronger. In addition, the dry west wind is enhanced from South America inland and brings more water vapor flux. However, wet northeasterly winds from the mid-Atlantic are weaker, and the corresponding water vapor flux is also decreasing. The increase of water vapor by the dry westerly wind is not enough to offset the decrease of water vapor by the wet northeast wind, which leads to the decrease of cloud formation and precipitation. As a result, decreasing runoff is observed in those regions. In central and southern South America, the trend change direction is just the opposite. As the region is mainly affected by the strengthening westerly wind from the southeast Pacific Ocean, which brings more warm and humid water vapor from the ocean. Thus, the precipitation is increasing, resulting in an increasing trend in the runoff.
In the whole European continent controlled by temperate climate (Temperate marine climate, Mediterranean climate), atmospheric circulation changes are relatively mild. Except for a slight increasing trend in air pressure, horizontal wind and water vapor flux changes are not particularly significant. However, we can still find out that the polar easterly winds at the 850 hPa level in northern Europe have a slightly enhanced trend, and the corresponding water vapor flux from the Arctic Ocean also shows an increasing trend as well as precipitation. Therefore, it causes an increasing flow in this region. In addition, we also find that the process of atmospheric circulation and the response of RS to it in some catchments of northern Asia is roughly the same as that of northern Europe.
In eastern Oceania, the air pressure at different geopotential heights shows an increasing trend, while the downdraft strengthens and the air becomes drier. At the same time, the humid southeast trade winds from the western Pacific are weakening along with the decrease of water vapor flux and precipitation, resulting in the decreasing trend in runoff in this region. In general, the consistent spatial and temporal patterns between atmospheric circulation variables and the change of RS are detected roughly, indicating that atmospheric circulation changes have a partial impact on the trend of RS [18].
4.3. The Response of Runoff Signatures to TWSA of GRACE Satellite
TWSA is a comprehensive reflection of regional precipitation, runoff, evapotranspiration, and groundwater, and it has already become an important parameter of global water cycle observation [29]. To explain the possible mechanisms of RS changes, we investigate the changing trend of RS from the perspective of the TWSA. We used the common coverage periods of GRACE-based TWSA and RS in the analysis, i.e., 1979–2017. In general, the spatial patterns of trend in TWSA are consistent with that in RS over most regions in North America and eastern South America from 1979 to 2017 (Figure 5 and Figure 6). Specifically, the same SIT between RS and TWSA is found in central and western North America, northern Europe, and central South America. Meanwhile, consistent SDT is observed in southern North America, eastern and southwestern South America. This consistent appearance of positive/negative trends in most RS and TWSA indicates that gradual changes in catchment humidity influenced by a combination of climate and anthropogenic factors are a prerequisite for local extreme runoff potential [16,29]. In the process of the water cycle, if we assume that all the specific conditions in the basin are constant, runoff is generated only from precipitation. However, runoff change is not only affected by the pattern, duration, and location of precipitation, but also by the antecedent soil moisture and hydraulic characteristics of the watershed [40]. Hence, when TWSA is a decreasing trend in the catchment, a certain amount of precipitation will preferentially replenish the reduced water in the soil. Additionally, runoff will show a decreasing trend due to the decrease in the water supply. When TWSA shows an increasing trend, it indicates that the soil moisture is becoming more and more saturated and the precipitation required gradually decreases. In addition, runoff will be an increasing trend due to increased water supply. We assume, of course, that the other variables remain unchanged. Therefore, this provides evidence for the reason why the trend direction of TWSA is consistent with that in RS.

Figure 5.
Spatial patterns of trends in eight runoff signatures, (a) ZFR, (b) Q10, (c) Q50, (d) Q99, (e) Qm, (f) Qw, (g) Qs, (h) Qstd based on the Mann–Kendall test at the 0.05 significance level, as well as trends in GRACE liquid water equivalent thickness in cm/year (1979–2017). The red circles indicate increasing trends, the blue represents decreasing trends. The green in the background shows an increasing trend in liquid water equivalent (basin water storage), and the orange shows a decreasing trend. The darker the color, the more obvious the changing trend.
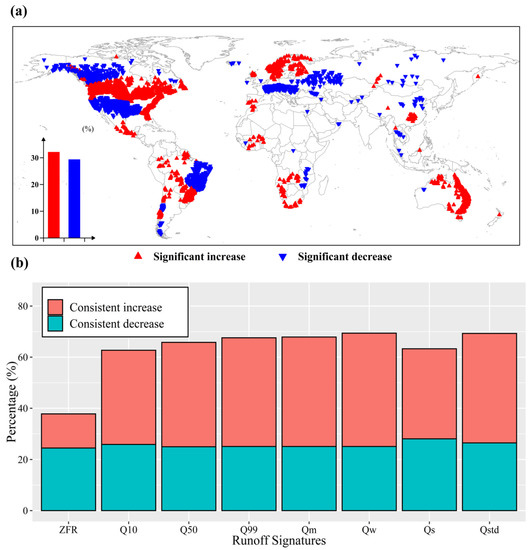
Figure 6.
(a) Spatial patterns of trends in TWSA based on the Mann–Kendall test at the 0.05 significance level (1979~2017). The red (blue) triangle represents a significant increase (decrease). The bar chart shows the percentages of stations showing significant trends. (b) The percentage of stations with consistent increase/decrease in TWSA and eight RS. Red (blue) indicates the proportion of stations with consistent increase (decrease) in TWSA and RS.
To compare the trends in RS and TWSA in the same spatial resolution, we extracted the TWSA for each catchment, and investigated the trends at the catchment scale (Figure 6). Generally, the RS changes are consistent with TWSA, with more 60% of stations showing consistent trends. It is worth mentioning that the percentage for ZFR is less than 40%. This is because larger ZFR represents less streamflow, which is contrary to other RS. Hence, the trends in all RS are consistent with TWSA in most stations, implying that the impacts of TWSA on streamflow indeed exist and are not random.
4.4. The Influences of Dams on Runoff Signatures
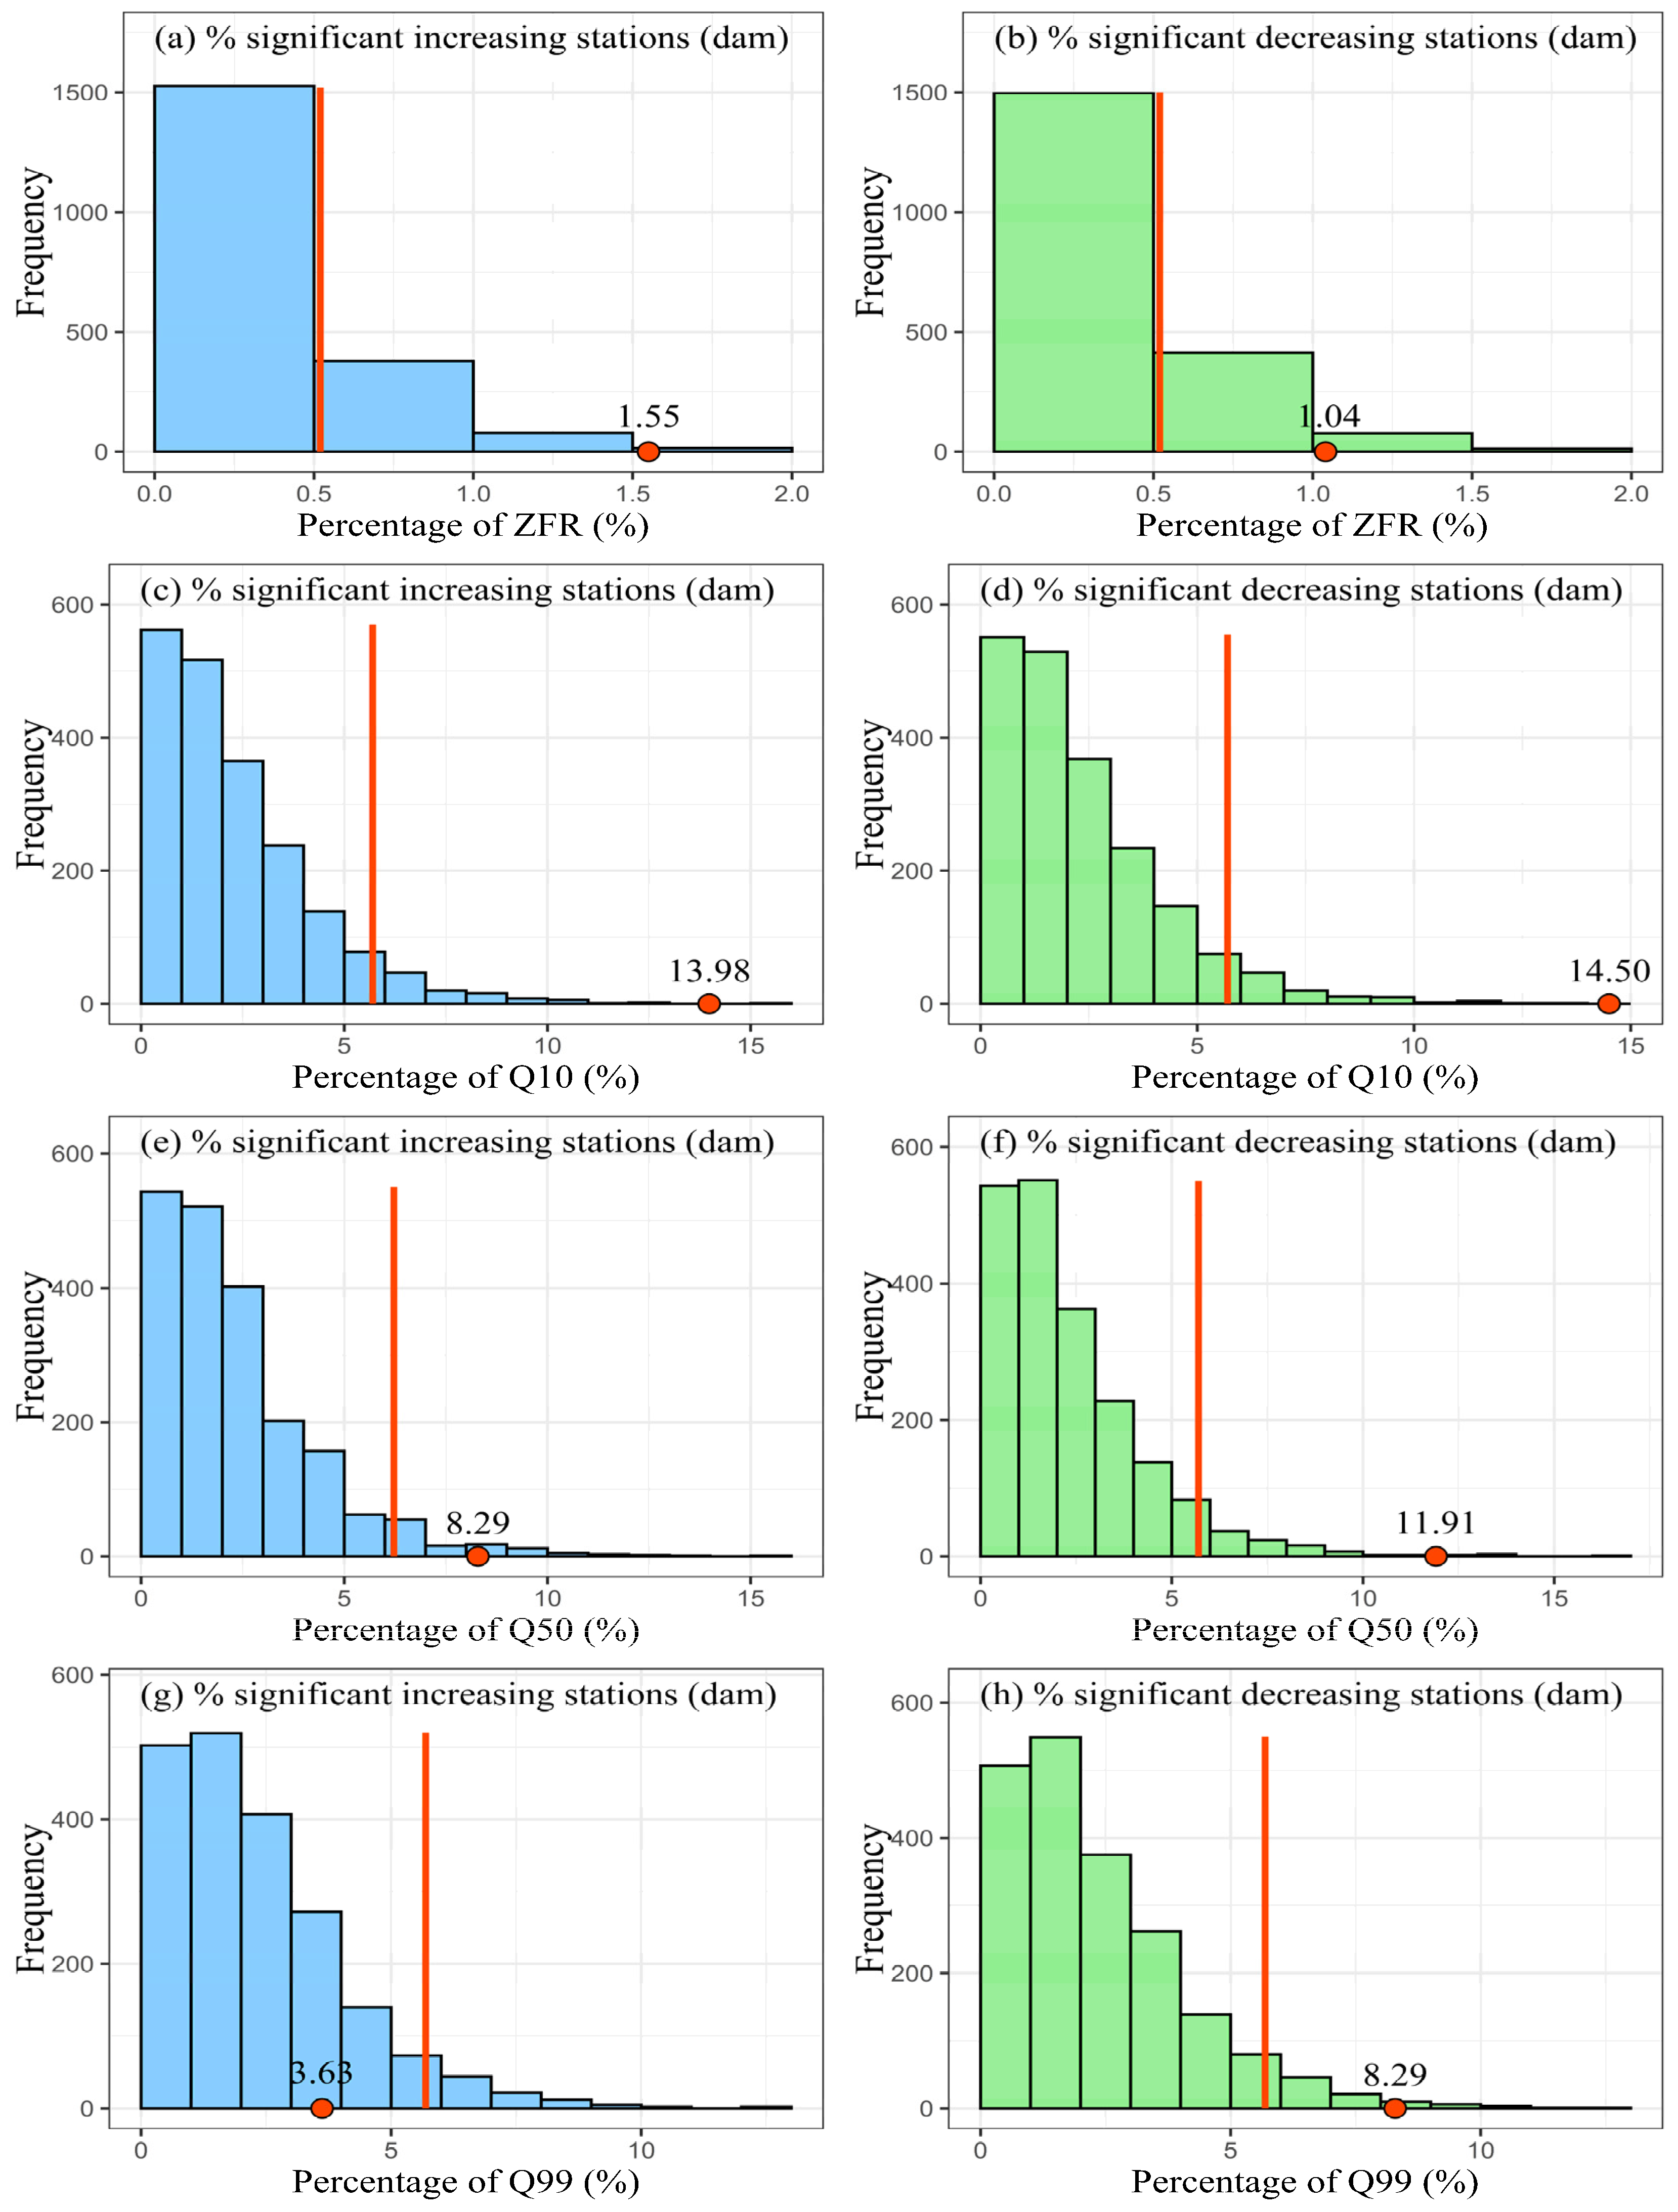
To evaluate the differential impact of dams on positive and negative trends of RS, we applied the Mann–Kendall test combined with resampling to investigate whether the proportion of stations showing an increasing/decreasing RS is significantly based on dataset A1 (dam-affected stations) [34]. The percentage distributions of dam-affected stations with significant trends are shown in Figure 7 and Figure 8. For low flow signatures, i.e., ZFR, Q10, and Q50, the percentage of stations with a SIT are close to that with a SDT. Specifically, the proportions of stations that show a SIT reach 1.55%, 13.98%, and 8.29%, while the percentages of stations with a SDT are 1.04%, 14.50%, and 11.91% for ZFR, Q10, and Q50, respectively. These low flow signatures show that the percentages of stations with a SIT/SDT are field significant and are inconsistent with the no-change null hypothesis. Additionally, this result indicates that the dams seem to have no material effect on the overall trend results of ZFR, Q10, and Q50.
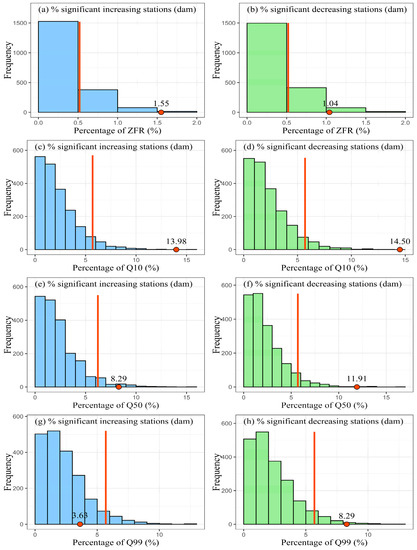
Figure 7.
The proportion of stations with significant trends for 193 stations in the “dam” dataset on the four runoff signatures, i.e., (a,b) ZFR, (c,d) Q10, (e,f) Q50, (g,h) Q99, based on the Mann–Kendall test. Left panels indicate the results for the proportion of stations showing a significantly increasing trend, while right panels represent results for the proportion of stations showing a significantly decreasing trend. The histogram represents the distribution of proportion obtained from the 2000 moving-blocks field significance resampling procedure. The red dot indicates the observation value while the red line indicates the 95th percentile.

Figure 8.
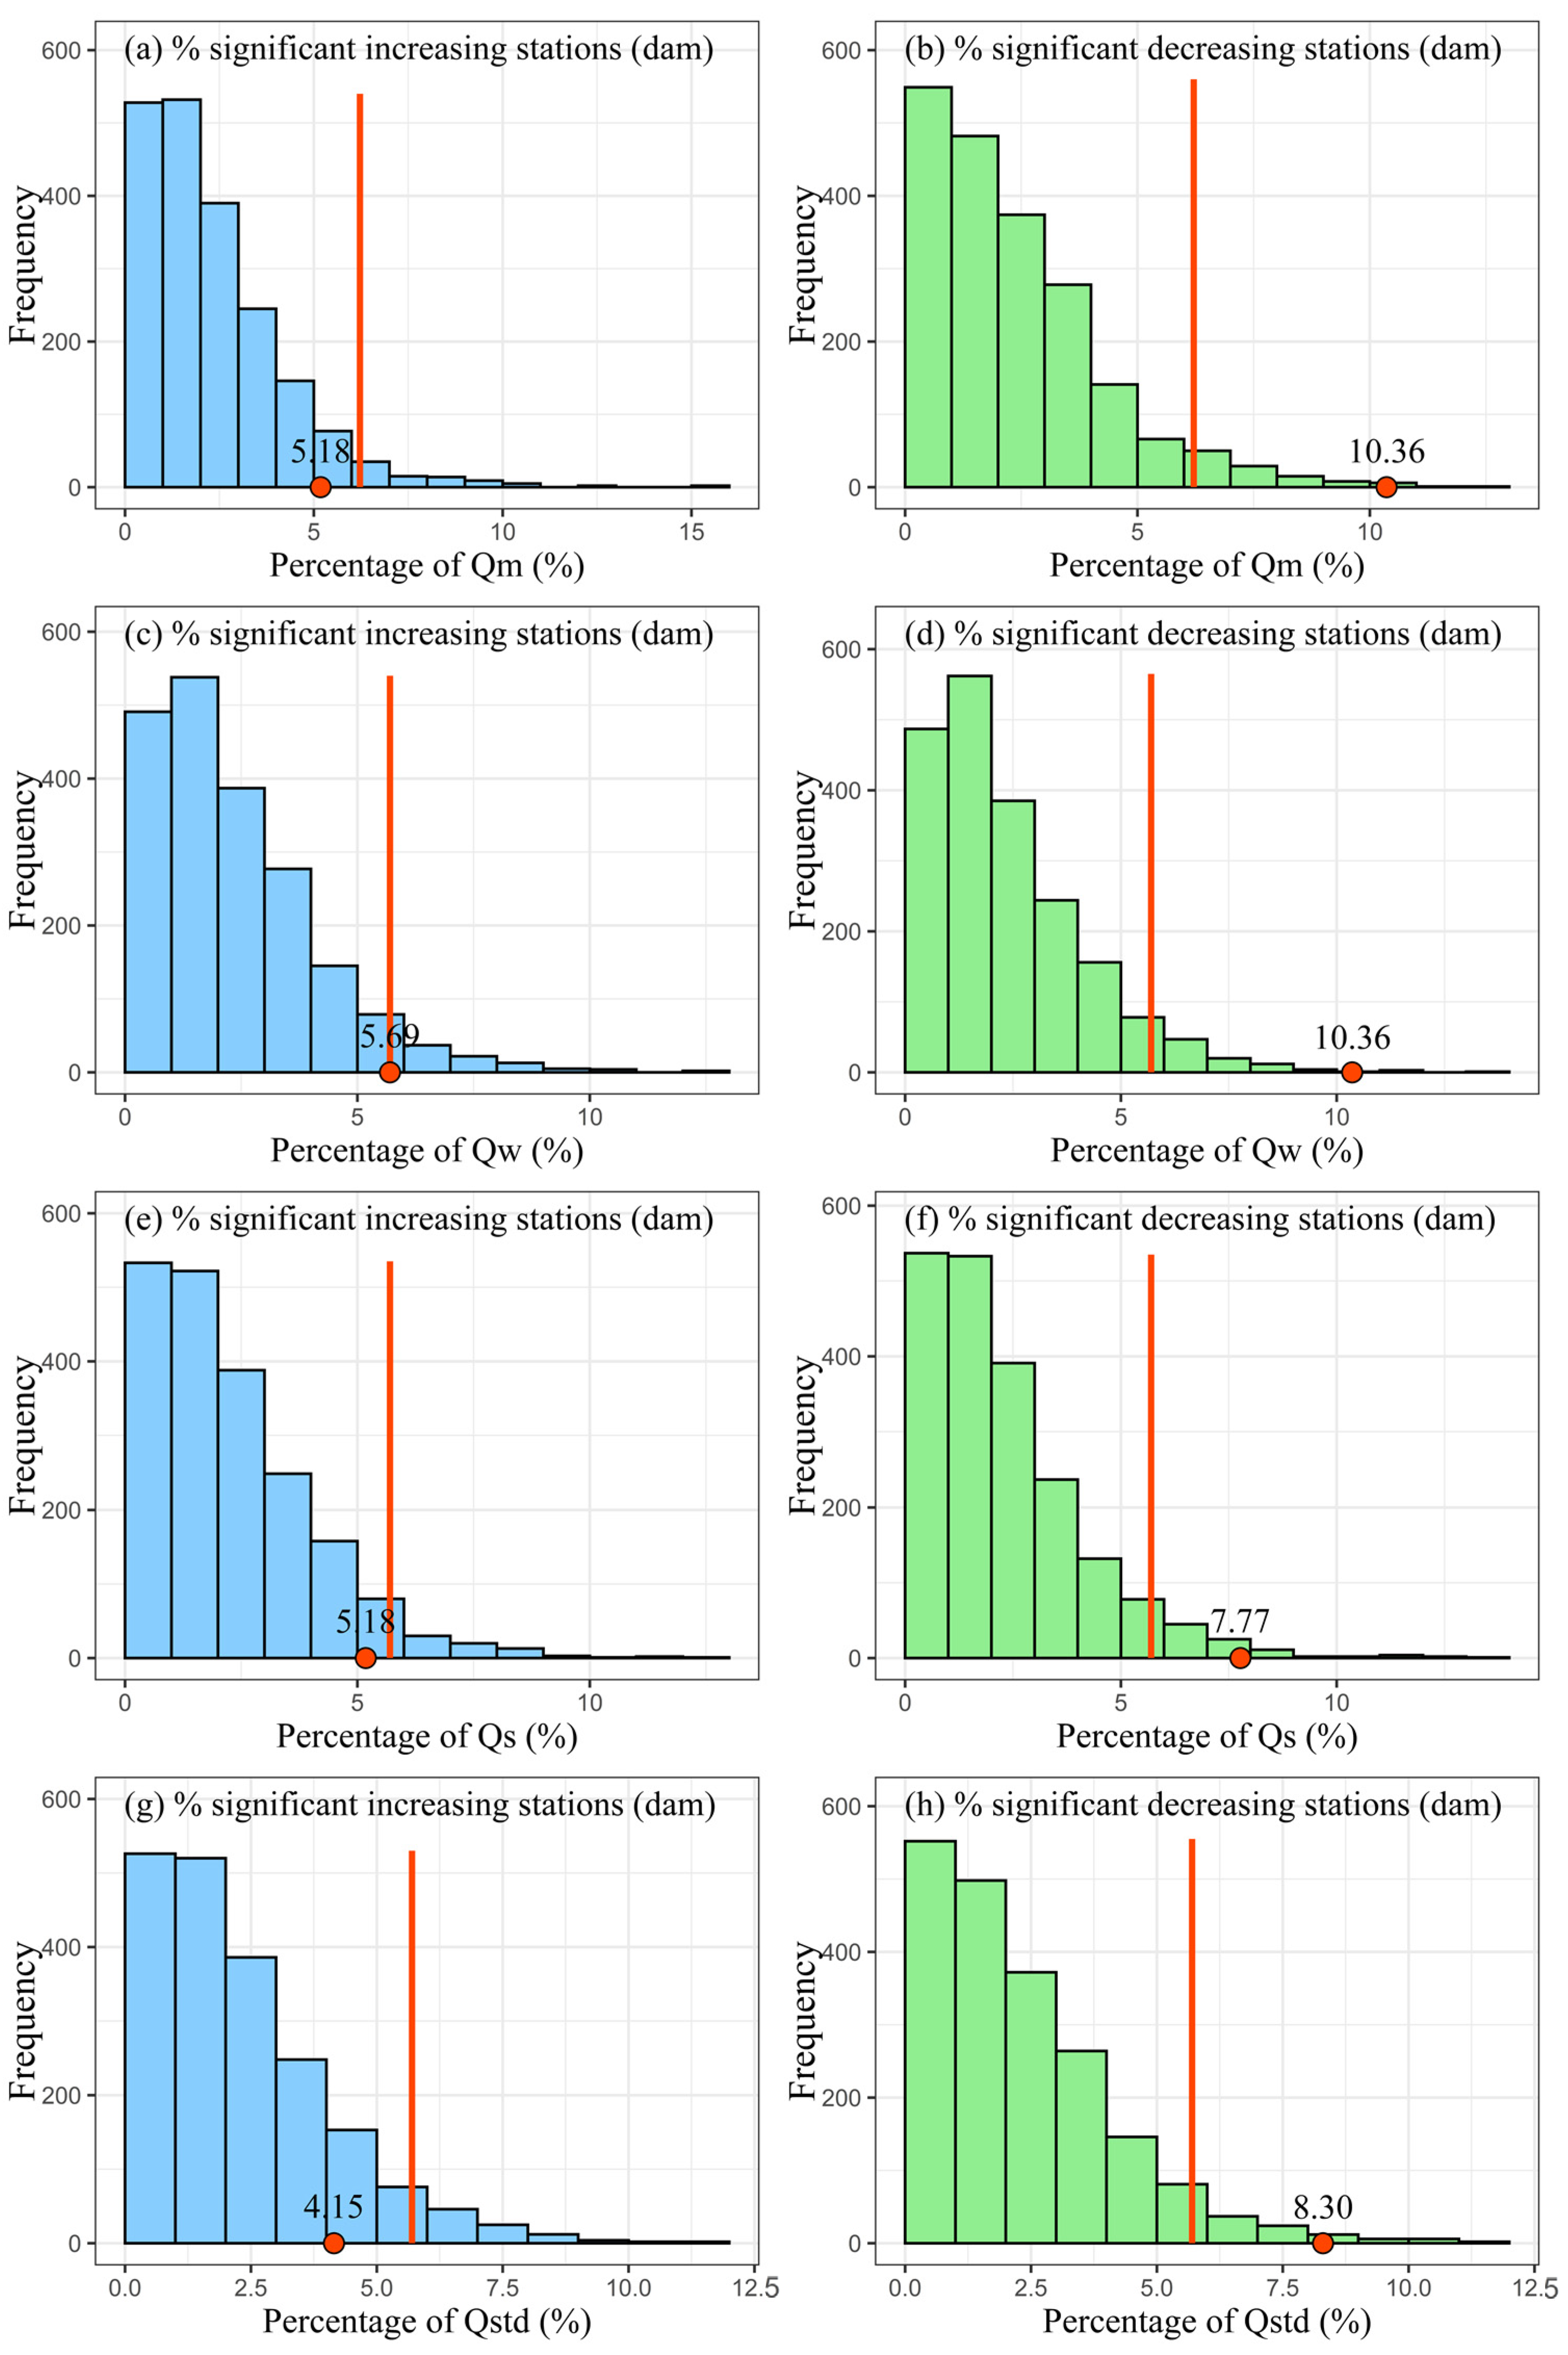
The same as Figure 7, but for the four runoff signatures, i.e., (a,b) Qm, (c,d) Qw, (e,f) Qs, (g,h) Qstd.
For high flow signature (Q99), the percentages of stations showing SDT are more than two times higher than that showing SIT. The proportion of stations with a SDT and SIT accounts for 8.29% and 3.63%, respectively. Similar results can be found in mean flow signatures (Qm and Qw) and flow dynamic signature (Qstd). Their percentages of stations showing a SDT are approximately twice as much as those showing a SIT. In particular, the percentages of stations showing a SDT reach 10.36%, 10.36%, and 8.30%, respectively, while the percentages of stations with a SIT are 5.18%, 5.69%, and 4.15%. Q99, Qm, Qw, and Qstd all show that the percentages of stations with a SIT are not the field significant and are consistent with the no-change null hypothesis, but the percentages of stations with a SDT are just the opposite. These results indicate that the increasing (decreasing) trend of Q99, Qm, Qw, and Qstd are (are not) caused by random changes, implying that dams have an important influence on reducing floods, mean runoff, and runoff variability.
5. Discussion
Although we collect global hydrological observation data as much as possible (Table 2), the conclusions in regions with fewer data are constrained (e.g., Asia) or muted (e.g., Africa). Consequently, the coverage of observations and the un-homogeneous of spatial distribution are still the limited factors of this study [2]. In fact, it is almost impossible to collect all hydrological stations across the globe with a regular distribution, particularly for some regions without rives and gauging stations. As shown in the new Figure 1, the regions without stations mainly distribute in the arid regions where no river and hydrological stations exist. At present, most studies on global hydrological change are still limited by uneven data distribution, such as Liu et al. [9], Do et al., [28], and Gudmundsson et al. [27]. Due to the diversity of instruments, collection and the limitations of documents, the GSIM dataset, with more than 30,000 stations, cannot guarantee its regular distribution across the world [41].
Over the past decades, the extreme RS in more stations shows a SDT globally, implying that both the flood and hydrological drought is more likely to decrease over the world. Generally, these results are consistent with previous regional research. For example, Hodgkins et al. [42] found that the flood in North America and Europe tends to decrease in more regions; Gudmundsson et al. [6] indicated that the runoff shows a decreasing trend in recent years in most regions of southern Europe. What is more, the change direction (positive and negative) of RS, Q10, Q50, Q99, Qm is usually consistent in the same station, implying that the runoff distribution tends to entirely upward in some regions, while downward in other regions, which agrees with the results of Gudmundsson et al. [27].
Atmospheric circulation has a significant impact on runoff variability, which has been widely verified in different regions, e.g., North America [43], Europe [44], and Australia [45]. Here, we assess the response of RS to atmospheric circulation on a global scale by focusing on precipitation as an intermediate variable. Additionally, our study finds that atmospheric circulation can explain the RS change in most regions. Nevertheless, atmospheric circulation is found to have a limited influence on RS changes in some regions due to the complexity of the hydrological process and its driving factors. The RS change driven by atmospheric circulation indicators such as geopotential height, horizontal wind, and water vapor flux is only a large-scale control factor [17]. However, except for the precipitation changes regulated by atmospheric circulation, the RS changes can be influenced by a series of other driving factors, such as soil moisture and groundwater (associated with TWSA) [46], and human activities (e.g., dams) [40]. Hence, we further investigate the response of RS to TWSA and dams to explore the possible mechanisms of global RS change.
GRACE is, to date, the first and only tool that is capable of global monitoring for TWSA. Besides, the Global Climate Observing System (GCOS) Steering Committee has been committed to treating TWSA as a new Essential Climate Variable (ECV) [30]. In consequence, it is reasonable and meaningful to explore the impacts of TWSA from GRACE on RS. Our results show that the trends in RS are generally consistent with that in TWSA over most regions in North America and eastern South America from 1979 to 2017, implying that the TWSA from the GRACE can largely explain spatial patterns of RS changes. These suggested that TWSA is an important factor affecting RS changes. On the one hand, larger TWSA always represents that more water storage (e.g., underground water and lake water) can recharge the river. On the other hand, the higher antecedent soil moisture accompanying larger TWSA favors a larger flooding and runoff. Additionally, previous studies suggested that the floods tend to decrease in the regions where TWSA and antecedent soil moisture showed decreasing trends [17,18]. Diffenbaugh et al. [47] found that California’s severe TWSA shortage led to the reduction of soil moisture and the worst drought (low RS) on the west coast of the United States in centuries. Louise et al. [29] indicated that the broad shifts of TWSA with the soil moisture decreasing that occurs at the land surface and subsurface (TWSA change) is an important driving factor of flooding (high RS). In the dry soil moisture condition, the increase of precipitation does not have to translate into the increase of streamflow, and the reduced soil moisture and groundwater will reduce RS [14].
In addition, we also investigated the impacts of dams on RS by using the stations with dams in their catchments. Our results show that the percentages of stations showing SDT are almost twice more than that showing SIT for Q99, Qm, Qw, and Qstd. This suggests that dams play an important role in reducing the peak and mean value of streamflow, as well as the streamflow variability. Nonetheless, we also find that dams have limited impacts on the low flow signatures, ZFR, Q10, Q50. From a hydrological point of view, large dams are expected to have an important impact on flood flows; as, in many situations, dams are designed to lessen the floods risks and disasters [48,49].
6. Conclusions
This study, for the first time, assesses the spatiotemporal patterns of RS changes and their possible mechanisms on a global scale based on 10044 stations. Compared with previous studies restricted to regional scale or using only the specific runoff index, our research not only breaks through the regional limitations and eliminates the disturbance of the uncertainty of the simulation data but also introduces a complete set of RS indicators that could reflect the runoff characteristics. Therefore, this investigation provides a comprehensive picture of temporal and spatial characteristics of global RS, with important implications in global water resource management and flood and drought disaster assessment.
The extreme RS, ZFR, and Q99 show a SDT in more stations globally over the past decades, implying that the flood and the drought tend to decrease in more regions. In addition, more stations show a SDT for Qstd, implying that the interannual variability of streamflow tends to be more stable. Generally, the change direction (positive and negative) of most runoff signatures is usually consistent. This indicates that the runoff distribution tends to be entirely upward in some regions, while downward in other regions (consistently drier or wetter).
Through the temporal and spatial variations of geopotential height, horizontal wind, and water vapor flux globally, we reveal the active mechanism of atmospheric circulation on the RS change. Although these atmospheric circulation indicators are only the large-scale controlling factors, the atmospheric circulation can roughly explain the RS change in many regions. Additionally, this suggests that the global atmospheric circulation variation has an important impact on regional RS changes.
The spatial patterns of trends in RS agree well with that in TWSA from GRACE satellites over most regions in North America and eastern South America from 1979 to 2017. This suggests that GRACE satellites productions have great potential in simulation and attribution of hydrological change. In addition, the dams have important impacts on the peak, mean, and variability of runoff. In the dam-impacts stations, our results show that the percentages of stations showing SDT are almost twice more than that showing SIT for Q99, Qm, Qw, and Qstd.
Author Contributions
Conceptualization, J.L., D.K. and X.G.; methodology, S.Y.; software, S.Y.; validation, S.Y.; formal analysis, S.Y.; investigation, S.Y.; resources, J.L.; data curation, J.L. and S.Y.; writing—original draft preparation, S.Y.; writing—review and editing, J.L., D.K. and X.G.; visualization, S.Y.; supervision, J.L.; project administration, J.L.; funding acquisition, J.L. All authors have read and agreed to the published version of the manuscript.
Funding
This research was funded by the National Natural Science Foundation of China (42001042), Fundamental Research Funds for the Central Universities, China University of Geosciences (Wuhan) (grants G1323521106), Visiting Researcher Fund Program of the State Key Laboratory of Water Resources and Hydropower Engineering Science (2020SWG02), Opening funding of the State Key Laboratory of Hydrology-Water Resources and Hydraulic Engineering, Nanjing Hydraulic Research Institute (U2020nkms01), Opening funding of the State Key Laboratory of Loess and Quaternary Geology, Institute of Earth Environment, CAS (SKLLQG2018), the Fundamental Research Funds for the Central Universities, China University of Geosciences (Wuhan) (CUG2106351), Ministry of Education (GTYR202003). We acknowledge the World Climate Research Programme’s Working Group on Coupled Modeling for CMIP6 simulations.
Institutional Review Board Statement
Not applicable.
Informed Consent Statement
Not applicable.
Data Availability Statement
The data is available from the website in Table 2.
Acknowledgments
We acknowledge Hylke E Beck and Yongqiang Zhang, who provided hydrological data and important suggestions.
Conflicts of Interest
The authors declare no conflict of interest.
References
- Westerberg, I.K.; McMillan, H.K. Uncertainty in hydrological signatures. Hydrol. Earth Syst. Sci. 2015, 19, 3951–3968. [Google Scholar] [CrossRef] [Green Version]
- Gudmundsson, L.; Boulange, J.; Do, H.X.; Gosling, S.N.; Grillakis, M.G.; Koutroulis, A.G.; Leonard, M.; Liu, J.G.; Schmied, H.M.; Papadimitriou, L.; et al. Globally observed trends in mean and extreme river flow attributed to climate change. Science 2021, 371, 1159–1162. [Google Scholar] [CrossRef]
- Zhang, Y.Q.; Chiew, F.H.S.; Li, M.; Post, D. Predicting Runoff Signatures Using Regression and Hydrological Modeling Approaches. Water Resour. Res. 2018, 54, 7859–7878. [Google Scholar] [CrossRef]
- Liu, J.Y.; Zhang, Q.; Singh, V.P.; Shi, P.J. Contribution of multiple climatic variables and human activities to streamflow changes across China. J. Hydrol. 2017, 545, 145–162. [Google Scholar] [CrossRef] [Green Version]
- Ahn, K.H.; Merwade, V. Quantifying the relative impact of climate and human activities on streamflow. J. Hydrol. 2014, 515, 257–266. [Google Scholar] [CrossRef]
- Gudmundsson, L.; Seneviratne, S.I.; Zhang, X.B. Anthropogenic climate change detected in European renewable freshwater resources. Nat. Clim. Chang. 2017, 7, 813–826. [Google Scholar] [CrossRef]
- Berghuijs, W.R.; Larsen, J.R.; van Emmerik, T.H.M.; Woods, R.A. A Global Assessment of Runoff Sensitivity to Changes in Precipitation, Potential Evaporation, and Other Factors. Water Resour. Res. 2017, 53, 8475–8486. [Google Scholar] [CrossRef] [Green Version]
- Berghuijs, W.R.; Woods, R.A. A simple framework to quantitatively describe monthly precipitation and temperature climatology. Int. J. Climatol. 2016, 36, 3161–3174. [Google Scholar] [CrossRef] [Green Version]
- Liu, J.Y.; Zhang, Q.; Feng, S.Y.; Gu, X.H.; Singh, V.P.; Sun, P. Global Attribution of Runoff Variance Across Multiple Timescales. J. Geophys. Res.-Atmos. 2019, 124, 13962–13974. [Google Scholar] [CrossRef]
- Marvel, K.; Cook, B.I.; Bonfils, C.J.W.; Durack, P.J.; Smerdon, J.E.; Williams, A.P. Twentieth-century hydroclimate changes consistent with human influence. Nature 2019, 569, 59–65. [Google Scholar] [CrossRef] [PubMed]
- Douville, H.; Ribes, A.; Decharme, B.; Alkama, R.; Sheffield, J. Anthropogenic influence on multidecadal changes in reconstructed global evapotranspiration. Nat. Clim. Chang. 2013, 3, 59–62. [Google Scholar] [CrossRef]
- Greve, P.; Gudmundsson, L.; Seneviratne, S.I. Regional scaling of annual mean precipitation and water availability with global temperature change. Earth Syst. Dynam. 2018, 9, 227–240. [Google Scholar] [CrossRef] [Green Version]
- Haddeland, I.; Heinke, J.; Biemans, H.; Eisner, S.; Florke, M.; Hanasaki, N.; Konzmann, M.; Ludwig, F.; Masaki, Y.; Schewe, J.; et al. Global water resources affected by human interventions and climate change. Proc. Natl. Acad. Sci. USA 2014, 111, 3251–3256. [Google Scholar] [CrossRef] [Green Version]
- Sharma, A.; Wasko, C.; Lettenmaier, D.P. If Precipitation Extremes Are Increasing, Why Aren’t Floods? Water Resour. Res. 2018, 54, 8545–8551. [Google Scholar] [CrossRef]
- Kusche, J.; Eicker, A.; Forootan, E.; Springer, A.; Longuevergne, L. Mapping probabilities of extreme continental water storage changes from space gravimetry. Geophys. Res. Lett. 2016, 43, 8026–8034. [Google Scholar] [CrossRef] [Green Version]
- Reager, J.T.; Thomas, B.F.; Famiglietti, J.S. River basin flood potential inferred using GRACE gravity observations at several months lead time. Nat. Geosci. 2014, 7, 589–593. [Google Scholar] [CrossRef]
- Liu, J.Y.; Zhang, Y.Q.; Yang, Y.T.; Gu, X.H.; Xiao, M.Z. Investigating Relationships Between Australian Flooding and Large-Scale Climate Indices and Possible Mechanism. J. Geophys. Res.-Atmos. 2018, 123, 8708–8723. [Google Scholar] [CrossRef]
- Liu, J.Y.; Zhang, Y.Q. Multi-temporal clustering of continental floods and associated atmospheric circulations. J. Hydrol. 2017, 555, 744–759. [Google Scholar] [CrossRef]
- Merz, B.; Aerts, J.; Arnbjerg-Nielsen, K.; Baldi, M.; Becker, A.; Bichet, A.; Bloschl, G.; Bouwer, L.M.; Brauer, A.; Cioffi, F.; et al. Floods and climate: Emerging perspectives for flood risk assessment and management. Nat. Hazards Earth Syst. Sci. 2014, 14, 1921–1942. [Google Scholar] [CrossRef] [Green Version]
- Jain, S.; Lall, U. Floods in a changing climate: Does the past represent the future? Water Resour. Res. 2001, 37, 3193–3205. [Google Scholar] [CrossRef]
- Ward, P.J.; Beets, W.; Bouwer, L.M.; Aerts, J.; Renssen, H. Sensitivity of river discharge to ENSO. Geophys. Res. Lett. 2010, 37, 6. [Google Scholar] [CrossRef] [Green Version]
- Yun, X.B.; Tang, Q.H.; Wang, J.; Liu, X.C.; Zhang, Y.Q.; Lu, H.; Wang, Y.L.; Zhang, L.; Chen, D.L. Impacts of climate change and reservoir operation on streamflow and flood characteristics in the Lancang-Mekong River Basin. J. Hydrol. 2020, 590, 11. [Google Scholar] [CrossRef]
- Zhang, Y.; Viney, N.; Frost, A.; Oke, A.; Brooks, M.; Chen, Y.; Campbell, N. Collation of Australian Modeller’s Streamflow Dataset for 780 Unregulated Australian Catchments; CSIRO: Canberra, Australia, 2013.
- Alvarez-Garreton, C.; Mendoza, P.A.; Boisier, J.P.; Addor, N.; Galleguillos, M.; Zambrano-Bigiarini, M.; Lara, A.; Puelma, C.; Cortes, G.; Garreaud, R.; et al. The CAMELS-CL dataset: Catchment attributes and meteorology for large sample studies-Chile dataset. Hydrol. Earth Syst. Sci. 2018, 22, 5817–5846. [Google Scholar] [CrossRef] [Green Version]
- Falcone, J.A.; Carlisle, D.M.; Meador, W. GAGES (Geospatial Attributes of Gages for Evaluating Streamflow): A stream gage database for evaluating natural and altered flow conditions in the conterminous United States. Ecology 2010, 91, 621. [Google Scholar] [CrossRef]
- Gudmundsson, L.; Greve, P.; Seneviratne, S.I. The sensitivity of water availability to changes in the aridity index and other factors-A probabilistic analysis in the Budyko space. Geophys. Res. Lett. 2016, 43, 6985–6994. [Google Scholar] [CrossRef] [Green Version]
- Gudmundsson, L.; Leonard, M.; Do, H.X.; Westra, S.; Seneviratne, S.I. Observed Trends in Global Indicators of Mean and Extreme Streamflow. Geophys. Res. Lett. 2019, 46, 756–766. [Google Scholar] [CrossRef] [Green Version]
- Do, H.X.; Westra, S.; Leonard, M. A global-scale investigation of trends in annual maximum streamflow. J. Hydrol. 2017, 552, 28–43. [Google Scholar] [CrossRef]
- Slater, L.J.; Villarini, G. Recent trends in US flood risk. Geophys. Res. Lett. 2016, 43, 12428–12436. [Google Scholar] [CrossRef] [Green Version]
- Li, F.P.; Kusche, J.; Chao, N.F.; Wang, Z.T.; Locher, A. Long-Term (1979–Present) Total Water Storage Anomalies Over the Global Land Derived by Reconstructing GRACE Data. Geophys. Res. Lett. 2021, 48, e2021GL093492. [Google Scholar] [CrossRef]
- Kobayashi, S.; Ota, Y.; Harada, Y.; Ebita, A.; Moriya, M.; Onoda, H.; Onogi, K.; Kamahori, H.; Kobayashi, C.; Endo, H.; et al. The JRA-55 Reanalysis: General Specifications and Basic Characteristics. J. Meteorol. Soc. Jpn. 2015, 93, 5–48. [Google Scholar] [CrossRef] [Green Version]
- Mann, H.B. Nonparametric test against trend. Econometrica 1945, 13, 245–259. [Google Scholar] [CrossRef]
- Kendall, M.G. Rank Correlation Measures, 4th ed.; Charles Griffin: London, UK, 1975; p. 272. [Google Scholar]
- Wilks, D.S. Statistical Methods in the Atmospheric Sciences; Academic Press: Cambridge, MA, USA, 2011; Volume 100. [Google Scholar]
- Ishak, E.H.; Rahman, A.; Westra, S.; Sharma, A.; Kuczera, G. Evaluating the non-stationarity of Australian annual maximum flood. J. Hydrol. 2013, 494, 134–145. [Google Scholar] [CrossRef]
- Westra, S.; Alexander, L.V.; Zwiers, F.W. Global Increasing Trends in Annual Maximum Daily Precipitation. J. Clim. 2013, 26, 3904–3918. [Google Scholar] [CrossRef] [Green Version]
- Patton, A.; Politis, D.N.; White, H. Correction to “Automatic Block-Length Selection for the Dependent Bootstrap” by D. Politis and H. White. Econom. Rev. 2009, 28, 372–375. [Google Scholar] [CrossRef]
- King, A.D.; Alexander, L.V.; Donat, M.G. Asymmetry in the response of eastern Australia extreme rainfall to low-frequency Pacific variability. Geophys. Res. Lett. 2013, 40, 2271–2277. [Google Scholar] [CrossRef]
- Najibi, N.; Devineni, N.; Lu, M.Q.; Perdigao, R.A.P. Coupled flow accumulation and atmospheric blocking govern flood duration. npj Clim. Atmos. Sci. 2019, 2, 13. [Google Scholar] [CrossRef]
- Johnson, F.; White, C.J.; van Dijk, A.; Ekstrom, M.; Evans, J.P.; Jakob, D.; Kiem, A.S.; Leonard, M.; Rouillard, A.; Westra, S. Natural hazards in Australia: Floods. Clim. Chang. 2016, 139, 21–35. [Google Scholar] [CrossRef] [Green Version]
- Liu, J.Y.; You, Y.Y.; Zhang, Q.; Gu, X.H. Attribution of streamflow changes across the globe based on the Budyko framework. Sci. Total Environ. 2021, 794, 148662. [Google Scholar] [CrossRef] [PubMed]
- Hodgkins, G.A.; Whitfield, P.H.; Burn, D.H.; Hannaford, J.; Renard, B.; Stahl, K.; Fleig, A.K.; Madsen, H.; Mediero, L.; Korhonen, J.; et al. Climate-driven variability in the occurrence of major floods across North America and Europe. J. Hydrol. 2017, 552, 704–717. [Google Scholar] [CrossRef] [Green Version]
- Burn, D.H. Climatic influences on streamflow timing in the headwaters of the Mackenzie River Basin. J. Hydrol. 2008, 352, 225–238. [Google Scholar] [CrossRef]
- Kingston, D.G.; Fleig, A.K.; Tallaksen, L.M.; Hannah, D.M. Ocean-Atmosphere Forcing of Summer Streamflow Drought in Great Britain. J. Hydrometeorol. 2013, 14, 331–344. [Google Scholar] [CrossRef]
- Verdon, D.C.; Wyatt, A.M.; Kiem, A.S.; Franks, S.W. Multidecadal variability of rainfall and streamflow: Eastern Australia. Water Resour. Res. 2004, 40, 8. [Google Scholar] [CrossRef]
- Barnett, T.P.; Pierce, D.W.; Hidalgo, H.G.; Bonfils, C.; Santer, B.D.; Das, T.; Bala, G.; Wood, A.W.; Nozawa, T.; Mirin, A.A.; et al. Human-induced changes in the hydrology of the western United States. Science 2008, 319, 1080–1083. [Google Scholar] [CrossRef] [PubMed] [Green Version]
- Diffenbaugh, N.S.; Swain, D.L.; Touma, D. Anthropogenic warming has increased drought risk in California. Proc. Natl. Acad. Sci. USA 2015, 112, 3931–3936. [Google Scholar] [CrossRef] [PubMed] [Green Version]
- FitzHugh, T.W.; Vogel, R.M. The impact of dams on flood flows in the United States. River Res. Appl. 2011, 27, 1192–1215. [Google Scholar] [CrossRef]
- Jaramillo, F.; Destouni, G. Local flow regulation and irrigation raise global human water consumption and footprint. Science 2015, 350, 1248–1251. [Google Scholar] [CrossRef]


Publisher’s Note: MDPI stays neutral with regard to jurisdictional claims in published maps and institutional affiliations. |
© 2021 by the authors. Licensee MDPI, Basel, Switzerland. This article is an open access article distributed under the terms and conditions of the Creative Commons Attribution (CC BY) license (https://creativecommons.org/licenses/by/4.0/).