You are currently viewing a new version of our website. To view the old version click .
Remote Sensing
  • Article
  • Open Access

26 September 2021

Thermal Imagery Feature Extraction Techniques and the Effects on Machine Learning Models for Smart HVAC Efficiency in Building Energy

,
,
and
1
Department of Computational Data Science and Engineering, North Carolina Agricultural and Technical State University, Greensboro, NC 27411, USA
2
Department of Civil, Architectural, and Environmental Engineering, North Carolina Agricultural and Technical State University, Greensboro, NC 27411, USA
3
Center for Energy Research and Technology, North Carolina Agricultural and Technical State University, Greensboro, NC 27411, USA
*
Author to whom correspondence should be addressed.
This article belongs to the Special Issue Wavelet Transform for Remote Sensing Image Analysis

Abstract

The control of thermostats of a heating, ventilation, and air-conditioning (HVAC) system installed in commercial and residential buildings remains a pertinent problem in building energy efficiency and thermal comfort research. The ability to determine the number of people at a particular time in an area is imperative for energy efficiency in order to condition only occupied regions and thermally deficient regions. In this study of the best features comparison for detecting the number of people in an area, feature extraction techniques including wavelet scattering, wavelet decomposition, grey-level co-occurrence matrix (GLCM) and feature maps convolution neural network (CNN) layers were explored using thermal camera imagery. Specifically, the pretrained CNN networks explored are the deep residual (Resnet-50) and visual geometry group (VGG-16) networks. The discriminating potential of Haar, Daubechies and Symlets wavelet statistics on different distributions of data were investigated. The performance of VGG-16 and ResNet-50 in an end-to-end manner utilizing transfer learning approach was investigated. Experimental results showed the classification and regression trees (CART) model trained on only GLCM and Haar wavelet statistic features, individually achieved accuracies of approximately 80% and 84%, respectively, in the detection problem. Moreover, k-nearest neighbors (KNN) trained on the combined features of GLCM and Haar wavelet statistics achieved an accuracy of approximately 86%. In addition, the performance accuracy of the multi classification support vector machine (SVM) trained on deep features obtained from layers of pretrained ResNet-50 and VGG-16 was between 96% and 97%. Furthermore, ResNet-50 transfer learning outperformed the VGG-16 transfer learning model for occupancy detection using thermal imagery. Overall, the SVM model trained on features extracted from wavelet scattering emerged as the best performing classifier with an accuracy of 100%. A principal component analysis (PCA) on the wavelet scattering features proved that the first twenty (20) principal components achieved a similar accuracy level instead of training on the whole feature set to reduce the execution time. The occupancy detection models can be integrated into HVAC control systems for energy efficiency and security systems, and aid in the distribution of resources to people in an area.

1. Introduction

Detecting the number of people in a space is an important task to help reduce energy consumption in homes and office buildings. The main function of the heating, ventilation, and air-conditioning (HVAC) system in commercial and residential buildings is to maintain comfortable indoor conditions, and to provide safe and acceptable indoor air quality. However, the downside of these HVAC systems is high consumption of energy. According to the building energy data book of the United States Department of Energy (DOE) published in 2015, about 50% of the energy consumption in buildings is directly related to space heating, cooling and ventilation. Considering a large room as shown in Figure 1, conditioning portions that are only occupied (blue quadrants) can save energy.
Figure 1. Smart HVAC efficiency diagram with air conditioning only in blue quadrants [1].
However, achieving this level of individualized optimum comfort control within the same room/space in buildings is currently unattainable. It is partially available in automobiles and aircrafts in manual mode. Most organizations only use a limited portion of their office space, hence the ability to condition only those occupied parts of the office can save energy. Traditionally, the thermostats of the HVAC system depend on the setpoint in hallway or entry of the rooms, which represents the worst scenario of occupants. Achieving a level of personalized personal comfort is not possible.
This study aims to explore the possibility of utilizing thermal images to train machine learning models for occupancy detection, which can be integrated into the control models of an HVAC system. The models developed in this research are different from previous works where people utilized motion detection as a concept to detect whether a human is present or not in a conference room. This study contributes to the field of building energy efficiency by proposing new feature sets and prediction algorithms to develop multi classification machine learning models for up to three people sitting at office desks using thermal images. In addition, four different feature extraction techniques and their effects on machine learning models are investigated for comparison. Textural features in the form of grey-level co-occurrence matrix (GLCM) and wavelet statistics feature extraction, wavelet scattering features and pretrained convolutional neural network feature maps were pursued for a linear discriminant analysis (LDA), support vector machines (SVM), classification and regression tree (cart) and k-nearest neighbors (KNN) machine learning models. Specifically, the pretrained CNN networks explored are the deep residual network (ResNet-50) and visual geometry group networks (VGG-16). ResNet-50 and VGG-16 pretrained networks are selected because of their performance in various deep learning competitions with very high accuracy. ResNet-50 is a convolutional neural network that is 50 layers deep and has been trained on a wide range of images. As a result, the network has learned varied and informative feature representations [2]. The classification of objects which are not part of these 1000 object categories can be performed with this pretrained network by adjusting the network. VGG-16 is a CNN model proposed by Simonyan and Zisserman and won the Imagenet Large Scale Recognition Challenge competition in 2014 [3]. Transfer learning architectures of these top pretrained CNN models will also be investigated on the thermal imagery dataset.

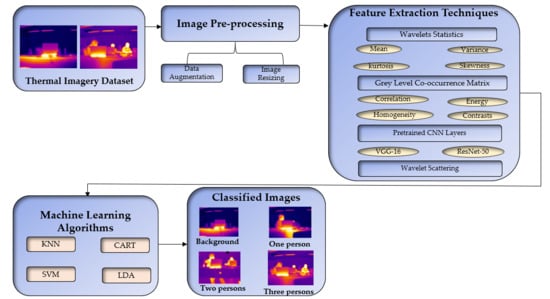
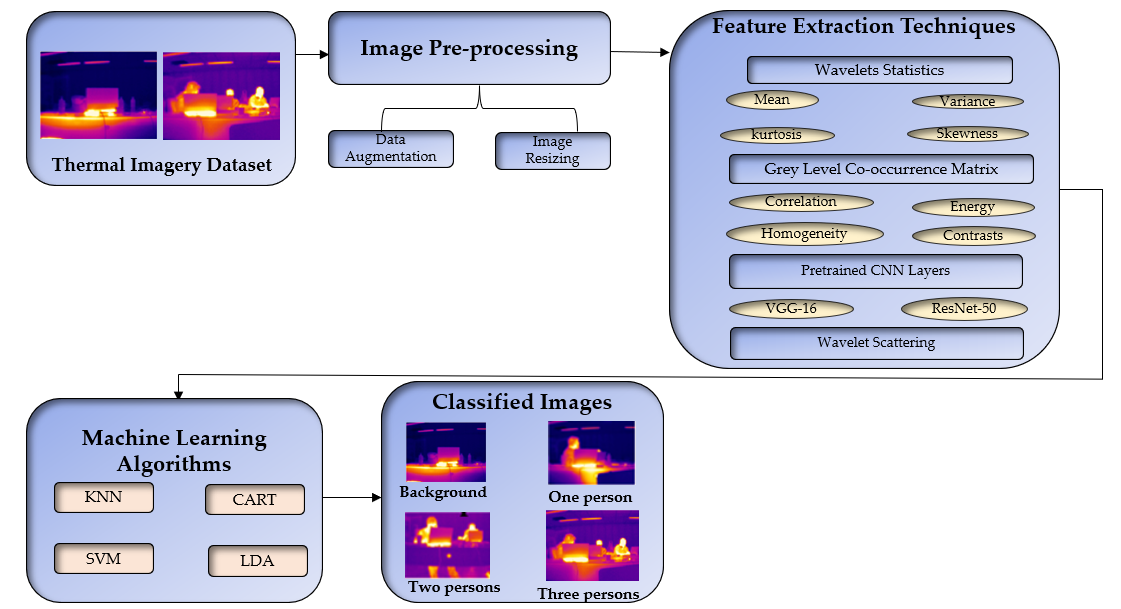
3. Materials and Methods

This section presents the overview of the materials and methods for the experiment as shown in Figure 2.
Figure 2. High level block diagram of the comparison study of various ML and DL methods validated for better performance in occupancy detection.

3.1. Thermal Images Dataset

The hardware for this research consists of a PI 160 thermal camera, a temperature and humidity sensor and an Arduino uno micro-controller board. Both sensors interrogated the same space. Figure 3 shows a snapshot of the Optrix PI connect software, Optrix PI connect infrared camera and the temperature and humidity sensor for the experiment. The PI connect software makes it possible to assess the infrared camera.
Figure 3. (a) Optrix PI 160 infrared camera, (b) Optrix PI Connect software and (c) temperature and humidity sensor and Arduino uno connection.
The PI 160 infrared camera was connected directly to a laboratory computer and the temperature and humidity sensors were interfaced through the Arduino uno which was also connected to the same desktop. The temperature readings obtained from the temperature and humidity sensor was used to calibrate the temperature on the PI160 thermal camera. Thermal images which contain a different number of occupants in the laboratory were captured every minute while they work around a desk. The accuracy and optical resolution of the Optrix PI 160 infrared camera was ±3.5 °F and 160 × 120 pixels, respectively. The data collection was implemented with the Optrix PI connect software while the implementation of models was performed with MATLAB version 2020a and Sklearn Python package. The training of models was performed on a windows platform with an Intel Core i7-8550U CPU @ 1.80 GHz, 1992 MHz, four core(s), eight logical processor(s) and a single GPU. Figure 4 shows a sample thermal image in each of the four categories to provide a clear picture of data collection and how occupants can be distinguished from the background. This experimental setup is a similar set up presented by Acquaah et al. [1]. The number of samples collected is 341. The dataset was divided into 70% training and 30% testing to obtain the general accuracy. The images were saved and grouped to their various classes depending on the number of people in the images (That is one person, two persons, three persons and the background). The background, one person, two persons and three persons classes contained 112, 72, 85 and 72 images, respectively.
Figure 4. Sample thermal image in each of the four categories.

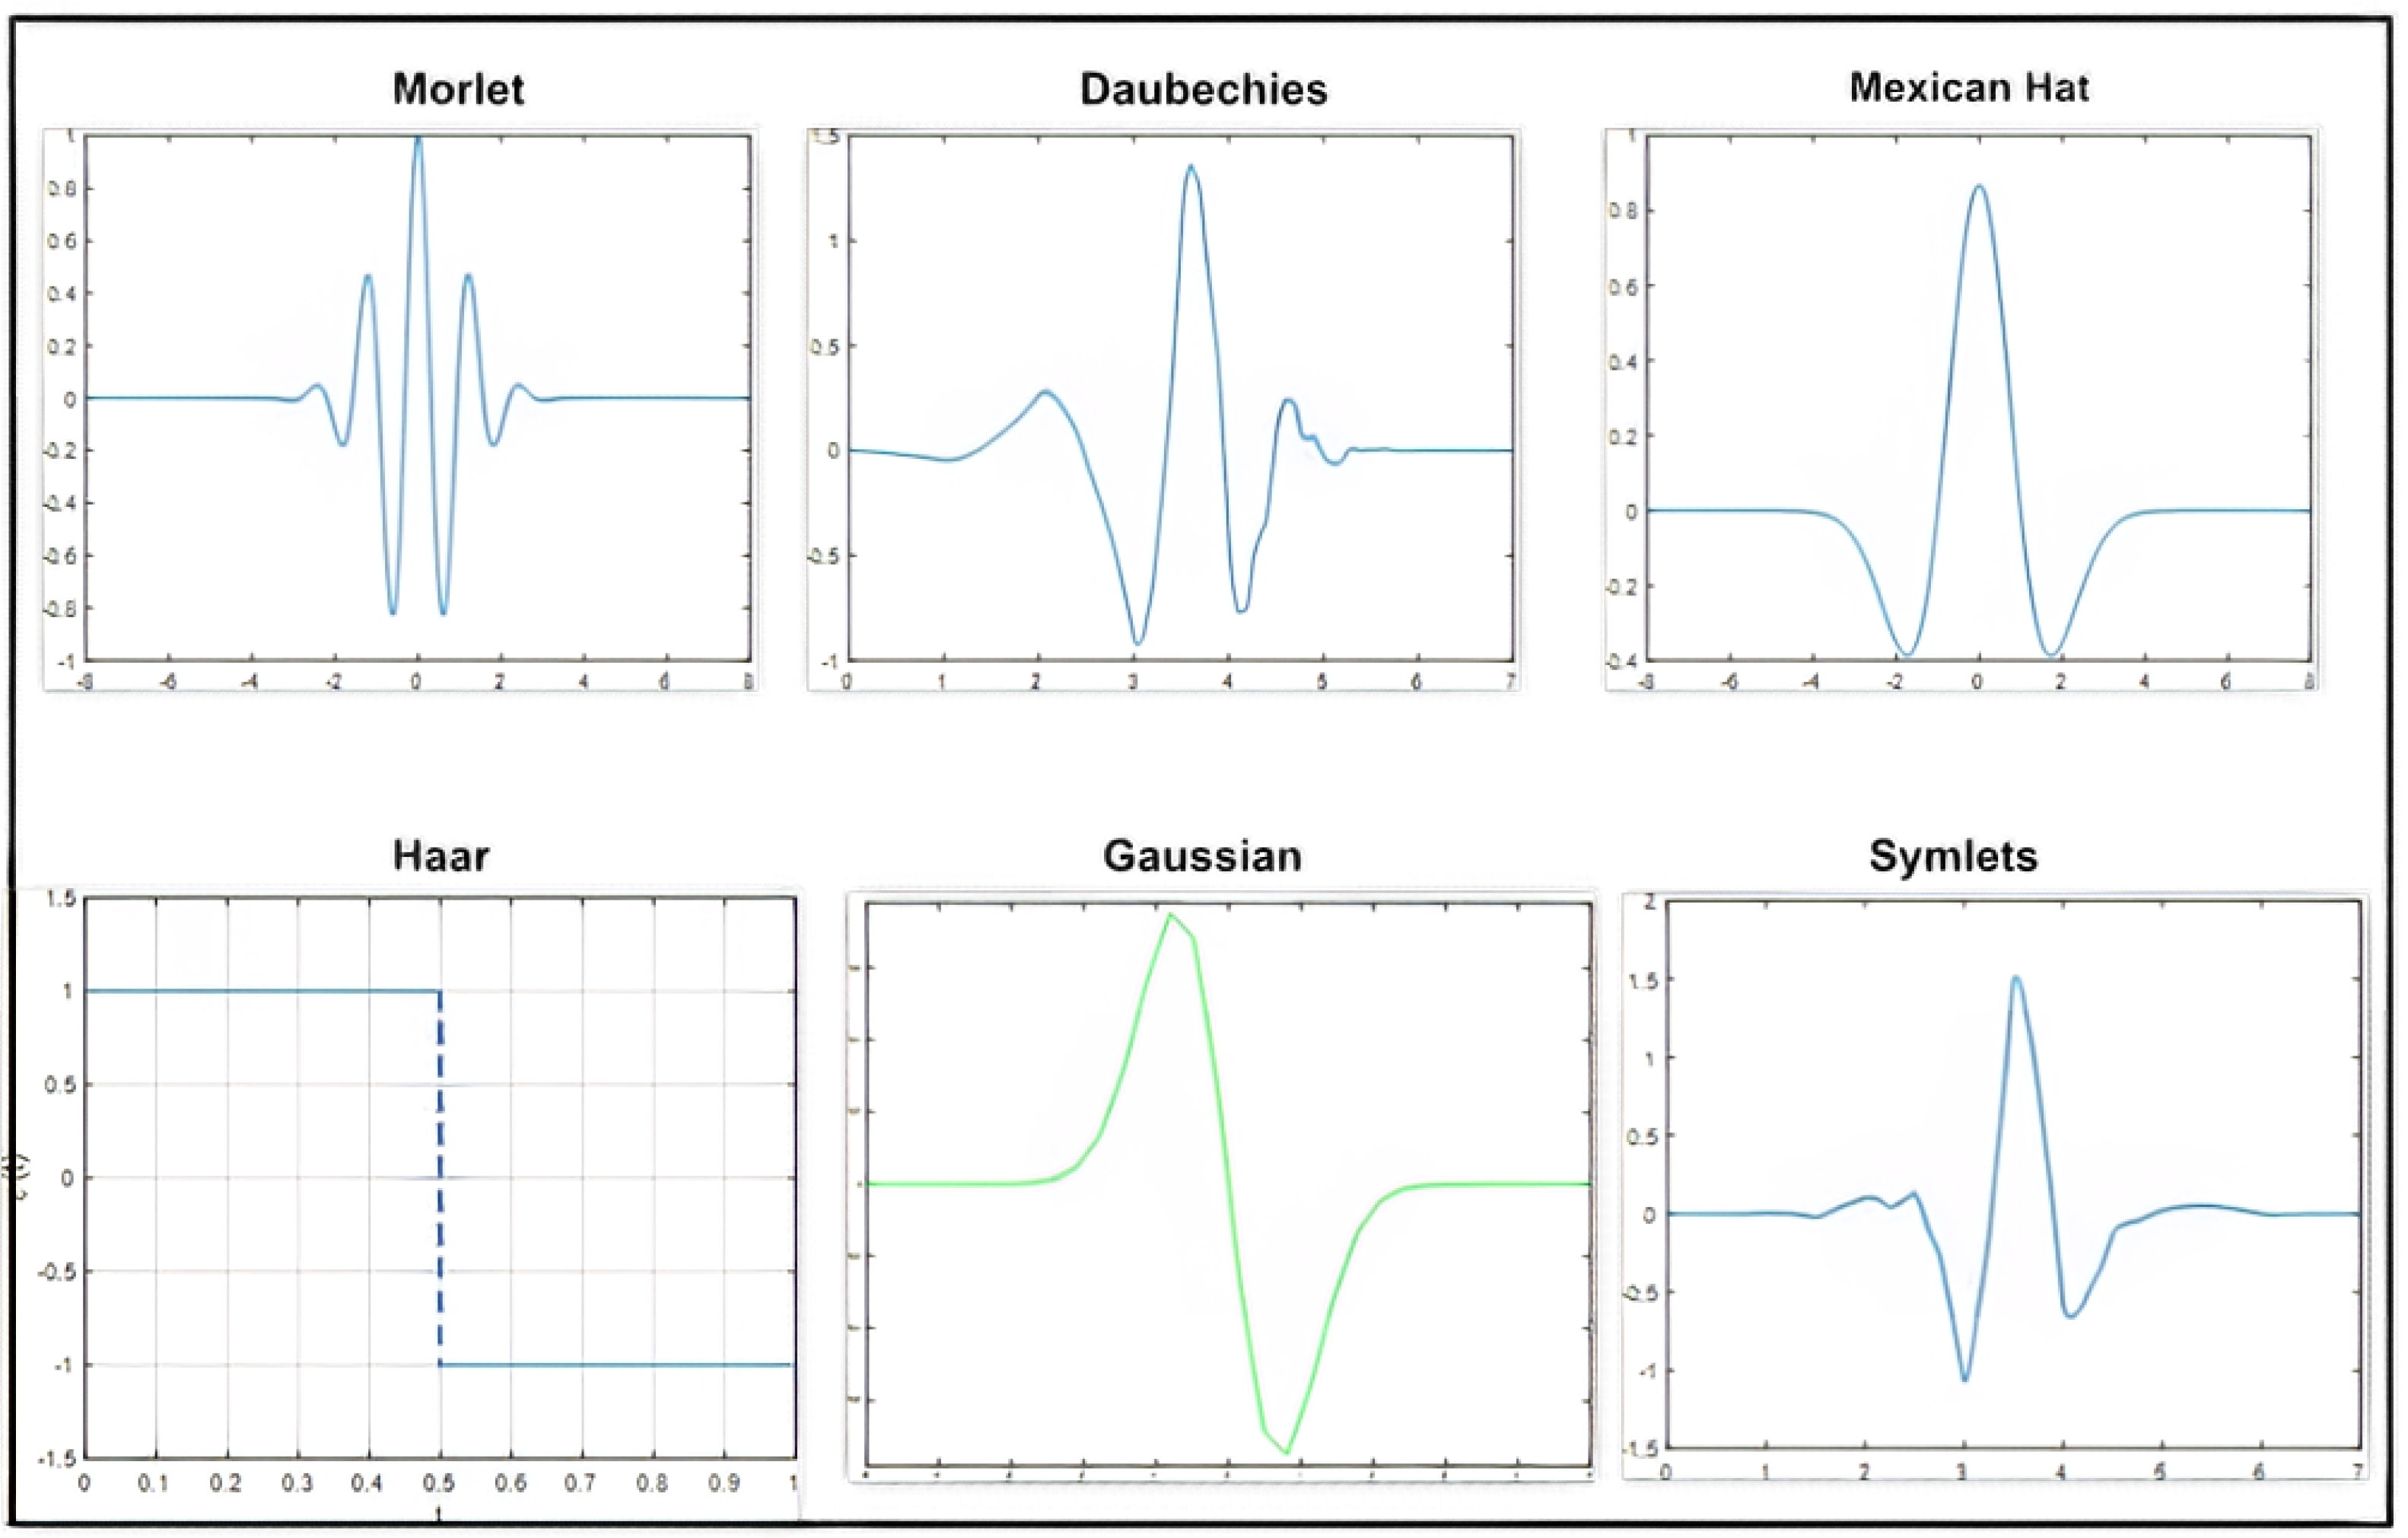
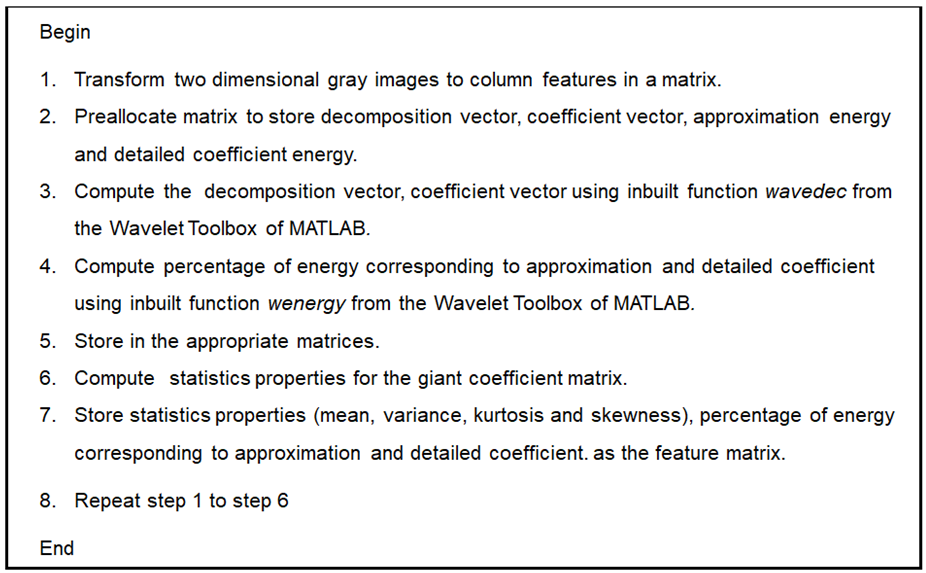
3.2. Wavelet Statistics Feature Extraction

Since the 1980’s wavelets have been applied in harmonic analysis, seismic exploration, quantum mechanics, computer vision and computer graphics. In expounding the usage of wavelets in the field of computer vision, the sparse representation property of wavelets has many important real-world applications such as image compression (e.g., the JPEG 2000 format), denoising, edge detection, numerical solutions of differential equations, computer generated graphics, modeling curves and surfaces, compressed sensing, and feature extraction. A wavelet is a rapidly decaying wave-like oscillation that has zero mean and exits for a finite duration and in different sizes and shapes. An application needs to be investigated well-before the right type of wavelet is chosen. Continuous and discrete wavelet transforms are the two major transforms in wavelet analysis. These transforms differ based on how the wavelets are scaled and shifted. Discrete wavelet transforms (DWT) are used to obtain manageable wavelet coefficient data size. The coefficients of a continuous wavelet transform (CWT) are innumerable which makes it computationally inefficient. CWT cannot be implemented with filter banks whereas decimated and undecimated (DWT) can be implemented with the help of filter banks (low-pass filtering and high-pass filtering). Many wavelets available for both continuous and discrete analysis are included in the wavelet toolbox of MATLAB 2020a. Examples of wavelets for discrete analysis included in the wavelet toolbox are orthogonal wavelets (Daubechies extremal phase and least asymmetric wavelets) and B-spline biorthogonal wavelets. Examples for wavelet families for continuous analysis present in the wavelet toolbox are Morlet, Meyer, derivatives of Gaussian and Paul wavelets. Appendix A presents some examples of wavelets for discrete and continuous analysis. Wavelet families can be distinguished based on the support of the wavelet in time and frequency, rate of decay, symmetry or antisymmetric and the existence of a scaling function. Lastly, the regularity of the wavelet is a very important distinguishing property. Smoother wavelets provide sharper frequency resolution. Additionally, iterative algorithms for wavelet construction converge faster. DWT is a good choice for applications such as denoising, compression, feature extraction and studying statistical properties of wavelet coefficients. Feature extraction is undeniably a very important stage in training a machine learning model as the accuracy and predictability is directly influenced by the type of data extracted from the training data. Due to the reasons above, the DWT wavelet was adapted in this study as the basis function. Selection of the appropriate wavelet transform for an application is not always very clear. The properties of wavelets discussed helps make an informed decision on the right wavelet transform to choose. For example, Wavelets with smaller support to separate the heterogenous features of interest such as Haar, db2 and sym2 can be used in the detection of closely spaced textural features. Unlike smaller support, wavelets with larger support tend to have difficulty detecting closely spaced features which can result in coefficients that do not distinguish individual features.
In this section of the study, statistics (such as mean, variance, kurtosis, and skewness) based on the Haar, db2 and sym2 wavelet transforms are computed to obtain interested information for classification. The complete procedure is provided in Appendix B.

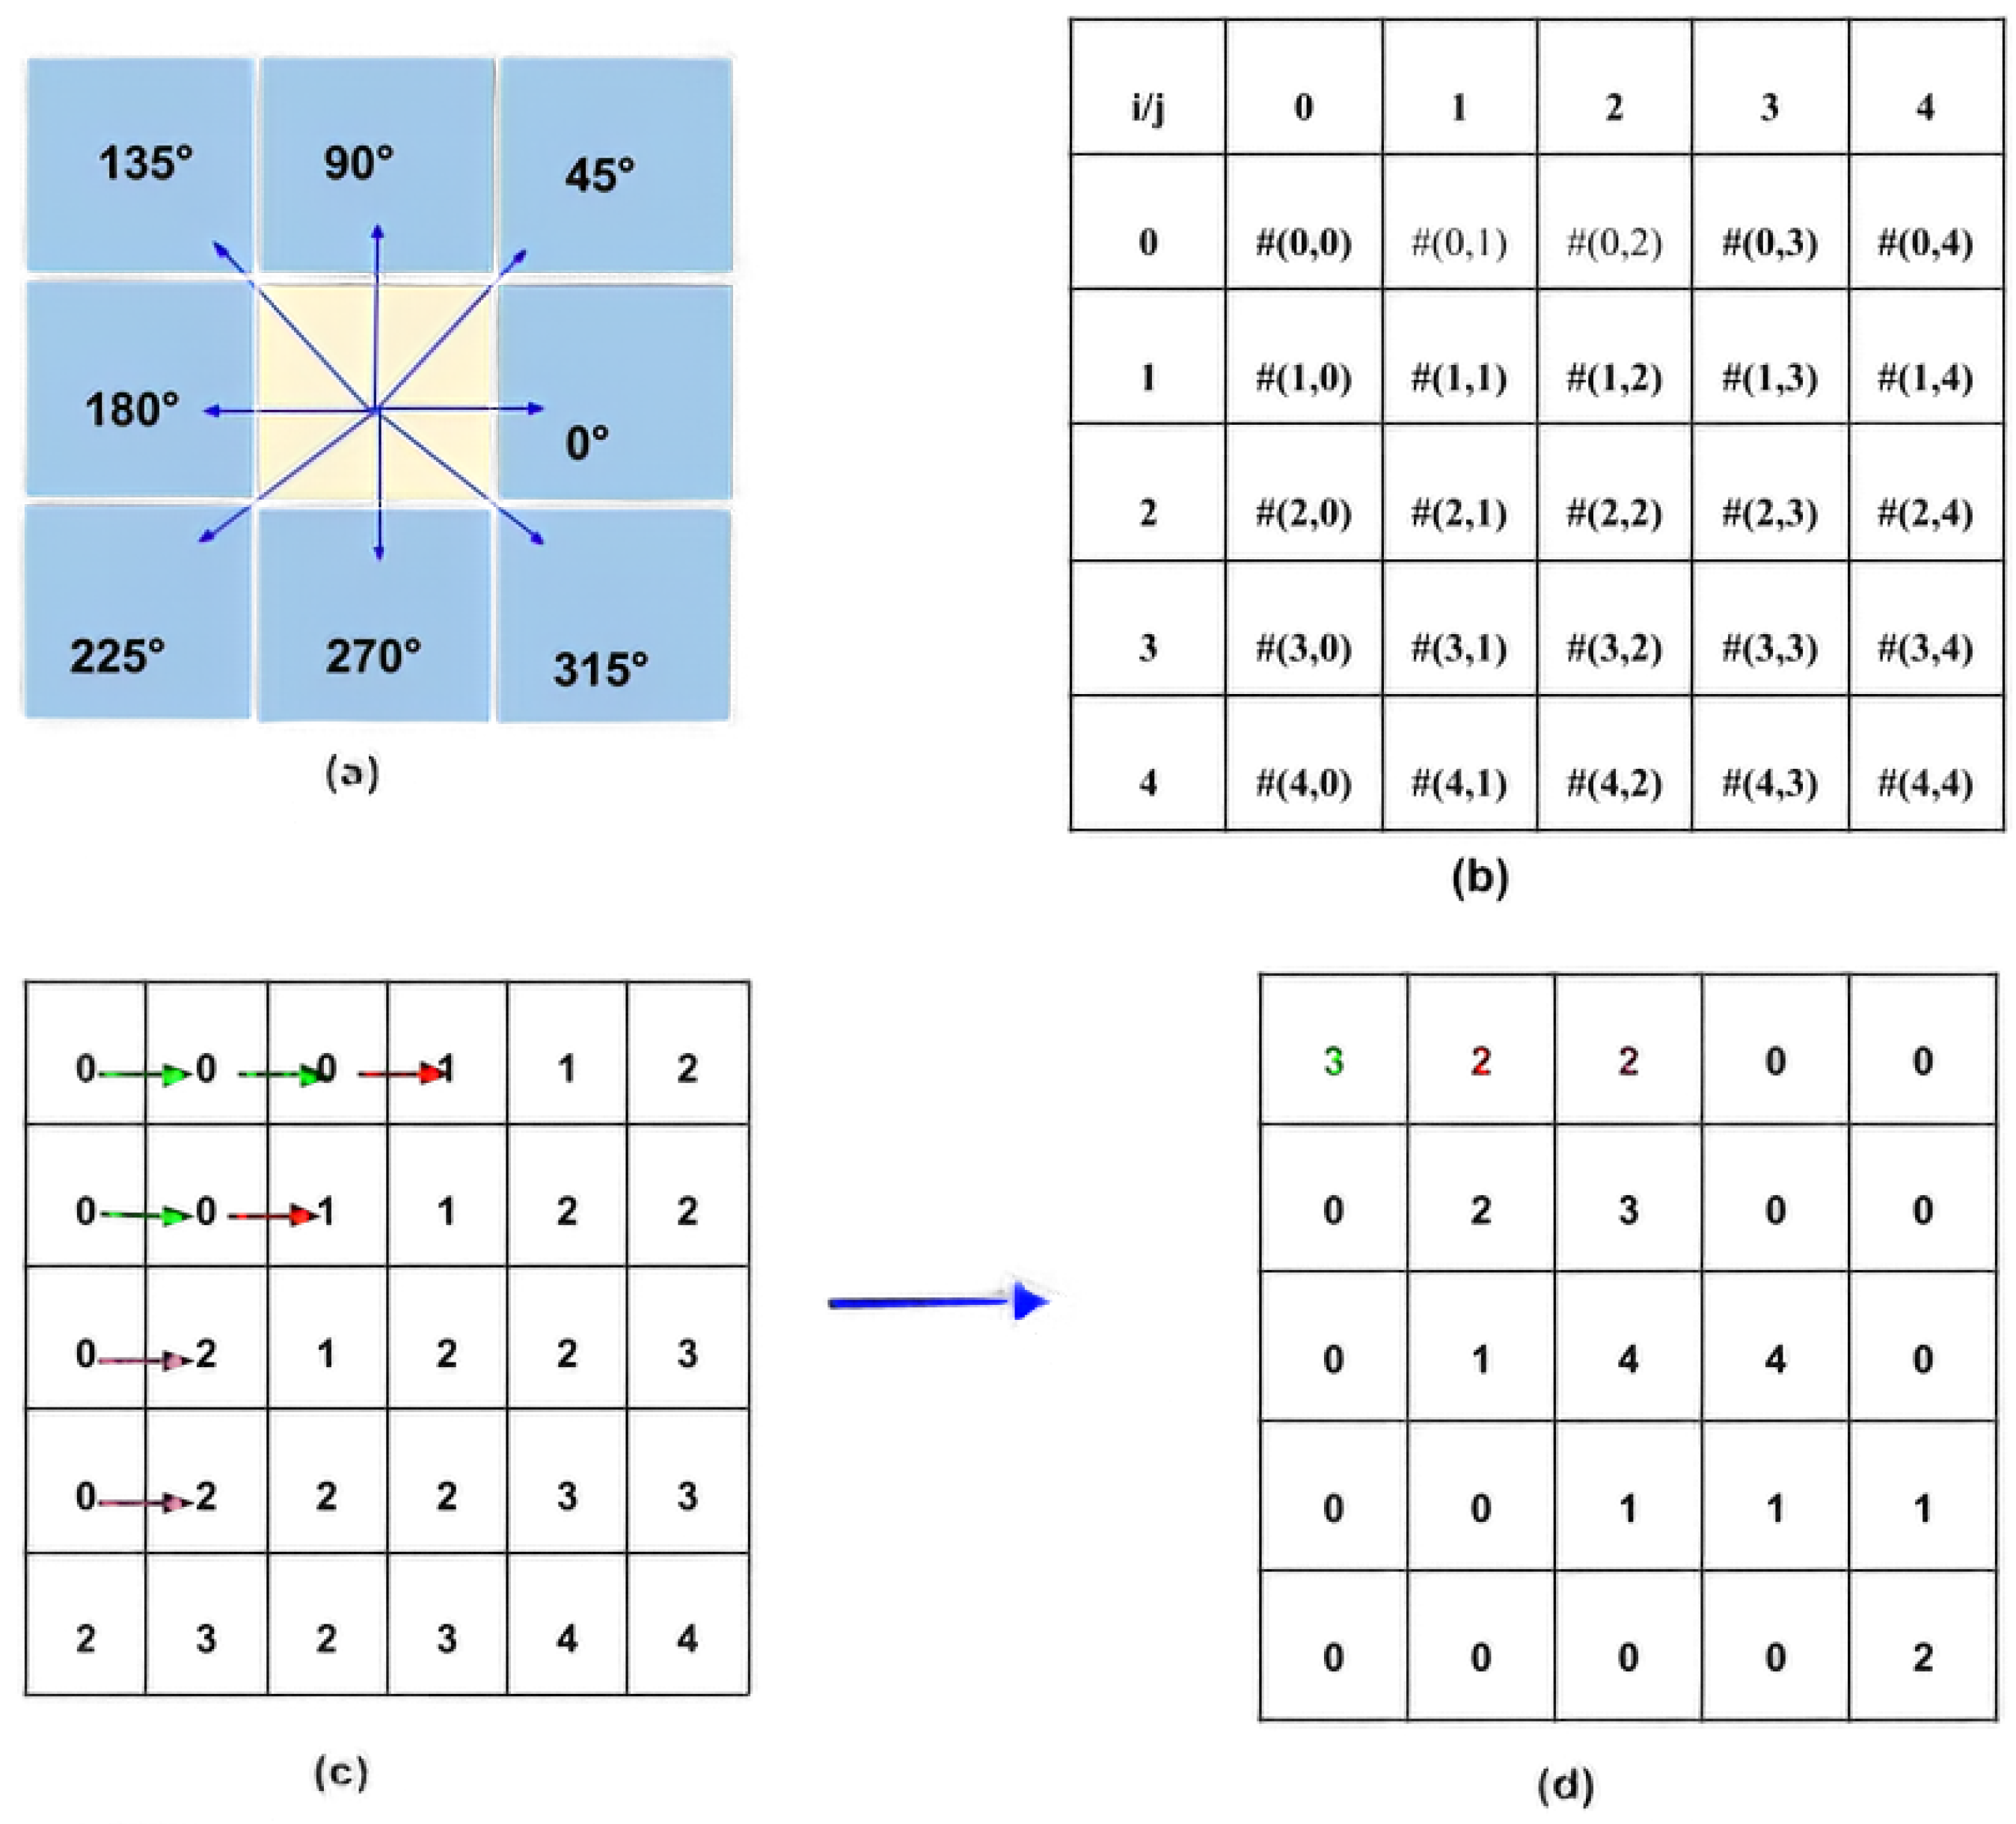
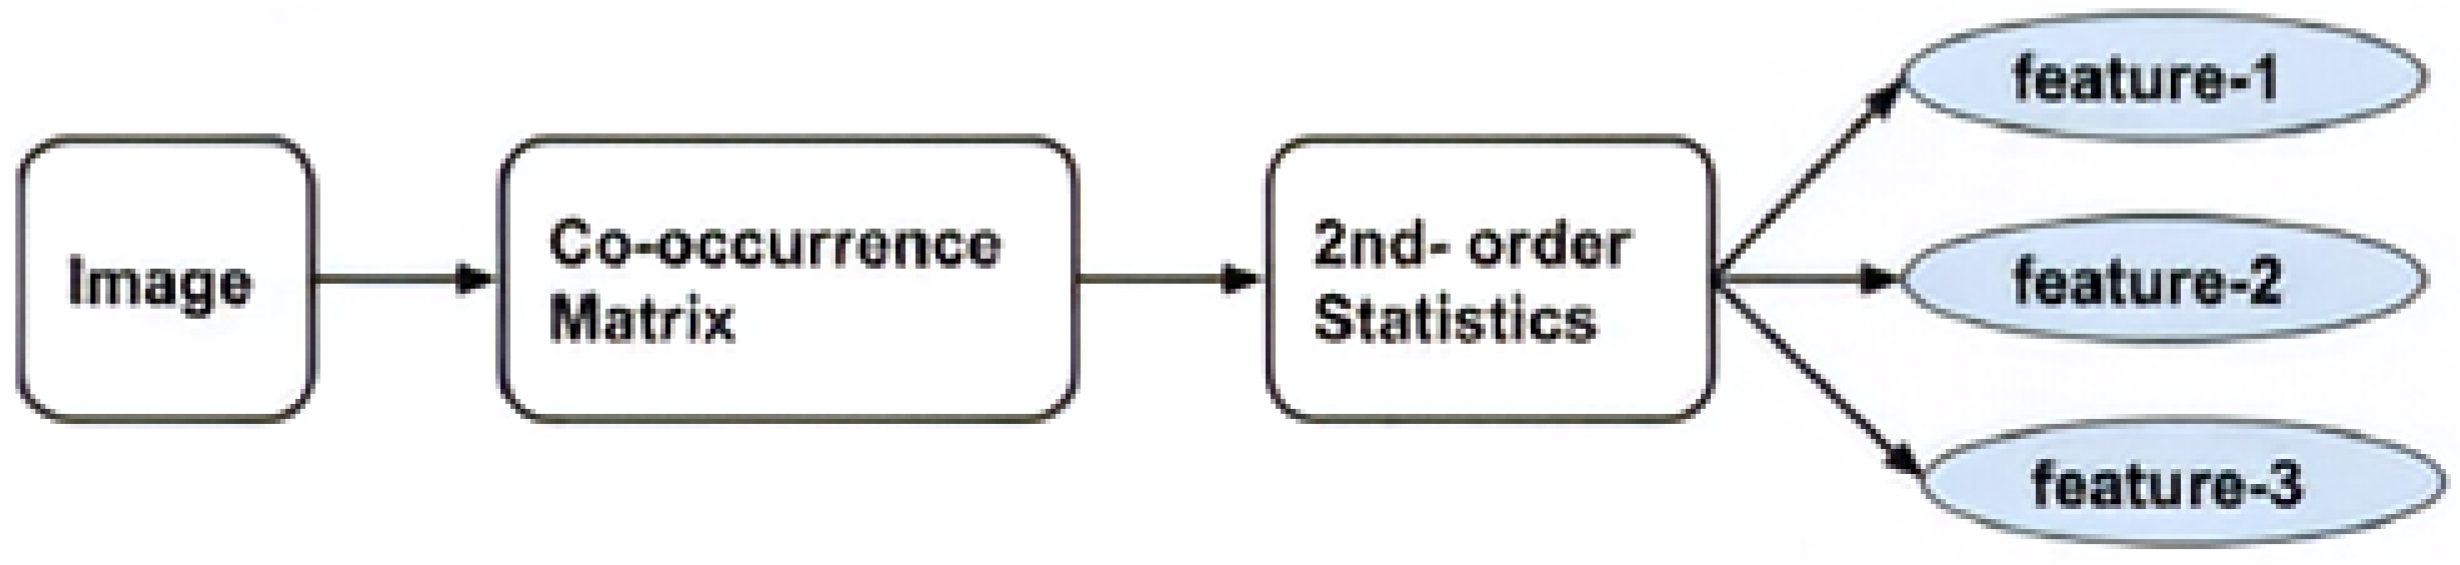
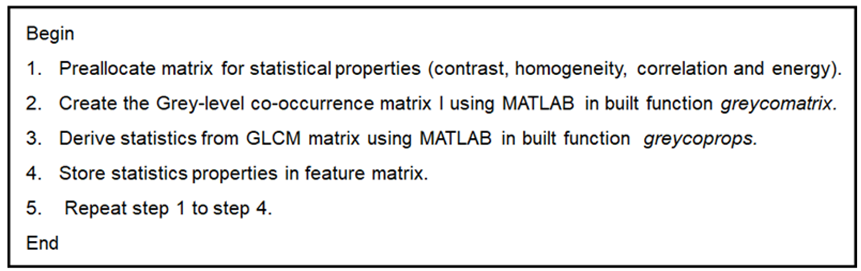
3.3. Grey-Level Co-Occurrence Matrix

Textures are complex visual patterns consisting of spatially organized entities that have characteristic brightness, color, shape, and size. In addition, textures can also be referred to as the description of the spatial arrangement of color or intensities in an image. In images or portions of images where the pixel values are not varying much or are nearly similar, then the texture is said to be homogenous or smooth. On the other hand, varying pixels over a region depicts a coarse texture. Textural features tell the local variation in intensity and are usually extracted from a single band. Texture features from different bands of the image are generally different and have different discriminating capabilities. Texture in an image can be perceived at different levels of resolution. Zooming out in an image makes an area smooth endowed compared with zooming in which locates all textural features. GLCM is a second order statistical method for texture analysis. An image is composed of pixels, each with an intensity or specific grey level, the GLCM is the tabulation of how often different combinations of grey levels co-occur in an image. Texture feature calculations use the entries of the GLCM to provide a measure of the variation in intensity of the region of interest. The GLCM is a square matrix with the same number of rows and columns as the quantization level and can be calculated at any angle and at any of the eight directions as shown in Appendix C. The quantization level was five, with a distance of one and horizontal offset. The computation of the grey-level co-occurrence matrix was performed by computing the number of co-occurrences of pixel i to the neighboring pixel value j also in Appendix C. The size of the resultant co-occurrence square matrix was 5 × 5 because the quantization levels were five in the image. The co-occurrence matrices only capture properties of a texture and are therefore not directly useful for further analysis. However, second order statistics were computed to obtain the feature vectors as shown in Appendix D. The step-by-step algorithm for extracting the GLCM features from thermal images for implementation in MATLAB 2020a can be found in Appendix D. Amongst the features that were computed for further analysis in this task are contrast, homogeneity, correlation and energy.

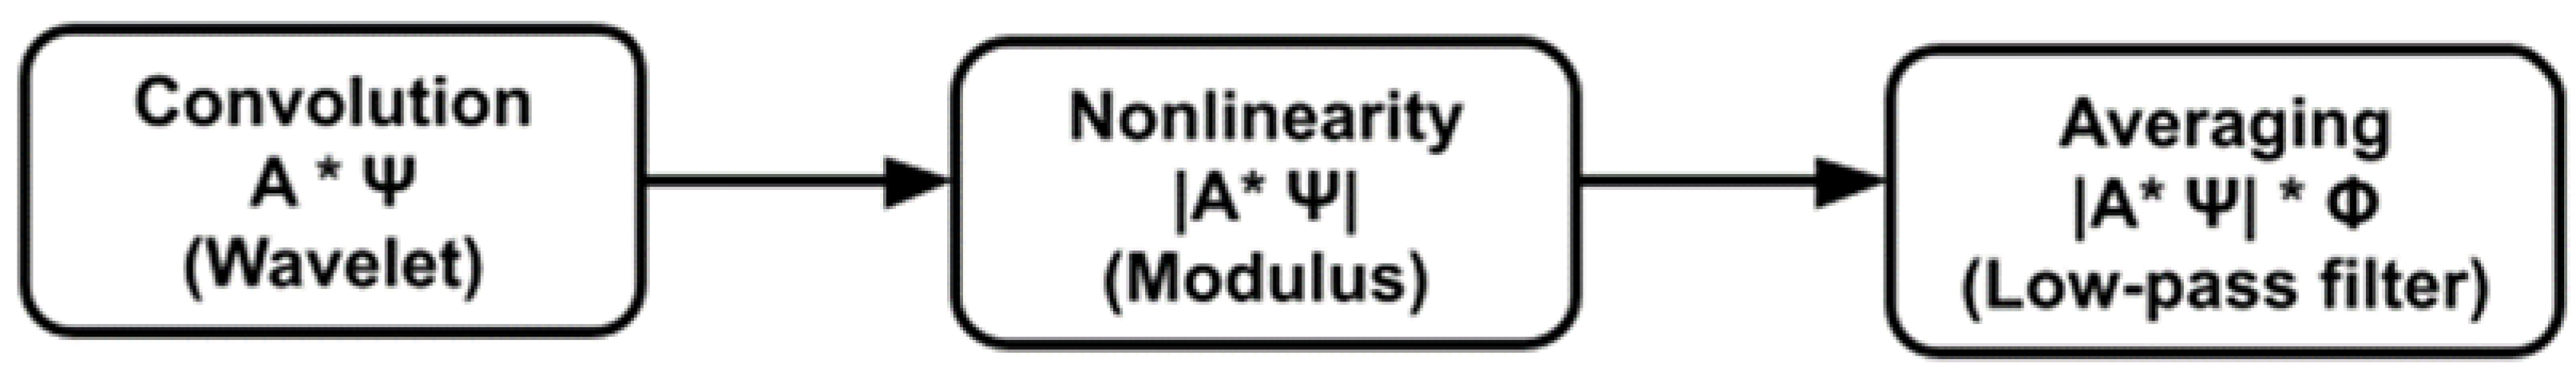
3.4. Wavelet Scattering Transform

Convolution, rectified linear units (RELU), and pooling are repetitive stages that are cascaded to form layers of a deep CNN. However, deep CNNs require large datasets and computational power and choice of hyperparameters for networks, which do not independently affect performance. Explaining the features that are extracted can also be difficult. Wavelet scattering addresses these problems by starting with known filters. Filter weights are learned in the case of CNNs, while filter weights are fixed in the wavelet scattering network. For a low variance representation of a dataset without losing detail and critical information, the wavelet scattering technique generates a representation that is invariant to data rotation (rotation) and stable to deformations. The wavelet scattering network is referred to as a deep network because it also performs three main tasks that make a deep network. An illustration of the tasks performed by a wavelet scattering network is presented in Figure 5.
Figure 5. Wavelet scattering transform stages where A represents an image, Ψ a wavelet function and Φ an averaging low-pass filter [36].
A mathematical framework for studying convolutional neural architectures was introduced by Mallat, with Bruna and Andén. Andén and Lostanlen developed efficient algorithms for wavelet scattering of 1D signals. Oyallon developed efficient algorithms for 2D scattering. Andén, Lostanlen, and Oyallon are major contributors to the ScatNet and Kymatio software for computing scattering transforms [36,37,38,39,40,41,42]. The wavelet scattering transform starts with the convolution of the original image by wavelets to produce an approximation of the data known as scattering coefficients. The zeroth-order scattering coefficients are computed by a simple averaging of the input. The information lost on each level is captured on subsequent levels. The MATLAB 2020a waveletscattering2 function has six input parameters and returns the scattering coefficient matrix. The data can be in the form of a vector, matrix or 3D array. In this study, data were in the form of an image, specifically a matrix. The image size for the wavelet image scattering network can be specified as a two-element integer-valued vector of a number of rows and a number of columns. The special support in the row and column dimensions of the scaling filter is termed invariance scale. Specification of the number of rotations per wavelet per filter bank in the scattering network was performed as an integer-valued vector. The number of rotations provided as integer-vector [5 5], means a network of five rotations per wavelet is created in the first filter bank and five rotations per wavelet in the second filter bank. The algorithm for this methodology is elaborated in Appendix F.

3.5. Resnet-50 and SVM
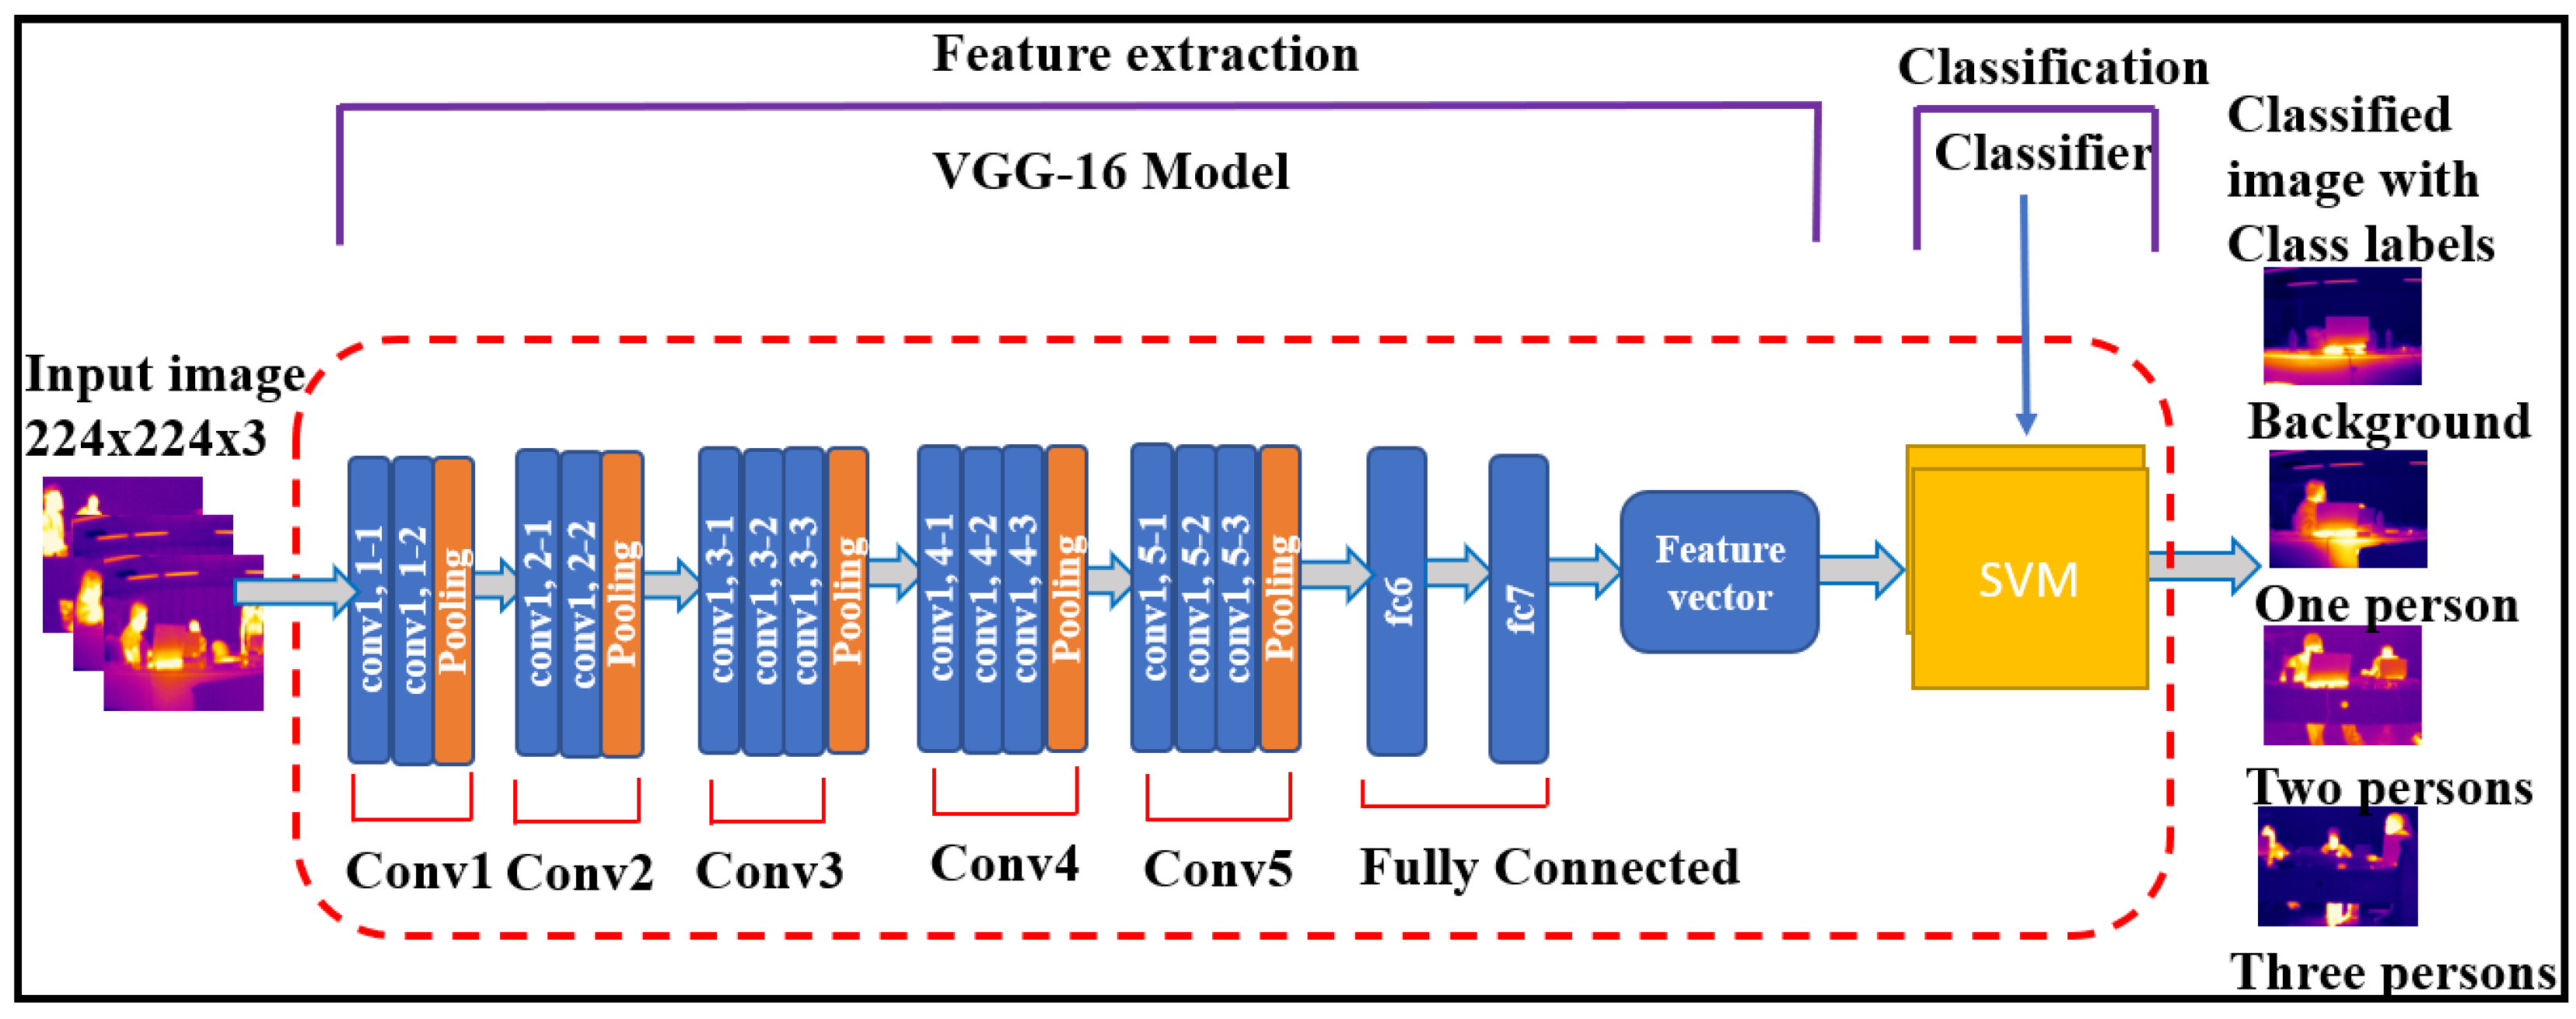
The ResNet-50 architecture was repurposed to solve a different classification on the thermal images data obtained from the experiment [1]. The image input size is 224-by-224-by-3, which represents the height, width, and channel for the ResNet-50 network. The channel size 3 corresponds to the color channel, which are red, green, and blue (RGB) values. For experimentation, these images were divided into a different training set and test set at 70% and 30%, respectively, to obtain the general accuracy. An image datastore enables you to store large image data, including data that does not fit in memory, and efficiently reads batches of images during the training of CNN. These features were processed by deeper network layers which combine the early features to form the higher-level image features. The features for this study were extracted from the layer right before the classification layer using the activation method. This is because the mentioned layer is endowed with combination of rich features from deeper layers [1].

3.6. VGG-16 and SVM

VGG-16 is a convolutional neural network that is 16 layers deep [3]. A pretrained version of the network trained on more than a million images from the ImageNet database can be loaded in MATLAB. The network has already learned rich feature representations for a wide range of images. Similar to Resnet-50, the network has the input size of 224-by-224-by-3. This network is leveraged as a feature extractor with traditional SVM. The dataset was once again split into 70% training and 30% test data. The images were automatically labelled based on the folder names, and the data were stored as an image datastore object in MATLAB. The images were resized to the input size before they were put into the network. The training and testing features were extracted from the fully connected layer ‘fc7’as shown in Figure 6 and used to train a support vector machine model.
Figure 6. VGG-16 with SVM.

3.7. VGG-16 and ResNet-50 Transfer Learning Frameworks

Transfer learning involves using weights that have been learned from standard computer vision benchmark datasets, such as the ImageNet to solve a different problem by replacing the last layers with the number of categories of the new problem. Top performing models such as ResNet-50 and VGG-16 can be downloaded and integrated into a new model for occupancy detection. In this section, the VGG-16 and ResNet-50 models were used as transfer learning frameworks to classify the occupancy detection dataset into four classes. The classification layer_fc1000, fc1000_softmax and the fc1000 layers were removed to repurpose the ResNet-50 CNN model to solve the occupancy detection task of four classes. These layers were replaced with a new fully connected layer, softmax layer and classification layer that is equivalent to the number of categories in the sample dataset. Similarly, the last three layers of VGG-16 were also replaced with a fully connected layer comprising of the number of classes in the thermal imagery dataset, softmax layer and the classification layer. It is worth noting that a classification layer which follows the softmax layer computes the cross-entropy loss for classification and weighted classification problems with mutually exclusive classes. In the classification layer, values from the softmax function are assigned to one of the K mutually exclusive classes using the cross-entropy function for a 1-of-K coding scheme [43]. This is presented in Equation (1):
l o s s = 1 N n = 1 N k = 1 K w k t n k l n y n k
where N is the number of samples, K is the number of classes, wk is the weight for class k, tnk is the indicator that the nth sample belongs to the kth class, and ynk is the output for sample n for class k, which is the value from the softmax function. ynk is described as the probability that the network associates the nth input with class k. Cross-entropy loss is an important cost function that is utilized to optimize classification models. The purpose of the cross-entropy is to take the output probabilities and measure the distance from the truth values. Model weights are iteratively adjusted during training to minimize the cross-entropy.
The thermal imagery occupancy detection dataset was preprocessed by resizing the training and validation images to the requirement of 224-by-224-by-3. Additional data augmentation operations including randomly flipping training images along the vertical axis and random translation up to thirty pixels horizontally and vertically were performed to prevent the network from overfitting. In specifying the training options, stochastic gradient descent momentum (SGDM) was adapted for error optimization at a learning rate of 0.0001. The remaining hyperparameters were a batch size of ten and the maximum number of epochs was ten. A total of 230 iterations were completed for both transfer learning architectures. Since training is computationally intensive, MATLAB online was leveraged with the following hardware environment specifications: Intel(R) Xeon(R) Platinum 8259CL CPU @ 2.50 GHz with sixteen CPU(s).

4. Results and Discussions

4.1. Wavelet Statistical Features and GLCM Modelling Accuracy

Table 1 summarizes the mean accuracy, standard deviation, and area under the curve for stratified 10-fold cross validation comparison for GLCM features. Haar wavelet statistical features and the combination of both CART models trained on only GLCM and the Haar wavelet statistic features individually achieved accuracies of approximately 80% and 84%, respectively, in the detection problem. K-nearest neighbors (KNN) trained on combined features of GLCM and Haar wavelet statistics achieved an accuracy of approximately 86%, which outperformed LDA and CART. Table 2 also summarizes the same performance metrics for combined GLCM and Daubechies features and combined GLCM and Symlets wavelet features. CART and LDA achieved the same accuracy performance for combined GLCM and Daubechies features and combined GLCM and Symlets wavelet features.
Table 1. Summary of mean accuracy, standard deviation, and area under the curve for Haar wavelet.
Table 2. Mean accuracy and standard deviation for combined GLCM and Daubechies features and combined GLCM and Symlets wavelet features.

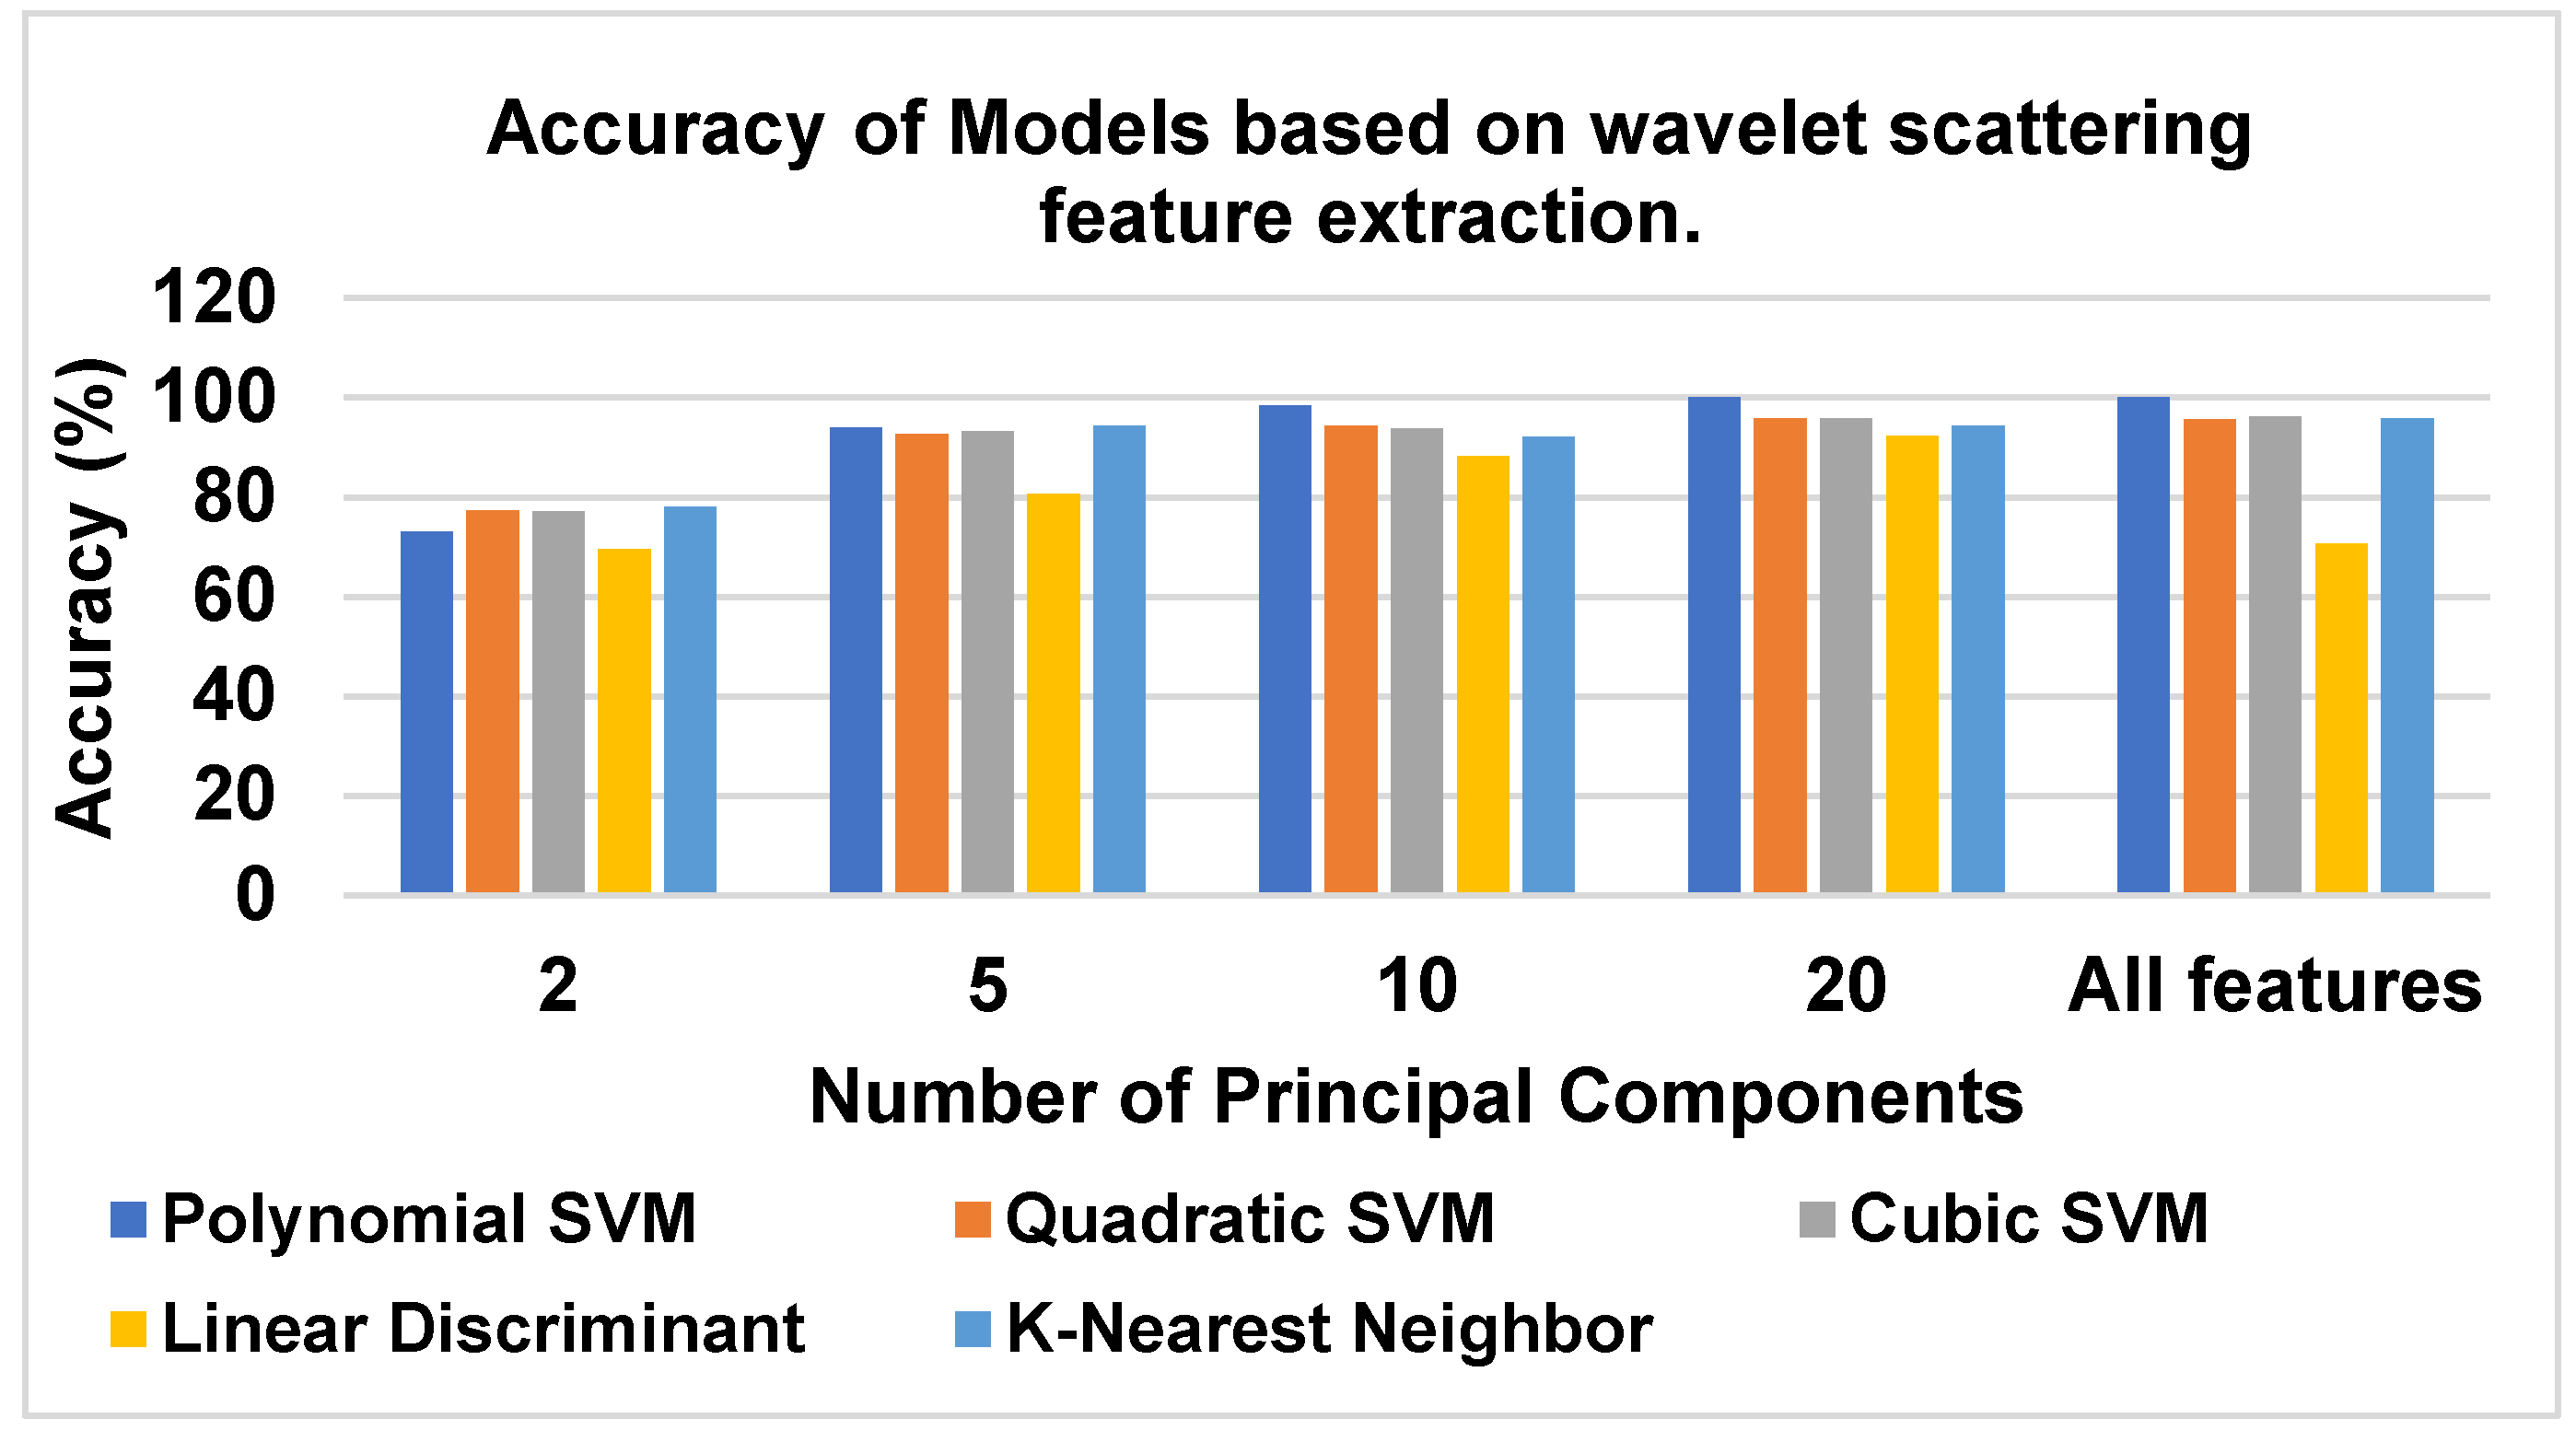
4.2. Performance Results Based on Wavelet Scattering Feature Extraction

The support vector machine model with polynomial kernel achieved an accuracy score of 100% provided the number of rotations to be [5 5]. This means the discriminating power of the classifier is perfect. All the test data were correctly classified by the polynomial SVM model. Table 3 provides the different feature matrices that were obtained by varying number of rotations per wavelet in the first and second filter banks.
Table 3. Evaluation of number rotations and SVM Model Accuracy.
The visualization of the results in Table 4 is presented in Figure 7 to provide a visual representation. An observation can be made that SVM with a polynomial kernel achieved an accuracy of 100% with 20 principal components.
Table 4. Evaluation of number of principal components and model accuracies.
Figure 7. Accuracy of models based on wavelet scattering feature extraction.

4.3. Pretrained CNN Deep Features: ResNet-50 with SVM and VGG-16 with SVM

The accuracy results for ResNet-50 with SVM and VGG-16 with SVM is presented in Table 5. The area under the curve of the receiver operator curve (ROC) for the polynomial SVM model is as shown in Figure 8a. The receiver operating characteristic (ROC) curve for the pretrained VGG-16 with multi SVM classification model showing the area under the curve (AUC) is presented in Figure 8b. The confusion matrix illustrating the performance of the pretrained wavelet scattering features with a multi classification SVM model is shown in Figure 8c. In addition, the confusion matrix illustrating the performance of the pretrained deep features from pretrained VGG-16 with multi classification SVM model is shown in Figure 8d. Few misclassifications of the test dataset with the multi SVM model trained on deep features extracted from VGG-16 can be observed. All the thermal images in test dataset were correctly classified with the multi class SVM trained on wavelet scattering features.
Table 5. Accuracy results of ResNet-50 with SVM and VGG-16 with SVM.
Figure 8. ROC curves and confusion matrices for testing set (a) wavelet scattering + multi classification SVM (b) VGG-16 + multi classification SVM (c) confusion matrix for wavelet scattering + multi classification SVM and (d) VGG-16 deep features + SVM.

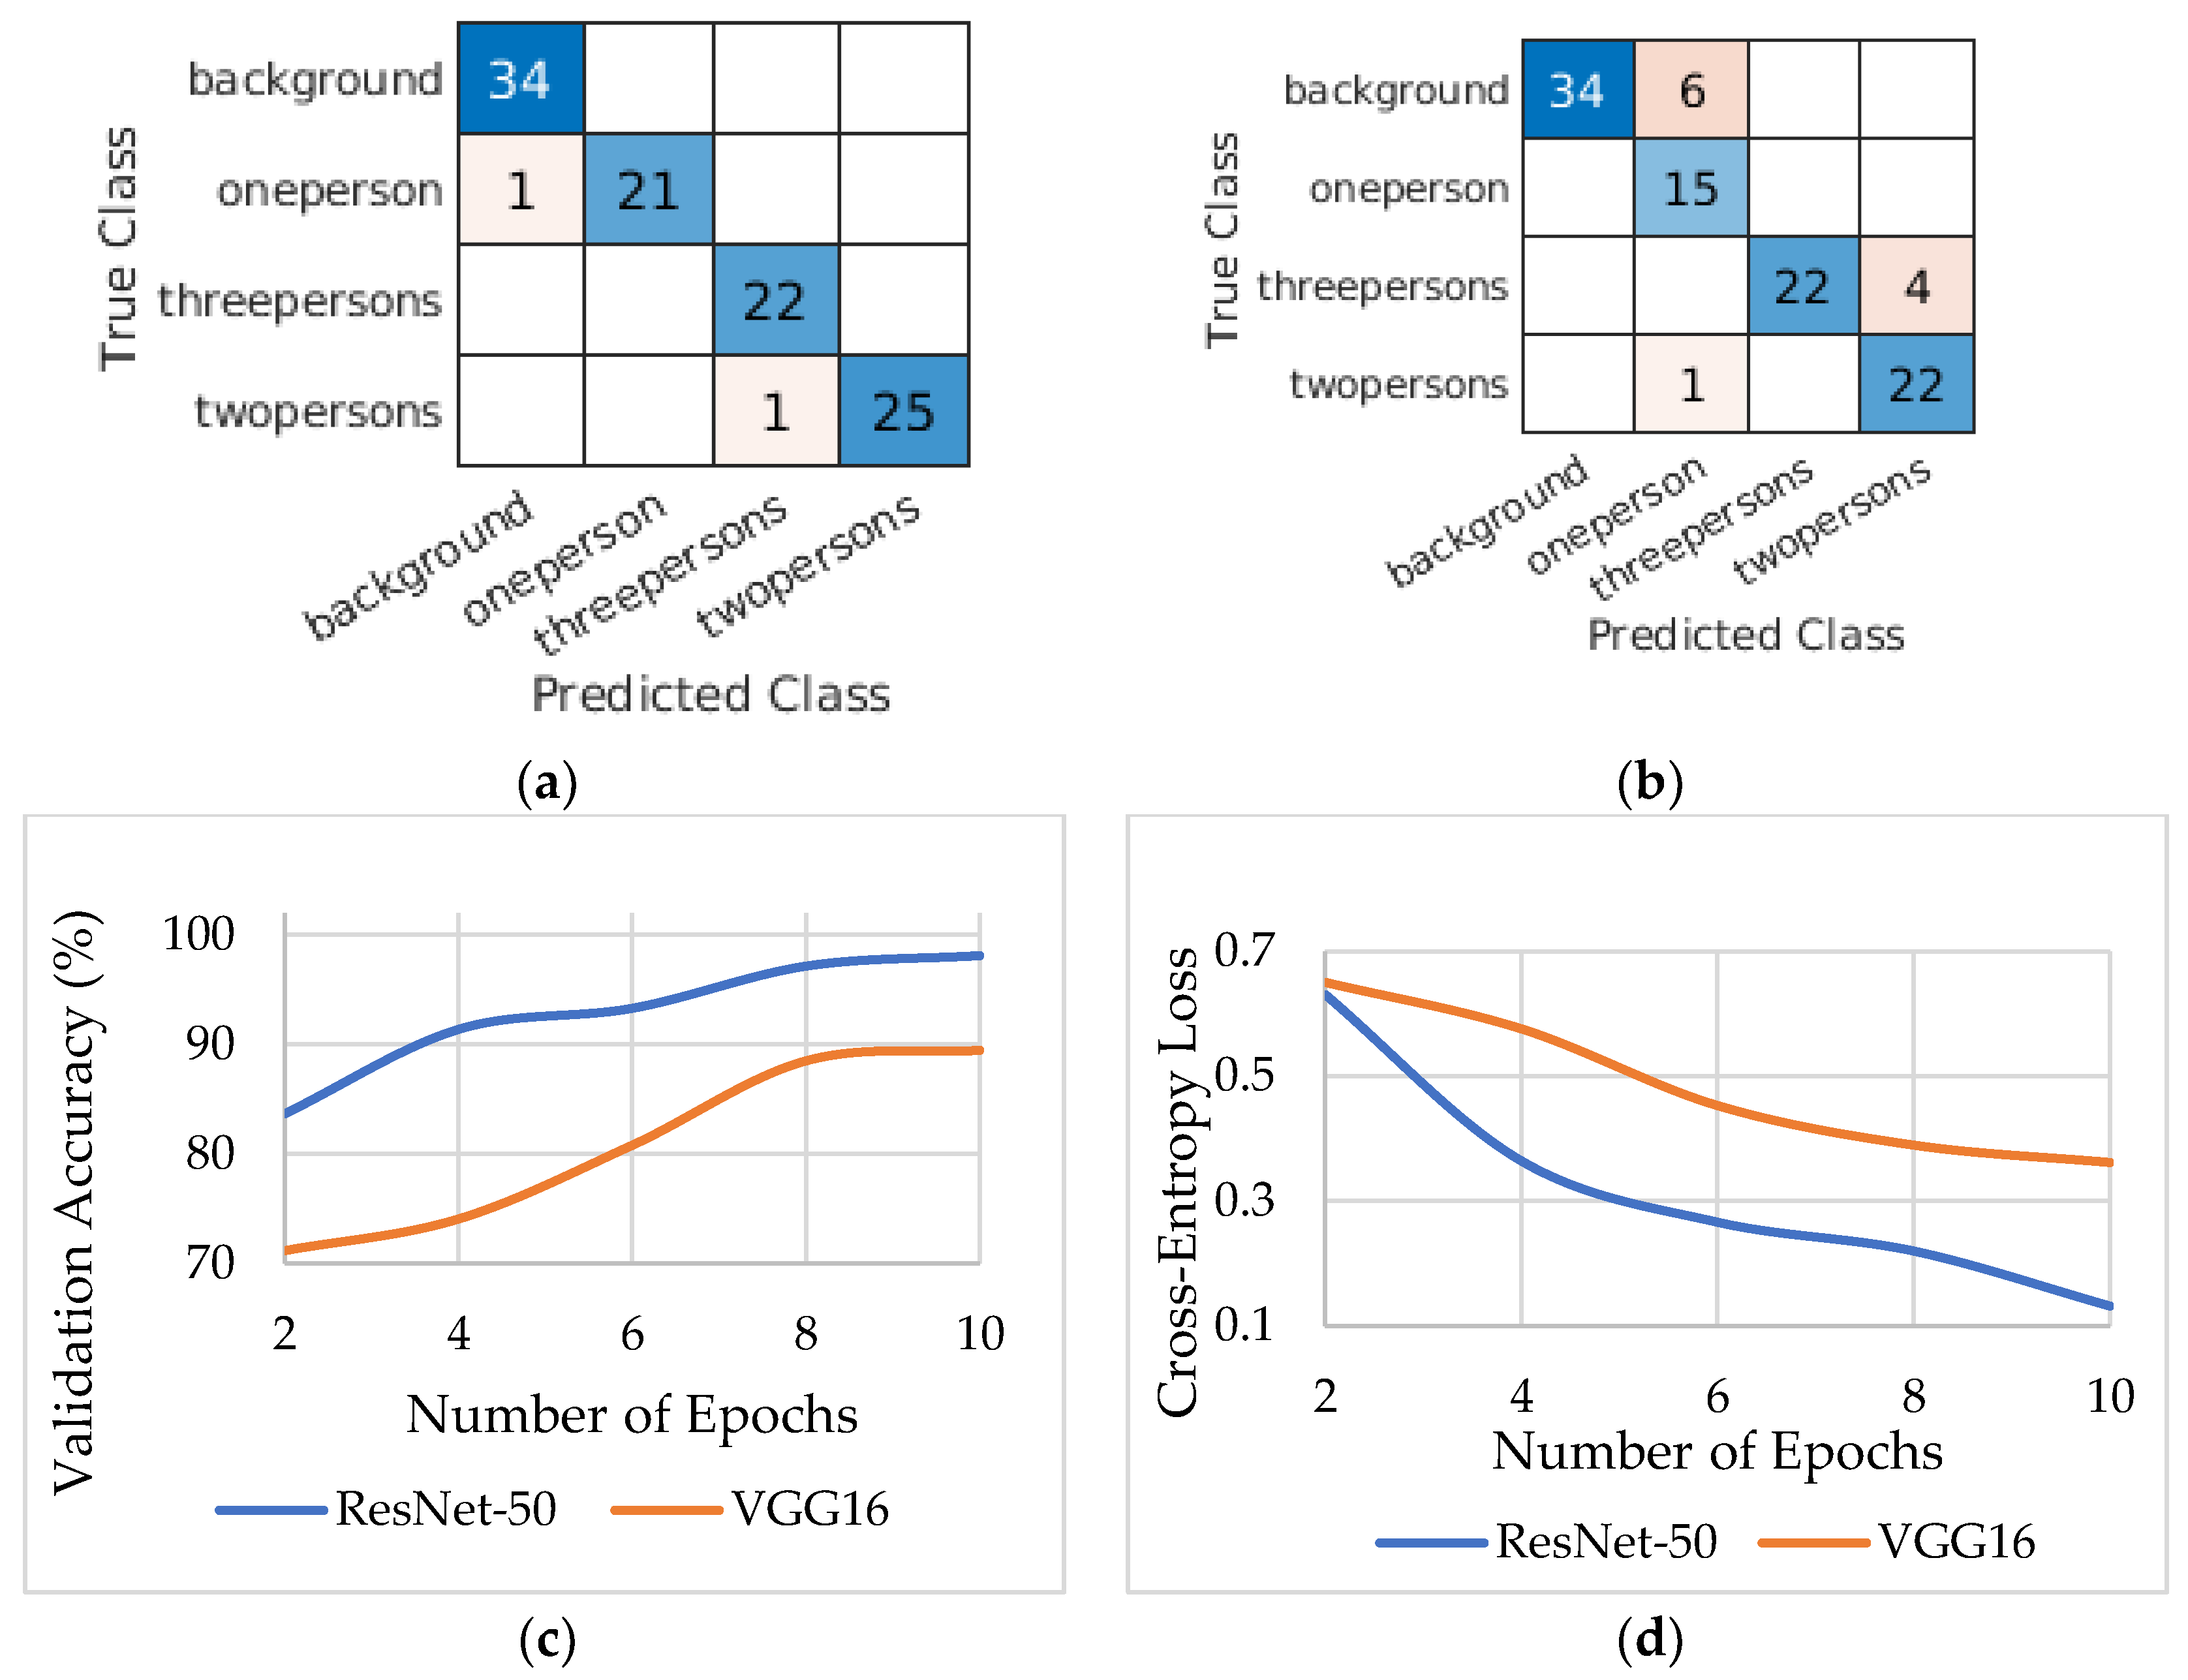
4.4. Analysis of Results of VGG-16 and ResNet-50 Transfer Learning Frameworks

The accuracy scores for ResNet-50 and VGG-16 transfer learning frameworks for 10 epochs is presented in Table 6. The confusion matrices for the two transfer learning architectures are shown in Figure 9a,b. The validation accuracy and cross entropy loss comparison curves for ResNet-50 and VGG-16 are presented in Figure 9c,d, respectively. It is observed that the ResNet-50 transfer learning architecture had the best performance. It can also be observed from Table 6 that ResNet-50 transfer learning framework trained faster than the VGG-16 transfer framework by about 31% on the thermal imagery dataset for occupancy detection. Accuracy of data analysis techniques utilized by other relevant research works is summarized in Table 7.
Table 6. Summary of the validation accuracy and training time.
Figure 9. Confusion matrices, accuracy and cross-entropy loss comparison for ResNet-50 and VGG-16 transfer learning frameworks on the validation set. (a) ResNet-50 transfer learning architecture, (b) VGG-16 transfer learning architecture, (c) validation accuracy for ResNet-50 and VGG-16 and (d) cross-entropy loss for ResNet-50 and VGG-16.
Table 7. Summary of the accuracy of data analysis techniques utilized by other research work.

5. Conclusions

This study explored the possibility of utilizing thermal images to train machine learning models for occupancy detection, which can be integrated into the control models of an HVAC system. Four different feature extraction techniques including wavelet scattering, wavelet feature extraction, grey-level co-occurrence matrix (GLCM) feature extraction and feature maps of pretrained CNNs (ResNet-50 and VGG-16) were explored to estimate the number of people in a large room by using thermal camera imagery. This study used the contrast, homogeneity, energy, and correlation as the GLCM features while the mean, variance, kurtosis, skewness, percentage of energy corresponding to approximation and detailed coefficient were used as the wavelet statistical features.
The experimental results exhibited that the CART model trained on only GLCM and Haar wavelet statistic features separately achieved accuracies of approximately 80% and 84%, respectively. Moreover, KNN trained on combined features of GLCM and Haar wavelet statistics achieved an accuracy of approximately 86%. In addition, the performance accuracy of the multi SVM classification trained on deep features obtained from layers of pretrained ResNet-50 and VGG-16 was between 96% and 97%. Overall, the multi classification SVM model trained on features extracted from wavelet scattering emerged as the best performing classifier with an accuracy of 100% for the thermal image dataset used. The principal component analysis (PCA) on the wavelet scattering features proved twenty (20) principal components achieved a similar accuracy level instead of training on the whole feature set to reduce the execution time. This paper also compared the end-to-end performance of VGG-16 and ResNet-50 transfer learning architectures for thermal imagery dataset on occupancy detection. The ResNet-50 transfer learning architecture outperformed the VGG-16 transfer learning framework with a validation accuracy of 98.08%. Furthermore, ResNet-50 transfer learning framework trained faster than the VGG-16 transfer framework by about 31% on the thermal imagery dataset for occupancy detection.
This study facilitates effective comparisons between different feature extraction techniques and their effects on occupancy estimation machine learning models. The occupancy detection models can be integrated into HVAC control systems for energy efficiency, and will also aid in the distribution of resources to people in an area. Future studies will include extracting deep features from other deep learning architectures such as the EfficientNet to investigate how the model behaves. This research is being done in phases and authors will incorporate human behaviors in the next phase as well to understand which temperatures are acceptable to improve thermal comfort.

Author Contributions

Data curation, Y.T.A.; Formal analysis, Y.T.A.; Funding acquisition, R.C.T.III; Investigation, R.C.T.III and G.H.M.; Methodology, Y.T.A., B.G.; Project administration, B.G., R.C.T.III and G.H.M.; Resources, B.G., R.C.T.III and G.H.M.; Supervision, B.G., R.C.T.III and G.H.M.; Writing—original draft, Y.T.A.; Writing—review and editing, B.G., R.C.T.III and G.H.M. All authors have read and agreed to the published version of the manuscript.

Funding

This research is sponsored by NC Department of Environmental Quality (NCDEQ) through Cares Act, Center for Energy Research and Technology (CERT), UNC Policy Collaboratory and Startup Funds by Office of Dean, in College of Engineering at North Carolina Agricultural and Technical State University.

Conflicts of Interest

The authors declare no conflict of interest.

Abbreviations

The following abbreviations are used in this manuscript:
HVACHeating, Ventilation and Air-conditioning
CNNConvolutional Neural Network
ANNArtificial Neural Network
FNNFeedforward Neural Network
PSOParticle Swarm Optimization
HMMHidden Markov Model
ResNetResidual Neural Network
VGGVisual Geometry Group
CO2Carbon Dioxide
PIRPassive Infrared
CARTClassification and Regression Trees
KNNK-Nearest Neighbors
GLCMGray-Level Co-Occurrence Matrix
SVMSupport Vector Machine
LDALinear Discriminant Analysis
PCAPrincipal Component Analysis
CVCross Validation
AUCArea Under the Curve
ROCReceiver Operating Characteristic
STDStandard Deviation
ACCAccuracy
DWTDiscrete Wavelet Transform
CWTContinuous Wavelet Transform

Appendix A

Figure A1. Wavelet families.

Appendix B

Remotesensing 13 03847 i001

Appendix C

Figure A2. (a) The eight angles for directions, (b) computation of co-occurrence matrix, (c) image (d) image and grey-level co-occurrence matrix of the image.

Appendix D

Figure A3. Computation of feature vectors from co-occurrence matrix.

Appendix E

Remotesensing 13 03847 i002

Appendix F

Remotesensing 13 03847 i003

References

  1. Acquaah, Y.; Steele, J.B.; Gokaraju, B.; Tesiero, R.; Monty, G.H. Occupancy Detection for Smart HVAC Efficiency in Building Energy: A Deep Learning Neural Network Framework using Thermal Imagery. In Proceedings of the 2020 IEEE Applied Imagery Pattern Recognition Workshop (AIPR), Washington DC, USA, 13–15 October 2020; pp. 1–6. [Google Scholar] [CrossRef]
  2. He, K.; Zhang, X.; Ren, S.; Sun, J. Deep Residual Learning for Image Recognition. In Proceedings of the 2016 IEEE Conference on Computer Vision and Pattern Recognition (CVPR), Las Vegas, NV, USA, 27–30 June 2016; pp. 770–778. [Google Scholar]
  3. Simonyan, K.; Zisserman, A. Very Deep Convolutional Networks for Large-Scale Image Recognition. arXiv 2014, arXiv:1409.1556. [Google Scholar]
  4. Kumar, S.; Singh, J.; Singh, O. Ensemble-based extreme learning machine model for occupancy detection with ambient attributes. Int. J. Syst. Assur. Eng. Manag. 2020, 11, 173–183. [Google Scholar] [CrossRef]
  5. Vela, A.; Alvarado-Uribe, J.; Davila, M.; Hernandez-Gress, N.; Ceballos, H.G. Estimating Occupancy Levels in Enclosed Spaces Using Environmental Variables: A Fitness Gym and Living Room as Evaluation Scenarios. Sensors 2020, 20, 6579. [Google Scholar] [CrossRef]
  6. Weber, M.; Doblander, C.; Mandl, P. Towards the Detection of Building Occupancy with Synthetic Environmental Data. arXiv 2020, arXiv:2010.04209. [Google Scholar]
  7. Wang, C.; Jiang, J.; Roth, T.; Nguyen, C.; Liu, Y.; Lee, H. Integrated sensor data processing for occupancy detection in residential buildings. Energy Build. 2021, 237, 110810. [Google Scholar] [CrossRef]
  8. Ivasic-Kos, M.; Kristo, M.; Pobar, M. Person Detection in Thermal Videos Using YOLO. In Proceedings of the Intelligent Systems and Applications, Cham, Switzerland, 24 August 2019; pp. 254–267. [Google Scholar]
  9. Yang, D.B.; Gonzalez-Banos, H.H.; Guibas, L.J. Counting people in crowds with a real-time network of simple image sensors. In Proceedings of the Ninth IEEE International Conference on Computer Vision, Washington, DC, USA, 13–16 October 2003; Volume 121, pp. 122–129. [Google Scholar]
  10. Lu, S.; Hameen, E.; Aziz, A. Dynamic HVAC Operations with Real-Time Vision-Based Occupant Recognition System. In Proceedings of the 2018 ASHRAE Winter Conference, Chicago, IL, USA, 20–24 January 2018. [Google Scholar]
  11. Gomez, A.; Conti, F.; Benini, L. Thermal image-based CNN’s for ultra-low power people recognition. In Proceedings of the 15th ACM International Conference on Computing Frontiers, Ischia, Italy, 8–10 May 2018; pp. 326–331. [Google Scholar]
  12. Yuan, Y.; Li, X.; Liu, Z.; Guan, X. Occupancy Estimation in Buildings Based on Infrared Array Sensors Detection. IEEE Sens. J. 2019, 20, 1043–1053. [Google Scholar] [CrossRef]
  13. Gokaraju, B.; Durbha, S.S.; King, R.L.; Younan, N.H. A Machine Learning Based Spatio-Temporal Data Mining Approach for Detection of Harmful Algal Blooms in the Gulf of Mexico. IEEE J. Sel. Top. Appl. Earth Obs. Remote Sens. 2011, 4, 710–720. [Google Scholar] [CrossRef]
  14. Palacharla, P.K.; Durbha, S.S.; King, R.L.; Gokaraju, B.; Lawrence, G.W. A hyperspectral reflectance data based model inversion methodology to detect reniform nematodes in cotton. In Proceedings of the 2011 6th International Workshop on the Analysis of Multi-temporal Remote Sensing Images (Multi-Temp), Trento, Italy, 12–14 July 2011; pp. 249–252. [Google Scholar]
  15. Gokaraju, B.; Nobrega, R.A.A.; Doss, D.A.; Turlapaty, A.C.; Tesiero, R.C. Data fusion of multi-source satellite data sets for cost-effective disaster management studies. In Proceedings of the SoutheastCon 2017, Concord, NC, USA, 30 March–2 April 2017; pp. 1–5. [Google Scholar] [CrossRef]
  16. Gokaraju, B.; Durbha, S.S.; King, R.L.; Younan, N.H. Sensor web and data mining approaches for Harmful algal bloom detection and monitoring in the Gulf of Mexico region. In Proceedings of the 2009 IEEE International Geoscience and Remote Sensing Symposium, Rondebosch, South Africa, 12 July 2009. [Google Scholar] [CrossRef]
  17. Gokaraju, B.; Agrawal, R.; Doss, D.A.; Bhattacharya, S. Identification of Spatio- Temporal Patterns in Cyber Security for Detecting the Signature Identity of Hacker. In Proceedings of the SoutheastCon 2018, St. Petersburg, FL, USA, 19–22 April 2018; pp. 1–5. [Google Scholar]
  18. Van Oosterhout, T.; Bakkes, S.; Krose, B. Head detection in stereo data for people counting and segmentation. In Proceedings of the Sixth International Conference on Computer Vision Theory and Applications, Vilamoura, Portugal, 5–7 March 2011; pp. 620–625. [Google Scholar] [CrossRef] [Green Version]
  19. Parise, A.; Manso-Callejo, M.A.; Cao, H.; Mendonca, M.; Kohli, H.; Wachowicz, M. Indoor Occupancy Prediction using an IoT Platform. In Proceedings of the 2019 Sixth International Conference on Internet of Things: Systems, Management and Security (IOTSMS), Granada, Spain, 22–25 October 2019; pp. 26–31. [Google Scholar]
  20. Beltran, A.; Erickson, V.; Cerpa, A. ThermoSense: Occupancy Thermal Based Sensing for HVAC Control. In Proceedings of the 5th ACM Workshop on Embedded Systems for Energy-Efficient Buildings, Roma, Italy, 11–15 November 2013; pp. 1–8. [Google Scholar]
  21. Zappi, P.; Farella, E.; Benini, L. Enhancing the spatial resolution of presence detection in a PIR based wireless surveillance network. In Proceedings of the 2007 IEEE Conference on Advanced Video and Signal Based Surveillance, London, UK, 5–7 September 2007; pp. 295–300. [Google Scholar] [CrossRef]
  22. Tyndall, A.; Cardell-Oliver, R.; Keating, A. Occupancy Estimation Using a Low-Pixel Count Thermal Imager. IEEE Sens. J. 2016, 16, 3784–3791. [Google Scholar] [CrossRef]
  23. Sirmacek, B.; Riveiro, M. Occupancy Prediction Using Low-Cost and Low-Resolution Heat Sensors for Smart Offices. Sensors 2020, 20, 5497. [Google Scholar] [CrossRef] [PubMed]
  24. Zou, H.; Zhou, Y.; Yang, J.; Spanos, C.J. Device-free occupancy detection and crowd counting in smart buildings with WiFi-enabled IoT. Energy Build. 2018, 174, 309–322. [Google Scholar] [CrossRef]
  25. Wang, J.; Tse, N.C.F.; Chan, J.Y.C. Wi-Fi based occupancy detection in a complex indoor space under discontinuous wireless communication: A robust filtering based on event-triggered updating. Build. Environ. 2019, 151, 228–239. [Google Scholar] [CrossRef]
  26. Nivetha, V.; Subathra, B.; Srinivasan, S. Wi-Fi based Occupancy Detection in a Building with Indoor Localization. In Proceedings of the 2019 IEEE International Conference on Intelligent Techniques in Control, Optimization and Signal Processing (INCOS), Virudhunagar, India, 11–13 April 2019; pp. 1–4. [Google Scholar]
  27. Simma, K.C.J.; Mammoli, A.; Bogus, S.M. Real-Time Occupancy Estimation Using WiFi Network to Optimize HVAC Operation. Procedia Comput. Sci. 2019, 155, 495–502. [Google Scholar] [CrossRef]
  28. Fatema, N.; Malik, H. Data-Driven Occupancy Detection Hybrid Model Using Particle Swarm Optimization Based Artificial Neural Network. In Metaheuristic and Evolutionary Computation: Algorithms and Applications; Springer: Singapore, 2020; pp. 283–297. [Google Scholar] [CrossRef]
  29. Tien, P.W.; Wei, S.; Calautit, J.K.; Darkwa, J.; Wood, C. A vision-based deep learning approach for the detection and prediction of occupancy heat emissions for demand-driven control solutions. Energy Build. 2020, 226, 110386. [Google Scholar] [CrossRef]
  30. Sharma, P.; Xu, G.; Hui, X.; Hysell, D.L.; Kan, E.C. Deep-Learning-Based Occupant Counting by Ambient RF Sensing. IEEE Sens. J. 2020, 21, 8564–8574. [Google Scholar] [CrossRef]
  31. Rueda, L.; Agbossou, K.; Cardenas, A.; Henao, N.; Kelouwani, S. A comprehensive review of approaches to building occupancy detection. Build. Environ. 2020, 180, 106966. [Google Scholar] [CrossRef]
  32. Metwaly, A.; Peña Queralta, J.; Sarker, V.; Nguyen gia, T.; Nasir, O.; Westerlund, T. Edge Computing with Embedded AI: Thermal Image Analysis for Occupancy Estimation in Intelligent Buildings. In Proceedings of the INTelligent Embedded Systems Architectures and Applications, INTESA@ESWEEK 2019, New York, NY, USA, 13–18 October 2019. [Google Scholar]
  33. Feng, C.; Mehmani, A.; Zhang, J. Deep Learning-Based Real-Time Building Occupancy Detection Using AMI Data. IEEE Trans. Smart Grid 2020, 11, 4490–4501. [Google Scholar] [CrossRef]
  34. Khalil, M.; McGough, S.; Pourmirza, Z.; Pazhoohesh, M.; Walker, S. Transfer Learning Approach for Occupancy Prediction in Smart Buildings. In Proceedings of the 12th International Renewable Engineering Conference (IREC), Amman, Jordan, 14–15 April 2021; pp. 1–6. [Google Scholar]
  35. Chen, Z.; Jiang, C.; Masood, M.K.; Soh, Y.C.; Wu, M.; Li, X. Deep Learning for Building Occupancy Estimation Using Environmental Sensors. In Deep Learning: Algorithms and Applications; Springer International Publishing: New York, NY, USA, 2019; pp. 335–357. [Google Scholar] [CrossRef]
  36. Bruna, J.; Mallat, S. Invariant Scattering Convolution Networks. IEEE Trans. Pattern Anal. Mach. Intell. 2013, 35, 1872–1886. [Google Scholar] [CrossRef] [PubMed] [Green Version]
  37. Anden, J.; Mallat, S. Deep Scattering Spectrum. IEEE Trans. Signal Process. 2014, 62, 4114–4128. [Google Scholar] [CrossRef] [Green Version]
  38. Sepúlveda, A.; Castillo, F.; Palma, C.; Rodriguez-Fernandez, M. Emotion Recognition from ECG Signals Using Wavelet Scattering and Machine Learning. Appl. Sci. 2021, 11, 4945. [Google Scholar] [CrossRef]
  39. Ma, S.; Cheng, B.; Shang, Z.; Liu, G. Scattering transform and LSPTSVM based fault diagnosis of rotating machinery. Mech. Syst. Signal Process. 2017, 104, 155–170. [Google Scholar] [CrossRef]
  40. Minaee, S.; Abdolrashidi, A.; Wang, Y. Iris recognition using scattering transform and textural features. In Proceedings of the 2015 IEEE Signal Processing and Signal Processing Education Workshop (SP/SPE), Salt Lake City, UT, USA, 9–12 August 2015; pp. 37–42. [Google Scholar]
  41. Li, J.; Ke, L.; Du, Q.; Ding, X.; Chen, X.; Wang, D. Heart Sound Signal Classification Algorithm: A Combination of Wavelet Scattering Transform and Twin Support Vector Machine. IEEE Access 2019, 7, 179339–179348. [Google Scholar] [CrossRef]
  42. Saydjari, A.K.; Portillo, S.K.N.; Slepian, Z.; Kahraman, S.; Burkhart, B.; Finkbeiner, D.P. Classification of Magnetohydrodynamic Simulations Using Wavelet Scattering Transforms. Astrophys. J. 2021, 910, 122. [Google Scholar] [CrossRef]
  43. Bishop, C.M. Pattern Recognition and Machine Learning; Springer: New York, NY, USA, 2006. [Google Scholar]
Publisher’s Note: MDPI stays neutral with regard to jurisdictional claims in published maps and institutional affiliations.

Article Metrics

Citations

Article Access Statistics

Multiple requests from the same IP address are counted as one view.