
Monitoring of Spatiotemporal Change of Green Spaces in Relation to the Land Surface Temperature: A Case Study of Belgrade, Serbia

 ,
,
Abstract
:
1. Introduction
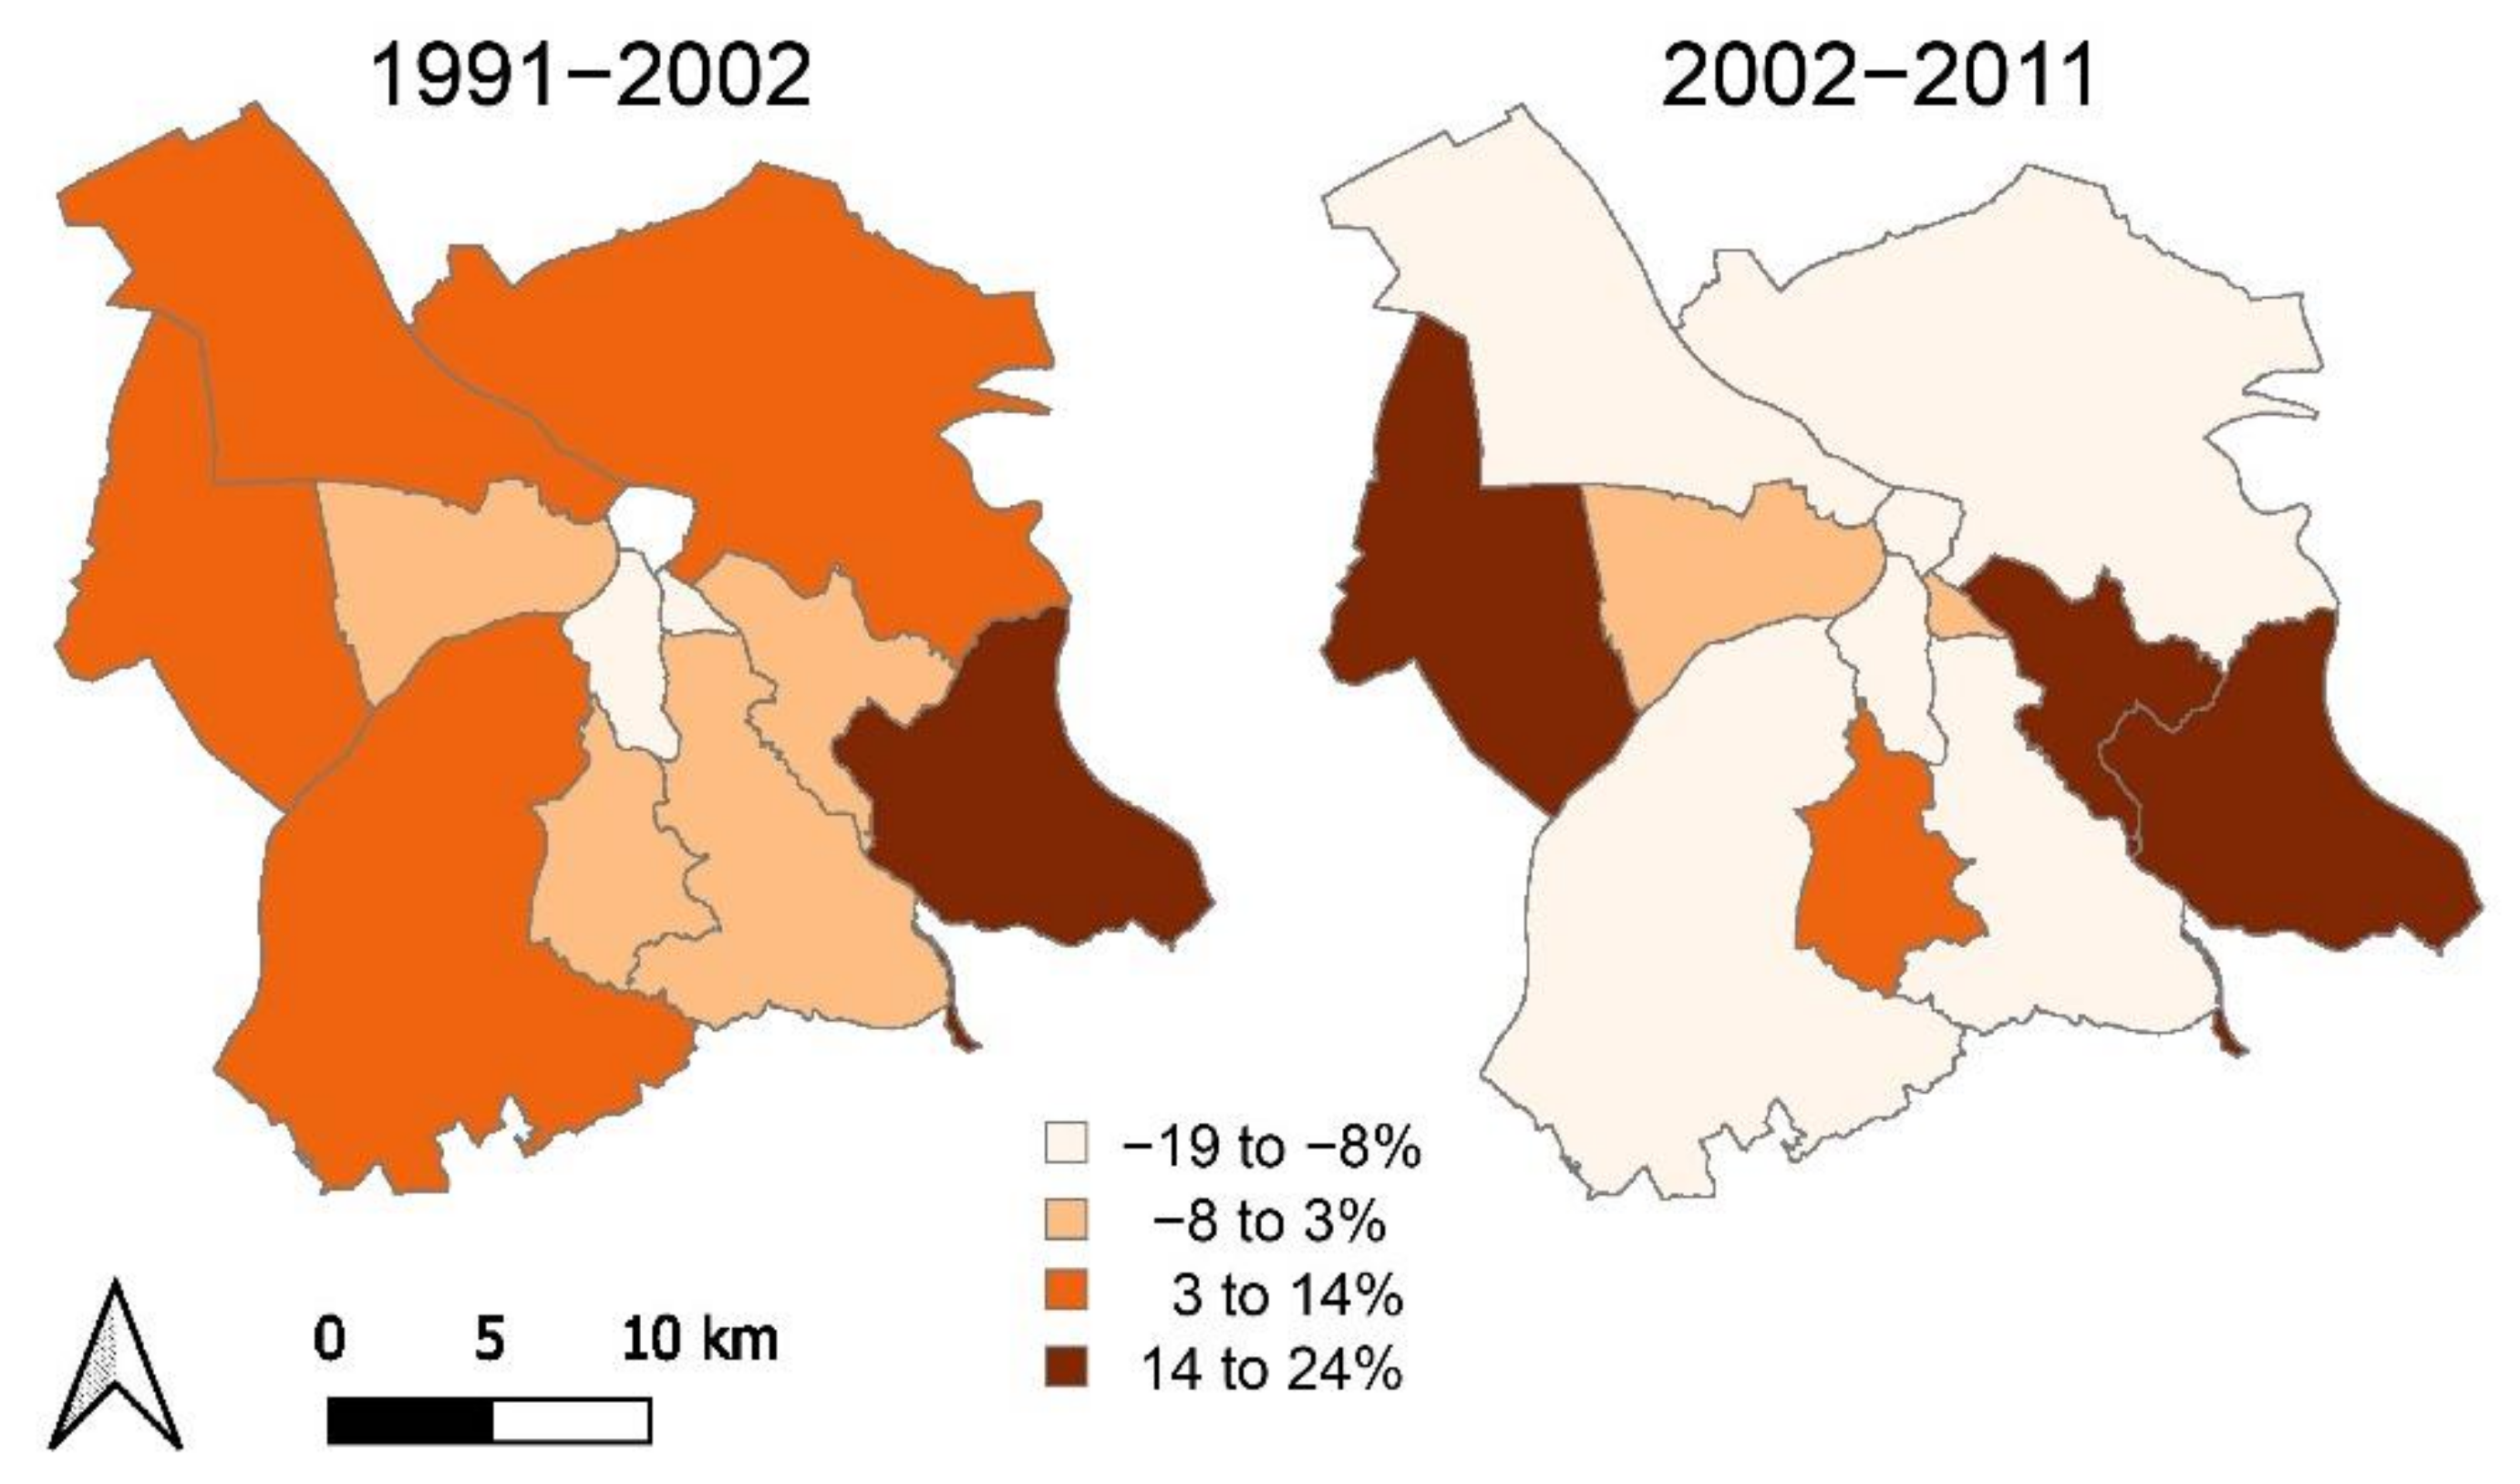
- How have green spaces changed in Belgrade in the last 3 decades (1991–2019)?
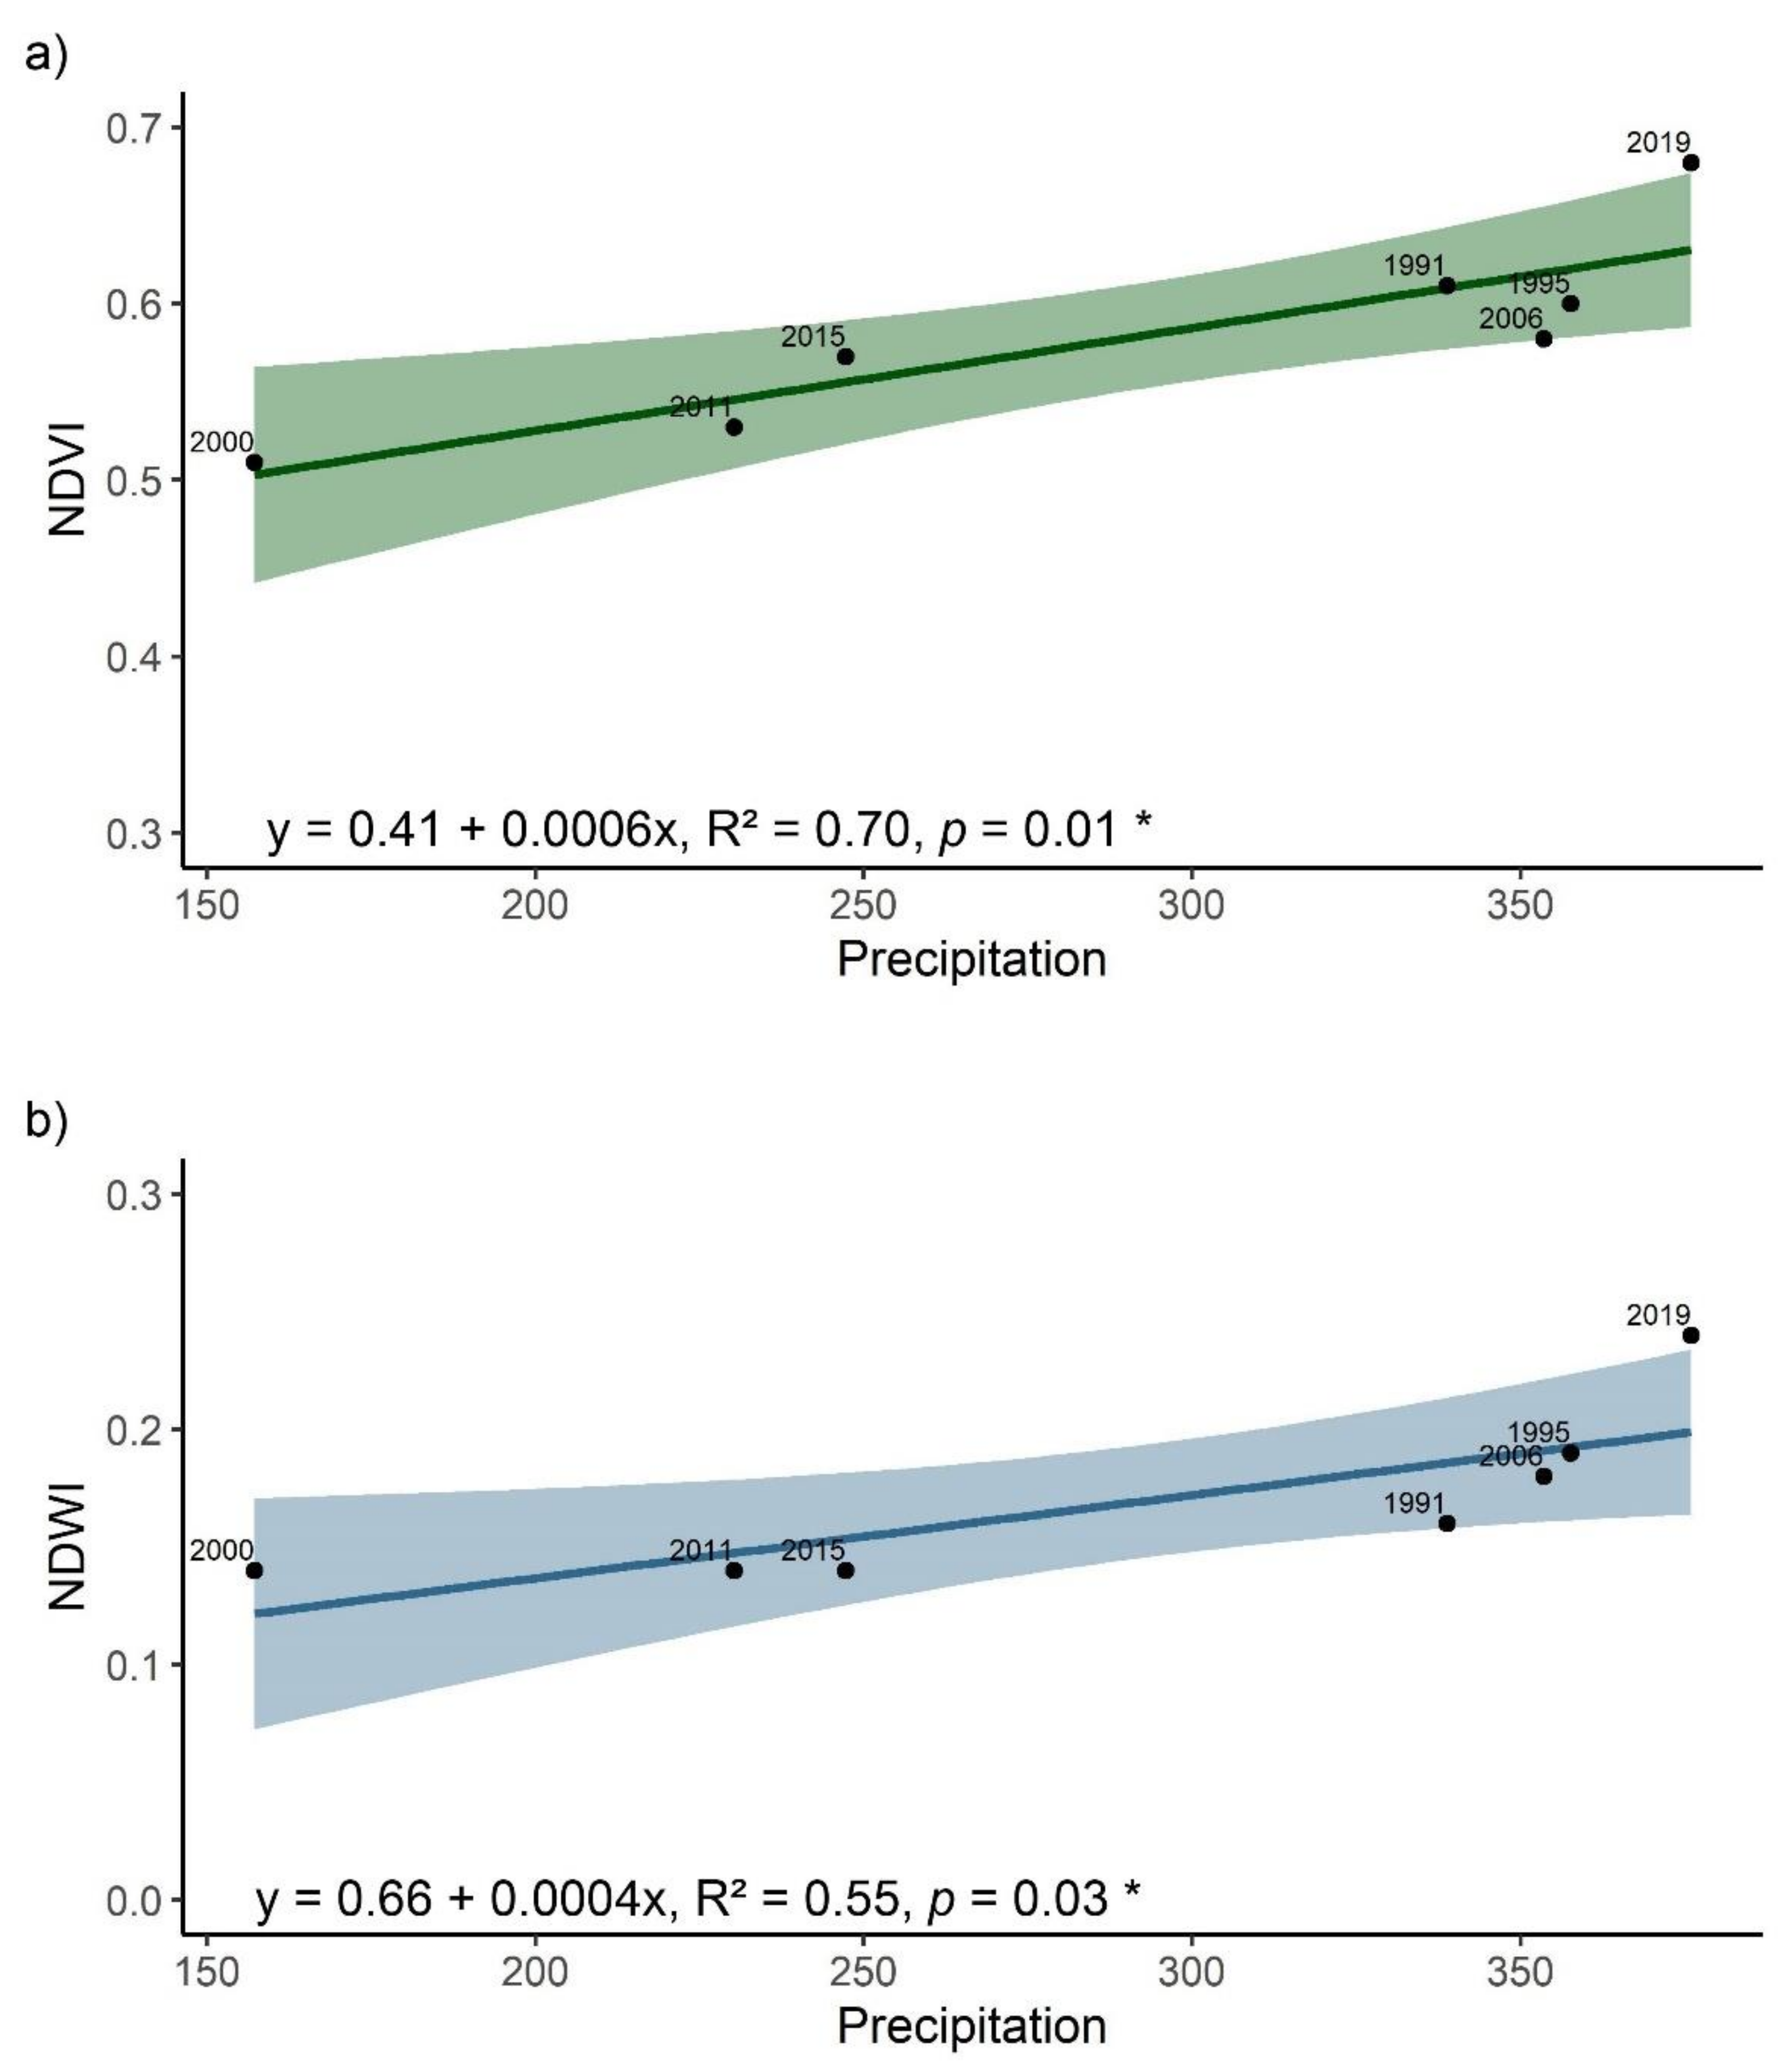
- What was the relationship between vegetation indices (the NDVI and the NDWI) and climate factors?
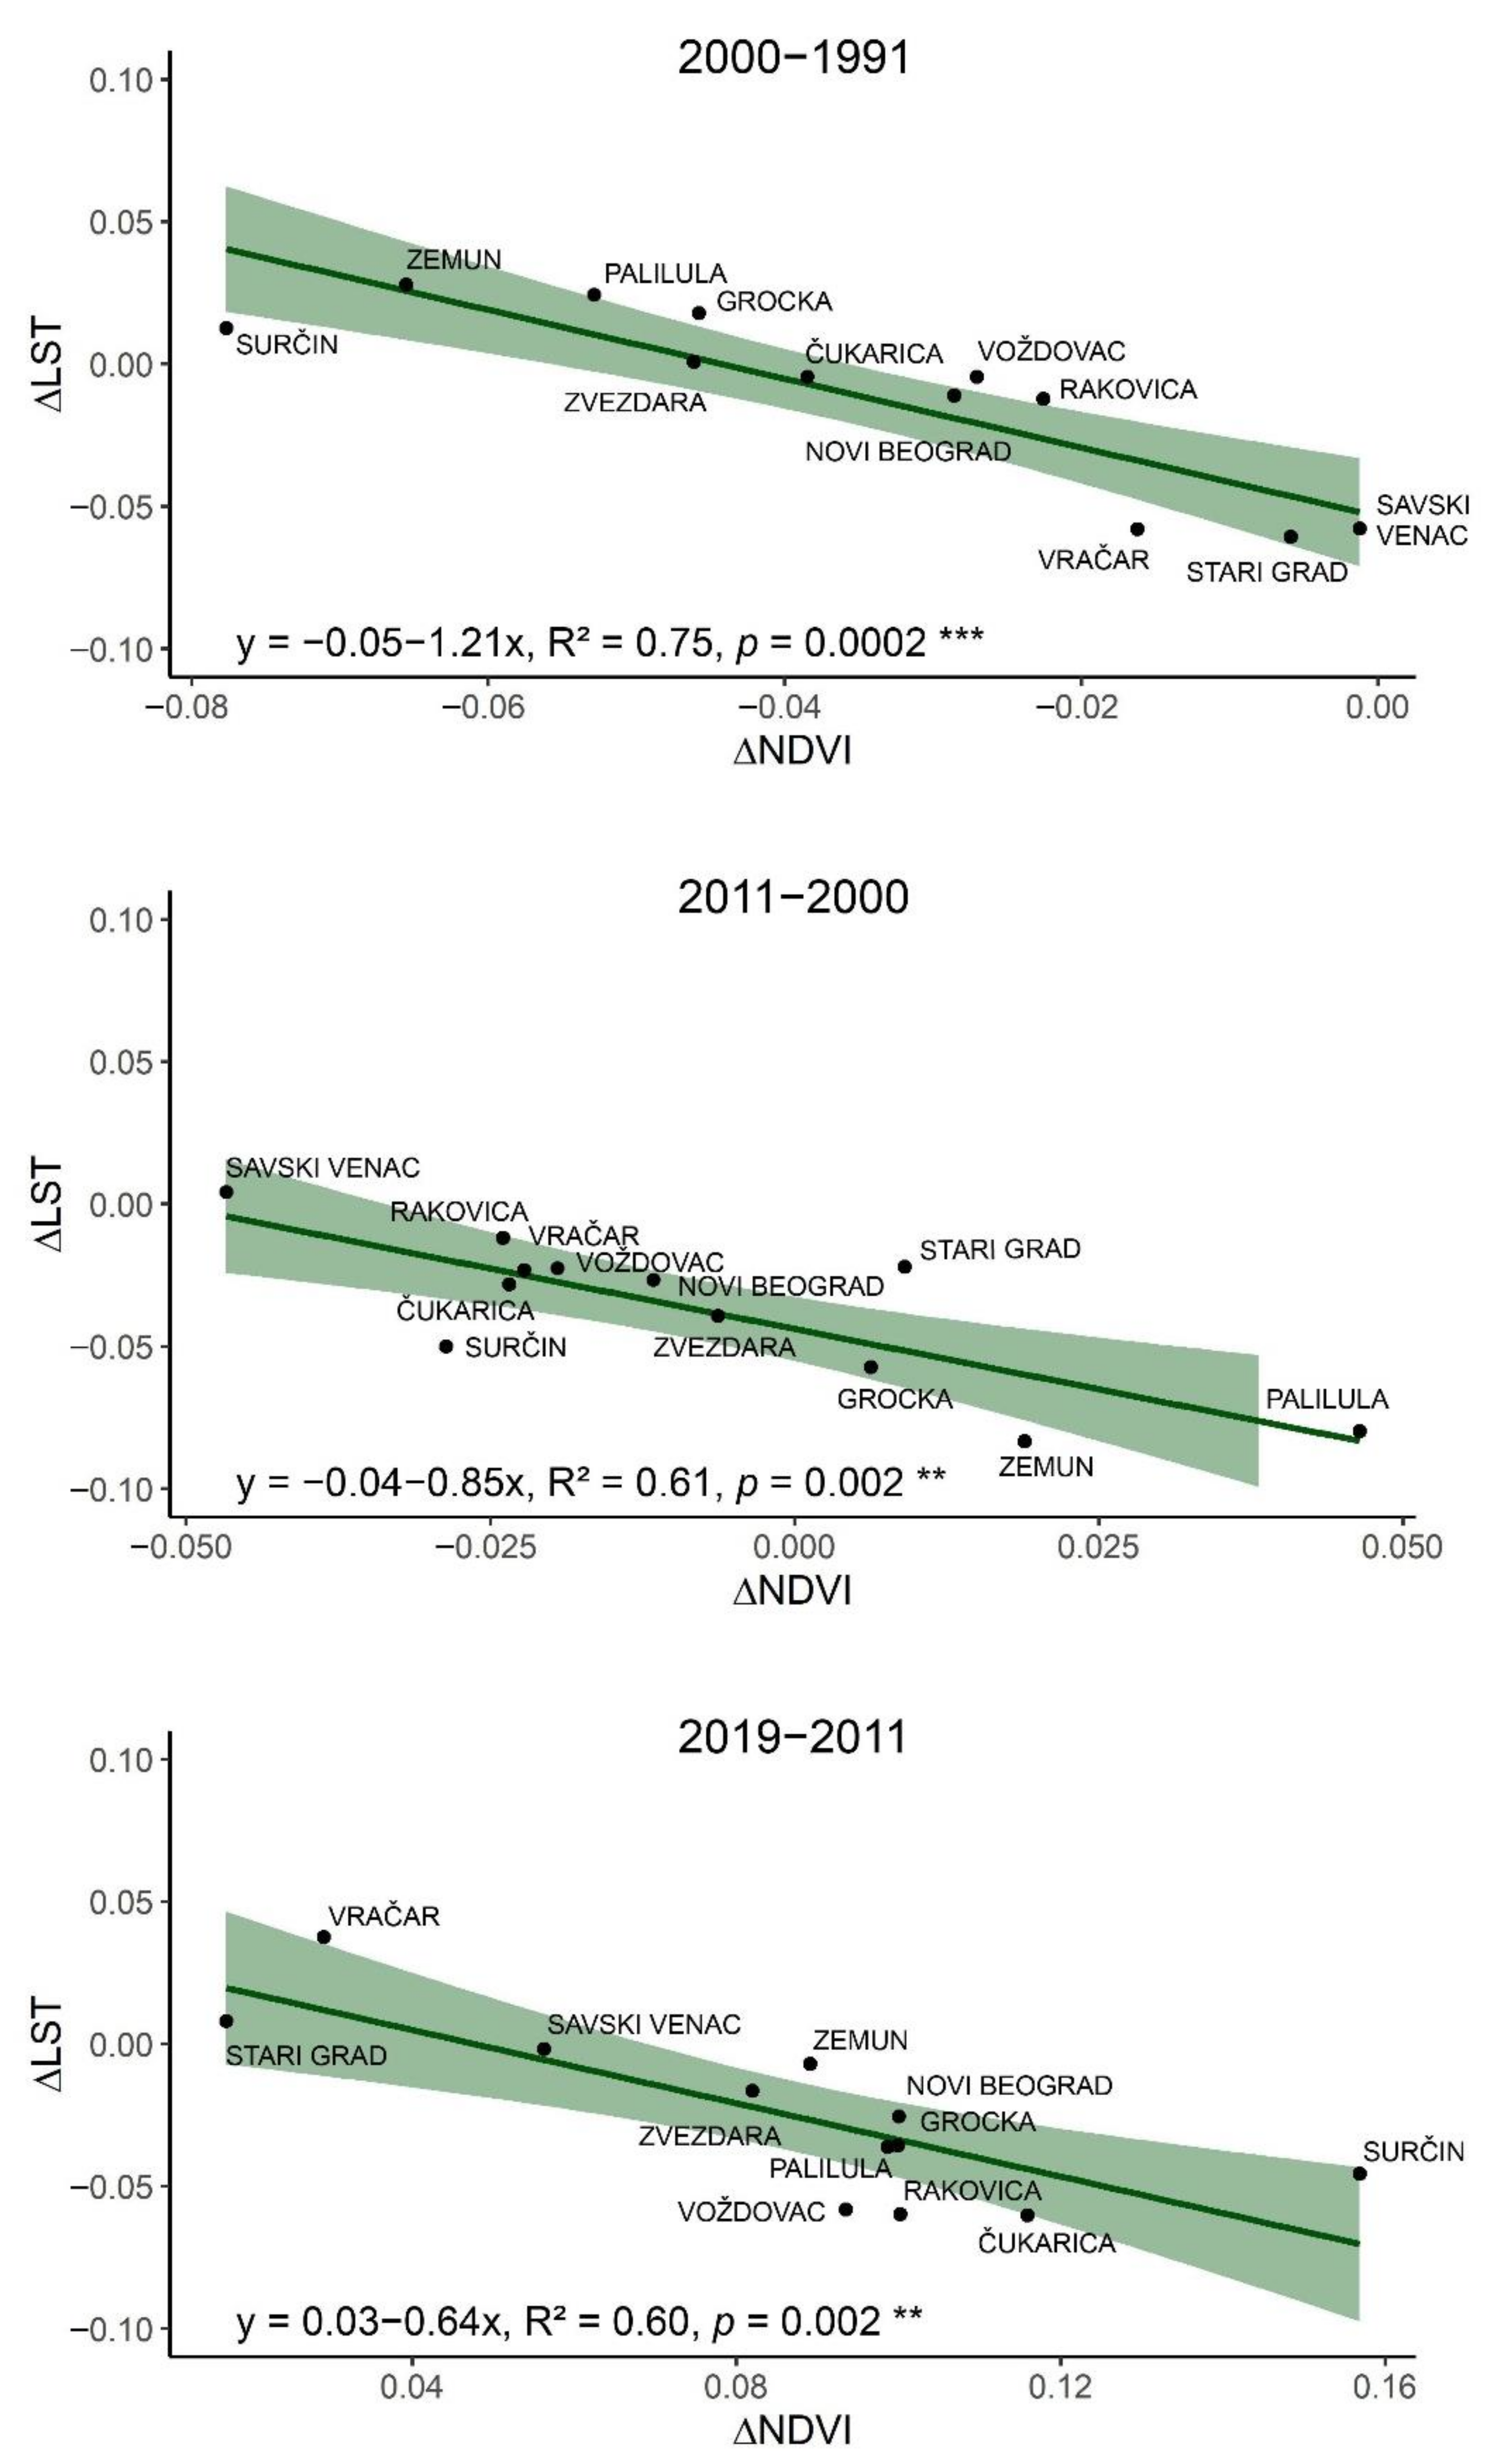
- What was the relationship between the change in vegetation indices (the NDVI and the NDWI) and change in the LST in different municipalities?
2. Materials and Methods
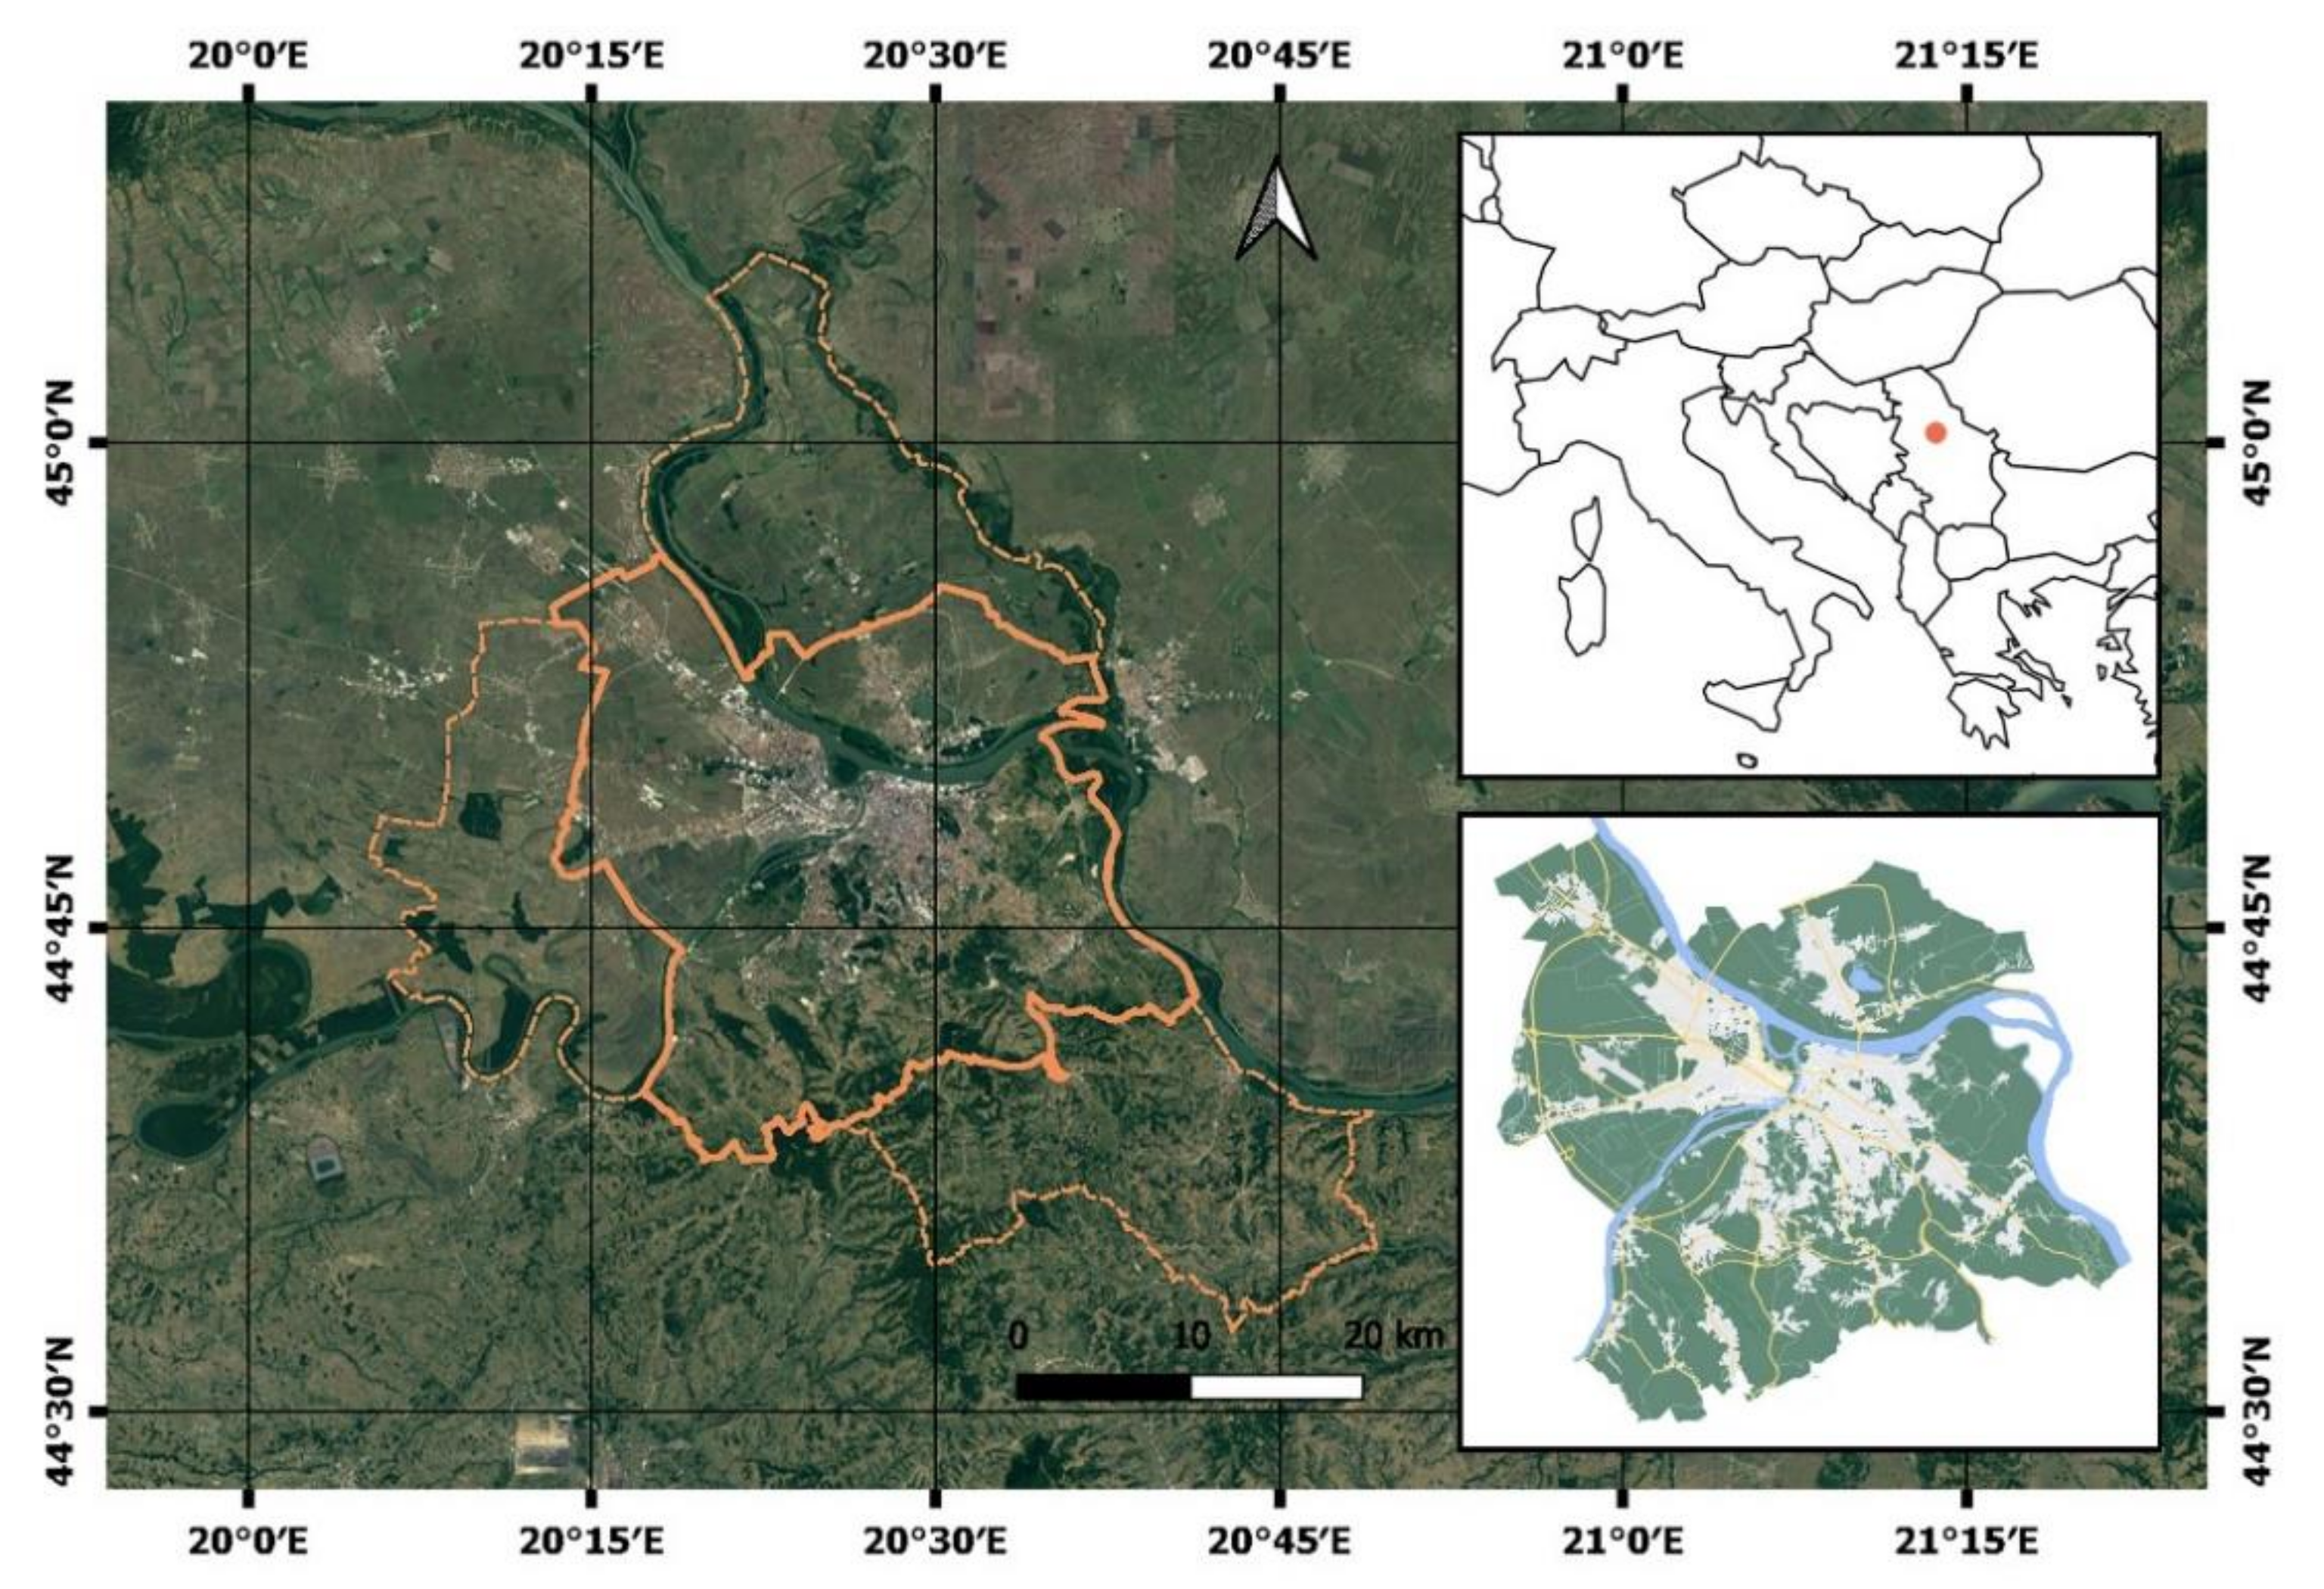
2.1. Study Area and Population
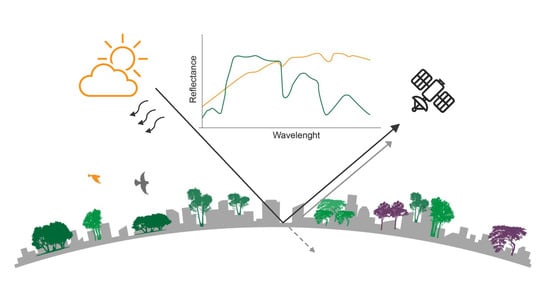
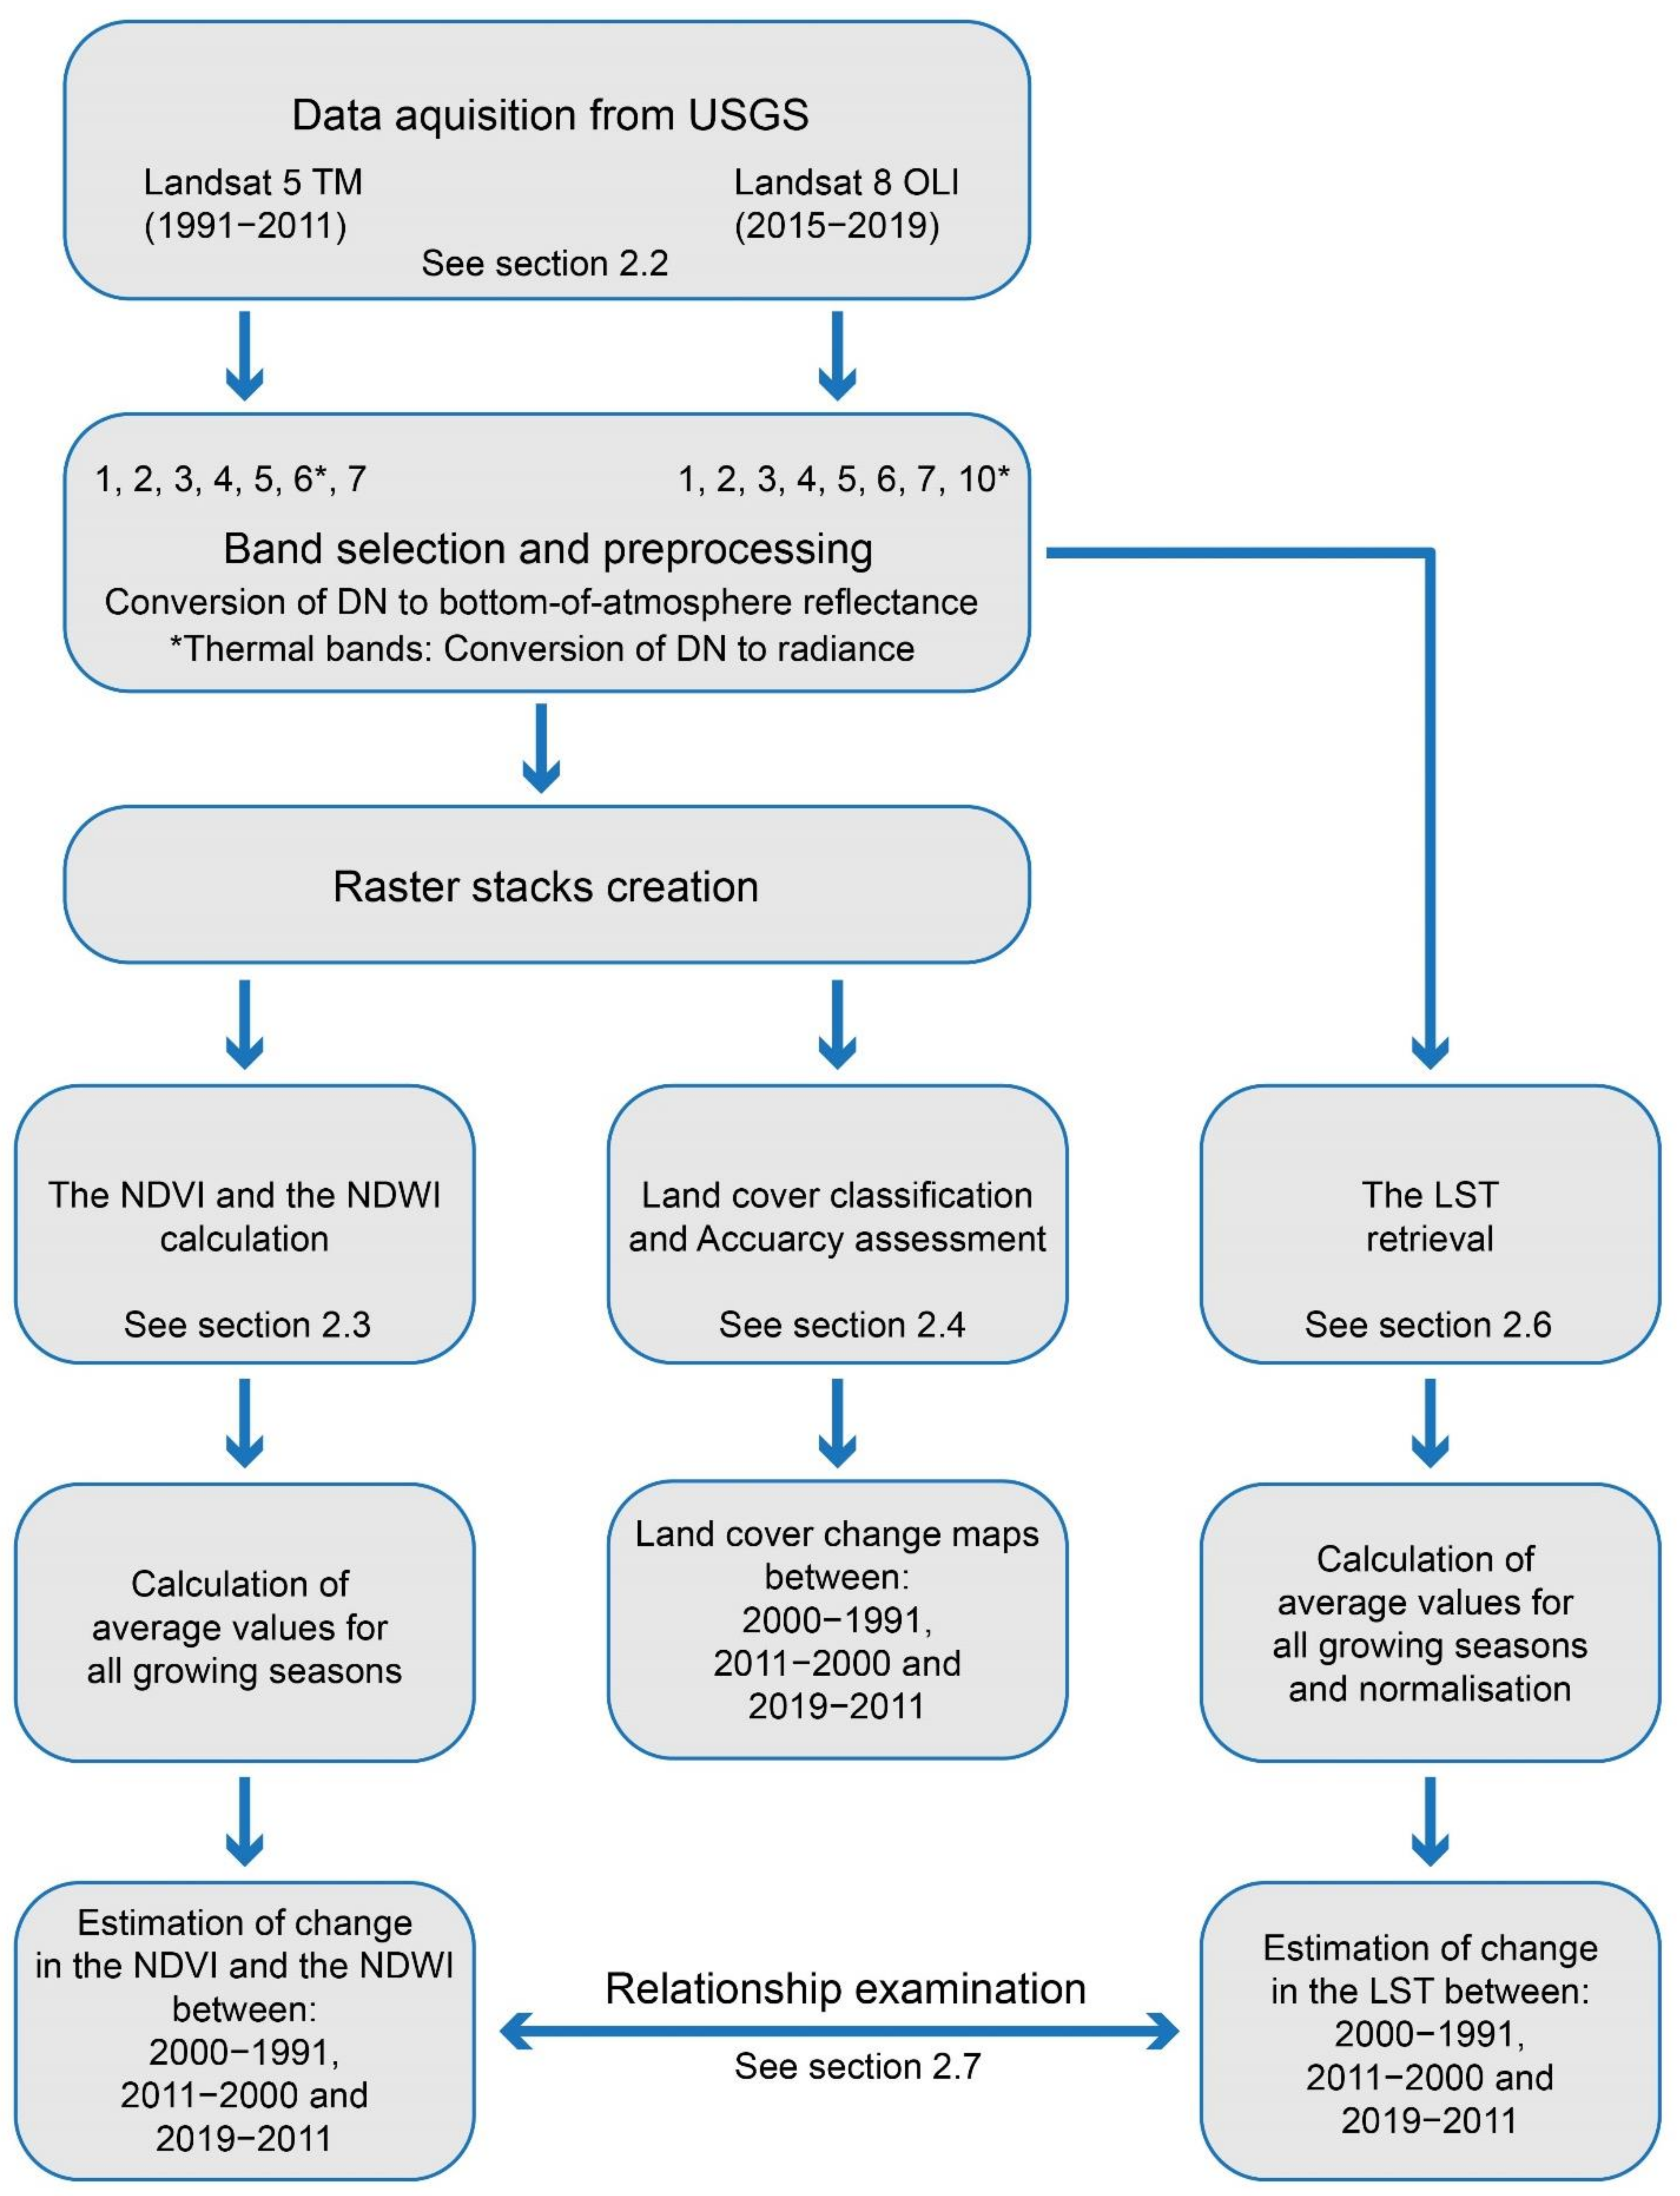
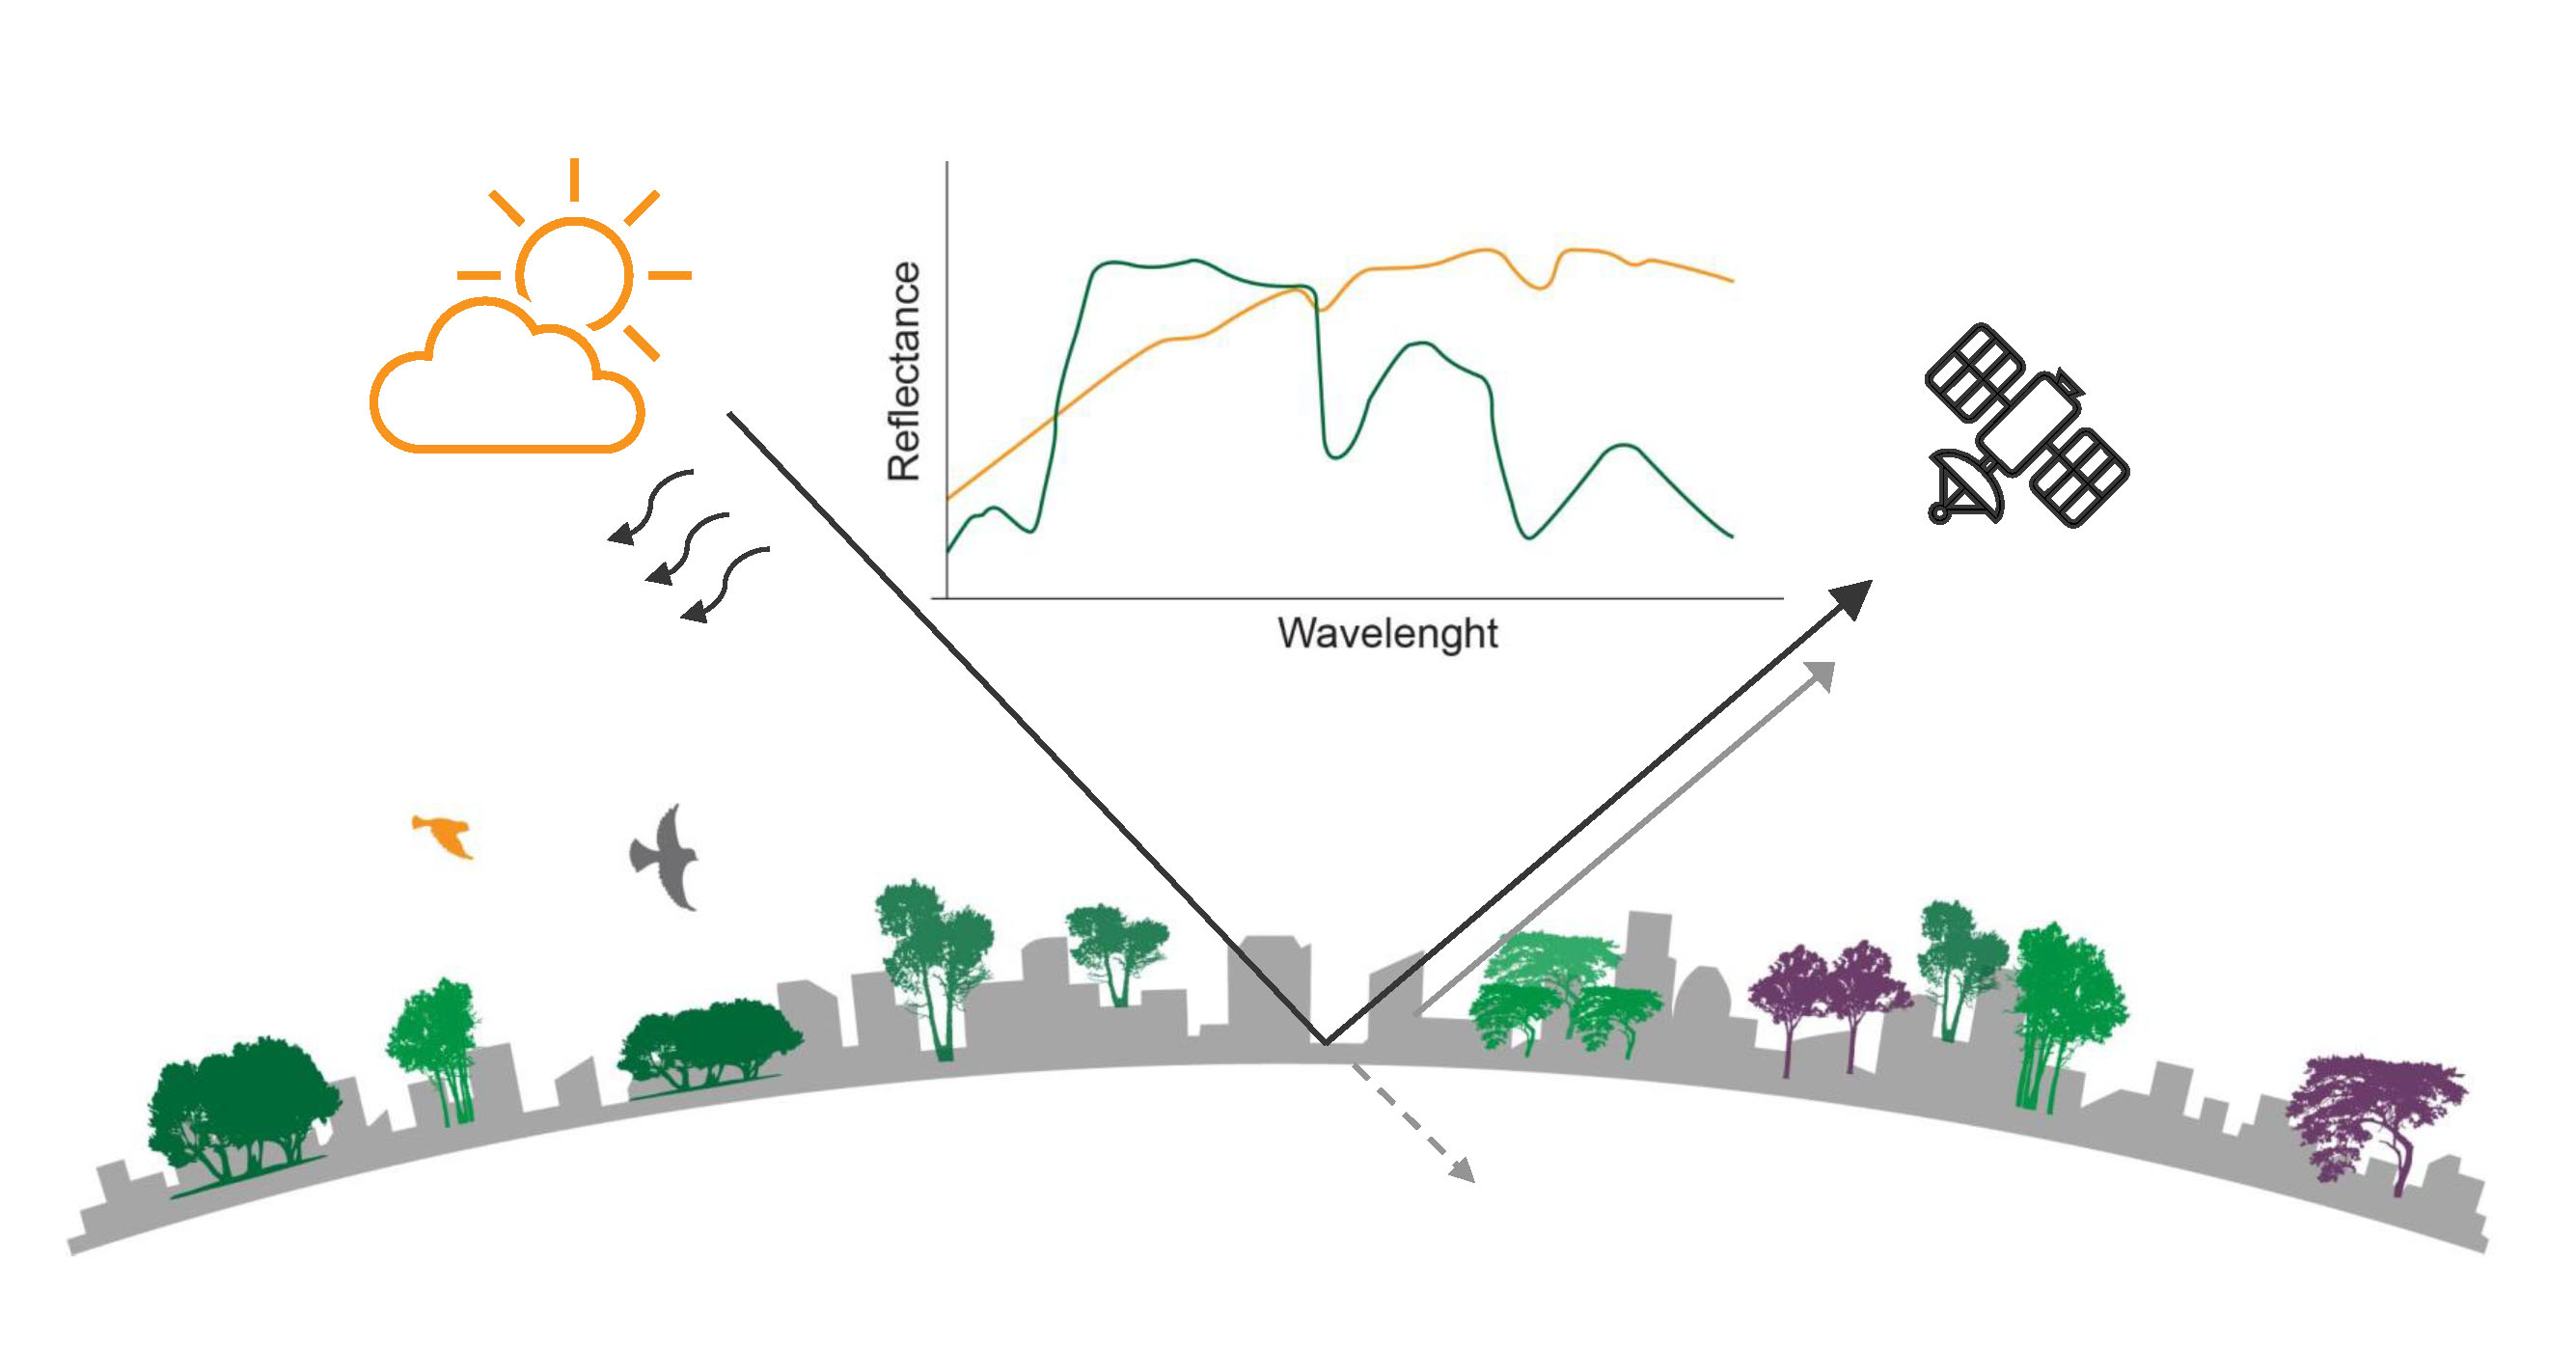
2.2. Satellite Imagery
2.3. Calculation of Spectral Vegetation Indices
2.4. Land Cover Classification and Accuracy Assessment
2.5. Relationship between Spectral Vegetation Indices and Climate Factors
2.6. LST Retrieval
2.7. Relationship between Change in the LST and Change in Spectral Vegetation Indices
3. Results
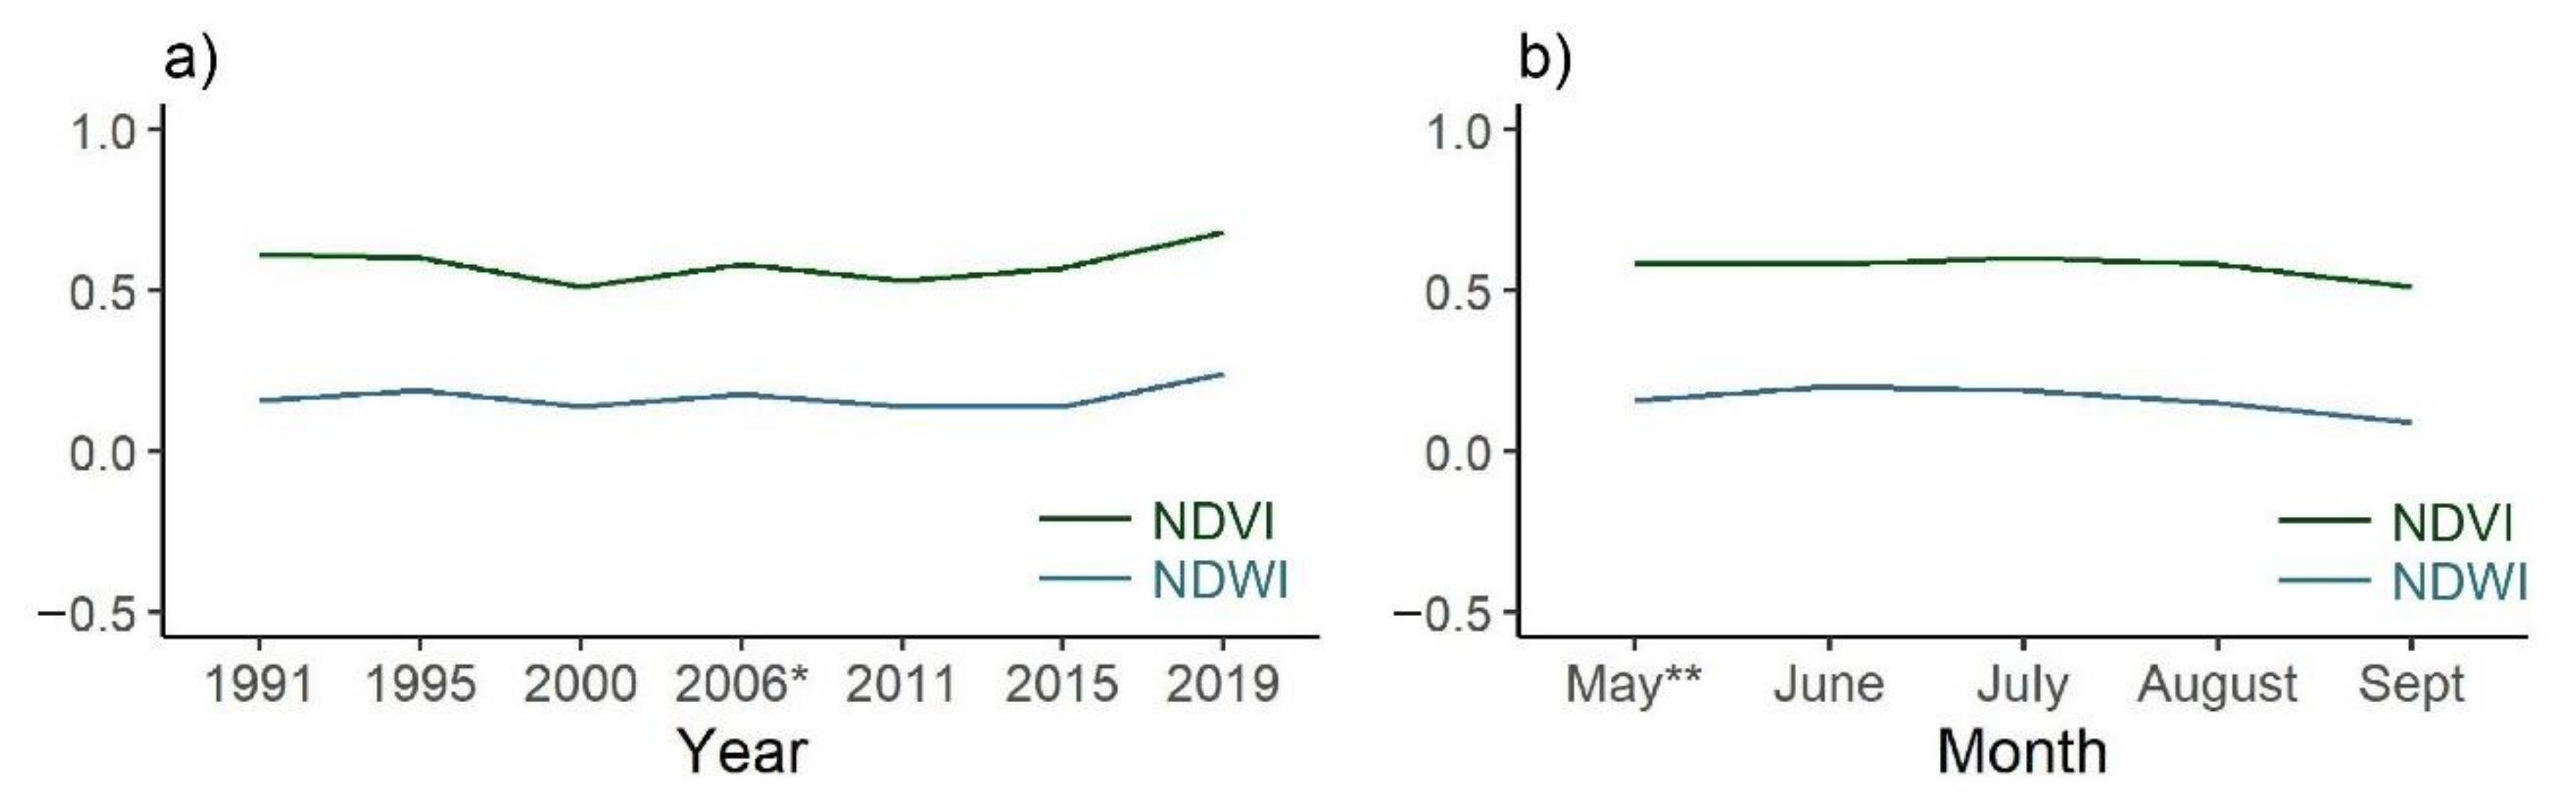
3.1. Spatiotemporal Patterns of Spectral Vegetation Indices
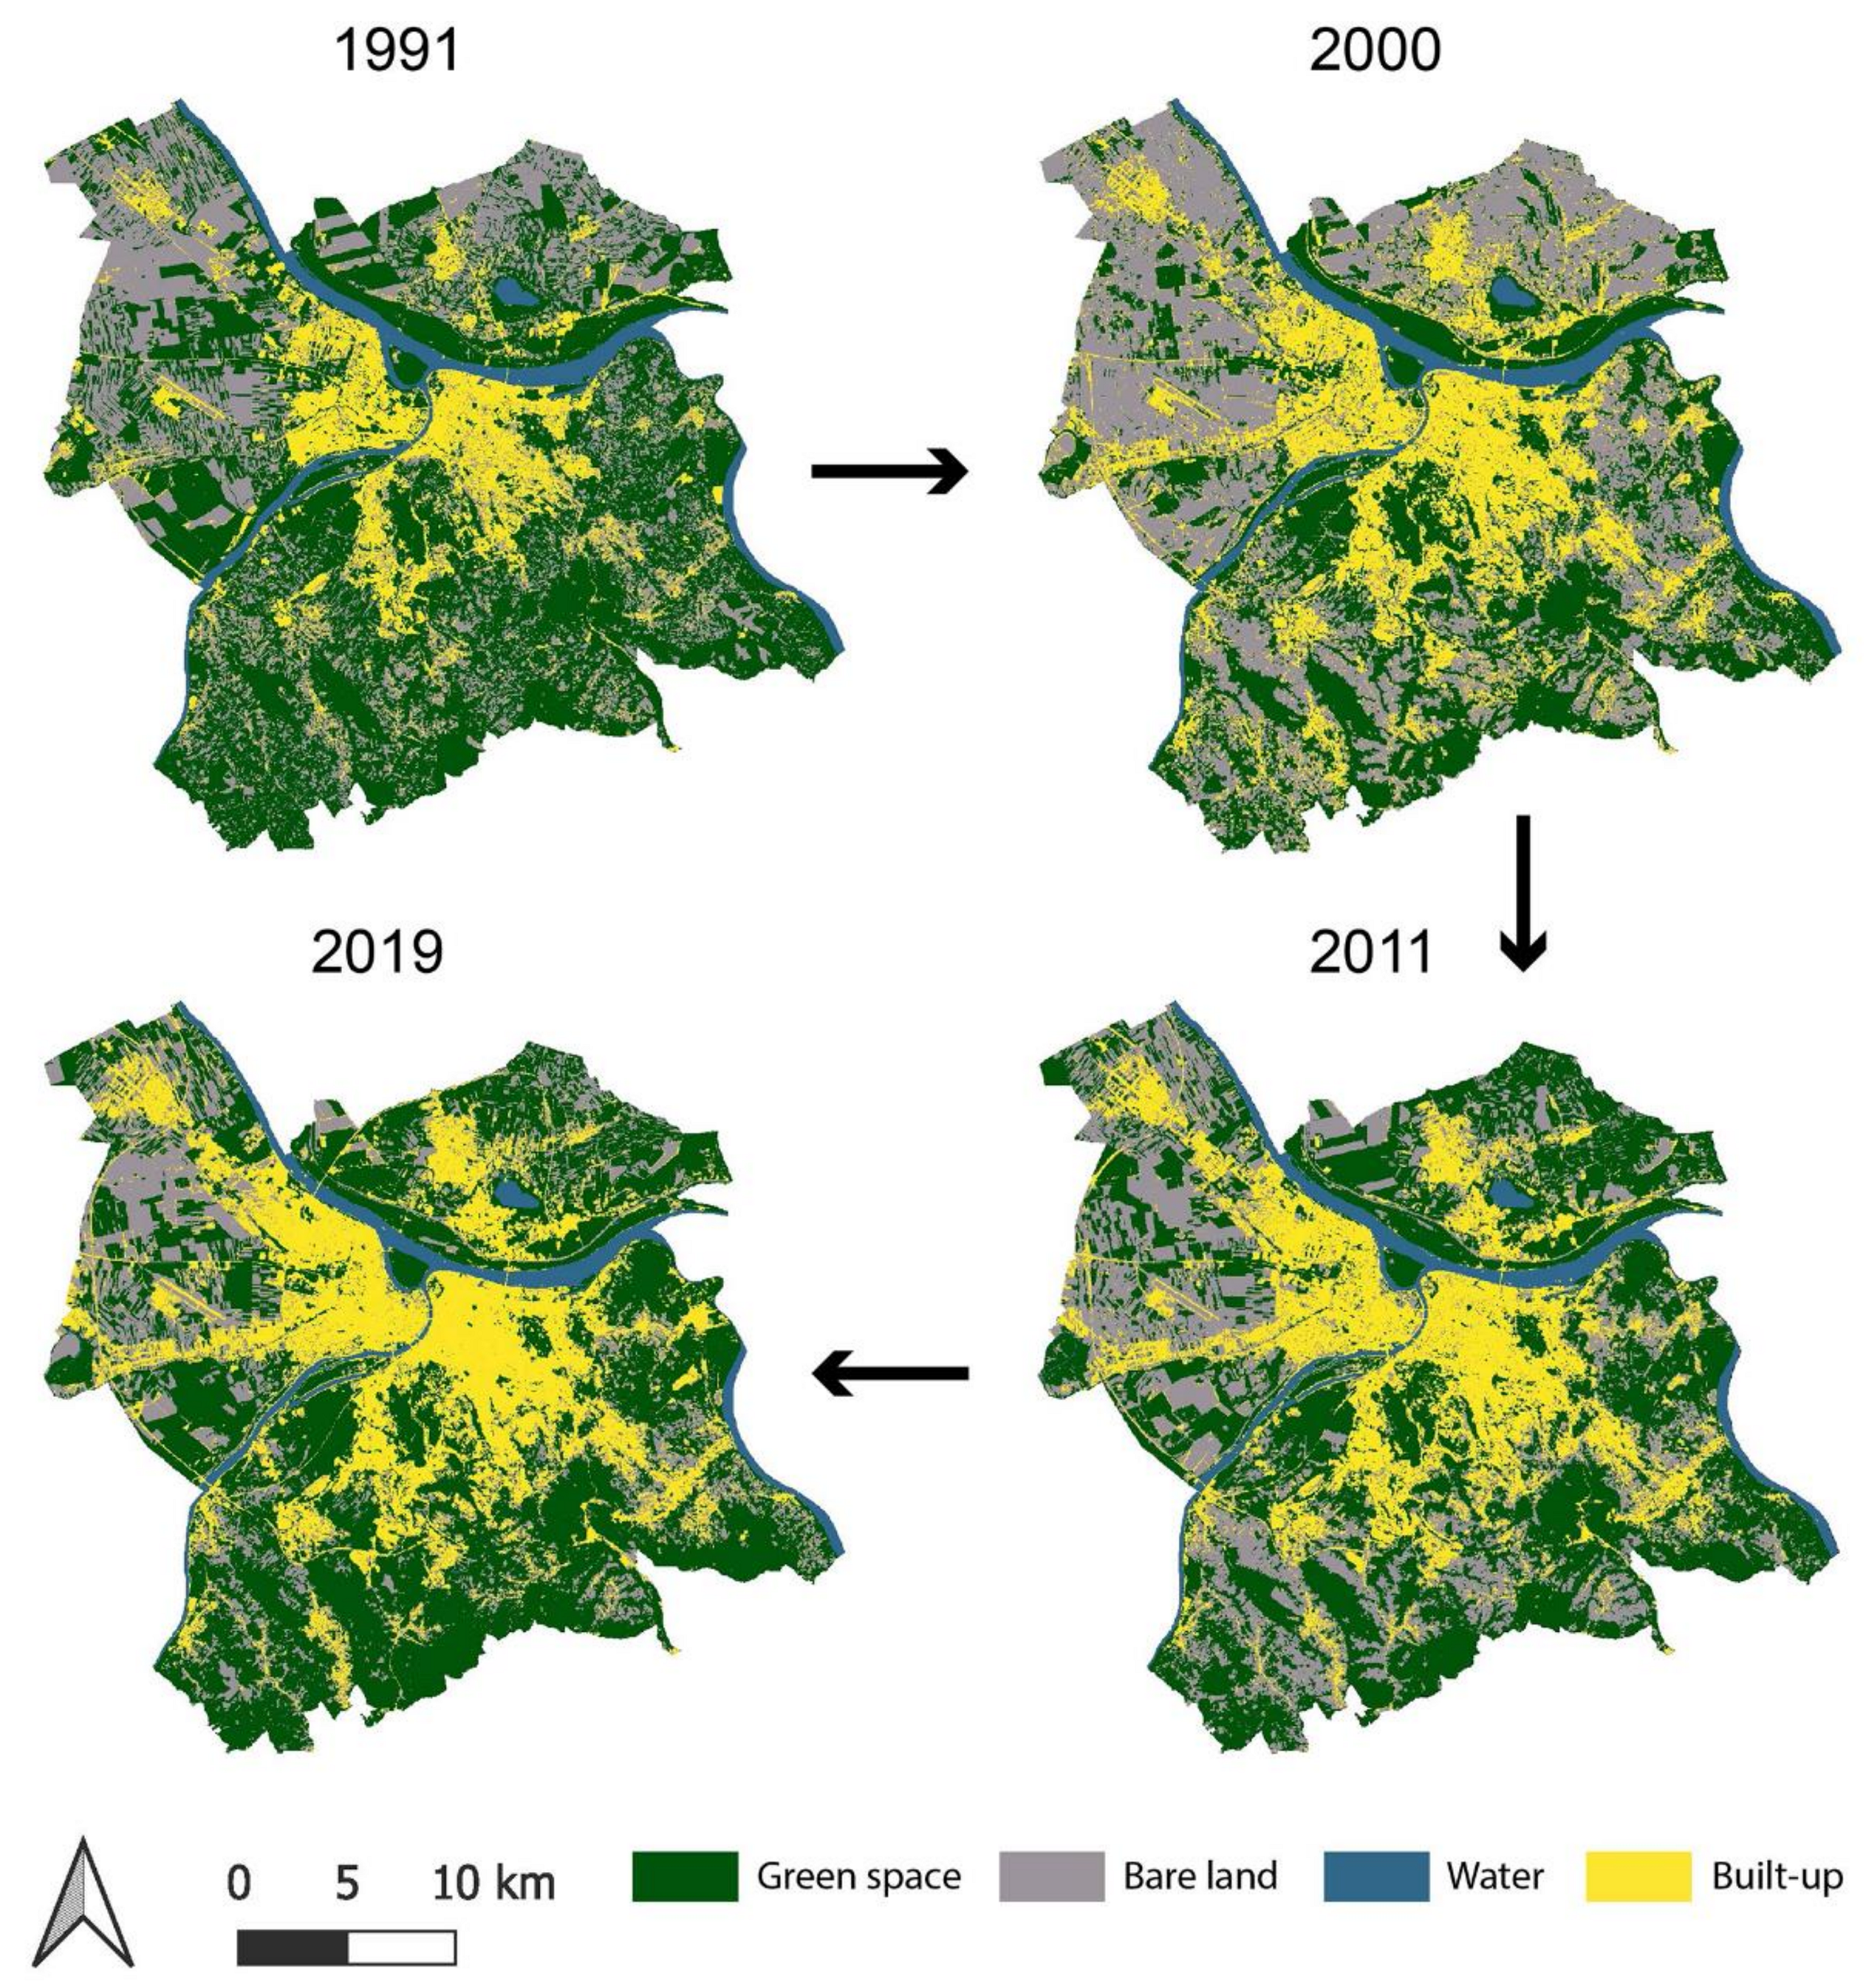
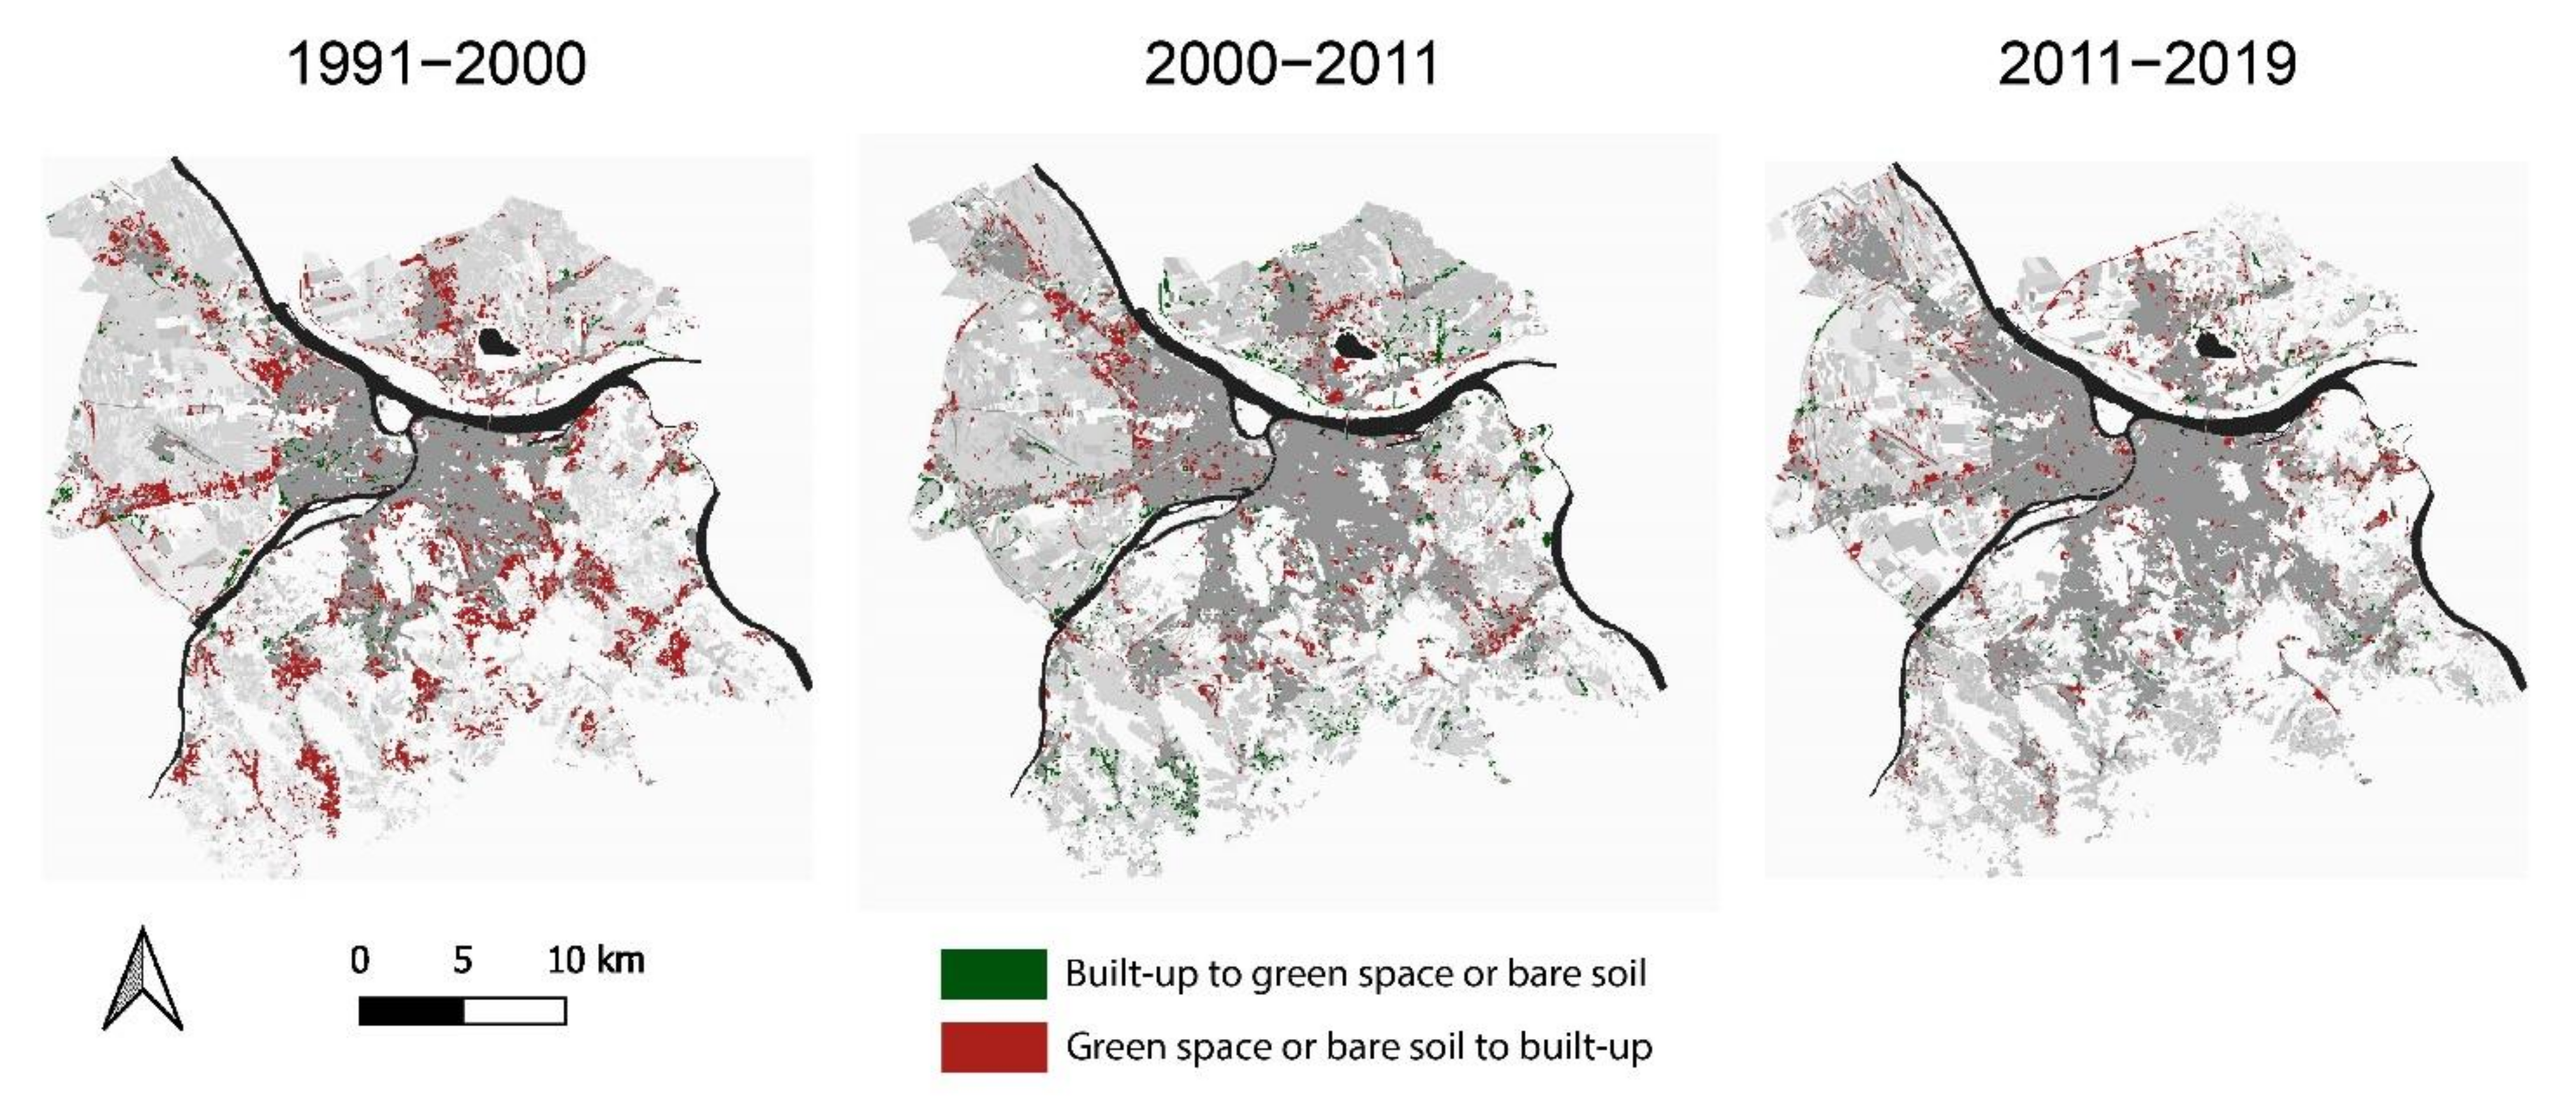
3.2. Land Cover Change
3.3. Relationship between Vegetation Indices and Climate Factors
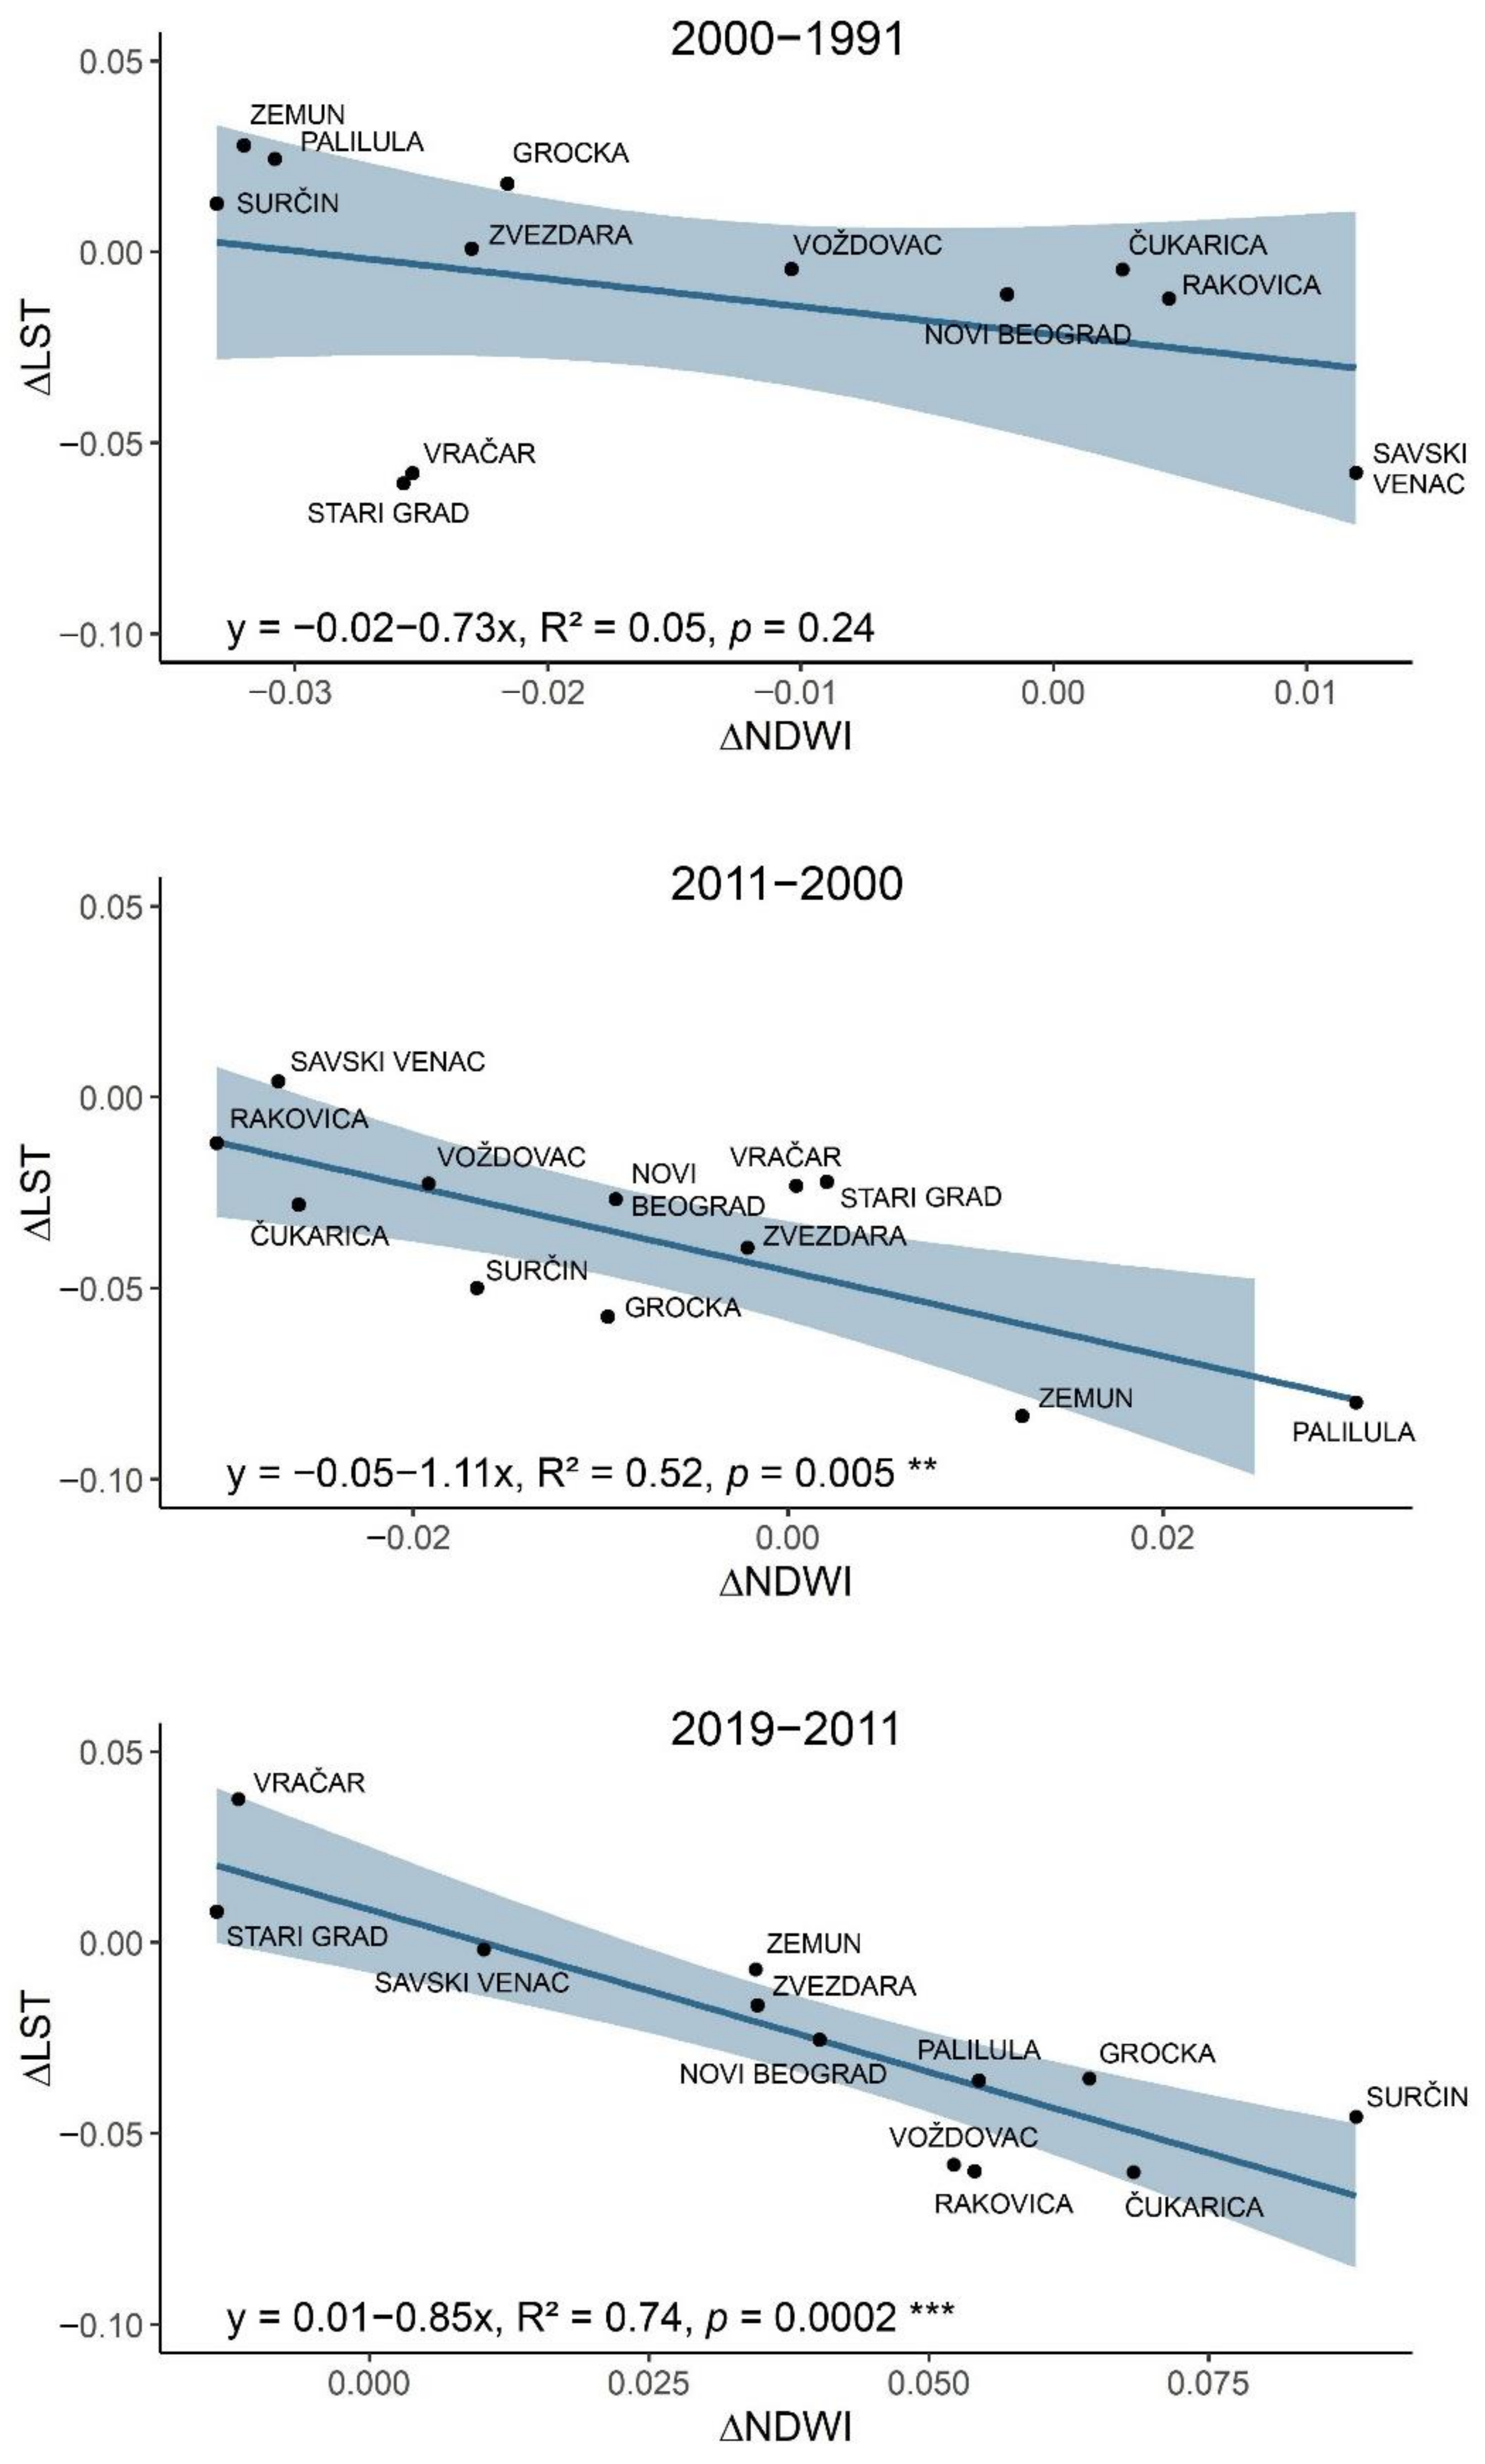
3.4. Spatiotemporal Change of the LST in Relation to Spectral Vegetation Indices
4. Discussion
4.1. Changes of Green Spaces in Belgrade during the Last Three Decades
4.2. Changes of the LST in Relation to Green Spaces
4.3. Implications of Study on Urban Planning, Management and Policy
- A constant decrease in green spaces and elevated LST in the central city zone negatively affects the health and life quality of the inhabitants of these parts of the city. In the past two decades, frequent heat waves have caused increased heat stress in the urban population and have had an especially negative effect on the health of vulnerable groups (the elderly, children, people with diseases of the cardiovascular and respiratory system and those with mental health issues) (Climate Change Adaptation Action Plan and Vulnerability Assessment, City of Belgrade, Secretariat for Environmental Protection, 2015). The proposed measures for mitigation of the urban heat island effect suggested development of new green spaces on built-up land cover that is undergoing conversion, preservation of existing and formation of new tree lines and establishment of green roofs and walls on technically feasible surfaces (the General Urban Plan of Belgrade 2021; Action Plan and Vulnerability Assessment, City of Belgrade, Secretariat for Environmental Protection, 2015). Besides these measures, we suggest prioritizing the preservation of old, large trees in the central city zone.
- In the planning and development of new green spaces, it is important to consider that water availability is the main limiting factor in temperate biome. Therefore, drought-tolerant autochthonous species should be selected for planting. Also, shrubs and trees should be favored, because these forms have a larger cooling potential in comparison to ground vegetation via both transpiration and shading [51].
- The pressure of urban development on the edges of urban forests within the “inner-ring” of green spaces is regarded as particularly harmful. The reduction of forest edges is threatening to diminish the energy flow between the forest and the surrounding areas and reduce shade for adjacent surfaces, thus increasing LST [60]. Although the protection of urban forests as natural resources and common goods is marked as a top priority according to the General Urban Plan of Belgrade 2021, this study showed an inconsistent application of this regulation in practice.
4.4. Limitations of the Study
5. Conclusions
Author Contributions
Funding
Institutional Review Board Statement
Informed Consent Statement
Data Availability Statement
Acknowledgments
Conflicts of Interest
References
- Grimmond, S. Urbanization and global environmental change: Local effects of urban warming. Geogr. J. 2007, 173, 83–88. [Google Scholar] [CrossRef]
- Imhoff, M.L.; Zhang, P.; Wolfe, R.E.; Bounoua, L. Remote sensing of the urban heat island effect across biomes in the continental USA. Remote Sens. Environ. 2010, 114, 504–513. [Google Scholar] [CrossRef] [Green Version]
- Bolund, P.; Hunhammar, S. Ecosystem services in urban areas. Ecol. Econ. 1999, 29, 293–301. [Google Scholar] [CrossRef]
- Bowler, D.E.; Buyung-Ali, L.; Knight, T.M.; Pullin, A.S. Urban greening to cool towns and cities: A systematic review of the empirical evidence. Landsc. Urban Plan. 2010, 97, 147–155. [Google Scholar] [CrossRef]
- Gill, S.E.; Handley, J.F.; Ennos, A.R.; Pauleit, S. Adapting Cities for Climate Change: The Role of the Green Infrastructure. Built Environ. 2007, 33, 115–132. [Google Scholar] [CrossRef] [Green Version]
- Smid, M.; Russo, S.; Costa, A.C.; Granell, C.; Pebesma, E. Ranking European capitals by exposure to heat waves and cold waves. Urban Clim. 2019, 27, 388–402. [Google Scholar] [CrossRef]
- Shih, W.Y.; Ahmad, S.; Chen, Y.C.; Lin, T.P.; Mabon, L. Spatial relationship between land development pattern and intra-urban thermal variations in Taipei. Sustain. Cities Soc. 2020, 62, 102415. [Google Scholar] [CrossRef]
- Tran, D.X.; Pla, F.; Latorre-Carmona, P.; Myint, S.W.; Caetano, M.; Kieu, H.V. Characterizing the relationship between land use land cover change and land surface temperature. ISPRS J. Photogramm. Remote Sens. 2017, 124, 119–132. [Google Scholar] [CrossRef] [Green Version]
- Nikolov, P. Demographic Factors, Urbanization and Urban Sprawl in Sofia, Rome and Belgrade. In Proceedings of the 14th International Scientific Conference VSU’2014, Sofia, Bulgaria, 5–6 June 2014. [Google Scholar]
- Slaev, A.D.; Nedović-Budić, Z.; Krunić, N.; Petrić, J.; Daskalova, D. Suburbanization and sprawl in post-socialist Belgrade and Sofia. Eur. Plan. Stud. 2018, 26, 1389–1412. [Google Scholar] [CrossRef]
- Liu, Y.; Wang, Y.; Peng, J.; Du, Y.; Liu, X.; Li, S.; Zhang, D. Correlations between urbanization and vegetation degradation across the world’s metropolises using DMSP/OLS nighttime light data. Remote Sens. 2015, 7, 2067–2088. [Google Scholar] [CrossRef] [Green Version]
- Weng, Q. Thermal infrared remote sensing for urban climate and environmental studies: Methods, applications, and trends. ISPRS J. Photogramm. Remote Sens. 2009, 64, 335–344. [Google Scholar] [CrossRef]
- Zhou, D.; Xiao, J.; Bonafoni, S.; Berger, C.; Deilami, K.; Zhou, Y.; Frolking, S.; Yao, R.; Qiao, Z.; Sobrino, J.A. Satellite remote sensing of surface urban heat islands: Progress, challenges, and perspectives. Remote Sens. 2019, 11, 48. [Google Scholar] [CrossRef] [Green Version]
- Liu, L.; Zhang, Y. Urban heat island analysis using the landsat TM data and ASTER Data: A case study in Hong Kong. Remote Sens. 2011, 3, 1535–1552. [Google Scholar] [CrossRef] [Green Version]
- Ahmed, B.; Kamruzzaman, M.D.; Zhu, X.; Shahinoor Rahman, M.D.; Choi, K. Simulating land cover changes and their impacts on land surface temperature in dhaka, bangladesh. Remote Sens. 2013, 5, 5969–5998. [Google Scholar] [CrossRef] [Green Version]
- Huang, L.; Shen, H.; Wu, P.; Zhang, L.; Zeng, C. Relationships analysis of land surface temperature with vegetation indicators and impervious surface fraction by fusing multi-temporal and multi-sensor remotely sensed data. In Proceedings of the 2015 Joint Urban Remote Sensing Event (JURSE), Lausanne, Switzerland, 30 March–1 April 2015; Volume 2015. [Google Scholar] [CrossRef]
- Kumar, D.; Shekhar, S. Statistical analysis of land surface temperature-vegetation indexes relationship through thermal remote sensing. Ecotoxicol. Environ. Saf. 2015, 121, 39–44. [Google Scholar] [CrossRef]
- Luo, X.; Li, W. Scale effect analysis of the relationships between urban heat island and impact factors: Case study in Chongqing. J. Appl. Remote Sens. 2014, 8, 084995. [Google Scholar] [CrossRef]
- Fattah, M.A.; Morshed, S.R.; Morshed, S.Y. Multi-layer perceptron-Markov chain-based artificial neural network for modelling future land-specific carbon emission pattern and its influences on surface temperature. SN Appl. Sci. 2021, 3, 1–22. [Google Scholar] [CrossRef]
- Karnieli, A.; Agam, N.; Pinker, R.T.; Anderson, M.; Imhoff, M.L.; Gutman, G.G.; Panov, N.; Goldberg, A. Use of NDVI and land surface temperature for drought assessment: Merits and limitations. J. Clim. 2010, 23, 618–633. [Google Scholar] [CrossRef]
- Karnieli, A.; Ohana-Levi, N.; Silver, M.; Paz-Kagan, T.; Panov, N.; Varghese, D.; Chrysoulakis, N.; Provenzale, A. Spatial and seasonal patterns in vegetation growth-limiting factors over Europe. Remote Sens. 2019, 11, 2406. [Google Scholar] [CrossRef] [Green Version]
- Chi, Y.; Sun, J.; Sun, Y.; Liu, S.; Fu, Z. Multi-temporal characterization of land surface temperature and its relationships with normalized difference vegetation index and soil moisture content in the Yellow River Delta, China. Glob. Ecol. Conserv. 2020, 23, e01092. [Google Scholar] [CrossRef]
- Guha, S.; Govil, H.; Besoya, M. An investigation on seasonal variability between LST and NDWI in an urban environment using Landsat satellite data. Geomat. Nat. Hazards Risk 2020, 11, 1319–1345. [Google Scholar] [CrossRef]
- Sun, D.; Kafatos, M. Note on the NDVI-LST relationship and the use of temperature-related drought indices over North America. Geophys. Res. Lett. 2007, 34. [Google Scholar] [CrossRef] [Green Version]
- Pongrácz, R.; Bartholy, J.; Dezso, Z. Application of remotely sensed thermal information to urban climatology of Central European cities. Phys. Chem. Earth 2010, 35, 95–99. [Google Scholar] [CrossRef]
- Obradović-Arsić, D.; Filipović, D. Physical-geographic factors of development of Belgrade. In Challenges of Spatial Development of Ljubljana and Belgrade; Krevs, M., Djordjević, D., Pichler-Milanović, N., Eds.; Scientific Publishing House of the Faculty of Arts: Ljubljana, Slovenia, 2010; pp. 37–54. [Google Scholar]
- Justice, C.O.; Townshend, J.R.G.; Holben, A.N.; Tucker, C.J. Analysis of the phenology of global vegetation using meteorological satellite data. Int. J. Remote Sens. 1985, 6, 1271–1318. [Google Scholar] [CrossRef]
- Gao, B.C. NDWI—A normalized difference water index for remote sensing of vegetation liquid water from space. Remote Sens. Environ. 1996, 58, 257–266. [Google Scholar] [CrossRef]
- Marusig, D.; Petruzzellis, F.; Tomasella, M.; Napolitano, R.; Altobelli, A.; Nardini, A. Correlation of field-measured and remotely sensed plant water status as a tool to monitor the risk of drought-induced forest decline. Forests 2020, 11, 77. [Google Scholar] [CrossRef] [Green Version]
- Lu, D.; Weng, Q. A survey of image classification methods and techniques for improving classification performance. Int. J. Remote Sens. 2007, 28, 823–870. [Google Scholar] [CrossRef]
- Taylor, L.; Hochuli, D.F. Defining greenspace: Multiple uses across multiple disciplines. Landsc. Urban Plan. 2017, 158, 25–38. [Google Scholar] [CrossRef] [Green Version]
- van der Linden, S.; Rabe, A.; Held, M.; Jakimow, B.; Leitão, P.; Okujeni, A.; Schwieder, M.; Suess, S.; Hostert, P. The EnMAP-Box—A Toolbox and Application Programming Interface for EnMAP Data Processing. Remote Sens. 2015, 7, 11249–11266. [Google Scholar] [CrossRef] [Green Version]
- Elias, I.; Hernandez, R.; Shi, W. A Random Forests classification method for urban land-use mapping integrating spatial metrics and texture analysis. Int. J. Remote Sens. 2018, 39, 1175–1198. [Google Scholar] [CrossRef]
- Goldblatt, R.; You, W.; Hanson, G.; Khandelwal, A.K. Detecting the boundaries of urban areas in India: A dataset for pixel-based image classification in google earth engine. Remote Sens. 2016, 8, 634. [Google Scholar] [CrossRef] [Green Version]
- Lu, L.; Weng, Q.; Xiao, D.; Guo, H.; Li, Q.; Hui, W. Spatiotemporal variation of surface urban heat islands in relation to land cover composition and configuration: A multi-scale case study of Xi’an, China. Remote Sens. 2020, 12, 2713. [Google Scholar] [CrossRef]
- Amiri, R.; Weng, Q.; Alimohammadi, A.; Alavipanah, S.K. Spatial-temporal dynamics of land surface temperature in relation to fractional vegetation cover and land use/cover in the Tabriz urban area, Iran. Remote Sens. Environ. 2009, 113, 2606–2617. [Google Scholar] [CrossRef]
- Dobbs, C.; Nitschke, C.; Kendal, D. Assessing the drivers shaping global patterns of urban vegetation landscape structure. Sci. Total Environ. 2017, 592, 171–177. [Google Scholar] [CrossRef]
- Threlfall, C.G.; Ossola, A.; Hahs, A.K.; Williams, N.S.G.; Wilson, L.; Livesley, S.J. Variation in vegetation structure and composition across urban green space types. Front. Ecol. Evol. 2016, 4, 66. [Google Scholar] [CrossRef] [Green Version]
- Pataki, D.E.; Carreiro, M.M.; Cherrier, J.; Grulke, N.E.; Jennings, V.; Pincetl, S.; Pouyat, R.V.; Whitlow, T.H.; Zipperer, W.C. Coupling biogeochemical cycles in urban environments: Ecosystem services, green solutions, and misconceptions. Front. Ecol. Environ. 2011, 9, 27–36. [Google Scholar] [CrossRef]
- Brovkin, V. Climate-vegetation interaction. J. Phys. IV 2002, 12, 57–72. [Google Scholar] [CrossRef]
- Holdridge, L.R. Determination of world plant formations from simple climatic data. Science 1947, 105, 367–368. [Google Scholar] [CrossRef]
- Hawinkel, P.; Thiery, W.; Lhermitte, S.; Swinnen, E.; Verbist, B.; Van Orshoven, J.; Muys, B. Vegetation response to precipitation variability in East Africa controlled by biogeographical factors. J. Geophys. Res. Biogeosci. 2016, 121, 2422–2444. [Google Scholar] [CrossRef] [Green Version]
- Weltzin, J.F.; Loik, M.E.; Schwinning, S.; Williams, D.G.; Fay, P.A.; Haddad, B.M.; Harte, J.; Huxman, T.E.; Knapp, A.K.; Lin, G.; et al. Assessing the Response of Terrestrial Ecosystems to Potential Changes in Precipitation. Bioscience 2003, 53, 941–952. [Google Scholar] [CrossRef]
- Nemani, R.R.; Keeling, C.D.; Hashimoto, H.; Jolly, W.M.; Piper, S.C.; Tucker, C.J.; Myneni, R.B.; Running, S.W. Climate-driven increases in global terrestrial net primary production from 1982 to 1999. Science 2003, 300, 1560–1563. [Google Scholar] [CrossRef] [Green Version]
- Fensholt, R.; Horion, S.; Tagesson, T.; Ehammer, A.; Grogan, K.; Tian, F.; Huber, S.; Verbesselt, J.; Prince, S.D.; Tucker, C.J.; et al. Assessing drivers of vegetation changes in drylands from time series of earth observation data. In Remote Sensing Time Series. Remote Sensing and Digital Image Processing; Kuenzer, C., Dech, S., Wagner, W., Eds.; Springer: Cham, The Netherlands, 2015; Volume 22, pp. 183–202. [Google Scholar] [CrossRef] [Green Version]
- Wramneby, A.; Smith, B.; Samuelsson, P. Hot spots of vegetation-climate feedbacks under future greenhouse forcing in Europe. J. Geophys. Res. Atmos. 2010, 115, 1–12. [Google Scholar] [CrossRef] [Green Version]
- Grimmond, C.S.B.; Oke, T.R. Evapotranspiration rates in urban areas. In Impacts of Urban Growth on Surface Water and Groundwater Quality: Proceedings of an International Symposium Held during IUGG 99, the XXII General Assembly of the International Union of Geodesy and Geophysics, at Birmingham, UK 18–30 July 1999; IAHS Press, Institute of Hydrology: Wallingford, UK, 1999; pp. 235–243. [Google Scholar]
- Konarska, J.; Uddling, J.; Holmer, B.; Lutz, M.; Lindberg, F.; Pleijel, H.; Thorsson, S. Transpiration of urban trees and its cooling effect in a high latitude city. Int. J. Biometeorol. 2016, 60, 159–172. [Google Scholar] [CrossRef] [PubMed]
- Rahman, M.A.; Moser, A.; Gold, A.; Rötzer, T.; Pauleit, S. Vertical air temperature gradients under the shade of two contrasting urban tree species during different types of summer days. Sci. Total Environ. 2018, 633, 100–111. [Google Scholar] [CrossRef] [PubMed]
- Rahman, M.A.; Moser, A.; Rötzer, T.; Pauleit, S. Within canopy temperature differences and cooling ability of Tilia cordata trees grown in urban conditions. Build. Environ. 2017, 114, 118–128. [Google Scholar] [CrossRef]
- Duncan, J.M.A.; Boruff, B.; Saunders, A.; Sun, Q.; Hurley, J.; Amati, M. Turning down the heat: An enhanced understanding of the relationship between urban vegetation and surface temperature at the city scale. Sci. Total Environ. 2019, 656, 118–128. [Google Scholar] [CrossRef]
- Li, X.; Zhou, W.; Ouyang, Z.; Xu, W.; Zheng, H. Spatial pattern of greenspace affects land surface temperature: Evidence from the heavily urbanized Beijing metropolitan area, China. Landsc. Ecol. 2012, 27, 887–898. [Google Scholar] [CrossRef]
- Logan, T.M.; Zaitchik, B.; Guikema, S.; Nisbet, A. Night and day: The influence and relative importance of urban characteristics on remotely sensed land surface temperature. Remote Sens. Environ. 2020, 247, 111861. [Google Scholar] [CrossRef]
- Wang, Y.; Zhang, Y.; Ding, N.; Qin, K.; Yang, X. Simulating the impact of urban surface evapotranspiration on the urban heat island effect using the modified RS-PM model: A case study of Xuzhou, China. Remote Sens. 2020, 12, 578. [Google Scholar] [CrossRef] [Green Version]
- Gunawardena, K.R.; Wells, M.J.; Kershaw, T. Utilising green and bluespace to mitigate urban heat island intensity. Sci. Total Environ. 2017, 584–585, 1040–1055. [Google Scholar] [CrossRef]
- Zhang, Q.; Ban, Y. Evaluation of urban expansion and its impact on surface temperature in Beijing, China. In Proceedings of the 2011 Joint Urban Remote Sensing Event, Munich, Germany, 11–13 April 2011. [Google Scholar]
- Coutts, A.M.; Harris, R.J.; Phan, T.; Livesley, S.J.; Williams, N.S.G.; Tapper, N.J. Thermal infrared remote sensing of urban heat: Hotspots, vegetation, and an assessment of techniques for use in urban planning. Remote Sens. Environ. 2016, 186, 637–651. [Google Scholar] [CrossRef]
- Goldblatt, R.; Deininger, K.; Hanson, G. Utilizing publicly available satellite data for urban research: Mapping built-up land cover and land use in Ho Chi Minh City, Vietnam. Dev. Eng. 2018, 3, 83–99. [Google Scholar] [CrossRef]
- Kabisch, N.; Selsam, P.; Kirsten, T.; Lausch, A.; Bumberger, J. A multi-sensor and multi-temporal remote sensing approach to detect land cover change dynamics in heterogeneous urban landscapes. Ecol. Indic. 2019, 99, 273–282. [Google Scholar] [CrossRef]
- Zhou, W.; Huang, G.; Cadenasso, M.L. Does spatial configuration matter? Understanding the effects of land cover pattern on land surface temperature in urban landscapes. Landsc. Urban Plan. 2011, 102, 54–63. [Google Scholar] [CrossRef]
- Powell, R.L.; Roberts, D.A.; Dennison, P.E.; Hess, L.L. Sub-pixel mapping of urban land cover using multiple endmember spectral mixture analysis: Manaus, Brazil. Remote Sens. Environ. 2007, 106, 253–267. [Google Scholar] [CrossRef]
- Quintano, C.; Fernández-Manso, A.; Shimabukuro, Y.E.; Pereira, G. Spectral unmixing. Int. J. Remote Sens. 2012, 33, 5307–5340. [Google Scholar] [CrossRef]
- Yu, J.; Chen, D.; Lin, Y.; Ye, S. Comparison of linear and nonlinear spectral unmixing approaches: A case study with multispectral TM imagery. Int. J. Remote Sens. 2017, 38, 773–795. [Google Scholar] [CrossRef]
- Yang, C.; Wu, G.; Ding, K.; Shi, T.; Li, Q.; Wang, J. Improving land use/land cover classification by integrating pixel unmixing and decision tree methods. Remote Sens. 2017, 9, 122. [Google Scholar] [CrossRef] [Green Version]
- Krtalić, A.; Linardić, D.; Pernar, R. Framework for spatial and temporal monitoring of urban forest and vegetation conditions: Case study Zagreb, Croatia. Sustainability 2021, 13, 6055. [Google Scholar] [CrossRef]


| Image ID | Observation Date [DD/MM/YY] | Sensor | LST 1 [°C] | AT 2 [°C] | P 2 [mm] |
|---|---|---|---|---|---|
| LT05_L2SP_186029_19910610_20200915_02_T1 | 10/06/1991 8:45 a.m. | Landsat 5 TM | 28.1 | 19.2 | 338.8 |
| LT05_L2SP_186029_19910712_20200915_02_T1 | 12/07/1991 8:45 a.m. | Landsat 5 TM | 33.5 | ||
| LT05_L2SP_186029_19910930_20200915_02_T1 | 30/09/1991 8:45 a.m. | Landsat 5 TM | 26.6 | ||
| LT05_L2SP_186029_19950723_20200912_02_T1 | 23/07/1995 8:26 a.m. | Landsat 5 TM | 32.8 | 19.7 | 357.6 |
| LT05_L2SP_186029_19950808_20200912_02_T1 | 08/08/1995 8:25 a.m. | Landsat 5 TM | 32.7 | ||
| LT05_L2SP_186029_19950824_20200912_02_T1 | 24/08/1995 8:24 a.m. | Landsat 5 TM | 28.8 | ||
| LT05_L2SP_186029_20000517_20200907_02_T1 | 17/05/2000 8:57 a.m. | Landsat 5 TM | 37.1 | 21.8 | 157.3 |
| LT05_L2SP_186029_20000602_20200907_02_T1 | 02/06/2000 8:57 a.m. | Landsat 5 TM | 31.4 | ||
| LT05_L2SP_186029_20060721_20200831_02_T1 | 21/07/2006 9:14 a.m. | Landsat 5 TM | 37.1 | 20.1 | 353.6 |
| LT05_L2SP_186029_20110601_20200822_02_T1 | 01/06/2011 9:11 a.m. | Landsat 5 TM | 26.4 | 21.7 | 230.3 |
| LT05_L2SP_186029_20110719_20200822_02_T1 | 19/07/2011 9:10 a.m. | Landsat 5 TM | 41.6 | ||
| LT05_L2SP_186029_20110820_20200820_02_T1 | 20/08/2011 9:10 a.m. | Landsat 5 TM | 33.1 | ||
| LT05_L2SP_186029_20110905_20200820_02_T1 | 05/09/2011 9:10 a.m. | Landsat 5 TM | 37.8 | ||
| LC08_L2SP_186029_20150612_20200909_02_T1 | 12/06/2015 9:20 a.m. | Landsat 8 OLI/TIRS | 36.3 | 22.3 | 247.3 |
| LC08_L2SP_186029_20150815_20200908_02_T1 | 15/08/2015 9:21 a.m. | Landsat 8 OLI/TIRS | 41.9 | ||
| LC08_L2SP_186029_20150831_20200908_02_T1 | 31/08/2015 9:21 a.m. | Landsat 8 OLI/TIRS | 39.0 | ||
| LC08_L2SP_186029_20190725_20200827_02_T1 | 25/07/2019 9:21 a.m. | Landsat 8 OLI/TIRS | 36.0 | 21.6 | 376.0 |
| LC08_L2SP_186029_20190810_20200827_02_T1 | 10/08/2019 9:21 a.m. | Landsat 8 OLI/TIRS | 36.5 |
| Sensor | RED | NIR | SWIR | Spatial Resolution [m] |
|---|---|---|---|---|
| Landsat 5 TM | Band 3 | Band 4 | Band 5 | 30 |
| Landsat 8 OLI/TIRS | Band 4 | Band 5 | Band 6 | 30 |
| Year | Class | Area | Accuracy | ||||
|---|---|---|---|---|---|---|---|
| Absolute [ha] | Relative [%] | User’s | Producer’s | Overall | Kappa | ||
| 1991 | Green space | 39,779.19 | 51.20 | 99.2 | 99.71 | 96.95 | 0.95 |
| Bare land | 23,558.67 | 30.32 | 94.66 | 91.38 | |||
| Water | 3445.65 | 4.43 | 99.33 | 99.31 | |||
| Built-up | 10,913.94 | 14.05 | 82.01 | 86.6 | |||
| 2000 | Green space | 26,552.43 | 34.17 | 98.27 | 99.0 | 93.39 | 0.89 |
| Bare land | 30,079.8 | 38.71 | 92.53 | 67.41 | |||
| Water | 3308.76 | 4.26 | 99.85 | 99.95 | |||
| Built-up | 17,756.46 | 22.85 | 67.5 | 92.5 | |||
| 2011 | Green space | 34,259.22 | 44.09 | 99.53 | 99.63 | 95.10 | 0.92 |
| Bare land | 22,563.72 | 29.04 | 96.23 | 82.18 | |||
| Water | 3252.87 | 4.19 | 99.97 | 99.99 | |||
| Built-up | 17,621.64 | 22.68 | 77.81 | 95.59 | |||
| 2019 | Green space | 38,522.97 | 49.58 | 99.72 | 99.77 | 95.43 | 0.93 |
| Bare land | 15,694.56 | 20.20 | 96.73 | 73.85 | |||
| Water | 3144.24 | 4.05 | 99.87 | 99.96 | |||
| Built-up | 20,334.33 | 26.17 | 80.88 | 97.76 | |||
Publisher’s Note: MDPI stays neutral with regard to jurisdictional claims in published maps and institutional affiliations. |
© 2021 by the authors. Licensee MDPI, Basel, Switzerland. This article is an open access article distributed under the terms and conditions of the Creative Commons Attribution (CC BY) license (https://creativecommons.org/licenses/by/4.0/).
Share and Cite
Marković, M.; Cheema, J.; Teofilović, A.; Čepić, S.; Popović, Z.; Tomićević-Dubljević, J.; Pause, M. Monitoring of Spatiotemporal Change of Green Spaces in Relation to the Land Surface Temperature: A Case Study of Belgrade, Serbia. Remote Sens. 2021, 13, 3846. https://doi.org/10.3390/rs13193846
Marković M, Cheema J, Teofilović A, Čepić S, Popović Z, Tomićević-Dubljević J, Pause M. Monitoring of Spatiotemporal Change of Green Spaces in Relation to the Land Surface Temperature: A Case Study of Belgrade, Serbia. Remote Sensing. 2021; 13(19):3846. https://doi.org/10.3390/rs13193846
Chicago/Turabian StyleMarković, Milena, Jasmin Cheema, Anica Teofilović, Slavica Čepić, Zorica Popović, Jelena Tomićević-Dubljević, and Marion Pause. 2021. "Monitoring of Spatiotemporal Change of Green Spaces in Relation to the Land Surface Temperature: A Case Study of Belgrade, Serbia" Remote Sensing 13, no. 19: 3846. https://doi.org/10.3390/rs13193846
APA StyleMarković, M., Cheema, J., Teofilović, A., Čepić, S., Popović, Z., Tomićević-Dubljević, J., & Pause, M. (2021). Monitoring of Spatiotemporal Change of Green Spaces in Relation to the Land Surface Temperature: A Case Study of Belgrade, Serbia. Remote Sensing, 13(19), 3846. https://doi.org/10.3390/rs13193846