Abstract
It is critical to acquire the information of forest type at the tree species level due to its strong links with various quantitative and qualitative indicators in forest inventories. The efficiency of deep-learning classification models for high spatial resolution (HSR) remote sensing image has been demonstrated with the ongoing development of artificial intelligence technology. However, due to limited statistical separability and complicated circumstances, completely automatic and highly accurate forest type mapping at the tree species level remains a challenge. To deal with the problem, a novel deep fusion uNet model was developed to improve the performance of forest classification refined at the dominant tree species level by combining the beneficial phenological characteristics of the multi-temporal imagery and the powerful features of the deep uNet model. The proposed model was built on a two-branch deep fusion architecture with the deep Res-uNet model functioning as its backbone. Quantitative assessments of China’s Gaofen-2 (GF-2) HSR satellite data revealed that the suggested model delivered a competitive performance in the Wangyedian forest farm, with an overall classification accuracy (OA) of 93.30% and a Kappa coefficient of 0.9229. The studies also yielded good results in the mapping of plantation species such as the Chinese pine and the Larix principis.
1. Introduction
Remote sensing-assisted classification of forest type at the tree species level drives a wide variety of applications, including issues with sustainable forest management [1,2], biological and surveillance [3,4], and invasive species monitoring [5].
Over the last four decades, advances in remote sensing technology have enabled the classification of tree species using various satellite sensors. Meanwhile, with the widespread availability of satellites and the advancement of sensor manufacturing technology, higher spatial resolution images and more detailed classification results were obtained. Recently, more and more studies have been conducted to obtain more specific information of forest types at the tree species level using high spatial resolution (HSR) satellite images [6,7,8]. However, it was shown that the spectral response of various tree species in a forest environment usually displayed complicated patterns as the spatial resolution improved. This means that several tree species or forest types have the same or comparable spectral response, which may cause interpretative difficulty when discriminating from the mono-temporal high-resolution data. As a result, despite substantial breakthroughs in geographic information science and technology, reliably categorizing forest types at the tree species level from mono-temporal high-resolution images remains a difficulty [9].
Due to phenological variations across tree species, multi-temporal satellite image has the ability to compensate for inadequate spectrum information. Previous research demonstrated that utilizing multi-temporal satellite images helped improve forest type categorization results. Nelson (2017) used the multi-temporal satellite images to classify tree species groups and forest types in central Sweden. The results demonstrated that utilizing a multi-temporal method could enhance overall classification accuracy [10]. Wessel (2018) extracted four tree species classifications from multi-temporal satellite images at a German test site and achieved up to 88% overall accuracy [11]. Persson (2018) demonstrated that employing multi-temporal satellite images yielded greater performance in tree species classification than using mono-temporal data [12]. Other research has also underlined the significance of phenological information contained in multi-season data for forest type mapping [13].
In terms of methodologies, the researchers successfully employed machine learning methods such as support vector machine (SVM) and random forest (RF) to the classification of forest types based on multi-temporal satellite data and produced satisfactory classification results. Meanwhile, many comparative analyses of different machine learning methods for forest type classification based on multi-temporal data have also been conducted [14,15]. The results showed that the key factor for determining the effect of machine learning algorithm was the feature representation of the satellite data which was always in the form of manual feature extraction and optimization. However, such operations were always time-consuming, laborious, and vulnerable to human experience.
Deep learning approaches have shown considerable potential in feature representation of remote sensing images with the advent of the big data era and the rapid development of scientific computing [16]. It has attracted the attention of many researchers as it demonstrated good classification performance with satellite imagery and overcame many limitations of traditional classification methods [17,18,19].
The full convolutional network (FCN) is regarded as a watershed moment in deep learning for semantic segmentation since it demonstrates how to train a convolutional neural network (CNN) end-to-end and produce dense predictions with inputs of any sizes [20]. Due to the connection between semantic segmentation in computer vision and satellite imagery classification, FCN was used to extract the hierarchical context characteristics of satellite image pixels in order to classify the land cover and use [21,22]. The model’s core premise is that it converts standard CNN into fully convolutional ones by replacing fully connected layers with convolutional layers and produces dense per-pixel labeled outputs using a progressively up-sampling process [23]. Despite its strength and versatility, the FCN model loses a lot of detail and lacks spatial consistency of pixels owing to a lot of pooling and up-sampling procedures [24].
The uNet is a symmetric U-shaped FCN that was first employed for image segmentation in biomedicine [25]. The performance of uNet is increased above that of regular FCN by merging the underlying spatial information gained by down-sampling with the input of up-sampling via skip connections. Deep learning approaches based on uNet have made significant progress in the areas of forest type and tree species classification using remote sensing data in recent years. Wang (2020) used HSR images to classify forest types using the uNet model. When compared to the classification results of FCN, support vector machine, and random forest models, the result has been improved considerably [26]. Cao (2020) suggested an enhanced Res-uNet network based on the uNet structure for tree classification utilizing HSR imagery [27]. To extract the multi-scale feature of an image, the novel method optimized the uNet with the residual unit of ResNet [28]. The experimental results revealed that, when compared to uNet and ResNet, the upgraded Res-uNet model produced superior results since it could extract the spatial and spectral properties of an image more efficiently.
Despite the fact that the optimized Res-uNet model offered new possibilities for tree species classification in HSR images, it failed to consider the advantages of multi-temporal imaging in classifying forest types and tree species. Meanwhile, the enhanced model did not integrate the deeper Resnet model with the original uNet network, instead using simply a three-level residual unit to replace the traditional convolutional block in the uNet. It overlooked the fact that, to some extent, the depth of representations is critical for many visual identification tasks [28].
With the development of artificial intelligence technologies, several studies explored the optimized the deep learning model for the land cover classification [29,30,31]. Recent studies also investigated the fusion of multiple branch classifiers into a FCN model for forest type at tree species level classification, which further enhanced the classification ability of single classifier in a manner of multi-classifier ensemble. Guo (2020) presented a two-branch FCN8s approach to improve forest type classification based on China’s Gaofen-2 (GF-2) HSR imagery by fusing with two sub-FCN8s models which were constructed with the multi-spectral channels and pretrain model, respectively [32,33]. The results showed that the suggested model could improve the classification performance by combining two classifiers. More recently, Guo (2020) further exploited the deep fusion model constructed in an end-to-end manner for mapping forests at tree species levels with HSR satellite imagery, which further enhanced the classification ability of single classifier in a manner of combining a two-branch FCN8s model and a conditional random field as recurrent neural network [34]. However, the advantage of phenological information extracted from multi-temporal images in forest type and tree species classification was also unemployed to the constructed model in the above previous studies. Moreover, while the uNet model has shown its performance in the classification of forest type and tree species, the backbone model used in the deep fusion model was mostly based on FCN8s method, which lacked investigating the effect of uNet model as its backbone.
It could be noted that: (1) Despite the fact that multi-temporal high-resolution satellite data are favored for better performance in forest type classification, few research have studied the performance of building deep learning models with such data to cope with such a job. (2) Although an improved Res-uNet network has been successfully applied in the tree species classification, the investigation of combining deeper Resnet such as 18-layer, 34-layer, 50-layer, and 101-layer residual nets with uNet was insufficient. (3) Furthermore, while Res-uNet and the deep fusion model have tremendous promise to answer the challenge of enhancing forest classification accuracy at the tree species level, research into developing the model by fusing the aforementioned two approaches utilizing multi-temporal satellite data have been rarely investigated.
As a result, the paper suggested a novel deep fusion uNet model based on multi-temporal HSR satellite data for mapping forest types at the tree species level. The suggested model was built on a two-branch deep fusion architecture that employed the deep Res-uNet model as its backbone and was named dual-uNet-Resnet in the study.
2. Materials and Methods
2.1. Study Areas
The study area was located within the Wangyedian farm in Northern China at the intersection between the Inner Mongolia, Hebei and Liaoning Provinces, south-west of Harqin Banner City, the Autonomous Region of Inner Mongolia, China (Figure 1). The location is a mountainous region of 800–1890 m above sea level, with a slope of 15–35°. The zone is a moderately temperate continental mountain climate with an average long-term annual precipitation of 400 mm and an annual mean temperature of 7.4 °C. The entire area of the experimental area is 24,700 ha, of which 23,300 ha are forests with 92.10% coverage. Chinese pine (Pinus tabuliformisCarrière), Larix principis (Larix principis-rupprechtii May), White birch (Betula platyphylla), and Aspen (Populus davidiana) are the principal tree species in this area.

Figure 1.
Schematic diagram of study area location and data source. WYD: Wangyedian forest farm; GF-2 satellite (bands 4, 3, 2 false-color combinations).
2.2. Test Data
2.2.1. Land Cover Types, Forest, and Tree Species Definition
The classification of land cover, forest, and tree species adopted in this study is primarily based on the regulation of forest resources planning, design, and measurement [35], which are technical standards of the national forest resources planning and design survey. Based on the analysis of potential land classification results through pre-classifications from multi-temporal China’s GF-2 images, the classification system of this study was determined as shown in Table 1. The classes were divided into 10 categories, including Chinese pine (Pinus tabulaeformis), Larix principis (Larix principis-rupprechtii), Korean pine (Pinus koraiensis), White birch and Aspen (Betula platyphylla and Populus davidiana), Mongolian oak (Quercus mongolica), Shrub land, Cultivated land, Grassland, Construction land, and other non-forest lands. For simplicity, the above types were abbreviated as CP, LP, KP, WA, MO, SL, CUL, GL, COL, and ONFL as shown in Table 1.

Table 1.
Classification system of the Wangyedian study areas.
2.2.2. Multi-Temporal Remote Sensing Data
A set of cloudless panchromatic and multispectral GF-2 data were obtained from the Natural Resources Satellite Remote Sensing Cloud Service Platform. Since the whole experimental region requires four satellite imageries to achieve full coverage, we gathered four remote sensing images in 2017 and 2019, respectively, totaling eight GF-2 images. The satellite imagery collection dates were 5 September 2017, 29 May and 23 June 2019. Table 2 shows detailed information of the satellite images including scenery serial number, image time, solar elevation angle, solar azimuth, and cloud cover. The first image (5 September 2017) was obtained at the beginning of autumn, when some leaves start to gradually change colors. The second image (29 May and 23 June 2019) represents the mid-summer. All the images contain four multi-spectral channels with a spatial resolution of 4 m and one panchromatic channel with a spatial resolution of 1 m, covering 0.45–0.90 µm spectral bands, including the blue band (B) (0.45−0.52 µm), green band (G) (0.52−0.59 µm), red band (R) (0.63−0.69 µm), near infrared band (NIR) (0.77−0.89 µm), and panchromatic band (0.45−0.90 µm).
Table 2.
Parameter information for GF-2 remote sensing images in the study area.
All the GF-2 satellite images were preprocessed in four steps: Radiometric calibration, atmospheric correction, ortho-rectification, and satellite image fusion. The first step was the radiometric calibration. By applying the absolute radiometric calibration coefficients published by the China resources Satellite Data and Application Center [36], the pixel brightness values of satellite observations have been converted to apparent radiance. The atmospheric correction of multi-spectral and panchromatic data was then performed using the Fast Line-of-Sight Atmospheric Analysis of Hypercube technique [37]. The parameters of the multi-spectral and panchromatic images, as well as one the digital elevation model (DEM) of 5 m resolution, were then used to perform ortho-rectification aided by ground control points automatically extracted by image-to-image registration using a scale invariant feature transformation algorithm [38] with ZY-3 digital ortho-photo map (DOM) in 2 m spatial resolution [39] as reference. Finally, the multi-spectral and panchromatic images were merged to achieve 1 m spatial resolution multi-spectral remote sensing data in the UTM/WGS84 projection with the Nearest-neighbor Diffusion-based Pan-sharpening algorithm [40].
2.2.3. Sample Dataset
- (1)
- Training and validation sample block
For building the deep learning model, 149 sample blocks (Figure 2) were produced by visual interpretation, supported by multi-temporary high resolution remote sensing imagery, forest sub-compartment map, and field survey data. Each sample was made up of a pre-processed multi-temporal remote sensing image block and a pixel-level image interpretation block. The sample size is 310 to 310 pixels. During the model training process, 80% of the sample blocks (119 blocks) were selected at random as training data, while the remaining 20% of the sample blocks are used as verification data (30 blocks). Given that sample imbalance affects classification effect, the samples were evenly distributed in the test area (Figure 3) and the number of samples corresponding to each category was balanced.

Figure 2.
Examples in detail for some of the training samples in the Wangyedian forest farm. (a) Original image blocks of 2019 (bands 4, 3, 2 false-color combinations); (b) original image blocks of 2017 (bands 4, 3, 2 false-color combinations); (c) ground truth (GT) blocks showing the labels corresponding to the image blocks in (a,b).
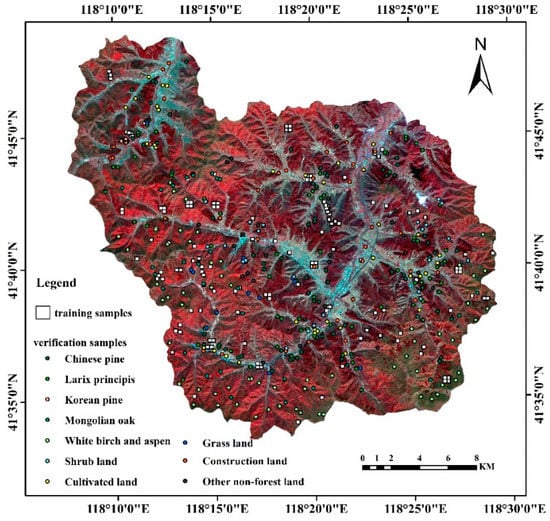
Figure 3.
Spatial distribution map of the field survey sample points and some of the training samples in the Wangyedian forest farm.
- (2)
- Test sample point
In addition, in order to verify the classification accuracy of the deep learning model, field surveys in the Wangyedian forest farm were conducted in September 2017 and 2019 to validate the proposed model’s classification accuracy. As indicated in Figure 3, a total of 358 field survey samples were collected. The square area in Figure 3 is the spatial distribution of part of the training sample blocks, and the circular area is the distribution of collected test sample points.
2.3. Workflow Description
Figure 4 shows visually the workflow of the proposed method based on multi-temporal HSR data. First, by pre-processing the multi-temporal HSR data and labeling of the selected responding image, the forest type classification dataset was developed. The suggested model was subsequently trained on the training samples and supervision was given to the optimal parameters. The back propagation algorithm [41] was used to update the parameters of the model until the optimal parameter was obtained. Finally, the entire test dataset with eight GF-2 images was put into the well-trained model in order to build the final classification map.

Figure 4.
Workflow for the dual-uNet-Resnet model for forest type classification at tree species level based on the multi-temporal HSR image.
2.4. Network Structure
The dual-uNet-Resnet model suggested is an end-to-end network for classifying forest types at the tree species level. The network combines the benefits of uNet with Resnet to develop a new network design by replacing the original uNet unit with a deep residual network. The deep residual model, the basic uNet backbone, and the suggested dual-uNet-Resnet model are all described in the following subsections.
2.4.1. Deep Residual Model
In 2015, He et al. introduced a unique convolutional neural network model named deep residual network, which won the ImageNet image classification competition [28]. The fundamental distinction between a residual model and a standard convolutional block is their network topology. In the case of a standard convolutional block, the architecture is often built in a cascade fashion by merging fundamental units such as convolutional layers, nonlinear mapping layers, pooling layers, or batch normalization. A residual model, on the other hand, contains a shortcut pathway that connects the input and output in a building block.
Residual learning fits its residual mapping F (x), where F (x): = H (x) − x, rather than directly estimating an underlying function H (x). The final mapping of a residual learning block is defined as F (x) + x, where x is the input, and the operation F (x) + x is performed by a shortcut connection and element-wise addition, which is equal to the output of a typical convolutional block, that is H (x), particularly when H (x) is an identity or near identity mapping. Fitting a residual mapping F (x) is easier than fitting the original mapping H (x), as He et al. [28] demonstrate, especially when H (x) is an identity or near identity mapping.
This property allows the depth of the residual network to be expanded to exceptionally deep levels without degrading the network’s classification performance and overcomes the gradient degradation problem in deeper networks. As a result of these advantages, numerous residual networks with varying depths of representation, such as 18-layer, 34-layer, 50-layer, and 101-layer residual nets, were built and effectively deployed in a variety of computation vision applications.
For the classification of forest types at the tree species level, the gradient degradation problem will cause another extra serious problem. The discrimination of diverse tree species attributes would be reduced due to the direct layered construction, making tree species distinctions difficult to discern. The residual mapping should be used more efficiently to solve the gradient degradation problem while also boosting the network’s learning method.
2.4.2. UNet Backbone
Olaf Ronneberger et al. [25] introduced uNet in 2015, which used a ground-breaking architecture and had remarkable success in satellite image classification. It featured an asymmetric construction with two components: Encoder and decoder.
The encoder was used to extract spatial characteristics from imagery and followed the standard structure of a convolutional network. A convolution block consists of two 3 × 3 convolution operations followed by a max-pooling operation with a pooling size of 2 × 2 and stride of 2. This block is repeated four times, with the number of filters in the convolution doubling after each down-sampling. Finally, the encoder and decoder are linked by a series of two 3 × 3 convolution operations.
The decoder creates the segmentation map from the encoder characteristics. The decoder employs 2 × 2 transposed convolution operations [25] to up-sample the feature map while also reducing the feature channels to half. Then, a series of two 3 × 3 convolution processes is repeated. This sequence of up-sampling and two convolution operations, such as the encoder, is repeated four times, reducing the number of filters to half at each iteration. Finally, the final segmentation map is generated using a 1 × 1 convolution operation. Except for the final layer, all convolutional layers in the uNet employ the rectified linear unit (ReLU) as an activation function [42].
Furthermore, the uNet architecture employs a skip connection to transfer output from the encoder to decoder. These feature maps are concatenated with the output of the up-sampling process, and the resulting feature map is transferred to the subsequent layers. The skip connections enable the network to recover the spatial information that were lost during pooling processes.
In fact, at the tree species level, the forest type classification could be considered as a complex image segmentation problem independent of the human visual system. We must differentiate between distinct tree species or forest types in satellite imagery that cannot be identified by human eyes most of the time. The only method to distinguish between various categories is through variations in image essence qualities, which may be determined by extracting discriminative features. Although the uNet structure can extract certain relatively shallow discriminative characteristics across network layers, only the two sides of the uNet structure interact, which is insufficient for extracting the distinct type. Furthermore, the gradient degradation problem [41] will develop when the network design becomes more complex.
2.4.3. Dual-uNet-Resnet Model
The proposed dual-uNet-Resnet model employed uNet as its backbone, but with some significant modifications. To begin, we broadened the network structure by combining two uNet models as our deep neural network architecture to extract multi-temporal information. The original encoder component of each uNet model was then replaced with a deep residual model, such as Resnet 50, and the residual unit was introduced into the skip connection. Finally, the decoder concatenated the two encoders and the updated skip connection layer, then learned the mapping from the low-resolution feature maps and generated pixel-wise forest type classifications at the tree species level. Owing to such modifications, dual-uNet-Resnet gains insights into the multi-temporal image under a global perspective. Accordingly, it maintains steady performance when classifying different categories, without requiring numerous training samples or a pre-training process. Similar to the original uNet architecture, each uNet backbone in the dual-uNet-Resnet model also has two parts: The encoder and the decoder (Figure 5).
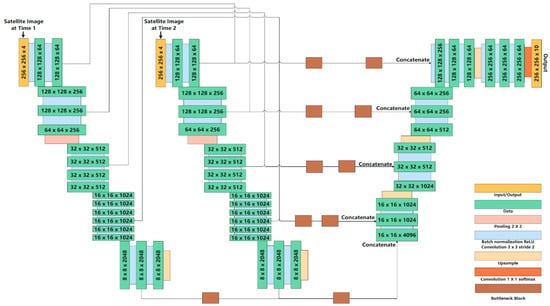
Figure 5.
The general workflow of the dual-uNet-Resnet classification method.
In the encoder part, the proposed dual-uNet-Resnet model contained two encoders. Each encoder utilized the standard structure of deep residual networks with 50 layers of depth to extract spatial characteristics from imagery. It was separated into five encoder phrases, each with a different number of layers. A bottleneck convolution block was present in each layer. A bottleneck convolution block consisted of a series of 1 × 1, 3 × 3, and 1 × 1 convolution operations, with the 1 × 1 convolution operation responsible for decreasing and restoring dimensions and the 3 × 3 convolution operation acting as a bottleneck with reduced input/output dimensions. There are two kinds of shortcuts we employed, one was performed in identity mapping and the other was done by inserting a 3 × 3 convolution operation into the shortcut connections for addressing the degradation problem. The down-sampling was performed by the convolution operation with a stride of two.
In the decoder section, each decoder of the proposed model first up-samples the feature map using a 2 × 2 transposed convolution operation, and the feature channels are decreased by half. Then, a sequence of two 3 × 3 convolution procedures were performed. Following that, the up-sampling and two convolution procedures were combined and performed four times in total. The number of filters was halved in each repeated stage. Finally, a convolution operation of 1 × 1 was used to get the final segmentation map. Except for the final convolution layers, the rectified linear unit (ReLU) activation function was used throughout the procedure [42].
Since there were two encoders in the dual-uNet-Resnet model to extract multi-temporal information, we used the decoder fusion approach to create the results of classification to keep temporal information from each encoder. We employed two types of fusion techniques. The first is decision level fusion, which combines information at the final level, and the second is multi-level fusion, which combines the properties of the four encoding stages.
The initial contribution of uNet architecture was to introduce the skip connection. It connected the appropriate layers before and after the max-pooling and deconvolution layers, so that spatial information lost during the pooling process could be maintained and the model spread from the encoder to the decoder. Since the skip connection crossed the low-level characteristics of the encoder and of the decoder’s much higher level, a semantic gap might be created between the encoder and the decoder. To alleviate the discrepancy between the encoder and decoder features, two bottleneck residual convolution blocks were additionally included into the skip connection, rather than just combining the encoder and decoder features. A succession of 1 × 1, 3 × 3, and 1 × 1 convolution operations were provided to each bottleneck residual convolution block, and a 1 × 1 convolution operation was inserted into the shortcut connections for addressing the degradation problem, named bottleneck block (Figure 6).

Figure 6.
The structure of the bottleneck block.
To summarize, the proposed dual-uNet-Resnet model ensures that the image discrimination attribute is more obvious while features are extracted among network layers, resulting in better and more stable classification performance than traditional feature extraction-based methods. The dual-uNet-Resnet network architecture was depicted in Figure 5. It is an end-to-end semantic segmentation network that can immediately classify without any preparation or post-processing.
The suggested model was built in Python utilizing Keras [43] and a TensorFlow [44] backend. All the experiments were carried out on an Nvidia Tesla K40C GPU. The training set was separated into subgroups to maximize the network weights and early stopping criterion (training, validation). We trained the proposed model using mini batches of size 16 using the Adam optimizer [45]. For all the experiments, the maximum number of training epochs was set to 10,000, and the training computation duration was around 36 h.
2.5. Accuracy Evaluation Index
The accuracy assessment index included the overall accuracy (OA), Kappa coefficient, as well as the user’s (UA) and producer’s accuracy (PA) values. The OA is a ratio of correctly classified samples to all the field survey samples (358 in total) expressed as a percentage. The Kappa coefficient assesses the consistency between the classification results and the verification samples. The UA and the PA index mainly refer to evaluating the classification accuracy of a given class. The UA is determined as the ratio of the total number of correctly classified samples for a particular class to the total number of samples belonging to the same class calculated according to the row in the confusion matrix. The UA is mainly used to evaluate the misclassification of a certain category, which is a complement of the Commission Error. The PA is calculated by dividing the number of correctly classified samples in a certain class by the total number of reference samples in that class, and it is a make-up of the omission error. The confusion matrix assigns the pixels to be categorized into a certain class.
3. Results
3.1. Classification Results of the Dual-uNet-Resnet
The dual-uNet-Resnet model’s classification results indicated a high level of agreement with the forest type of the test site. The OA was 93.30% and the Kappa coefficient was 0.9229 (Table 3). The coniferous tree species including CP, LP, and KP have superior performance than the broad-leaved tree species including WA and MO. Furthermore, the classification results of all three kinds of coniferous tree species were well and achieved an accuracy of around 90%. The precision in categorization of forest types and species with broad leave was over 85%. The classification accuracy for Mongolian oak species was likewise better than 90%. The model has also been shown to get good results for classifying non-forest land types. The PA and UA of cultivated land and construction land are both 100%. It showed that the proposed model exhibited a superior performance for the type with a regular texture shape.
Table 3.
Confusion matrix of classification result of dual-uNet-Resnet.
3.2. Benchmark Comparison for Classification Based on Multi-Temporal Imagery
To validate the classification impact of the proposed dual-uNet-Resnet model, the subsection evaluated its performance to four existing approaches. The models under consideration include the uNet model, the uNet model with Resnet 50 as its encoder (named uNet-Resnet), the dual-FCN8s model, and the standard FCN8s network with Resnet 50 as its backbone (named FCN8s). To ensure structural equivalence with the dual-uNet-Resnet model, each branch of the dual-FCN8s retrieved temporal information and used Resnet 50 as its backbone.
The aforementioned algorithms used multi-temporal spectral characteristics as input. The OA of the dual-uNet-Resnet model was 93.30%, and the Kappa was 0.9229, which was better than the other four models (Table 4). The dual-FCN8s model outperformed the other three models in classification, with an OA of 91.67% and a Kappa of 0.9044. The uNet-resnet model was next, with an OA of 88.92% and a Kappa of 0.8724. The uNet and FCN8s models performed similarly, with both achieving an OA of about 86%, however the uNet model performed better.
Table 4.
Classification accuracies of the dual-uNet-Resnet, dual-FCN8s, UNet-Resnet, UNet, and FCN8s for the Wangyedian forest farm.
According to the comparison above, the results of the dual-branch structure model were superior to the results of the single branch structure model for the categorization of forest type and tree species with multi-temporal satellite data. This might be due to the dual-branch structure model’s ability to not only fully extract multi-temporal characteristics, but also to make greater use of phenological distinctions across multi-temporal characteristics to increase the classification result.
All of the above models, especially those that used uNet as its backbone including the uNet, the uNet-Resnet, and the dual-uNet-Resnet model, could efficiently extract Korean pine tree species. The dual-uNet-Resnet model outperformed the other models for the classification of Chinese pine and Larix principis. The PA grew by 13.51 (81.08% to 94.59%) and the UA climbed by 6.88 (83.33% to 89.74%) for the Chinese pine, and 14.41 (78.13% to 92.54%) and 14.67 (79.27% to 93.94%) for the Larix principis. The dual-FCN8s model outperformed the single-FCN8s model for broad-leaved species, particularly for White birch and Aspen. It should be noted that the model with dual branch structure performed much better for the cultivated and construction land types.
Figure 7 depicted the land cover type obtained from the five models discussed above at a finer scale. The dual-uNet-Resnet model outperformed the other models in a visual comparison. Not only did the algorithm provide crisper land cover forms, but it also produced more accurate results, particularly for mixed-type categorization. Some tiny objects were easily misclassified in the dual-FCN8s model, and local erroneous bounds were created, causing departure from the true borders. The uNet-Resnet result revealed that some information on the land cover boundary were missing. Small land cover regions tended to be circular, and certain inaccurate classifications were magnified when the common-structure FCN8s and uNet models were used directly, particularly for the FCN8s model.

Figure 7.
The detailed classification results of the Wangyedian forest farm. (a) GF-2; (b) label; (c) dual-uNet-Resnet; (d) dual-FCN8s; (e) UNet-Resnet; (f) UNet; (g) FCN8s.
4. Discussion
We developed a novel deep fusion model employing HSR remote sensing imagery from two dates to improve the performance of forest type categorization at the tree species level. The experimental results demonstrated that the proposed model could efficiently extract the main tree species and forest types in the research regions, particularly plantation species such as Chinese pine, Larix principis, which all had an OA greater than 90.00%.
The time phase of multi-temporal remote sensing data was particularly crucial since the major objective of this work is to classify forest types at the tree species level using multi-temporal HSR optical remote sensing images. The images in May, June, and September were chosen in this study based on the findings of the literature [46] and the present state of available GF-2 data in the experimental area for the last 3 years. These periods relate to the growth and defoliation stages of vegetation in the experimental area, and they include a variety of phenological data that aids in the classification task. It is worth mentioning that the two-branch optimized deep learning model outperformed traditional methods such as the original uNet when it regarded extracting forest types from multi-temporal satellite data (Table 4). We also strived to incorporate the December image into the training dataset for classification during the research process in order to improve classification results. However, the accuracy was dramatically decreased when the December image was added, and the snow cover area had a considerable impact on the classification result. Thus, the data of vegetation growth phase and early defoliation period should be selected as much as feasible when employing HSR remote sensing images for forest type classification. If obtaining available images during the stages of vegetation’s growth and defoliation was challenging, the method of multi-resolution optical data fusion, which is also the next research topic of this study, might be employed for modeling.
Moreover, since this study adopted the supervised deep learning optimization method to perform forest type classification, the quality and quantity of training samples had a major impact on the model’s classification result. We employed 149 samples in the experiment, including 119 training samples and 30 verification samples. However, when compared to similar studies that performed FCN-based HSR remote sensing classification, the work obtained comparable classification results with a smaller sample size. Liu et al. (2018) carried out remote sensing classification of land use types based on the FCN model. In this study, a total of seven land use types were extracted, and the classification accuracy was 87.1% [47]. However, this study used 400 orthophotos to extract 2800 sample blocks, and the sample size was much larger than that of this study. Fu et al. (2017) used the FCN model and two dates of GF-2 images to extract the land use types of urban areas. The OA was 81% for 12 land use types [22]. The study divided the two dates of remote sensing images into 74 image blocks, with each image block having a pixel size of 1024 pixels, including 70 blocks for training and four blocks for testing. The pixel size of each image block in our study is only 310 pixels, the sample size was much smaller than that of this study, but the classification accuracy of our study was better.
Compared with the previous research results of the forest classification at tree species level using multi-temporal HSR data, the proposed model got better performance. Agata (2019) classified tree species based on multi-temporal Sentinel-2 and DEM following the stratified approach with a classification accuracy of 89.5% for broadleaf and 82% for coniferous species [46]. Ren (2019) based on multi-temporal SPOT-5 and China’s GF-1 data performed the fine classification of forest types with an accuracy of up to 92% [48]. Persson (2018) classified common tree species over a mature forest in central Sweden based on a multi-temporal Sentinel-2 dataset with a classification accuracy of 88.2% [13].
When compared to earlier research results of the forest type classification utilizing HSR data in the same test region, the approach proposed in the study gotbetter performance. Xie (2019) based on multi-temporal ZY-3 data, carried out the classification of tree species, forest type, and land cover type in the Wangyedian forest farm and got the overall accuracy of 84.9% [15], which was lower than the results of this study. For the results of the tree species classification, the performance of the Larix principis category improved obviously using the proposed model which increased from 87.3% to 93.24%. The proposed model in this study also got better performance than the results in [34], which improved from 85.89% to 93.30%. Categories with an obvious improvement included the Larix principis, White birch and aspen, Construction land type, in which accuracy increased from 91.3% to 92.54%, from 80.65% to 85.71%, and from 43.75% to 100.00%, respectively. Compared with the results of [32], the proposed model also performed better, especially for the results of the Larix principis category, in which the accuracy increased from 89.86% to 92.54%.
In order to obtain the optimal structure of the proposed model, we also evaluated the network design of the proposed model. First, four residual networks with varying depths at the encoder were compared. The various fusion techniques at the decoder were then examined. Finally, the classification effects of including a residual convolution module, a standard convolution module, and not including convolution in the skip connection were assessed.
4.1. Impact of the Depth of Residual Network on Classification Results
Resnet 18, Resnet 34, Resnet 50, and Resnet 101 were included in the comparative residual networks. Table 5 showed that the Resnet 50, better than the other three models, had pretty excellent results in classification. The weight of the Resnet 50 was updated by 19 s per epoch. Although the processing speed was not the fastest, however, it got the best performance by the comprehensive comparison. For the remaining three models, the classification effect of the proposed model based on Resnet 34 and Resnet 101 were similar, but the running speed of the Resnet 34 was much faster than the Resnet 101, which increased from 31 to 19 s for one epoch update. The processing speed of the Resnet 18 was the fastest, but its classification effect was relatively poor, possibly due to the shallow depth of the residual network.
Table 5.
Impact of the depth of residual network on classification accuracy.
Figure 8 depicted the classification results of the four residual networks in further detail. All the residual networks above performed well, except the Larix principis category was misclassified as Chinese pine by Resnet 18, and the Korean pine category was misclassified as Construction land by Resnet 101.

Figure 8.
The detailed classification results of the four residual networks as encoder. (a) GF-2; (b) label; (c) Resnet 50; (d) Resnet 34; (e) Resnet 18; (f) Resnet 101.
4.2. Impact of the Different Fusion Strategies of the Decoder
Table 6 displayed the results of two types of decoder fusion strategies: Final decision layer fusion (dual-uNet-Resnet-DeMerge) and multi-level fusion involving all of the layer fusion (dual-uNet-Resnet). It was clear that the multi-level fusion technique outperformed the decision layer fusion technique, particularly for the Larix principis, Cultivated land, and Grassland categories. This might due to the fact that spatial information could be extracted more efficiently from the multi-level fusion technique, particularly for types with regular shape and texture. Figure 9 depicted the results of the two decoder fusion procedures in further detail. It was clear that the multi-level fusion method produced superior outcomes. The multi-level fusion technique significantly improved the categorization result of the Larix principis category.
Table 6.
Impact of the different fusion strategy of the decoder on classification accuracy.

Figure 9.
The detailed information of the results with two decoder fusion strategies of the Wangyedian forest farm (a) GF-2; (b) label; (c) dual-uNet-Resnet; (d) dual-uNet-Resnet-DeMerge.
4.3. Impact of Inserting the Convolution Module into the Skip Connection
One of the major components of the uNet model is the skip connection. The research investigated the classification impact of adding the residual convolution module (dual-uNet-Resnet), ordinary convolution module (dual-uNet-Resnet-ConvConnect), and without any convolution module (dual-uNet-Resnet-WithoutConnect) in the skip connection to validate the effect of adding the convolution module of different architectures in the skip connection. According to Table 7, the classification accuracy significantly improved as the complexity of the convolution module increased. First, the overall classification accuracy was raised from 91.01% to 93.30%. This trend has also been shown by the optimization effects of Larix principis, Cultivated land, Construction land, Shrub land, and Grassland. As shown in Figure 10, the classification accuracy increased following the addition of the residual convolution module, particularly in areas with several categories.
Table 7.
Impact of inserting the convolution module into the skip connection.

Figure 10.
The detailed information of without and with convolution module and residual convolutional module into the skip connection (a) GF-2; (b) label; (c) dual-uNet-Resnet; (d) dual-uNet-Resnet-ConvConnect; (e) dual-uNet-Resnet-WithoutConnect.
5. Conclusions
We proposed a novel deep fusion uNet model based on the multi-temporal HSR satellite data in this study to maximize forest mapping performance at the tree species level. To increase pixel-wise mapping accuracy, the suggested approach combined the benefit of phenological difference from multi-temporal data with the powerful features of the deep Res-uNet model. With an OA of 93.30% and a Kappa of 0.9229 for the test regions, it demonstrated the model’s excellent potential for forest mapping at the tree species level. The results also show that it was possible to obtain a remarkable result for mapping plantation species such as Chinese pine and Larix principis tree species.
In view of the importance of forest resource mapping, the proposed deep fusion uNet model provided a feasible optimization idea for the forest type mapping at the tree species level based on the multi-temporal HSR images, which will make an important contribution to improving the management level and sustainable development of China’s forest resources.
Author Contributions
Y.G. conceptualized the manuscript topic and was in charge of overall direction and planning. Z.L. and E.C. reviewed and edited the first draft of the manuscript. X.Z. provided valuable information for field survey site selection. L.Z. and L.L. was involved in field data collection. E.X. and Y.H. carried out the preprocessing of the images and were involved in field data collection. Authorship must be limited to those who have contributed substantially to the work reported. All authors have read and agreed to the published version of the manuscript.
Funding
This research was funded by the Special Funds for Fundamental Research Business Expenses of Central Public Welfare Research Institutions “Study on Image Diagnosis Technology of Main Diseases and Insect Pests of Rare Tree Species (CAFYBB2021ZB002)” project and “National Science and Technology Major Project of China’s High Resolution Earth Observation System (Project Number: 21-Y20B01-9001-19/22).”
Acknowledgments
We express our sincere thanks to the Shengli Yu Engineer from Wangyedian Forest Farm for field guidance. We would like to thank the Wangyedian Forest Farm for providing the valuable datasets. The authors are also grateful to the editors and referees for their constructive criticism on this paper.
Conflicts of Interest
The authors declare no conflict of interest.
References
- Van Aardt, J.A.N.; Wynne, R.H. Examining pine spectral separability using hyperspectral data from an airborne sensor: An extension of field-based results. Int. J. Remote Sens. 2007, 28, 431–436. [Google Scholar] [CrossRef]
- Shang, X.; Chisholm, L.A. Classification of Australian Native Forest Species Using Hyperspectral Remote Sensing and Machine-Learning Classification Algorithms. IEEE J. Sel. Top. Appl. Earth Obs. Remote Sens. 2014, 7, 2481–2489. [Google Scholar] [CrossRef]
- Boschetti, M.; Boschetti, L.; Oliveri, S.; Casati, L.; Canova, I. Tree Species Mapping with Airborne Hyper-spectral MIVIS Data: The Ticino Park Study Case. Int. J. Remote Sens. 2007, 28, 1251–1261. [Google Scholar] [CrossRef]
- Jansson, G.; Angelstam, P. Threshold Levels of Habitat Composition for the Presence of the Long-Tailed Tit (Aegithalos Caudatus) in a Boreal Landscape. Landsc. Ecol. 1999, 14, 283–290. [Google Scholar] [CrossRef]
- Myint, S.W.; Gober, P.; Brazel, A.; Grossman-Clarke, S.; Weng, Q. Per-Pixel vs. Object-Based Classification of Urban Land Cover Extraction Using High Spatial Resolution Imagery. Remote Sens. Environ. 2011, 115, 1145–1161. [Google Scholar] [CrossRef]
- Johansen, K.; Coops, N.C.; Gergel, S.E.; Stange, Y. Application of High Spatial Resolution Satellite Imagery for Riparian and Forest Ecosystem Classification. Remote Sens. Environ. 2007, 110, 29–44. [Google Scholar] [CrossRef]
- Deur, M.; Gašparović, M.; Balenović, I. Tree Species Classification in Mixed Deciduous Forests Using Very High Spatial Resolution Satellite Imagery and Machine Learning Methods. Remote Sens. 2020, 12, 3926. [Google Scholar] [CrossRef]
- Immitzer, M.; Atzberger, C.; Koukal, T. Tree Species Classification with Random Forest Using Very High Spatial Resolution 8-Band WorldView-2 Satellite Data. Remote Sens. 2012, 4, 2661–2693. [Google Scholar] [CrossRef] [Green Version]
- Key, T.; Warner, T.A.; McGraw, J.B.; Fajvan, M.A. A Comparison of Multispectral and Multitemporal Information in High Spatial Resolution Imagery for Classification of Individual Tree Species in a Temperate Hardwood Forest. Remote Sens. Environ. 2001, 75, 100–112. [Google Scholar] [CrossRef]
- Nelson, M. Evaluating Multitemporal Sentinel-2 Data for Forest Mapping Using Random Forest. Master’s Thesis, Stockholm University, Stockholm, Sweden, 2017. [Google Scholar]
- Wessel, M.; Brandmeier, M.; Tiede, D. Evaluation of Different Machine Learning Algorithms for Scalable Classification of Tree Types and Tree Species Based on Sentinel-2 Data. Remote Sens. 2018, 10, 1419. [Google Scholar] [CrossRef] [Green Version]
- Persson, M.; Lindberg, E.; Reese, H. Tree Species Classification with Multi-Temporal Sentinel-2 Data. Remote Sens. 2018, 10, 1794. [Google Scholar] [CrossRef] [Green Version]
- Liu, Y.; Gong, W.; Hu, X.; Gong, J. Forest Type Identification with Random Forest Using Sentinel-1A, Sentinel-2A, Multi-Temporal Landsat-8 and DEM Data. Remote Sens. 2018, 10, 946. [Google Scholar] [CrossRef] [Green Version]
- Lim, J.; Kim, K.-M.; Kim, E.-H.; Jin, R. Machine Learning for Tree Species Classification Using Sentinel-2 Spectral Information, Crown Texture, and Environmental Variables. Remote Sens. 2020, 12, 2049. [Google Scholar] [CrossRef]
- Xie, Z.; Chen, Y.; Lu, D.; Li, G.; Chen, E. Classification of Land Cover, Forest, and Tree Species Classes with ZiYuan-3 Multispectral and Stereo Data. Remote Sens. 2019, 11, 164. [Google Scholar] [CrossRef] [Green Version]
- Zhu, X.X.; Tuia, D.; Mou, L.; Xia, G.-S.; Zhang, L.; Xu, F.; Fraundorfer, F. Deep Learning in Remote Sensing: A Comprehensive Review and List of Resources. IEEE Trans. Geosci. Remote Sens. 2017, 5, 8–36. [Google Scholar] [CrossRef] [Green Version]
- Zhang, C.; Pan, X.; Li, H.; Gardiner, A.; Sargent, I.; Hare, J.; Atkinson, P.M. A Hybrid MLP-CNN Classifier for Very Fine Resolution Remotely Sensed Image Classification. ISPRS J. Photogramm. Remote Sens. 2018, 140, 133–144. [Google Scholar] [CrossRef] [Green Version]
- Zhao, W.; Du, S. Learning Multiscale and Deep Representations for Classifying Remotely Sensed Imagery. ISPRS J. Photogramm. Remote Sens. 2016, 113, 155–165. [Google Scholar] [CrossRef]
- Zhao, W.; Guo, Z.; Yue, J.; Zhang, X.; Luo, L. On Combining Multiscale Deep Learning Features for the Classification of Hyperspectral Remote Sensing Imagery. Int. J. Remote Sens. 2015, 36, 3368–3379. [Google Scholar] [CrossRef]
- Long, J.; Shelhamer, E.; Darrell, T. Fully Convolutional Networks for Semantic Segmentation. In Proceedings of the IEEE Conference on Computer Vision and Pattern Recognition (CVPR), Boston, MA, USA, 7–12 June 2015; pp. 3431–3440. [Google Scholar]
- Fu, G.; Liu, C.; Zhou, R.; Sun, T.; Zhang, Q. Classification for High Resolution Remote Sensing Imagery Using a Fully Convolutional Network. Remote Sens. 2017, 9, 498. [Google Scholar] [CrossRef] [Green Version]
- Peng, C.; Li, Y.; Jiao, L.; Chen, Y.; Shang, R. Densely Based Multi-Scale and Multi-Modal Fully Convolutional Networks for High-Resolution Remote-Sensing Image Semantic Segmentation. IEEE J. Sel. Top. Appl. Earth Obs. Remote Sens. 2019, 12, 2612–2626. [Google Scholar] [CrossRef]
- Guo, Y.; Liu, Y.; Georgiou, T.; Lew, M.S. A Review of Semantic Segmentation Using Deep Neural Networks. Int. J. Multimed. Inf. Retr. 2018, 7, 87–93. [Google Scholar] [CrossRef] [Green Version]
- Garcia-Garcia, A.; Orts-Escolano, S.; Oprea, S.; Villena-Martinez, V.; Garcia-Rodriguez, J. A Review on Deep Learning Techniques Applied to Semantic Segmentation. arXiv 2017, arXiv:1704.06857. [Google Scholar]
- Ronneberger, O.; Fischer, P.; Brox, T. U-Net: Convolutional Networks for Biomedical Image Segmentation. In Medical Image Computing and Computer-Assisted Intervention—MICCAI 2015; Navab, N., Hornegger, J., Wells, W.M., Frangi, A.F., Eds.; Lecture Notes in Computer Science; Springer: Cham, Switzerland, 2015; pp. 234–241. [Google Scholar] [CrossRef]
- Wang, Y.; Chen, E.; Guo, Y.; Li, Z.; Jin, Y.; Zhao, J.; Zhou, Y. Deep U-Net Optimization Method for Forest Type Classification with High Resolution Multispectral Remote Sensing Images. For. Res. 2020, 33, 11–18. [Google Scholar] [CrossRef]
- Cao, K.; Zhang, X. An Improved Res-UNet Model for Tree Species Classification Using Airborne High-Resolution Images. Remote Sens. 2020, 12, 1128. [Google Scholar] [CrossRef] [Green Version]
- He, K.; Zhang, X.; Ren, S. Deep Residual Learning for Image Recognition. In Proceedings of the 2016 IEEE Conference on Computer Vision and Pattern Recognition (CVPR), Las Vegas, NV, USA, 27–30 June 2016; pp. 770–778. [Google Scholar]
- Ienco, D.; Interdonato, R.; Gaetano, R.; Ho Tong Minh, D. Combining Sentinel-1 and Sentinel-2 Satellite Image Time Series for Land Cover Mapping via a Multi-Source Deep Learning Architecture. ISPRS J. Photogramm. Remote Sens. 2019, 158, 11–22. [Google Scholar] [CrossRef]
- Scott, G.J.; Marcum, R.A.; Davis, C.H.; Nivin, T.W. Fusion of Deep Convolutional Neural Networks for Land Cover Classification of High-Resolution Imagery. IEEE Geosci. Remote Sens. Lett. 2017, 14, 1638–1642. [Google Scholar] [CrossRef]
- Scott, G.J.; Hagan, K.C.; Marcum, R.A.; Hurt, J.A.; Anderson, D.T.; Davis, C.H. Enhanced Fusion of Deep Neural Networks for Classification of Benchmark High-Resolution Image Data Sets. IEEE Geosci. Remote Sens. Lett. 2018, 15, 1451–1455. [Google Scholar] [CrossRef]
- Guo, Y.; Li, Z.; Chen, E.; Zhang, X.; Zhao, L.; Chen, Y.; Wang, Y. A Deep Learning Method for Forest Fine Classification Based on High Resolution Remote Sensing Images: Two-Branch FCN-8s. Sci. Silvae Sin. 2020, 3, 48–60. [Google Scholar] [CrossRef]
- Guo, Y.; Li, Z.; Chen, E.; Zhang, X.; Zhao, L.; Chen, Y.; Wang, Y. A Deep Learning Forest Types Classification Method for Resolution Multispectral Remote Sensing Images: Dual-FCN8s-CRF. In Proceedings of the 2019 IEEE International Geoscience and Remote Sensing Symposium, Yokohama, Japan, 28 July–2 August 2019. [Google Scholar]
- Guo, Y.; Li, Z.; Chen, E.; Zhang, X.; Zhao, L.; Xu, E.; Hou, Y.; Sun, R. An End-to-End Deep Fusion Model for Mapping Forests at Tree Species Levels with High Spatial Resolution Satellite Imagery. Remote Sens. 2020, 12, 3324. [Google Scholar] [CrossRef]
- GB/T 26424-2010. Technical Regulations for Inventory for Forest Management Planning and Design; Chinese GB Standards: Shenzhen, China, 2011. [Google Scholar]
- China Centre for Resources Satellite Data and Application. The Introduction of GF-2 Satellite. Available online: http://218.247.138.119/CN/Satellite/3128.shtml (accessed on 12 June 2021).
- Cooley, T.; Anderson, G.P.; Felde, G.W.; Hoke, M.L.; Ratkowski, A.J.; Chetwynd, J.H.; Gardner, J.A.; Adler-Golden, S.M.; Matthew, M.W.; Berk, A.; et al. FLAASH, a MODTRAN4-based atmospheric correction algorithm, its application and validation. In Proceedings of the IGARSS 2002, Toronto, ON, Canada, 24–28 June 2002; pp. 1414–1418. [Google Scholar] [CrossRef]
- Cao, H.; Gao, W.; Zhang, X.; Liu, X.; Fan, B.; Li, S. Overview of ZY-3 satellite research and application. In Proceedings of the 63rd IAC (International Astronautical Congress), Naples, Italy, 1–5 October 2012. [Google Scholar]
- Gao, Y.; Zhang, W. Comparison test and research progress of topographic correction on remotely sensed data. Geogr. Res. 2008, 27, 467–477. [Google Scholar] [CrossRef]
- Sun, W.; Chen, B.; Messinger, D.W. Nearest-neighbor diffusion-based pansharpening algorithm for spectral images. Opt. Eng. 2014, 53, 013107. [Google Scholar] [CrossRef] [Green Version]
- Hirose, Y.; Yamashita, K.; Hijiya, S. Back-Propagation Algorithm Which Varies the Number of Hidden Units. Neural Netw. 1991, 4, 61–66. [Google Scholar] [CrossRef]
- Nair, V.; Hinton, G. Rectified Linear Units Improve Restricted Boltzmann Machines. In Proceedings of the 27th International Conference on Machine Learning (ICML-10), Haifa, Israel, 21–24 June 2010; pp. 807–814. [Google Scholar]
- Moolayil, J. An Introduction to Deep Learning and Keras: A Fast-Track Approach to Modern Deep Learning with Python; Apress: Thousand Oaks, CA, USA, 2018; pp. 1–16. [Google Scholar]
- Drakopoulos, G.; Liapakis, X.; Spyrou, E.; Tzimas, G.; Sioutas, S. Computing long sequences of consecutive fibonacci integers with tensorflow. In Proceedings of the International Conference on Artificial Intelligence Applications and Innovations, Dubai, UAE, 30 November 2019; pp. 150–160. [Google Scholar]
- Kingma, D.; Ba, J. Adam: A Method for Stochastic Optimization. In Proceedings of the 3rd International Conference for Learning Representations, San Diego, CA, USA, 7–9 May 2015. [Google Scholar]
- Hościło, A.; Lewandowska, A. Mapping Forest Type and Tree Species on a Regional Scale Using Multi-Temporal Sentinel-2 Data. Remote Sens. 2019, 11, 929. [Google Scholar] [CrossRef] [Green Version]
- Liu, X.; Jiao, L.; Zhao, J.; Zhao, J.; Zhang, D.; Liu, F.; Yang, S.; Tang, X. Deep Multiple Instance Learning-Based Spatial–Spectral Classification for PAN and MS Imagery. IEEE Trans. Geosci. Remote Sens. 2018, 56, 461–473. [Google Scholar] [CrossRef]
- Ren, C.; Ju, H.; Zhang, H.; Huang, J. Forest land type precise classification based on SPOT5 and GF-1 images. In Proceedings of the 2016 IEEE International Geoscience and Remote Sensing Symposium, Beijing, China, 10–15 July 2016; pp. 894–897. [Google Scholar]
Publisher’s Note: MDPI stays neutral with regard to jurisdictional claims in published maps and institutional affiliations. |
© 2021 by the authors. Licensee MDPI, Basel, Switzerland. This article is an open access article distributed under the terms and conditions of the Creative Commons Attribution (CC BY) license (https://creativecommons.org/licenses/by/4.0/).