Abstract
Rapid urbanization is one of the most concerning issues in the 21st century because of its significant impacts on various fields, including agriculture, forestry, ecology, and climate. The urban heat island (UHI) phenomenon, highly related to the rapid urbanization, has attracted considerable attention from both academic scholars and governmental policymakers because of its direct influence on citizens’ daily life. Land surface temperature (LST) is a widely used indicator to assess the intensity of UHI significantly affected by the local land use/cover (LULC). In this study, we used the Landsat time-series data to derive the LULC composition and LST distribution maps of Nanjing in 2000, 2014, and 2018. A correlation analysis was carried out to check the relationship between LST and the density of each class of LULC. We found out that cropland and forest in Nanjing are helping to cool the city with different degrees of cooling effects depending on the location and LULC composition. Then, a Cellar Automata (CA)-Markov model was applied to predict the LULC conditions of Nanjing in 2030 and 2050. Based on the simulated LULC maps and the relationship between LST and LULC, we delineated high- and moderate-LST related risk areas in the city of Nanjing. Our findings are valuable for the local government to reorganize the future development zones in a way to control the urban climate environment and to keep a healthy social life within the city.
1. Introduction
Following the rapid development of urbanization and industrialization, the quantity, structure, and degree of land use/cover (LULC) have been significantly changed over the past years, especially in developing countries [1,2]. Meanwhile, the urban heat island (UHI) phenomenon has become severely causing excessive consumption of energy, an increase of air pollutants, and deterioration of the environment [3]. Therefore, by determining the relationship between land surface temperature (LST) and LULC distribution, we can evaluate the impact of urbanization on LST, which is crucial for sustainable urban development.
The key physical drivers of the UHI are fivefold as summarized by Coffel et al. [4]: (1) the increase of flat and cemented surface at the expense of frictional surfaces in urban areas, which leads to the reduction in the efficiency of convective heat transfer between the surface and lower atmosphere causing an intensified UHI mainly in humid regions as pointed out by Zhao et al. [5]; (2) the loss of vegetation cover results in less evaporative cooling effects; (3) the increased energy absorption capacities caused by a lower albedo; (4) the enhanced capacities of energy storage as a consequence of used artificial materials; and finally (5) the anthropogenic waste heat released from homes, industrial facilities, and transportation means. Other researchers have linked the observed variations of urban climate with the effects of urban morphology given the importance of ventilation in dispersing pollutants and disseminating heat [6,7]. Most of the abovementioned factors are related to LULC changes resulted from fast and extensive unplanned urbanization leading to an expansion in impervious surfaces, which further aggravates the soil moisture deficit and causes a decrease of evapotranspiration [8]. Consequently, LST is always higher in urban areas than in rural areas [9]. In recent years, however, these temperature differences have become even higher due to the distance gap between urban and rural areas [10,11,12]. Based on these conditions, examining the relationship between LULC and LST is essential to find ways to relieve UHI impacts on urban environments.
Remote sensing techniques have been used to retrieve LST from satellite images, which enabled the analysis of the dynamic conditions in different areas [13]. Some studies have examined the relationship between LST and indicators such as Normalized Difference Vegetation Index (NDVI), Normalized Difference Built-up Index (NDBI), and Normalized Difference Water Index (NDWI) [14,15]. It is worth mentioning that several limitations have been pointed out when comparing LST with these indicators as different LULC types have different surface reflectance and roughness which affect LST values. Additionally, seasonality, time of the day, and research methods are also aspects that can influence the accuracy of extracting LST [16]. Moreover, planned and traditional cities have different urban structures, which also impacts the LST [17]. Controlling the LST in the central area is crucial for people’s health, living environment, and sustainable development. On the other hand, LULC change is a long-term process that is influenced by human activities, historical trends, natural disasters, and city planning. Therefore, it is essential for re-planning the LULC distribution to decrease LST to moderate levels and consequently to establish sustainable development for the future.
Simulating the future LULC should be proposed under a particular environment, such as study area, future plan, economic demand, and sustainable development strategy [18]. Simulating future LULC studies have been considered as valuable because they provide critical insights to city planners [19]. Nanjing, with a history of over 2500 years, is the ancient capital of six Chinese dynasties. The city plan has attracted extensive interest because of its necessity in combining cultural and historical aspects with modernity. In 2000, the Nanjing Bureau of Planning and Natural Resources released new urban planning for sustainable development purposes [20]. Therefore, the time period between 2000 and 2018 was selected for monitoring LULC change in this study, whereas 2030 and 2050 were selected as target years to simulate future LULC patterns and to assess LST related risk areas.
This study aims at simulating future LULC changes in Nanjing in 2030 and 2050 and discussing future LST distribution with the purpose of providing a valuable reference to city planners about vulnerable areas to high LST in order to take the necessary measures to define new planning policies. To achieve that, we first discuss the spatiotemporal changes of LULC in Nanjing from 2000 to 2018. We then analyze the LULC impacts on LST composition and propose sustainable urban planning initiatives.
2. Materials and Methods
2.1. Study Area
In this study, we take Nanjing (Figure 1), the capital of Jiangsu province in China, as the study area. It is one of the most important cities in the Yangtze Delta with political, economic, and cultural significance. The city has over 2500 years of historical background, which has shaped the LULC change process. From 1978, Nanjing, like other Chinese cities, has experienced breakneck urbanization as a result of the Chinese economic reform. According to the National Bureau of Statistics, the total population of Nanjing increased from 6.13 million in 2000 to 8.34 million in 2018, with an annual increase rate of 12.28% [21]. In 2016, the area of the built-up in Nanjing expanded to 773.79 km2, pushing the city to rank as the ninth-largest among all Chinese cities [21].
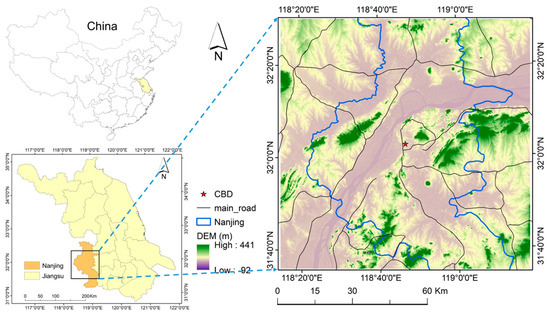
Figure 1.
Location map of Nanjing.
Nanjing has a subtropical monsoon climate with an average annual temperature of 16.1°C and annual precipitation of 1106.8 mm in 2017 [22]. The Yangtse River is crossing the area from southwest to east. In this study, a range of 31°34′–32°33′N and 118°15′–119°20′E, which is the central part of Nanjing city is decided as the study area (Figure 1). The topography of the study area ranges between an elevation of -92 m and 441 m with hilly and mountainous areas surrounding the city from almost all directions.
2.2. Workflow
The workflow of this study is shown in Figure 2. The final objectives are to simulate the future LULC development in 2030 and 2050 and to assess the risk of high LST distribution in order to support urban planning initiatives and sustainable development in the study area. To achieve these goals, several steps have been conducted. First, we applied the maximum likelihood classification to extract LULC maps from Landsat images. The principle of maximum likelihood supervised classification is based on training samples and is used to classify pixels into suitable LULC categories [23,24]. The selection of training samples was based on our previous knowledge of the geographical settings of the study area. Second, we conducted an urban-gradient analysis to monitor the urbanization trends in Nanjing. Third, we retrieved LST maps and conducted the regression analysis with LULC maps to examine the existing relationship. Lastly, we simulated the LULC in 2030 and 2050 using a hybrid model of Markov and CA models with the aim of assessing the LST related risk areas as a final step [25,26].
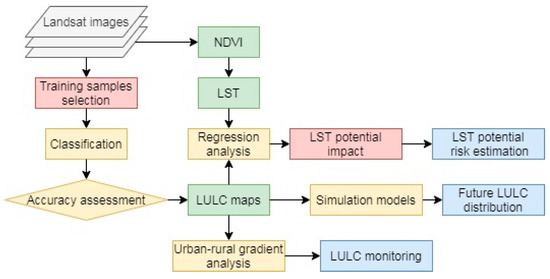
Figure 2.
The workflow of this study.
2.3. Data Processing
LULC and LST maps were extracted from three Landsat images captured on September 16, 2000 (Landsat 7 ETM+), November 18, 2014 (Landsat 8 OLI/TIRS) and October 12, 2018 (Landsat 8 OLI/TIRS) (Table 1). All the images were obtained from the United States Geological Survey (USGS) [27]. To avoid cloud-coverage issues, images were acquired during the autumn season with a cloud-coverage of less than 10%. Additionally, it is worth mentioning that seasonal variations also influence NDVI and LST values. Usually, from March to November, it is easy to distinguish the differences in LST intensities between different LULC classes [28]. Consequently, in this study, all the Landsat images were collected between these two months to exclude any possible seasonal variability effects.

Table 1.
List of Landsat images selected for the study.
Other auxiliary data, mainly the modeling variables for driving LULC changes, were collected as well, including the central business district (CBD), main roads, water areas, protected areas, Digital Elevation Model (DEM) and slope (See Figure A1 in Appendix A). The CBD is located in the central region of the study area, which has potential effects on economic development and urbanization. The main roads are always recognized as one of the essential factors influencing urban construction. The permanent water bodies and protected areas were selected for their quasi-stable status during the LULC change process as these areas are difficult to be converted into other LULC types. The DEM and slope data were considered due to the varied terrain topography of the study area, characterized by the disparity in elevation. The DEM was obtained from the USGS which was used to extract the slope map.
2.4. LST Retrieval
LST is a crucial factor that can reflect the surface temperature among different LULC types. For retrieving LST maps from Landsat images, several steps need to be conducted. Initially, the Digital Numbers (DNs) of thermal bands (band 6 in Landsat TM and ETM+, and band 10 in Landsat OLI/TIRS) should be converted into radiance values [29,30,31]. These values should be collected for calculating the at-satellite brightness temperature [3,32]. All images have been undergone atmospheric and emissivity correction procedures prior to the analysis. In this study, the preprocessed band 6 of Landsat 7 in 2000 and band 10 of Landsat 8 in 2014 and 2018 were used for expressing at-satellite brightness temperature in Kelvin. The mathematic equation of land surface emissivity can be expressed as follows [33]:
where is the proportion of vegetation, which can be calculated using the following equation:
where NDVI refers to the Normalized Difference Vegetation Index, which reflects the vegetation density of land. It can be derived from the red and near-infrared bands of Landsat images [34] using the following formula:
Lastly, LST values can be calculated using the following equation [35]:
where TB is band 6 in Landsat ETM+, and band 10 in Landsat OLI/TIRS; λ is the wavelength of emitted radiance (11.5 μm for Landsat ETM+ band 6 and 10.8 μm for Landsat OLI/TIRS band 10) [36]; = h × c/σ (1.438 × 10⁻² mK), σ = the Boltzmann constant (1.38 × 10⁻²³ J/K), h = Planck’s constant (6.626 × 10⁻³⁴ Js), and c = velocity of light (2.998 × 10⁸ m/s); and is the land surface emissivity, which can be obtained by Equation (1).
2.5. LULC Classification
LULC classification is a significant challenge when it comes to obtaining complex LULC distribution information from Landsat data [18,37]. Several classification methods have been employed in different studies depending on the target area and the spatial resolution of the satellite images [38,39,40]. From a performance perspective, the maximum likelihood supervised classification method provides an accurate outcome [23]. Therefore, we selected it as the primary classification method in this study. Based on the statistic features of remote sensing data, the maximum likelihood supervised classification method can calculate the mean value and variance to establish a function. According to this function, each pixel can verify their belonging category by plugging it into this equation.
The maximum likelihood supervised classification method was employed to classify LULC maps using ArcGIS 10.4 software. Based on the purpose of this study, four LULC categories were considered, namely built-up, cropland, green, and water. The built-up category includes impervious surfaces such as buildings, roads, airports, parking lots, and sidewalks. The cropland category consists of agricultural lands without tree canopy. The category of green comprises forest, woodland, shrubland, grassland, and green spaces with the tree canopy. The water category contains all water bodies, such as rivers, lakes, ponds, reservoirs, and wetlands. The number of training samples selected on Landsat images for classification was 368, 395, and 386 for 2000, 2014, and 2018, respectively. The range of pixels’ size is between 80 and 140 for all the training samples. Finally, an accuracy assessment was conducted to confirm the exactitude of the LULC maps.
2.6. Urban-Rural Gradient Analysis
A prefecture-level city always consists of several spaces. Each space serves certain or multiple urban purposes. Since these sectors have different characteristics, their LULC composition differs. Keeping in mind that LULC composition strongly influences the future development potential in terms of sustainability and economy, it is essential to analyze the LULC composition for each zone to perceive the future trends of LULC. Urban-rural gradient analysis is a method to analyze the spatial distribution of different LULC classes by predefined distance ranges from the city center all the way to the nearby rural areas [1,39]. The method can help to understand the urbanization structure and discover further opportunities for potential development in the city. In this study, 50 ring buffers were created from the city center to the rural areas in Nanjing with a distance interval of 1 km.
2.7. Markov Model
Markov model is a stochastic model that can trace the changing process from one state to another. The future state is only influenced by the current state, and each state should keep the same time step [41]. Markov model can be applied to reflect the change of LULC process [25,42]: (1) all the LULC types can change from each other under the historical influence; (2) LULC change is a complicated process which is influenced by several parameters and cannot be described by simple functions; and (3) the transformation of LULC is stable during the time period. Based on its characteristics, the Markov model is an essential method for simulating future LULC changes. Therefore, it was considered for the LULC simulation. The Markov process can be written as follows:
where is the transition state probability in time period , and is the current state probability in time period .
During the LULC transition process in the Markov model, the condition of LULC in the next time period is only influenced by the current state and the transition rule subordinated to the transition probability matrix [43]. The original transition probability matrices can be calculated from LULC maps, and the LULC category in a one-time period should be defined before employing the Markov model. This can be expressed as follows:
where refers to the transformation probability matrix of LULC changes occurred from ith category into jth within one time period, and n is the land use category in the study area. P should meet the following condition:
By considering that LULC maps do not keep the same time period, the “Hazard rate approach” was applied during the Markov process. The per unit time transition matrix should be calculated using the following equation:
where is the hazard rate in one year.
In this study, the transition probability matrix from 2014 to 2018 was calculated using the Markov model at first. Next, the hazard rate approach was combined with a Markov model to extract a one-year transition probability matrix from 2014 to 2018. Finally, the employed model was set to calculate the one-year transition probability matrix 12 and 32 times to simulate the LULC map in 2030 and 2050, respectively.
2.8. Cellular Automata-Markov Model
The CA-Markov model is a hybrid model combining Markov and cellular automata models. Because of its ability to allocate spatial information of landscape, it has been widely used in land cover modeling and landscape prediction [1,44]. It has already gained an excellent reputation and has a prospective future in several fields, for instance: computer science, mathematics, and geographical science [45,46]. The CA-Markov model can be applied to spatiotemporally simulate future LULC distribution. The CA model is established of spatial cells, which are all independent and interactive with each other. The transition process of the CA model also can reflect the interaction among spatial cells. Because of these characteristics, it has also been applied for simulating the LULC process [47,48]. In the CA model, all cells should obey the specific transition rules. The transition rules employed a 3 × 3 neighborhood to affect the central cell condition in the future. Using the CA model to simulate the future LULC, the property of LULC types should be considered, for instance, the built-up area cannot transfer into the water in the near future [25].
LULC change is a complex process affected by historic trends, environmental effects, transition rules, and land use policy. To comprehensively simulate the LULC process, the CA model and the Markov model were combined to provide spatiotemporal changes. The following equation illustrates the cell changing process from time t to time t + 1 [49]:
where is the state of cell (i, j) at time t + 1, is the state of cell (i, j) at time t, is the transition suitability of cell (i, j) at time t, is the transition probability of cell (i, j) at time t, and is the interaction by surrounding cells under the transition rules.
3. Results
3.1. LULC Composition along the Urban-rural Gradient Analysis
Figure 3 shows the LULC maps of Nanjing in 2000, 2014, and 2018, respectively. It can be observed that built-up areas are concentrated in the central area and had been expanding from 2000 to 2018. The proportion of built-up increased from 5.91% in 2000 to 16.80% in 2014 and 22.85% in 2018 (Table 2). Cropland areas are mainly located in rural areas. As a result of the expansion of urban areas to meet the growing urbanization demand, cropland areas decreased from 713,951.55 ha in 2000 to 556,336.68 ha in 2018 (Table 2). On the other hand, no changes have been observed for green areas during the study period, and this is due to the location of these areas in the mountains. Similarly, no huge changes were witnessed in the total area of water bodies consisted mainly of the Yangtse River.
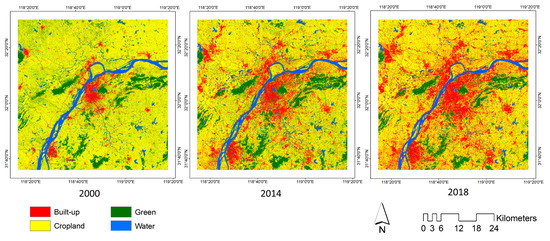
Figure 3.
LULC maps of Nanjing in 2000, 2014, and 2018.
Table 2.
Land use/cover (LULC) composition of Nanjing in 2000, 2014, and 2018.
The results of the urban-rural gradient analysis are shown in Figure 4. In general, the percentage of built-up areas decreased from the city center to rural areas. Compared with 2000, the proportion of built-up areas increased from 9 to 13 km in 2014 and 2018. Accordingly, it also can be found that built-up areas have expanded from the city center to the surrounding areas from 2000 to 2018 (Figure 3). On the contrary, cropland is increasing from the city center to the rural areas in all three years with a slight decrease of 10% in its total share from 2000 to 2018. The percentage of green fluctuated largely from 2000 to 2018, especially from 1 to 15 km. Water bodies remained stable in the study area from 2000 to 2018.
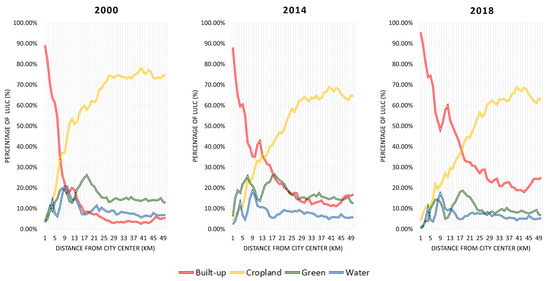
Figure 4.
Urban-rural gradient analysis of Nanjing in 2000, 2014, and 2018.
3.2. Relationship between LST and LULC
The spatial pattern of NDVI of Nanjing for 2000, 2014, and 2018 are presented in Figure 5. The NDVI values are ranging between −0.50 and 0.82 in 2000, −1 and 0.93 in 2014, −0.85 and 0.91 in 2018, respectively. Based on LULC maps illustrated in Figure 3, areas with the lowest NDVI values are mainly covered by water. On the other hand, the highest values of NDVI are mainly spread across mountainous areas, which correspond to forest areas. In general, NDVI maps are always influenced by LULC distribution and vegetation conditions.
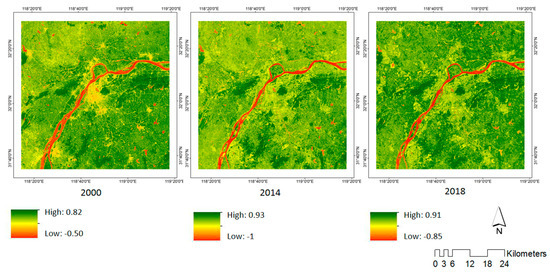
Figure 5.
Normalized Difference Vegetation Index (NDVI) maps of Nanjing in 2000, 2014, and 2018.
The LST maps of the study area for 2000, 2014, and 2018 are shown in Figure 6. On September 16, 2000, the LST of Nanjing ranged between 10.67 °C and 53.89 °C, with a mean value of 27.30 °C. On November 18, 2014, the LST ranged from 21.33 °C to 42.73 °C, with a mean value of 30.71 °C. And on October 12, 2018, the LST ranged between 0.82 °C and 36.99 °C, with a mean value of 20.83 °C. The LST value was influenced by several uncertain factors, such as water content, sunlight, wind velocity, and precipitation. All the ranges of LST maps in the three years have been normalized to a range from 0 to 1. Compared with the LULC maps (Figure 3), areas with the highest values of LST are mainly covered by built-up from 2000 to 2018. In contrast, cropland and green areas have the lowest LST values, which might indicate their contribution to cooling the city.
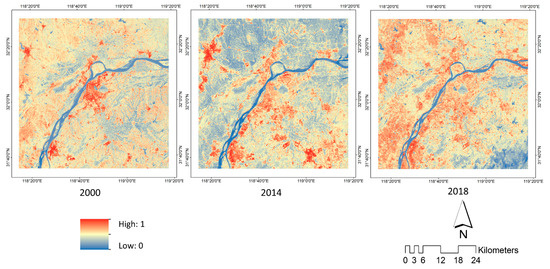
Figure 6.
Land surface temperature (LST) maps of Nanjing in 2000, 2014, and 2018.
To further prove the relationship between LULC, NDVI, and LST, a space lattice with a total of 625 points (2000, 2014, and 2018) was drawn from LULC, NDVI and LST maps. All LST values were normalized into a 0–1 scale to reduce the influence of uncertainties. It can be observed that the pattern of LULC dots of 2000 is different than the ones of 2014 and 2018. In 2000, most of LULC dots are clustered within the same range values of NDVI (i.e. 0–0.75) and LST (i.e. 0.5–0.75). Contrarily, larger ranges of LST (i.e. 0.25–0.75) can be observed during 2014 and 2018. In Figure 7, the locations of water dots are easy to distinguish from other LULC types as they are scattered with negative values of NDVI and LST values inferior to 0.5. The built-up dots are concentrated with high LST values. Contrarily, green dots have obviously high NDVI values with low LST values. To clearly understand the correlation between LULC and LST, we summarized the statistical values of the sample points in Table 3. We observed a continuous trend that built-up has the highest mean LST, followed by cropland, green, and water in the three years. In addition, the standard deviation ranged between 1.81°C (green) and 2.30 °C (water) in 2000, between 1.48 °C (water) and 2.21 °C (built-up) in 2014, and between 1.48 °C (built-up) and 2.97 °C (water) in 2018.
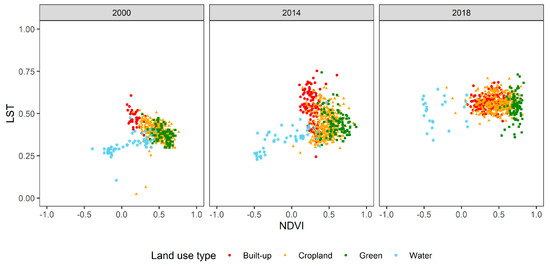
Figure 7.
The space lattice of LULC-NDVI-LST in 2000, 2014 and 2018.
Table 3.
Statistical results of categorized LST (°C) of Nanjing in 2000, 2014, and 2018.
3.3. Future LULC and LST in 2030 and 2050
The simulation results of LULC change in 2030 and 2050 are illustrated in Figure 8. Comparing the LULC maps of 2000, 2014, and 2018 (Figure 3), it can be observed that built-up areas are expected to continually expand and even occupy the nearby croplands surrounding them. The area percentages of each of the four LULC classes from 2000 to 2050 are shown in Figure 9. Same with other developing countries, built-up areas are expanding, to meet the demand of urbanization, at the expense of cropland that is consistently decreasing. Most of the green areas are expected to remain intact from 2018 to 2050. During the LULC change process, water is expected to preserve its share in the total area.
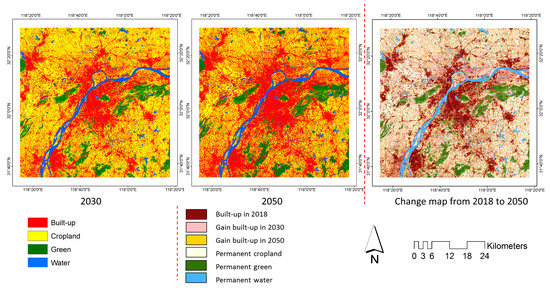
Figure 8.
LULC distribution of Nanjing in 2030 and 2050, and the change map from 2018 to 2050.
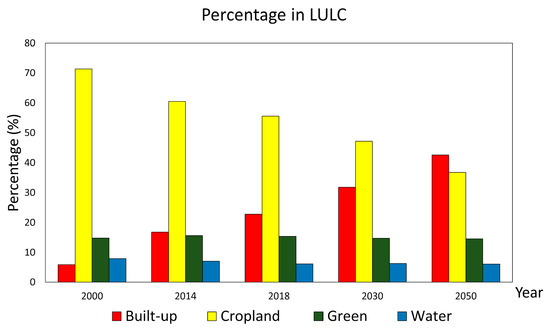
Figure 9.
Area percentages of the four LULC classes from 2000 to 2050.
Based on the relationship between LULC and LST, the future distribution of LST has been estimated (Figure 10). It can be observed that areas with high LST risk are expected to be distributed mainly in the central area in 2030 resulted from the forecasted built-up distribution. Whereas, moderate LST risk areas are anticipated to be located in several scattered settlements. The overall LST risk areas are expected to increase from 2030 to 2050. It is projected that the high LST risk areas will be expanded by 2050, and some new moderate LST risk areas are expected to be generated. The LST differences between the central area and the surrounding areas are forecasted to become higher, which may cause environmental problems that can have bad effects on human health. These simulation results may provide insights to the local government and city planners to take corrective measures for wiser sustainable urban development policies.
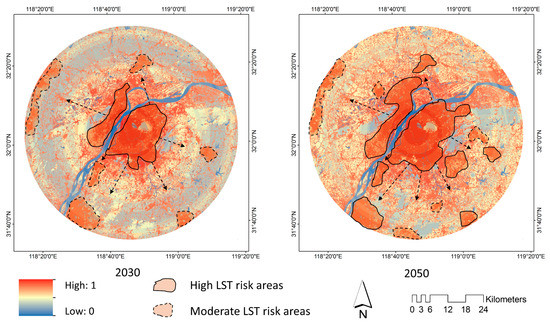
Figure 10.
LST risk areas of Nanjing in 2030 and 2050.
4. Discussion
Existing studies have pointed out that the increase of LST is related to urban growth, especially in developing countries [50]. The agglomeration and expansion of urban areas have a significant effect on the increase of impervious surfaces [51,52]. Moreover, previous studies have found that green space can maintain soil moisture to reduce LST [53]. In this study, we analyzed the relationship between LULC and LST by using remote sensing data. Our results, based on quantitative analysis and spatial distribution, showed that built-up, cropland, green, and water have different effects on LST. In addition, an interesting result has been found, which is the fact that the central LST of built-up has been reduced considerably from 2000 to 2018 (Figure 7). This might be attributed to the existence of natural obstacles in the form of water bodies and green spaces (high altitude) located in the central area. Meanwhile, built-up areas have expanded beyond these natural obstacles in almost all directions, creating what can be called a mixed LULC area (Figure 3).
In recent years, the relationship between LST and LULC has received more and more attention from researchers [14,54]. However, few of them have reached similar results because of regional differences and geographical settings of the targeted areas. In this research, Nanjing was selected as a case study reasoned by the fact that it is one of three furnace cities in China. Local people are suffering from high temperatures during summertime. Therefore, reducing the LST to moderate levels has become a critical target for improving the living standards and supporting future sustainable development. In this work, by combining remote sensing techniques and geographic information system capacities, we examined the impacts of multiple LULC categories on LST quantitatively and spatially. Furthermore, a simulation of future land use/cover changes in 2030 and 2050 has been conducted. ArcGIS and TerrSet software were used for LULC classification and examining LST changes in each LULC category at different spatial scales. The Landsat data of three different years during autumn season (2000, 2014 and 2018) of the Chinese city of Nanjing were acquired to analyze the LULC changes and their relationship with LST.
The monitoring result shows that during the urbanization and industrialization process, the built-up area had been expanding from the central area of the city to the suburban areas from 2000 to 2018. At the same time, the UHI phenomenon started to be observed in Nanjing. Many studies have shown that green space can help reducing LST, especially in the central area [15,55]. Additionally, mixed land use not only can enrich the living environment but also can decrease LST to support sustainable development [56,57]. Since it is prohibited to change protected green areas into other LULC categories, no significant changes have occurred in these areas during the study period. The LST values in these areas are lower than the ones observed in the central area.
Based on the extracted LST and LULC maps, the characteristics of UHI in Nanjing has been discussed. According to the simulated LULC maps of 2030 and 2050, similarly to other cities in developing countries, urban growth is expected to continue in the city (Figure 8). Additionally, maps of the LST risk area have been extracted and have been analyzed based on the thermal radiation characteristics of each LULC type (Figure 9). The result shows that if the urbanization sustained from 2018 to 2050, the high LST risk areas are expected to expand.
Based on the results of simulating LST risks in Nanjing, we propose the following three suggestions to alleviate the LST increase: (1) to promote the use of renewable energy resources and environmental protection materials: For example, using high reflectance materials on buildings’ walls or roofs to reduce absorption from solar radiation energy, and using water permeability materials to construct the urban roads in order to improve transpiration; (2) to build ecological cities that support sustainable development, where urban green areas can significantly decrease LST and improve the living standards; and (3) to properly redistribute the transportation network and to encourage the utilization of public transportation.
The Chinese government has always governed and regulated urbanization. In recent years, it has started to become aware of the risks posed by UHI on its sustainable development strategy. The sponge city, forest city, and climate-sensitive city are examples of the proposed cities of the future. All of them can decrease UHI by establishing built-up mixed green areas [58,59]. In this study, the government regulations related to environment protection has been considered to reduce the LST in the future simulation in 2030 and 2050. Compared with the past period 2000–2018, the impact of the population on urban planning is expected to getting smaller. In contrast, the limited supply of land and economical regulations have an increasing effect on LULC change. Therefore, to examine the current development situation of LULC and simulate the future LULC change under the green area protection regulations, it is possible to verify the feasibility of the current city plan to reduce the potential pressure on the environment in the future. According to the LULC maps in 2030 and 2050 (Figure 8), the built-up is continually increasing by occupying other LULC types. Compared with the period from 2000 to 2018, the urbanization speed has slowed down during the period from 2018 to 2050. This trend is conforming to the existing city planning forms in China.
Establishing a sustainable development in the future is always recognized as the ultimate objective in many LULC studies [60,61]. There are many factors that influence LST to engender the UHI phenomenon, such as psychrometrics, temperature, and intensity of illumination [62]. Compared with other factors, LULC is a relatively constant factor that predominantly influences the causation of UHI. By simulating future land use/cover changes and analyzing the relationship with LST, UHI effects can be effectively reduced. Land use/cover simulation not only can provide several scenarios of what can be occurred in the future but also avoid disparate development between social-economic and environmental protection.
Although increasing green space can relieve LST, there are still some limitations that should be pointed out. There are many extraneous and uncontrollable factors influencing LST such as precipitation, illumination, season, etc. This is the reason why LST is different day by day, even hour by hour. In this study, we only focused on the spatiotemporal correlation land use/cover types with LST. Therefore, in future research, we will assess the impacts of the density of green space and built-up areas, which impact the living environment to accommodate government policy and social problems.
5. Conclusions
In this study, we monitored the spatio-temporal dynamics of land use/cover and LST of Nanjing from 2000 to 2018. The results demonstrated that during the first 18 years of the 21st century, Nanjing had experienced rapid urbanization with the cost of a tremendous decrease in the agricultural lands. The expansion of impervious surfaces resulted from the process of rapid urbanization, has caused an increase in urban LST indicating that the UHI phenomenon has become more severe in Nanjing. Through a correlation analysis between LST and landscape composition, we found that forest and cropland had the highest potential in cooling the LST in Nanjing. A significant impact of water bodies on the temperature of the surrounding areas was not recognized. The cooling effects of cropland and forest differed when the surrounding landscape composition differed. Considering the abovementioned findings, it would be more efficient to find a suitable combination of landscape composition that would be more efficient in cooling the LST instead of merely increasing the cropland or forest.
The CA-Markov model was employed to simulate the land use/cover conditions of Nanjing in 2030 and 2050. From the empirical outcomes, we observed a continuous and fast urban expansion accompanied with the loss of cropland and forest. Based on the simulation, the central areas in Nanjing along the Yangtze River would be supposed to face severe UHI impacts in the coming future if no effective policies or regulations are established. The results of the carried analyses are an alarming information for the local government that the landscape of the central areas of Nanjing should be reorganized to cope up with the expected upcoming severe effects of UHI on the residents. Our study proposed a valuable framework to delineate and predict the risk of UHI in the future based on the changing land use/cover conditions. The method developed in this study would be applicable in other megacities to assess the areas with high LST risk.
Author Contributions
R.W. and H.H. proposed the topic and spearheaded the data processing and analysis, as well as the writing of the manuscript. H.H., Y.M., and A.D. helped in the design, research implementation, analysis, and the writing of the manuscript. All authors have read and agreed to the published version of the manuscript.
Fundings
This research was supported by the Japan Society for the Promotion of Science (JSPS) through Grants-in-Aid for Scientific Research 19J11409 (2019–2021) (Representative: Ruci Wang), Natural Science Foundation of Zhejiang Province: LQ20D010008 (2020-2022) (Representative: Hao Hou), and Japan Society for the Promotion of Science (JSPS) through Grant-in-Aid for Scientific Research (B) 18H00763 (2018-2020) (Representative: Yuji Murayama).
Acknowledgments
The authors would like to thank the anonymous reviewers for their valuable comments and suggestions.
Conflicts of Interest
The authors declare no conflicts of interest.
Appendix A

Figure A1.
Modeling variables for future LULC simulation: (a) DEM; (b) distance to cropland; (c) distance to CBD; (d) distance to green; (e) distance to road; (f) distance to water; (g) slope; (h) protected area.
References
- Hou, H.; Wang, R.; Murayama, Y. Scenario-based modelling for urban sustainability focusing on changes in cropland under rapid urbanization: A case study of Hangzhou from 1990 to 2035. Sci. Total. Environ. 2019, 661, 422–431. [Google Scholar] [CrossRef] [PubMed]
- Zhang, R.; Matsushima, K.; Kobayashi, K. Can land use planning help mitigate transport-related carbon emissions? A case of Changzhou. Land Use Policy 2018, 74, 32–40. [Google Scholar] [CrossRef]
- Bokaie, M.; Zarkesh, M.K.; Arasteh, P.D.; Hosseini, A. Assessment of Urban Heat Island based on the relationship between land surface temperature and Land Use/Land Cover in Tehran. Sustain. Cities Soc. 2016, 23, 94–104. [Google Scholar] [CrossRef]
- Coffel, E.D.; De Sherbinin, A.; Horton, R.M.; Lane, K.; Kienberger, S.; Wilhelmi, O. The Science of Adaptation to Extreme Heat. In Resilience; Elsevier BV: Amsterdam, The Netherlands, 2018; pp. 89–103. [Google Scholar]
- Zhao, L.; Lee, X.; Smith, R.B.; Oleson, K. Strong contributions of local background climate to urban heat islands. Nature 2014, 511, 216–219. [Google Scholar] [CrossRef]
- He, B.-J.; Ding, L.; Prasad, D. Enhancing urban ventilation performance through the development of precinct ventilation zones: A case study based on the Greater Sydney, Australia. Sustain. Cities Soc. 2019, 47, 101472. [Google Scholar] [CrossRef]
- Stewart, I.D.; Oke, T.R. Local Climate Zones for Urban Temperature Studies. Bull. Am. Meteorol. Soc. 2012, 93, 1879–1900. [Google Scholar] [CrossRef]
- Fitria, R.; Kim, D.; Baik, J.; Choi, M. Impact of Biophysical Mechanisms on Urban Heat Island Associated with Climate Variation and Urban Morphology. Sci. Rep. 2019, 9, 1–13. [Google Scholar] [CrossRef]
- Gwenzi, W.; Nyamadzawo, G. Hydrological Impacts of Urbanization and Urban Roof Water Harvesting in Water-limited Catchments: A Review. Environ. Process. 2014, 1, 573–593. [Google Scholar] [CrossRef]
- Feng, J.-M.; Wang, Y.-L.; Ma, Z.-G.; Liu, Y.-H. Simulating the Regional Impacts of Urbanization and Anthropogenic Heat Release on Climate across China. J. Clim. 2012, 25, 7187–7203. [Google Scholar] [CrossRef]
- Miao, S.; Chen, F.; LeMone, M.A.; Tewari, M.; Li, Q.; Wang, Y. An Observational and Modeling Study of Characteristics of Urban Heat Island and Boundary Layer Structures in Beijing. J. Appl. Meteorol. Clim. 2009, 48, 484–501. [Google Scholar] [CrossRef]
- Oke, T.R. City size and the urban heat island. Atmos. Environ. (1967) 1973, 7, 769–779. [Google Scholar] [CrossRef]
- Li, W.; Cao, Q.; Lang, K.; Wu, J. Linking potential heat source and sink to urban heat island: Heterogeneous effects of landscape pattern on land surface temperature. Sci. Total. Environ. 2017, 586, 457–465. [Google Scholar] [CrossRef] [PubMed]
- Fatemi, M.; Narangifard, M. Monitoring LULC changes and its impact on the LST and NDVI in District 1 of Shiraz City. Arab. J. Geosci. 2019, 12, 127. [Google Scholar] [CrossRef]
- Sun, D.; Kafatos, M. Note on the NDVI-LST relationship and the use of temperature-related drought indices over North America. Geophys. Res. Lett. 2007, 34, 34. [Google Scholar] [CrossRef]
- Tomlinson, C.J.; Chapman, L.; Thornes, J.E.; Baker, C. Remote sensing land surface temperature for meteorology and climatology: A review. Meteorol. Appl. 2011, 18, 296–306. [Google Scholar] [CrossRef]
- Deng, Y.; Wang, S.; Bai, X.; Tian, Y.; Wu, L.; Xiao, J.; Chen, F.; Qian, Q. Relationship among land surface temperature and LUCC, NDVI in typical karst area. Sci. Rep. 2018, 8, 641. [Google Scholar] [CrossRef]
- Wang, R.; Derdouri, A.; Murayama, Y. Spatiotemporal Simulation of Future Land Use/Cover Change Scenarios in the Tokyo Metropolitan Area. Sustainability 2018, 10, 2056. [Google Scholar] [CrossRef]
- Bendor, T.; Westervelt, J.; Song, Y.; Sexton, J.O. Modeling park development through regional land use change simulation. Land Use Policy 2013, 30, 1–12. [Google Scholar] [CrossRef]
- Nanjing Bureau of Planning and Natural Resources. Available online: http://ghj.nanjing.gov.cn/ (accessed on 3 July 2019).
- National Bureau of Statistics of the People’s Republic of China. Available online: http://www.stats.gov.cn (accessed on 30 April 2019).
- China Meteorological Administration. Available online: http://www.cma.gov.cn/ (accessed on 20 March 2019).
- Erbek, F.S.; Ozkan, C.; Taberner, M. Comparison of maximum likelihood classification method with supervised artificial neural network algorithms for land use activities. Int. J. Remote. Sens. 2004, 25, 1733–1748. [Google Scholar] [CrossRef]
- Perlovsky, L.I.; McManus, M.M. Maximum likelihood neural networks for sensor fusion and adaptive classification. Neural Networks 1991, 4, 89–102. [Google Scholar] [CrossRef]
- Guan, D.; Li, H.; Inohae, T.; Su, W.; Nagaie, T.; Hokao, K. Modeling urban land use change by the integration of cellular automaton and Markov model. Ecol. Model. 2011, 222, 3761–3772. [Google Scholar] [CrossRef]
- Aaviksoo, K. Simulating vegetation dynamics and land use in a mire landscape using a Markov model. Landsc. Urban Plan. 1995, 31, 129–142. [Google Scholar] [CrossRef]
- United States Geological Survey (USGS) Earth Explorer. Available online: http://earthexplorer.usgs.gov/ (accessed on 12 April 2019).
- Haashemi, S.; Weng, Q.; Darvishi, A.; Alavipanah, S.K. Seasonal Variations of the Surface Urban Heat Island in a Semi-Arid City. Remote. Sens. 2016, 8, 352. [Google Scholar] [CrossRef]
- Estoque, R.C.; Murayama, Y. Monitoring surface urban heat island formation in a tropical mountain city using Landsat data (1987–2015). ISPRS J. Photogramm. Remote. Sens. 2017, 133, 18–29. [Google Scholar] [CrossRef]
- Chander, G.; Markham, B.L.; Helder, D.L. Summary of current radiometric calibration coefficients for Landsat MSS, TM, ETM+, and EO-1 ALI sensors. Remote Sens. Environ. 2009, 113, 893–903. [Google Scholar] [CrossRef]
- Zhang, X.; Estoque, R.C.; Murayama, Y. An urban heat island study in Nanchang City, China based on land surface temperature and social-ecological variables. Sustain. Cities Soc. 2017, 32, 557–568. [Google Scholar] [CrossRef]
- Ahmed, B.; Kamruzzaman; Zhu, X.; Rahman, S.; Choi, K. Simulating Land Cover Changes and Their Impacts on Land Surface Temperature in Dhaka, Bangladesh. Remote. Sens. 2013, 5, 5969–5998. [Google Scholar] [CrossRef]
- Sobrino, J.A.; Jiménez-Muñoz, J.C.; Paolini, L. Land surface temperature retrieval from LANDSAT TM 5. Remote. Sens. Environ. 2004, 90, 434–440. [Google Scholar] [CrossRef]
- Weng, Q.; Lu, D.; Schubring, J. Estimation of land surface temperature–vegetation abundance relationship for urban heat island studies. Remote. Sens. Environ. 2004, 89, 467–483. [Google Scholar] [CrossRef]
- Artis, D.A.; Carnahan, W.H. Survey of emissivity variability in thermography of urban areas. Remote. Sens. Environ. 1982, 12, 313–329. [Google Scholar] [CrossRef]
- Markham, B.L.; Barker, J.L. Spectral characterization of the LANDSAT Thematic Mapper sensors. Int. J. Remote. Sens. 1985, 6, 697–716. [Google Scholar] [CrossRef]
- Simwanda, M.; Murayama, Y. Integrating Geospatial Techniques for Urban Land Use Classification in the Developing Sub-Saharan African City of Lusaka, Zambia. ISPRS Int. J. Geo-Information 2017, 6, 102. [Google Scholar] [CrossRef]
- Ranagalage, M.; Wang, R.; Gunarathna, M.H.J.P.; Dissanayake, D.; Murayama, Y.; Simwanda, M. Spatial forecasting of the landscape in rapidly urbanizing hill stations of south Asia: A case study of Nuwara Eliya, Sri Lanka (1996–2037). Remote Sens. 2019, 11, 1743. [Google Scholar] [CrossRef]
- Yu, L.; Su, J.; Li, C.; Wang, L.; Luo, Z.; Yan, B. Improvement of Moderate Resolution Land Use and Land Cover Classification by Introducing Adjacent Region Features. Remote. Sens. 2018, 10, 414. [Google Scholar] [CrossRef]
- AlQurashi, A.F.; Kumar, L.; Sinha, P. Urban Land Cover Change Modelling Using Time-Series Satellite Images: A Case Study of Urban Growth in Five Cities of Saudi Arabia. Remote. Sens. 2016, 8, 838. [Google Scholar] [CrossRef]
- Hathout, S. The use of GIS for monitoring and predicting urban growth in East and West St Paul, Winnipeg, Manitoba, Canada. J. Environ. Manag. 2002, 66, 229–238. [Google Scholar] [CrossRef]
- Arsanjani, J.J.; Helbich, M.; Kainz, W.; Boloorani, A.D. Integration of logistic regression, Markov chain and cellular automata models to simulate urban expansion. Int. J. Appl. Earth Obs. Geoinformation 2013, 21, 265–275. [Google Scholar] [CrossRef]
- Howard, D.; Howard, P.; Howard, D. A Markov Model Projection of Soil Organic Carbon Stores Following Land Use Changes. J. Environ. Manag. 1995, 45, 287–302. [Google Scholar] [CrossRef]
- Wang, R.; Hou, H.; Murayama, Y. Scenario-Based Simulation of Tianjin City Using a Cellular Automata–Markov Model. Sustainability 2018, 10, 2633. [Google Scholar] [CrossRef]
- Haah, J.; Fidkowski, L.; Hastings, M.B. Nontrivial Quantum Cellular Automata in Higher Dimensions. arXiv 2018, arXiv:1812.01625. [Google Scholar]
- Zinoviev, A.; Zinovieva, O.; Ploshikhin, V.; Romanova, V.; Balokhonov, R. Evolution of grain structure during laser additive manufacturing. Simulation by a cellular automata method. Mater. Des. 2016, 106, 321–329. [Google Scholar] [CrossRef]
- Mitsova, D.; Shuster, W.; Wang, X. A cellular automata model of land cover change to integrate urban growth with open space conservation. Landsc. Urban Plan. 2011, 99, 141–153. [Google Scholar] [CrossRef]
- Santé, I.; García, A.M.; Miranda, D.; Crecente, R. Cellular automata models for the simulation of real-world urban processes: A review and analysis. Landsc. Urban Plan. 2010, 96, 108–122. [Google Scholar] [CrossRef]
- Samat, N.; Hasni, R.; Elhadary, Y.A.E. Modelling Land Use Changes at the Peri-Urban Areas using Geographic Information Systems and Cellular Automata Model. J. Sustain. Dev. 2011, 4, 72. [Google Scholar] [CrossRef]
- Hua, A.K.; Ping, O.W. The influence of land-use/land-cover changes on land surface temperature: A case study of Kuala Lumpur metropolitan city. Eur. J. Remote. Sens. 2018, 51, 1049–1069. [Google Scholar] [CrossRef]
- Weng, Q.; Lu, D. A sub-pixel analysis of urbanization effect on land surface temperature and its interplay with impervious surface and vegetation coverage in Indianapolis, United States. Int. J. Appl. Earth Obs. Geoinformation 2008, 10, 68–83. [Google Scholar] [CrossRef]
- Weng, Q. Remote sensing of impervious surfaces in the urban areas: Requirements, methods, and trends. Remote. Sens. Environ. 2012, 117, 34–49. [Google Scholar] [CrossRef]
- Masoudi, M.; Tan, P.Y. Multi-year comparison of the effects of spatial pattern of urban green spaces on urban land surface temperature. Landsc. Urban Plan. 2019, 184, 44–58. [Google Scholar] [CrossRef]
- Martin, K.L.; Hwang, T.; Vose, J.M.; Coulston, J.W.; Wear, D.N.; Miles, B.; Band, L.E. Watershed impacts of climate and land use changes depend on magnitude and land use context. Ecohydrology 2017, 10, e1870. [Google Scholar] [CrossRef]
- Su, W.; Yang, G.; Chen, S.; Yang, Y. Measuring the Pattern of High Temperature Areas in Urban Greenery of Nanjing City, China. Int. J. Environ. Res. Public Heal. 2012, 9, 2922–2935. [Google Scholar] [CrossRef]
- Guo, Z.; Wang, S.; Cheng, M.; Shu, Y. Assess the effect of different degrees of urbanization on land surface temperature using remote sensing images. Procedia Environ. Sci. 2012, 13, 935–942. [Google Scholar] [CrossRef]
- Li, Z.-L.; Tang, B.-H.; Wu, H.; Ren, H.; Yan, G.; Wan, Z.; Trigo, I.F.; Sobrino, J.A. Satellite-derived land surface temperature: Current status and perspectives. Remote. Sens. Environ. 2013, 131, 14–37. [Google Scholar] [CrossRef]
- He, B.-J.; Zhu, J.; Zhao, D.-X.; Gou, Z.-H.; Qi, J.-D.; Wang, J. Co-benefits approach: Opportunities for implementing sponge city and urban heat island mitigation. Land Use Policy 2019, 86, 147–157. [Google Scholar] [CrossRef]
- Ng, E.; Ren, C. China’s adaptation to climate & urban climatic changes: A critical review. Urban Clim. 2018, 23, 352–372. [Google Scholar]
- Cai, M.; Ren, C.; Xu, Y.; Dai, W.; Wang, X.M. Local Climate Zone Study for Sustainable Megacities Development by Using Improved WUDAPT Methodology—A Case Study in Guangzhou. Procedia Environ. Sci. 2016, 36, 82–89. [Google Scholar] [CrossRef]
- Simwanda, M.; Murayama, Y. Spatiotemporal patterns of urban land use change in the rapidly growing city of Lusaka, Zambia: Implications for sustainable urban development. Sustain. Cities Soc. 2018, 39, 262–274. [Google Scholar] [CrossRef]
- Id, M.; Z, Y.; B, P. Simulation and Prediction of Land Surface Temperature (LST) Dynamics within Ikom City in Nigeria Using Artificial Neural Network (ANN). J. Remote. Sens. GIS 2015, 5, 1–7. [Google Scholar] [CrossRef]
© 2020 by the authors. Licensee MDPI, Basel, Switzerland. This article is an open access article distributed under the terms and conditions of the Creative Commons Attribution (CC BY) license (http://creativecommons.org/licenses/by/4.0/).