The authors wish to make the following correction to this paper [
1].
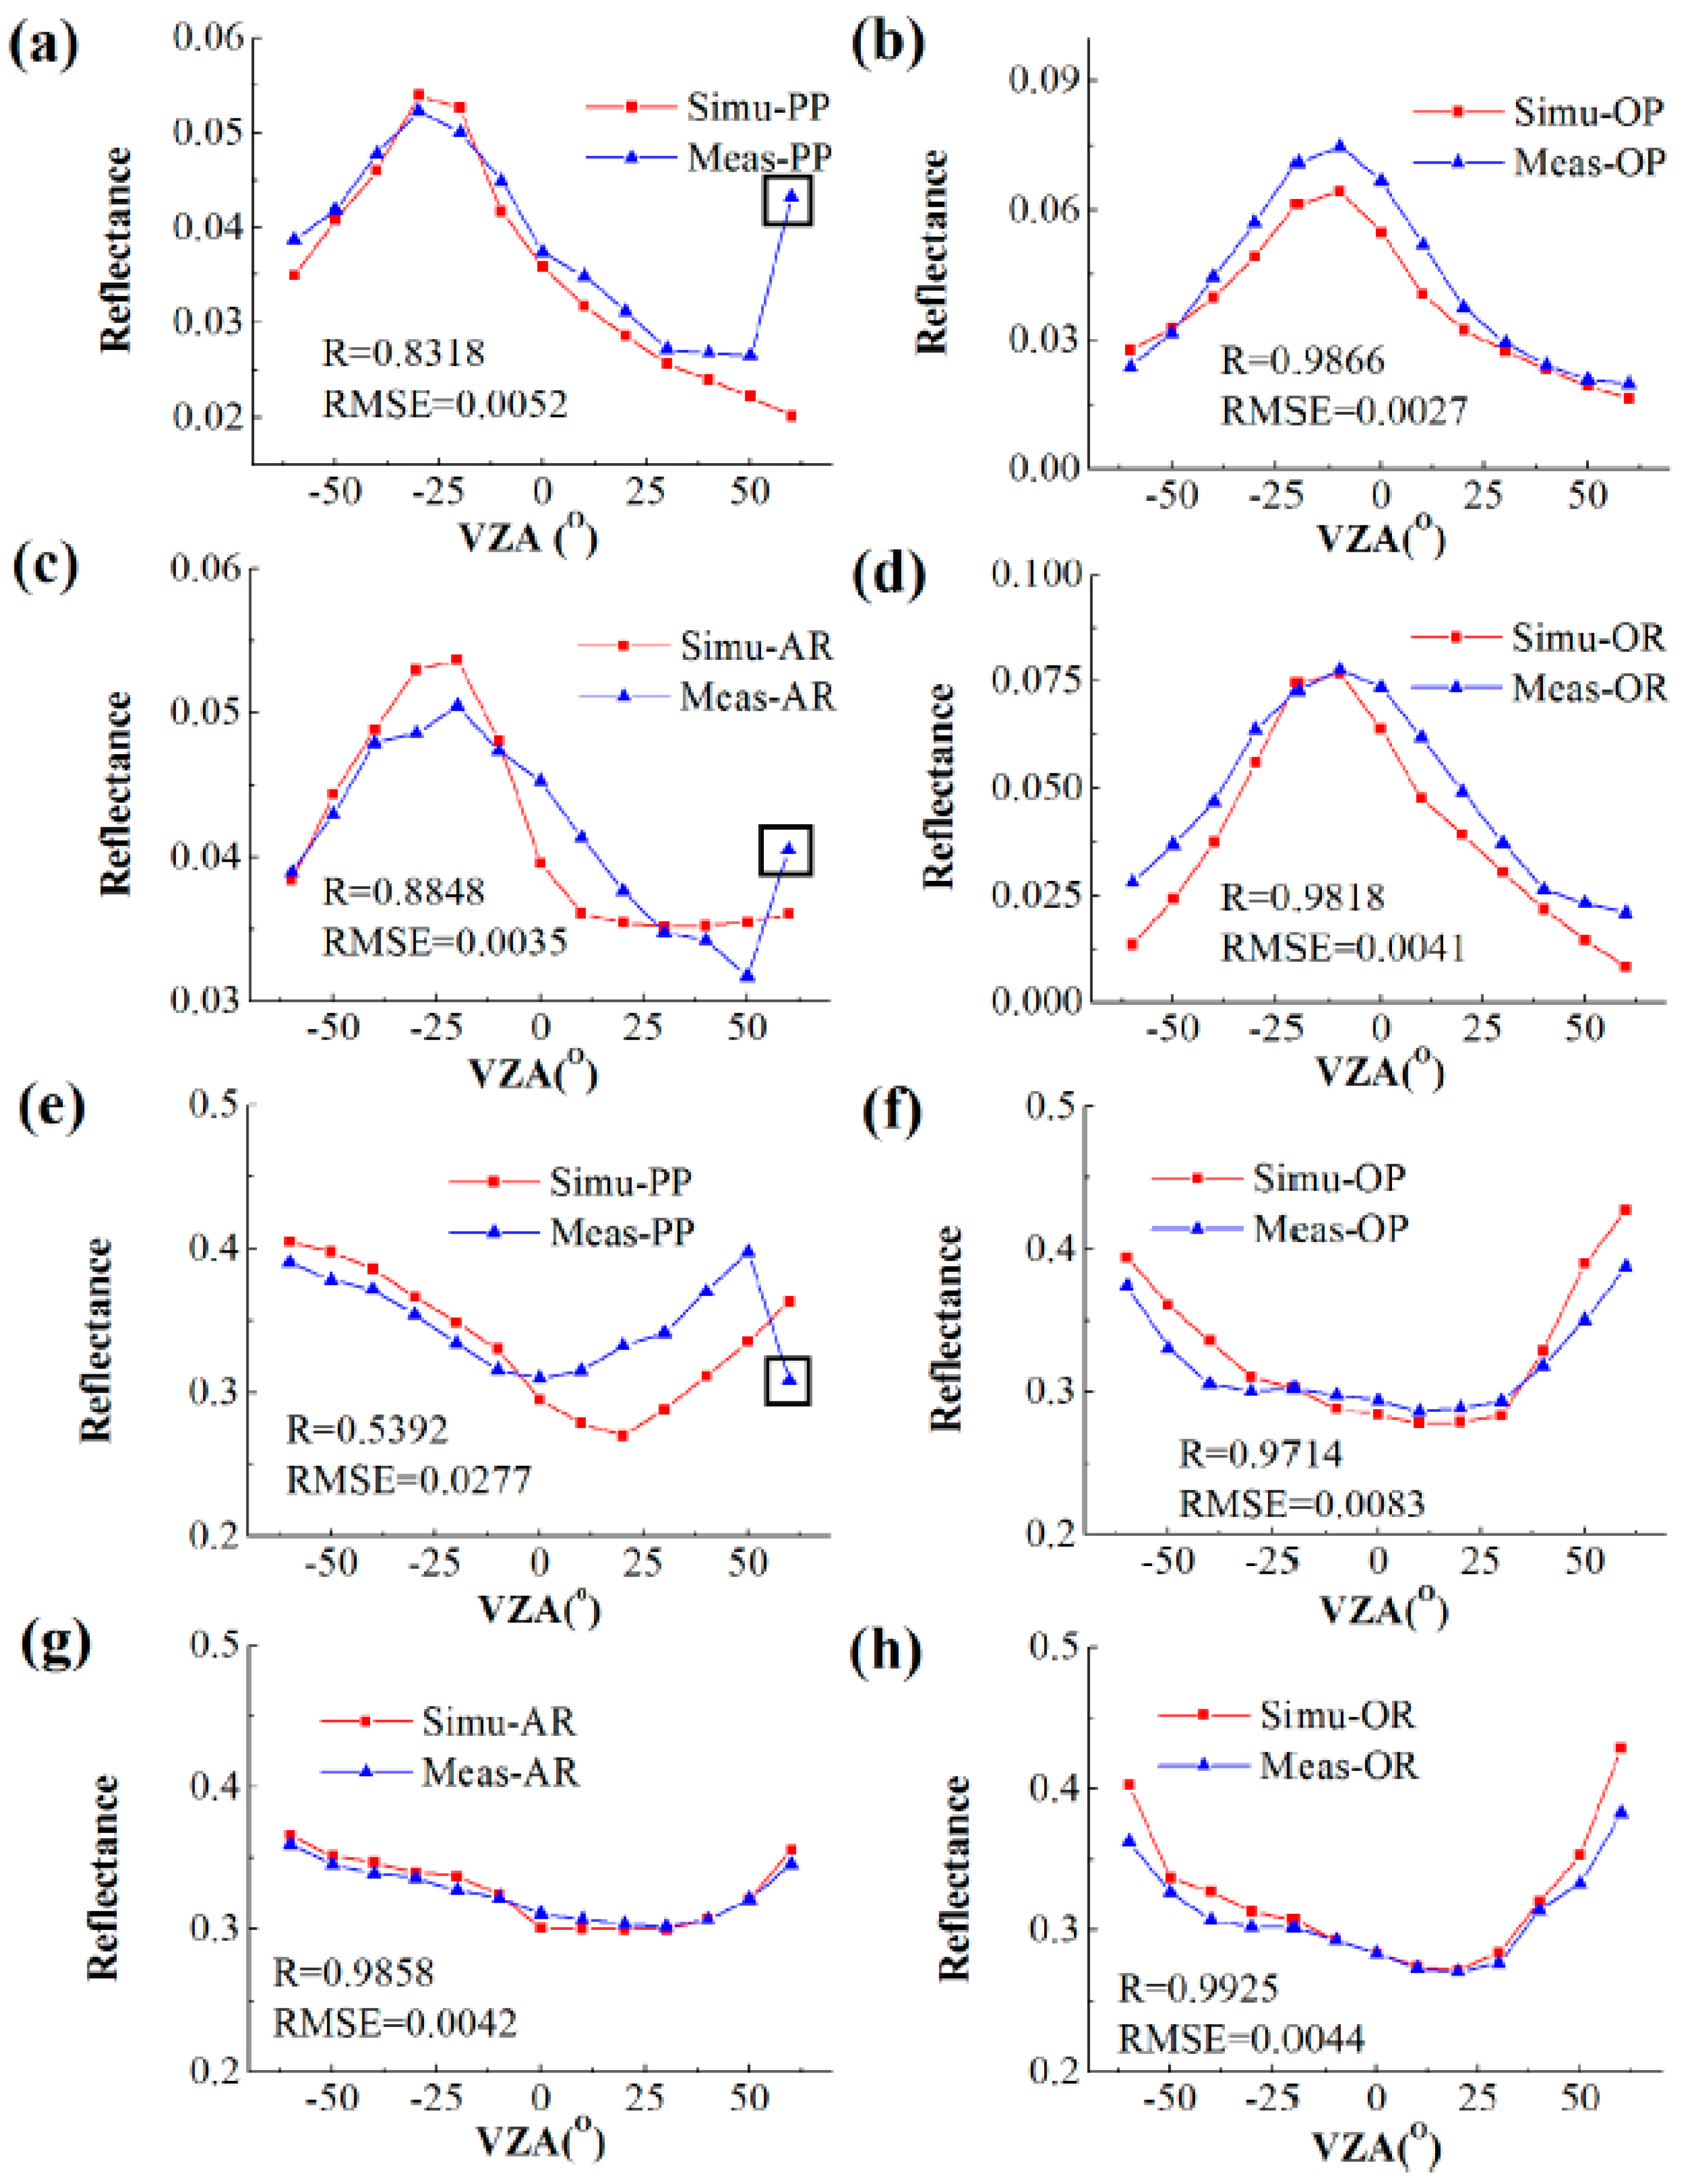
In the original paper, there was a mistake in
Figure 11 as published. During the review process, the reviewer found that correlation coefficient (R) and Root mean square error (RMSE) is confusing in statistics, i.e., regarding the simulation and the measurement, which one is the independent variable on the X-axis and which one is the dependent variable on the Y-axis. Previously, the selection of variables was chaotic, which resulted in inconsistent RMSEs statistical results. Therefore, in the previous revision process, the reviewer recommends using the measurement as values in the X-axis (independent variable) and the simulation as values in the Y-axis (dependent variable) to calculate R and RMSE between reflectance simulated by the row model and field data. Therefore, we recalculated the R and RMSE between reflectance simulated by the row model and field data based on the reviewers’ suggestion and then modified the previous confusing statistical results. Finally, to clearly show the statistical results of
Figure 11, we added a scatter plot between the sum of the reflectance simulated by the row model and field data in Figure 12 during the modification process. However, confusing statistical results (R and RMSE) in
Figure 11 were not deleted in the online version (PDF file). Therefore, these confusing statistical results remain in the published paper, which leads to the difference between the RMSE in
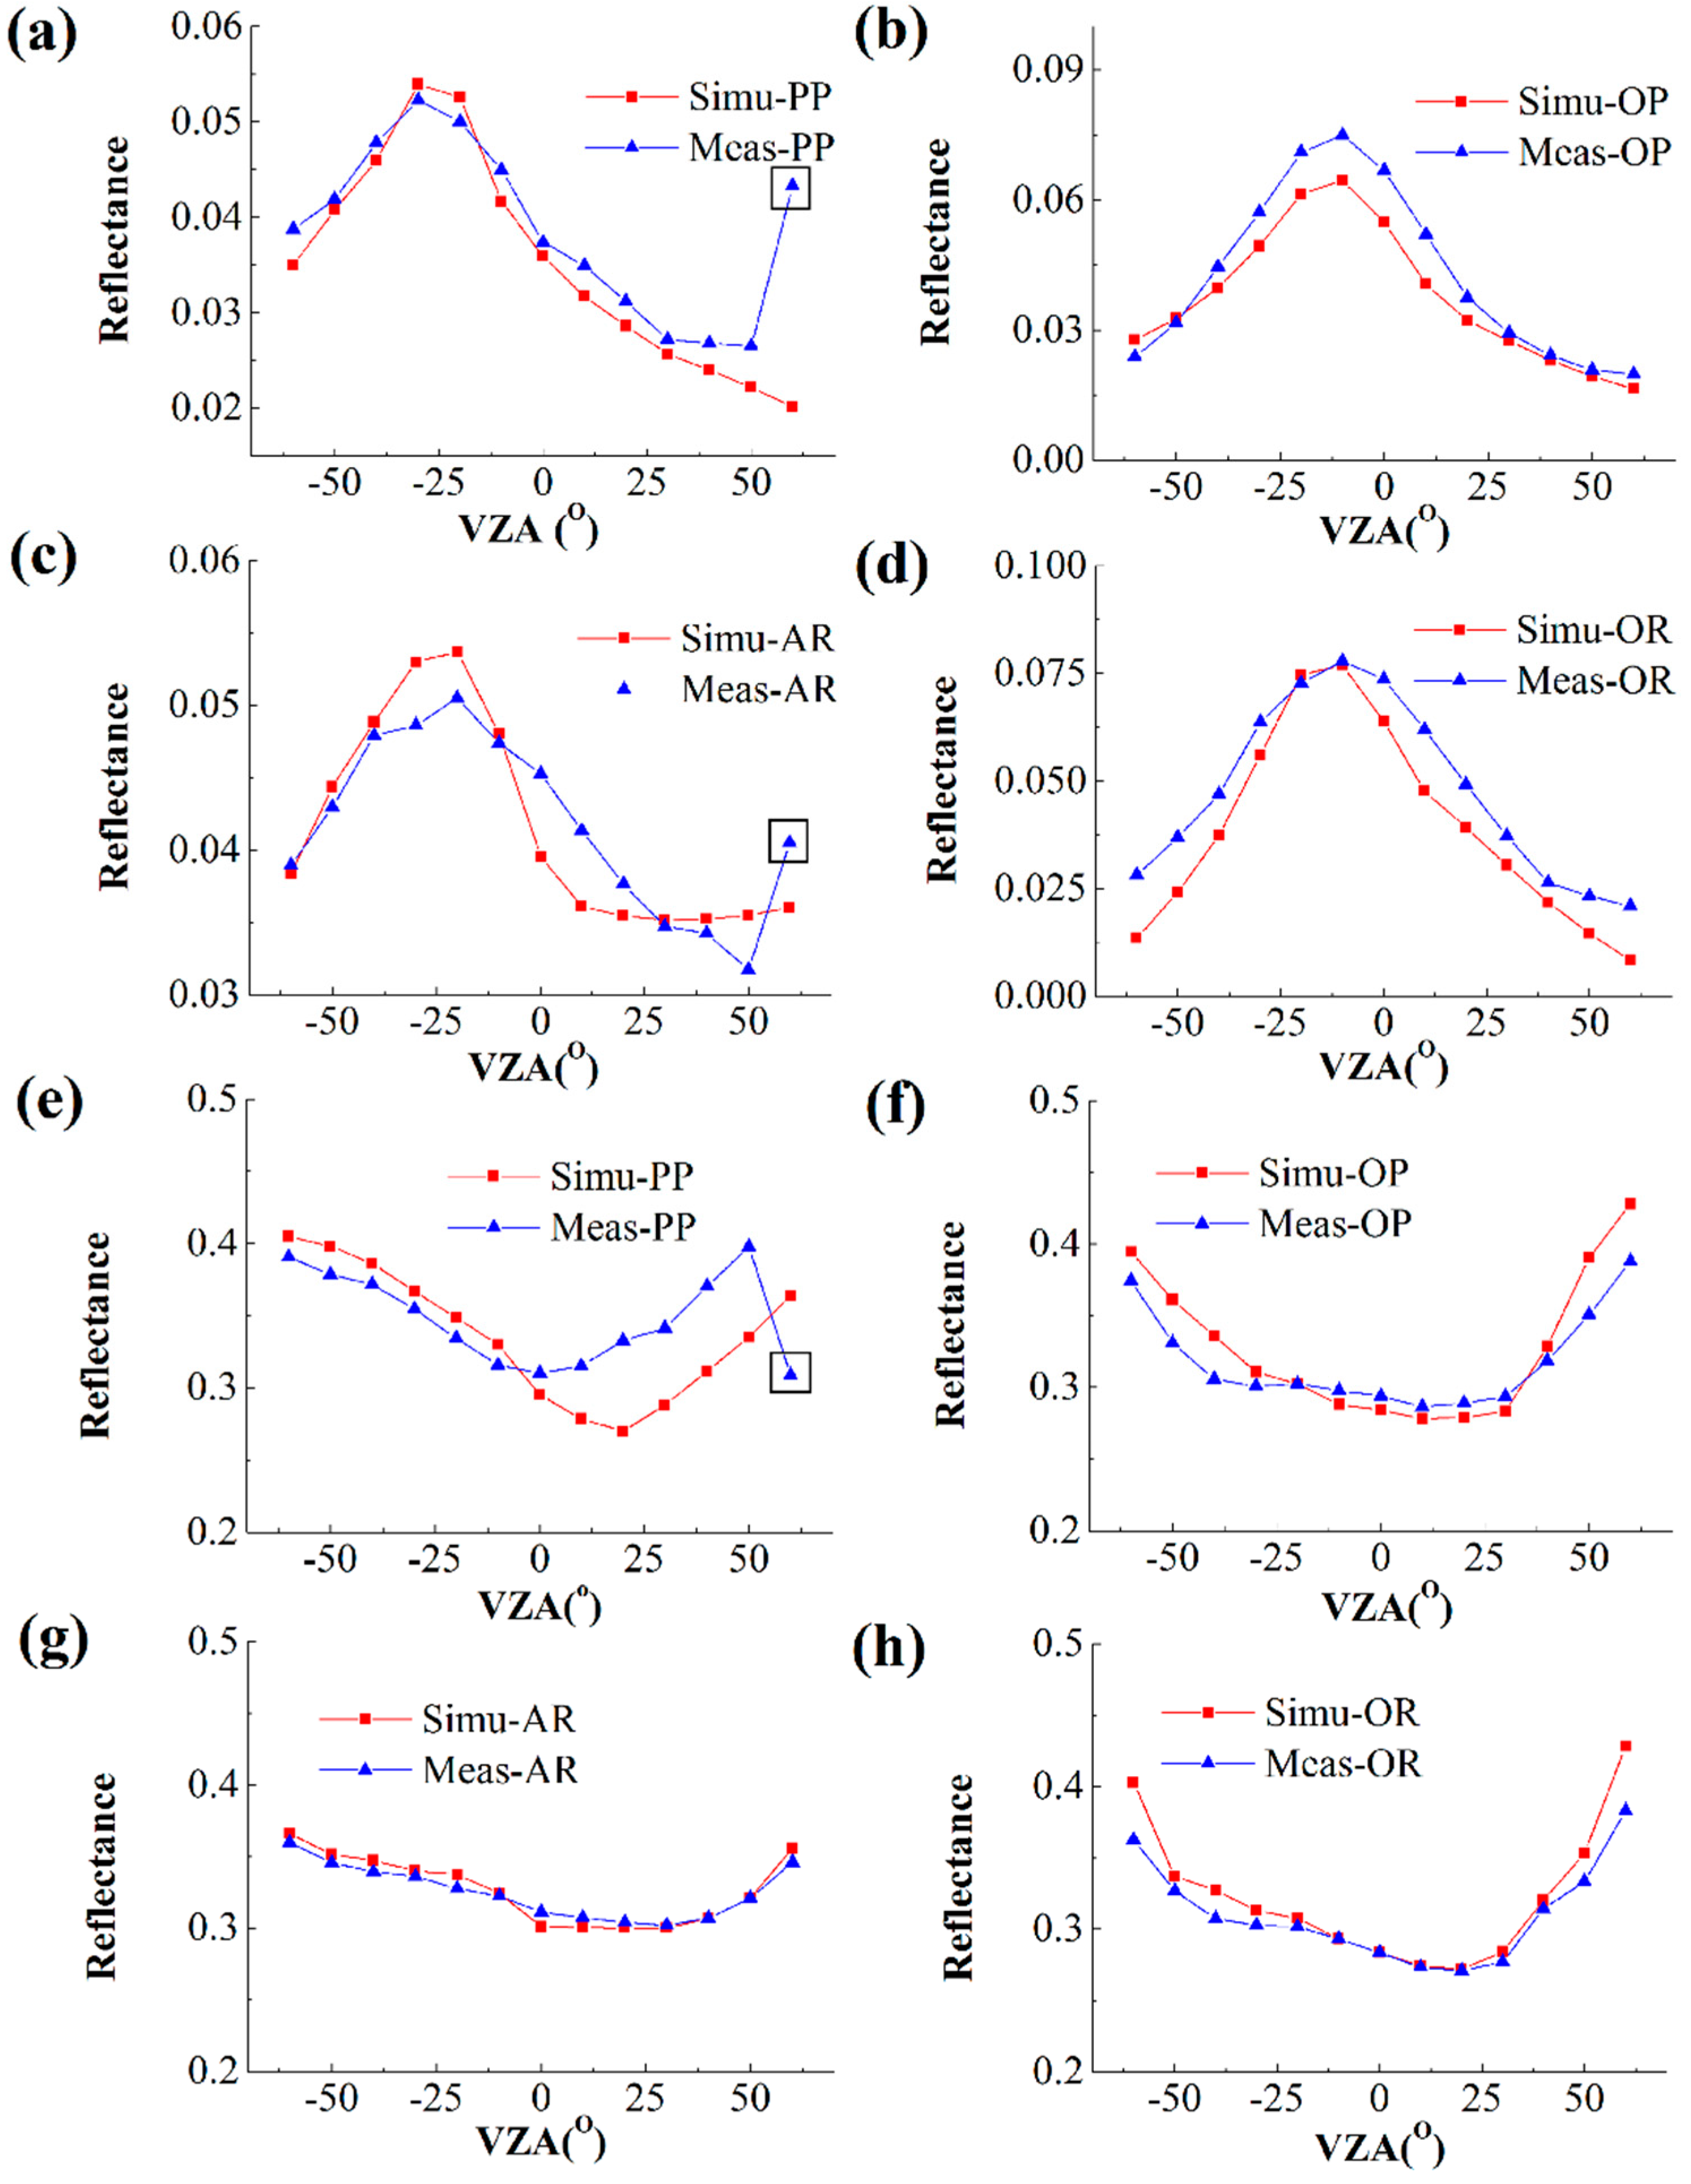
Figure 11 and the RMSE in Figure 12. We once again affirm that the statistical indicators (R and RMSE) in Figure 12 in this paper are correct. To avoid ambiguity, we intend to revise
Figure 11 (remove R and RMSE in
Figure 11). Finally, our paper has no problem with the description of the statistical indicators here, and the authors apologize for any inconvenience caused and state that the scientific conclusions are unaffected.
Replace
Figure 11.
Comparison of the distribution of the sum of the reflectance simulated by the row model and field data in the multiangle observation for the principal plane (PP) mode (a,e), orthogonal plane (OP) mode (b,f), along-row plane (AR) mode (c,g), and orthogonal row plane (OR) mode (d,h). (a–d) Red band (670 nm); (e–h) NIR band (860 nm). VZA is the viewing zenith angle. The black box is the abnormal point in the measurement.


