Article

Thermophysical Features of the Rümker Region in Northern Oceanus Procellarum: Insights from CE-2 CELMS Data

1
College of Geoexploration Science and Technology, Jilin University, Changchun 130026, China
2
State Key Laboratory of Resources and Environmental Information System, Institute of Geographic Sciences and Natural Resources Research, Chinese Academy of Sciences, Beijing 100101, China
3
Institute of National Development and Security Studies, Jilin University, Changchun 130026, China
4
School of Earth Sciences, China University of Geosciences, Wuhan 430074, China
5
Departmental of Earth, Environmental, and Planetary Sciences, Brown University, Providence, RI 02912, USA
6
National Space Science Center, Chinese Academy of Sciences, Beijing 100012, China
7
Key Laboratory of Lunar and Deep Space Exploration, National Astronomical Observatory, Chinese Academy of Sciences, Beijing 100012, China
8
School of Land Science and Technology, China University of Geosciences, Beijing 100083, China
9
Subcenter of International Cooperation and Research on Lunar and Planetary Exploration, Center of Space Exploration, Ministry of Education of the People’s Republic of China, Beijing 100083, China
*
Author to whom correspondence should be addressed.
Remote Sens. 2020, 12(19), 3272; https://doi.org/10.3390/rs12193272
Submission received: 5 September 2020 / Revised: 4 October 2020 / Accepted: 6 October 2020 / Published: 8 October 2020
(This article belongs to the Special Issue Lunar Remote Sensing and Applications)

Abstract

:
The Rümker region is located in the northern Oceanus Procellarum, which has been selected as the landing and sampling region for China’s Chang’e-5 (CE-5) mission. The thermophysical features of the mare units are studied in detail using the brightness temperature (TB) maps (TB, normalized TB, TB difference) derived from the CE-2 microwave radiometer data. The previously interpreted geological boundaries of the Rümker region are revisited in this study according to their TB behaviors: IR1, IR2, and IR3 Rümker plateau units are combined into one single unit (IR); and a hidden unit is found on the Mons Rümker; Mare basaltic units Im1 and Em1 are combined into Em1; and Em2 is more likely the extending of Im2. Each of the previous proposed landing sites and their scientific value are summarized and reevaluated. Based on this, four landing sites are recommended in order to maximize the scientific outcome of the CE-5 mission. We suggest that the Eratosthenian-aged Em4 and Em1 units as the top priority landing site for the CE-5 mission; the age-dating results will provide important clues concerning the thermal evolution of the Moon.

Graphical Abstract

1. Introduction

The Chang’e-5 (CE-5) mission, scheduled to launch at the end of 2020, is China’s first lunar sample return mission [1,2,3]. The Rümker region (41–45°N, 49–69°W; Figure 1a) in northern Oceanus Procellarum has been selected as the landing region [4].
The CE-5 landing region is located in the northwest part of the Procellarum KREEP Terrane (PKT), far from the previous Apollo and Luna landing sites. PKT is one of the three most prominent geochemical anomalies on the Moon (i.e., Procellarum KREEP Terrane, Feldspathic Highlands Terrane, and South Pole-Aitken Terrane; Jolliff et al. [5]). It underwent a complex geological history, including multiple volcanic episodes with different element composition and mineral assemblages, and is described as the most interesting place for recent and future missions to understand some of the most fundamental scientific questions of selenology, such as the properties of late stage lunar volcanism and the deep mantle materials [6,7]. The elevated levels of heat-producing elements [8] and thin crust (usually <30 km, Wieczorek et al. [9]), may serve to enhance the generation, ascent, and eruptions of lunar basaltic magma [10,11], which could be the factor leading to an extended period of volcanism in the region [12,13], producing the most recent mare basalts (about 1.21 Ga) on the Moon [14,15,16]. Within the PKT, the Rümker region displays a spectrum of lunar volcanism and related products [2], from basaltic mare eruptions to silica-rich dome eruptions [17], from Imbrian-aged mare flows to Eratosthenian-aged mare flows, from long-term construction of a huge volcanic complex (i.e., Mons Rümker; Zhao et al. [1]) to short-term eruption [18] of the longest sinuous rille on the Moon (i.e., Rima Sharp), etc. On the basis of the distribution of different kinds of volcanic products, especially some of the youngest mare basalts on the Moon [2], the Rümker region has been chosen as the candidate sampling region for the Chang’e-5 mission [4]. Samples from the region could profoundly improve our understandings of lunar impact and thermal history [2].
The geological history of the Rümker region and northern Oceanus Procellarum has been fully studied with spectral data. Based on mineralogical and geochemical characteristics and impact populations, Zhao et al. [1] and Qian et al. [2] mapped three Rümker plateau units (i.e., IR1, IR2, and IR3; basaltic in composition) and seven mare basaltic units (Figure 1b). The mare basalts are subdivided into three Imbrian-aged units (Im1, Im2, and Im3), characterized by low-Ti, low-Fe contents, and a high crater density [2]; and four Eratosthenian-aged units (Em1, Em2, Em3, and Em4), characterized by high-Ti, high-Fe, and high-Th contents, richer in olivine than the old Imbrian-aged mare basalts on the eastern nearside, and a lower crater density [2]. Although the crater size-frequency distribution (CSFD) absolute model ages of each geological unit may be more complicated [19,20,21,22], the subdivisions of geological units are diagnostic in terms of surface reflectance data and derived compositional data (e.g., Clementine UVVIS data and Kaguya MI data) and correspond well with Hiesinger et al. [14,16] and Boroughs and Spudis [23], etc.; therefore, we mainly assess and address their results in this study.
CE-5 plans to collect ~2 kg (~2 m in core length) of lunar regolith from the surface utilizing a robotic arm and subsurface drilling [24], to study the subsurface structures, especially regolith properties. However, until now, the geological study of the Rümker region is mainly based on spectral and topographic data [2,20,22], and details of the regolith properties of the CE-5 landing region are not well constrained. Campbell et al. [25] analyzed the surface properties of Mons Rümker with Earth-based radar data and found it likely to be covered with rock-poor, fine-grained pyroclastic materials. Xie et al. [26] quantitatively estimated the abundance variations of distantly sourced particles with depth using an updated ballistic sedimentation model, concluding that most of the extraneous materials are derived from Pythagoras (~5%) and Aristarchus craters (~7%). Qian et al. [27] and Yue et al. [28] studied the regolith thickness of the region, and found that the Imbrian-aged mare basalts have thicker regolith than the Eratosthenian-aged and that over 99% of the Rümker region has a regolith thickness larger than 2 m (the length of the core drill). Chisenga et al. [29] applied a 3D density inversion to resolve both the shallow and deep density structures using Gravity Recovery and Interior Laboratory (GRAIL) data; they proposed that Mons Rümker is fed by a shallow magma chamber and a quasi-circular gravity anomaly may be the source region of the Eratosthenain-aged mare basalts in the Rümker region. All in all, an improved understanding of the regolith, its subsurface properties, and thermophysical features are of great interest due to the importance for mission operations and drilling, and the great scientific value of the mission.
The global brightness temperature (TB) of the Moon was first measured by a microwave radiometer (CELMS) onboard China’s Chang’e-1 (CE-1) and Chang’e-2 (CE-2) spacecraft, operating at 3.0 GHz, 7.8 GHz, 19.35 GHz, and 37.0 GHz channels. The penetration depth of CELMS is about 1 m at 3.0 GHz, 38.5 cm at 7.8 GHz, 15.5 cm at 19.35 GHz, and 8.1 cm at 37 GHz [25,30,31], owing to the high iron and titanium abundances of the Rümker region [2]. The CELMS data is sensitive to the chemical components and temperature of the substrate regolith [30,32,33,34,35], providing an opportunity to unravel its structures. In this case, the CE-2 CELMS data are employed to evaluate the thermophysical features of the basaltic units in the Rümker region, in order to better understand the basaltic volcanism of the region and provide additional supports for the CE-5 mission.

2. Brightness Temperature

The Brightness Temperature (TB) of the lunar regolith at different microwave frequencies and its characteristics have been well investigated theoretically by a number of authors [36,37] and are widely used to obtain global lunar heat flow and average regolith thickness [38]. The thermophysical features of TB could provide a more reliable estimation of the substrate structures that are less influenced by lateral mixing of materials that may contaminate optical measurements [39,40,41].
To better understand the findings in this study, the radiative transfer theory is used to model the TB from the regolith. The mare deposit is thought as two layers, including a regolith layer and a rock layer [30,38,41]. Then, TB is modeled by the radiation from the regolith layer and the rock layer. Considering a 0° observation angle of CELMS instrument, the radiative transfer simulation is expressed as follows:
T B = 0 d 1 r 1 1 L k a 1 ( z ) T ( z ) 1 e 0 z k a 1 ( z ) d z d z + 0 d ( 1 r 1 ) r 2 1 L k a 1 ( z ) T ( z ) e ( z d k a 1 ( z ) d z + 0 d k a 1 ( z ) d z ) d z + d ( 1 r 1 ) ( 1 r 2 ) 1 L k a 2 ( z ) T ( z ) e d z k a 2 ( z ) d z d z e 0 d k a 1 ( z ) d z
where the first and second parts represent the upwelling and downwelling radiations of the regolith layer, and the third parts is the radiation from the rock layer. d is the regolith layer thickness; ka1 and ka2 are the absorption coefficients in the lunar regolith and rock layers, respectively; T(z) is the temperature profile, which is obtained with a thermal conduction model [34]; r1 and r2 represent the effective reflectivity values of the free space-regolith and regolith-rock interfaces, respectively; and 1/(1 − L) is the multi-reflection coefficient.
The dielectric constant is a decisive factor for the parameters including r1, r2, ka1, and ka2 [39,40,42]. Based on experiments on the lunar regolith samples, Heiken et al. [43] assessed the relationship between the real part of the relative dielectric constant ε’, the loss tangent tanδ, and the (FeO + TiO2) abundance (FTA) value S (wt%), which is expressed as follows:
{ ε = 1.919 ρ , tan δ = 10 0.038 S + 0.312 ρ 3.260 ,
where ρ is the density of the lunar regolith.
The relationship between TB and the thermophysical parameters of the lunar regolith can, then, be constructed by integrating Equation (1) over the total thickness d. Meng et al. [30,44] proposed that the regolith thickness d plays a weak role on the TB. Thus, the regolith is assumed to be a 6-m-thick layer with a smooth surface. T(z) is calculated with the thermal conductivity model and the innermost depth temperature is assumed to be 252 K [37] as a constraint to solve the model. The hyperbolic model is used to obtain the density parameter ρ. The dielectric constant of the rock layer is assumed to be 6.15 + i0.155 (the dielectric constant of sample No.1555 from the Apollo 15 mission, Heiken et al. [43]). Assuming a surface temperatures of 390 K (noon) and 100 K (night), the relationship between TB and FTA at noon and night can be simulated with Equations (1) and (2), as shown in Figure 2 for the 3.0 and 37 GHz channels.
In this study, the difference between the noon TB and night TB of the same frequency is defined as dTB. Here, two observations should be noticed: (1) As the FTA increase from 1 wt.% to 41 wt.%, the TB will monotonously increase at noon but decrease at night. This relationship will be used to re-evaluate the thermophysical features of the geological units of Qian et al. [2] (Section 4). (2) The mare deposits with higher FTA should have a higher TB at noon but a lower TB at night. The TB performances in the Imbrian-aged and Eratosthenian-aged units all agree with this conclusion. However, the Rümker plateau unit and several other places do not follow this relationship (Section 4).

3. Data Processing

In this study, the TB maps are derived from data from the CELMS instrument onboard the CE-2 spacecraft; the surface temperature is derived from the LRO Diviner data [45] and the numerical simulation [46]; and the FeO and TiO2 abundances are derived from SELENE Multiband Imager (MI) data [47].

3.1. TB Maps Generation

The CELMS data used in this study were obtained from the CE-2 spacecraft, from October 2010 to June 2011, at an altitude of ~100 km [35,48], with an observation angle of 0°. CELMS instrument has four frequency channels (3.0, 7.8, 19.35, and 37.0 GHz), and each channel can reflect the thermophysical features of the lunar regolith at a specific penetration depth [30,31,32,33,49]. The used CELMS data is in 2C level, which is the raw data after geometric correction and radiometric calibration [33,35,48]. The radiometric accuracy of the CELMS data is better than 1.0 K [35]. The data is available from Data Release and Information Service System of China’s Lunar Exploration Program (http://moon.bao.ac.cn/).
The CELMS data processing has been described in detail by Chan et al. [50], Zheng et al. [35,49], and Meng et al. [30,33,51]. The same processing method is adopted in this study.
Firstly, 19,942 CELMS data points are selected according to the range of the Rümker region. Secondly, the time angle is introduced to ascribe the selected CELMS data points into 24 lunar hours, where the data points in one hour are approximated to experience similar illumination conditions. Thereafter, the scatter maps in the 24 h are plotted to choose the proper observation times, since the CELMS data points are not intensive enough to generate the TB maps at every hour. After comparison, the data points from 1 p.m. to 2 p.m. and 4 a.m. to 5 a.m. are chosen to generate the TB maps, representing the observations at noon and night, respectively. Finally, the linear interpolation method is used to generate the TB maps at 3.0, 7.8, 19.35, and 37.0 GHz with a spatial resolution of 0.25° × 0.25°. This data pre-processing algorithm has been tested and works well in previously published papers [30,32,33,44,51].
The original TB map of the mare basalts in the Rümker region at 37 GHz is shown in Figure 3. The Em4 unit in the southeastern part has high FTA values; correspondingly, the 37 GHz TB of Em4 is high at noon but low at night. The Im2 unit in the northwestern part has low FTA values; and the 37 GHz TB of Im2 is low at noon but high at night. Such TB behaviors agree with the simulation results by Meng et al. [30,42] and Hu et al. [52], indicating the reliability of the generated TB maps.

3.2. Proper TB Maps Generation

Though the TB maps produced agree well with the components of the lunar regolith (Figure 3), the correspondence between TB and the geological boundaries is unclear. Moreover, from 39°N to 46°N, the TB variations are about 20 K along the latitude, no matter whether at noon or at night. The latitude-dependent TB variations are much larger than regolith composition-dependent variations (~10 K at noon and ~5 K at night along the same latitude), which should be eliminated to reveal the true signal of regolith properties.
In this study, the normalized TB (nTB), TB difference (dTB), and emissivity maps are applied to solve latitude-dependent TB variation issues [30,32,33,44,51]. Moreover, to better understand the TB performances, the geological units identified by Qian et al. [2] are vectorized and overlain on the following generated maps.

3.2.1. nTB Maps

In order to obtain the nTB maps, the standard TB values of every latitude are calculated [32,33,51]. Firstly, one TB is selected for every latitude on the conditions that the FTA, surface slope, and rock abundance are similar in all selected positions (from the JMARS, https://jmars.asu.edu/). Then, a fitting curve is made according to the selected TB, and the fitted value is defined as the standard TB for the corresponding frequency and latitude. Finally, the nTB maps are generated using the TB divided by the standard TB of the latitude (Figure 4, noon; Figure 5, night) [33,51].
Compared to the primary TB values (Figure 3), the latitude artifacts are considerably reduced, where the higher TB in the lower latitudes is weakened and the lower TB in higher latitudes is enhanced. This makes the nTB values of the same mare unit more homogeneous. Particularly in the Im2 unit, the nTB values are similarly low at noon and similarly high at night. A similar phenomenon also occurs in Im1 and Em4 units, indicating that the latitude-dependent effect of the TB maps is well resolved.
Generally, the nTB performances can be categorized into four grades. At noon, Em4 has the highest nTB values, followed by Em3, and Im2 and Em2 have the lowest values. At night, Im2 has the highest in nTB values, followed by Im1, Im3, and Em1, and Em4 has the lowest value. In addition, some abnormally high and low regions occur in the nTB maps (Figure 4 and Figure 5), indicating the presence of inhomogeneous materials at depth, and will be discussed in detail later.

3.2.2. TB Difference (dTB) Maps

The dTB maps are generated in this study (Figure 6). dTB is the difference between the noon TB and the night TB at the same frequency. It is directly related to the regolith thermophysical parameters within the penetration depth, because the majority change of the regolith temperature only happens at the uppermost 15 cm layer [30,32,33,40,41,51,52]. The dTB performances can be classified into four grades (Figure 6). Em4 has the highest dTB values, followed by Em3, and Im2 and Em2 have the lowest values. Moreover, the four-channel dTB maps describe well the change of the thermophysical features with depth in the lunar regolith, which is discussed in Section 4.

3.2.3. Emissivity Maps

The emissivity is the ratio between the observed TB and the surface temperature at the same time, which is directly related to the dielectric constant or density of the lunar regolith [43]. The soil temperature (ST) product at night is used in this study to calculate the data for the emissivity maps [45], with a temperature resolution of 0.02 K and a spatial resolution of 128 pixels/degree. This dataset is available from PDS Geosciences Node (https://ode.rsl.wustl.edu/moon/index.aspx). The ST product is the average temperature in Kelvin, nighttime hourly and all hours averaged together. However, the raw data value is from −40 K to 40 K. This is the direct surface temperature parameter of the lunar regolith. The ST is added 273 K in this study to better describe the thermal emission features of the mare units in the Rümker region (Figure 7a). Then, the ratio between the 37 GHz nighttime TB and the ST product can be assigned as the nighttime emissivity of the mare deposits (Figure 7b).
Meng et al. [51,53] proposed that the generated TB divided by the simulated surface temperature can be used to represent the emissivity of the lunar regolith at the corresponding frequency, which is essential to evaluate the regolith thermophysical features of the related penetration depth. Here, the surface temperature is estimated with the method provided by Meng et al. [46], and the CE-1 (Laser Altimeter) LAM data is used as the surface elevation on the condition of 1:30 p.m., in the middle of the observation time for the CELMS used data at 1 a.m. to 2 a.m. Then, the ratio between the generated 37 GHz TB and the simulated surface temperature is assigned as the noon emissivity of the mare deposits (Figure 7c).
Compared to the primary TB values (Figure 3), the emissivity maps provide new views of the Rümker region. The clear geologic boundaries between Im2, Im3, and Em3 indicate that the generated emissivity maps are realistic. However, it should be noted that:
(1)
The Diviner surface temperature is the original data plus 273 K (not the real night emissivity), but it is valuable to study the relative distribution of the regolith thermophysical features comparatively.
(2)
There are abundant crater-related spots with abnormally high emissivity at night, but the study of their abnormal emissivity is not feasible, because of the rather low resolution of CELMS (1 degree/pixel) compared to the Diviner data (128 pixels/degree).
Even so, the LRO Diviner data is better than the simulated surface temperature, because it is the direct measurement of the temperature of the mare basalts. In this study, only the emissivity map at 37 GHz is employed, and the application of the emissivity should be critical.

3.2.4. Reliability Analysis

For the CELMS was the first orbital instrument to measure the microwave thermal emission of the lunar regolith [54], no similar data is available to evaluate the reliability of the generated nTB, dTB, and emissivity maps. Thus, the following three ways are used to comparatively evaluate the rationality of the generated nTB, dTB, and emissivity maps.
Firstly, the generated TB maps agree well with the previous global TB maps provided by Chan et al. [50], Zheng et al. [35,49], Cai and Lan [48], and Zhu et al. [55] in values and geographic distribution.
Secondly, the TB and nTB in Em4 are higher than Im2 at noon, while they are lower than Im2 at night. Moreover, the dTB in Em4 is higher than Im2. Because the FTA in Em4 is higher than Im2 [2], the TB, nTB, and dTB performances coincide well with the simulation results in Section 2.
Thirdly, Figure 4, Figure 5 and Figure 6 show that, in general, the correspondence between the mare units and the nTB and dTB performances is not perfect. Even so, the boundary between Im2 and other adjacent units is well seen in the nTB and dTB maps. In addition, the nTB and dTB performances are largely good expressed in Im1, Im3, Em2, and Em4 units and Mons Rümker. What is more, the geologic boundaries are also shown by the emissivity maps.
In summary, the generated nTB, dTB, and emissivity maps should be reliable. The special nTB performances at noon and night and the dTB maps present several good descriptions of the thermophysical features of mare units. The nTB and dTB performances at the four channels indicate a good description of the regolith thermophysical parameters in vertical direction.
To further understand the thermophysical features of the mare units in the Rümker region, the TB maps at 1 a.m., 7 a.m., 12 p.m., 4 p.m., 6 p.m., 8 p.m., and 10 p.m. are also generated in this study, which are used as frames of reference in the following discussions.

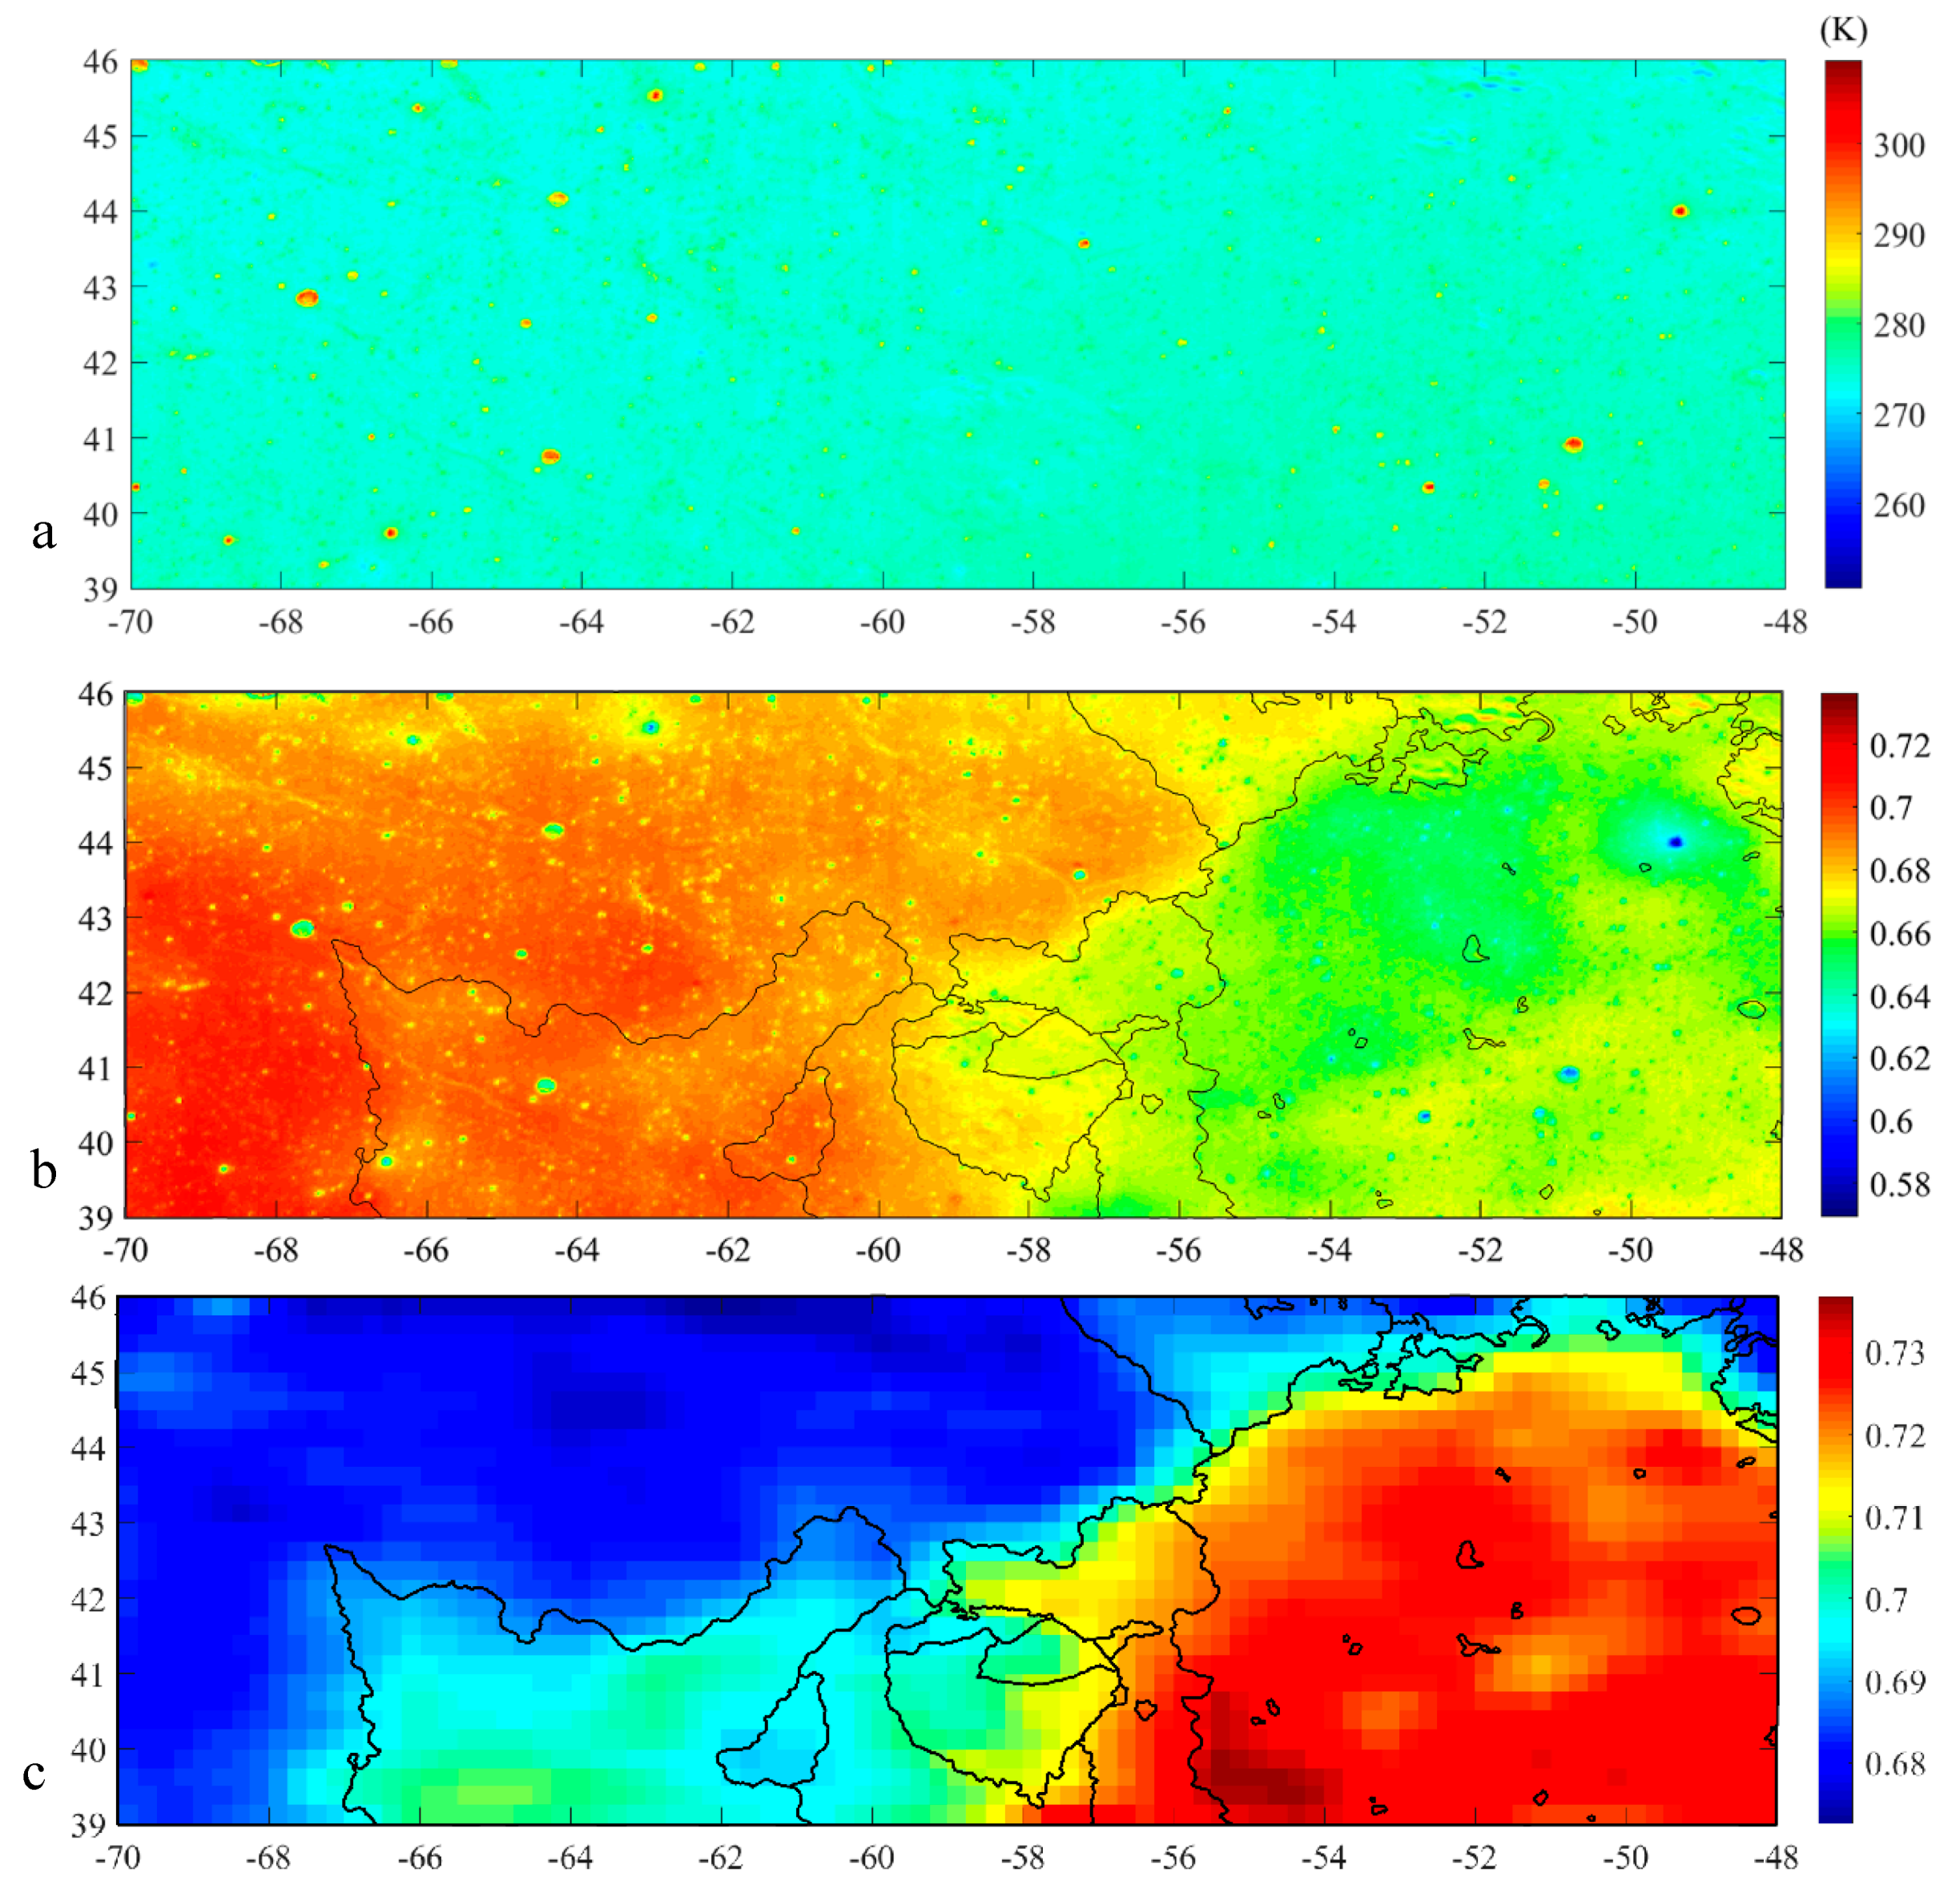
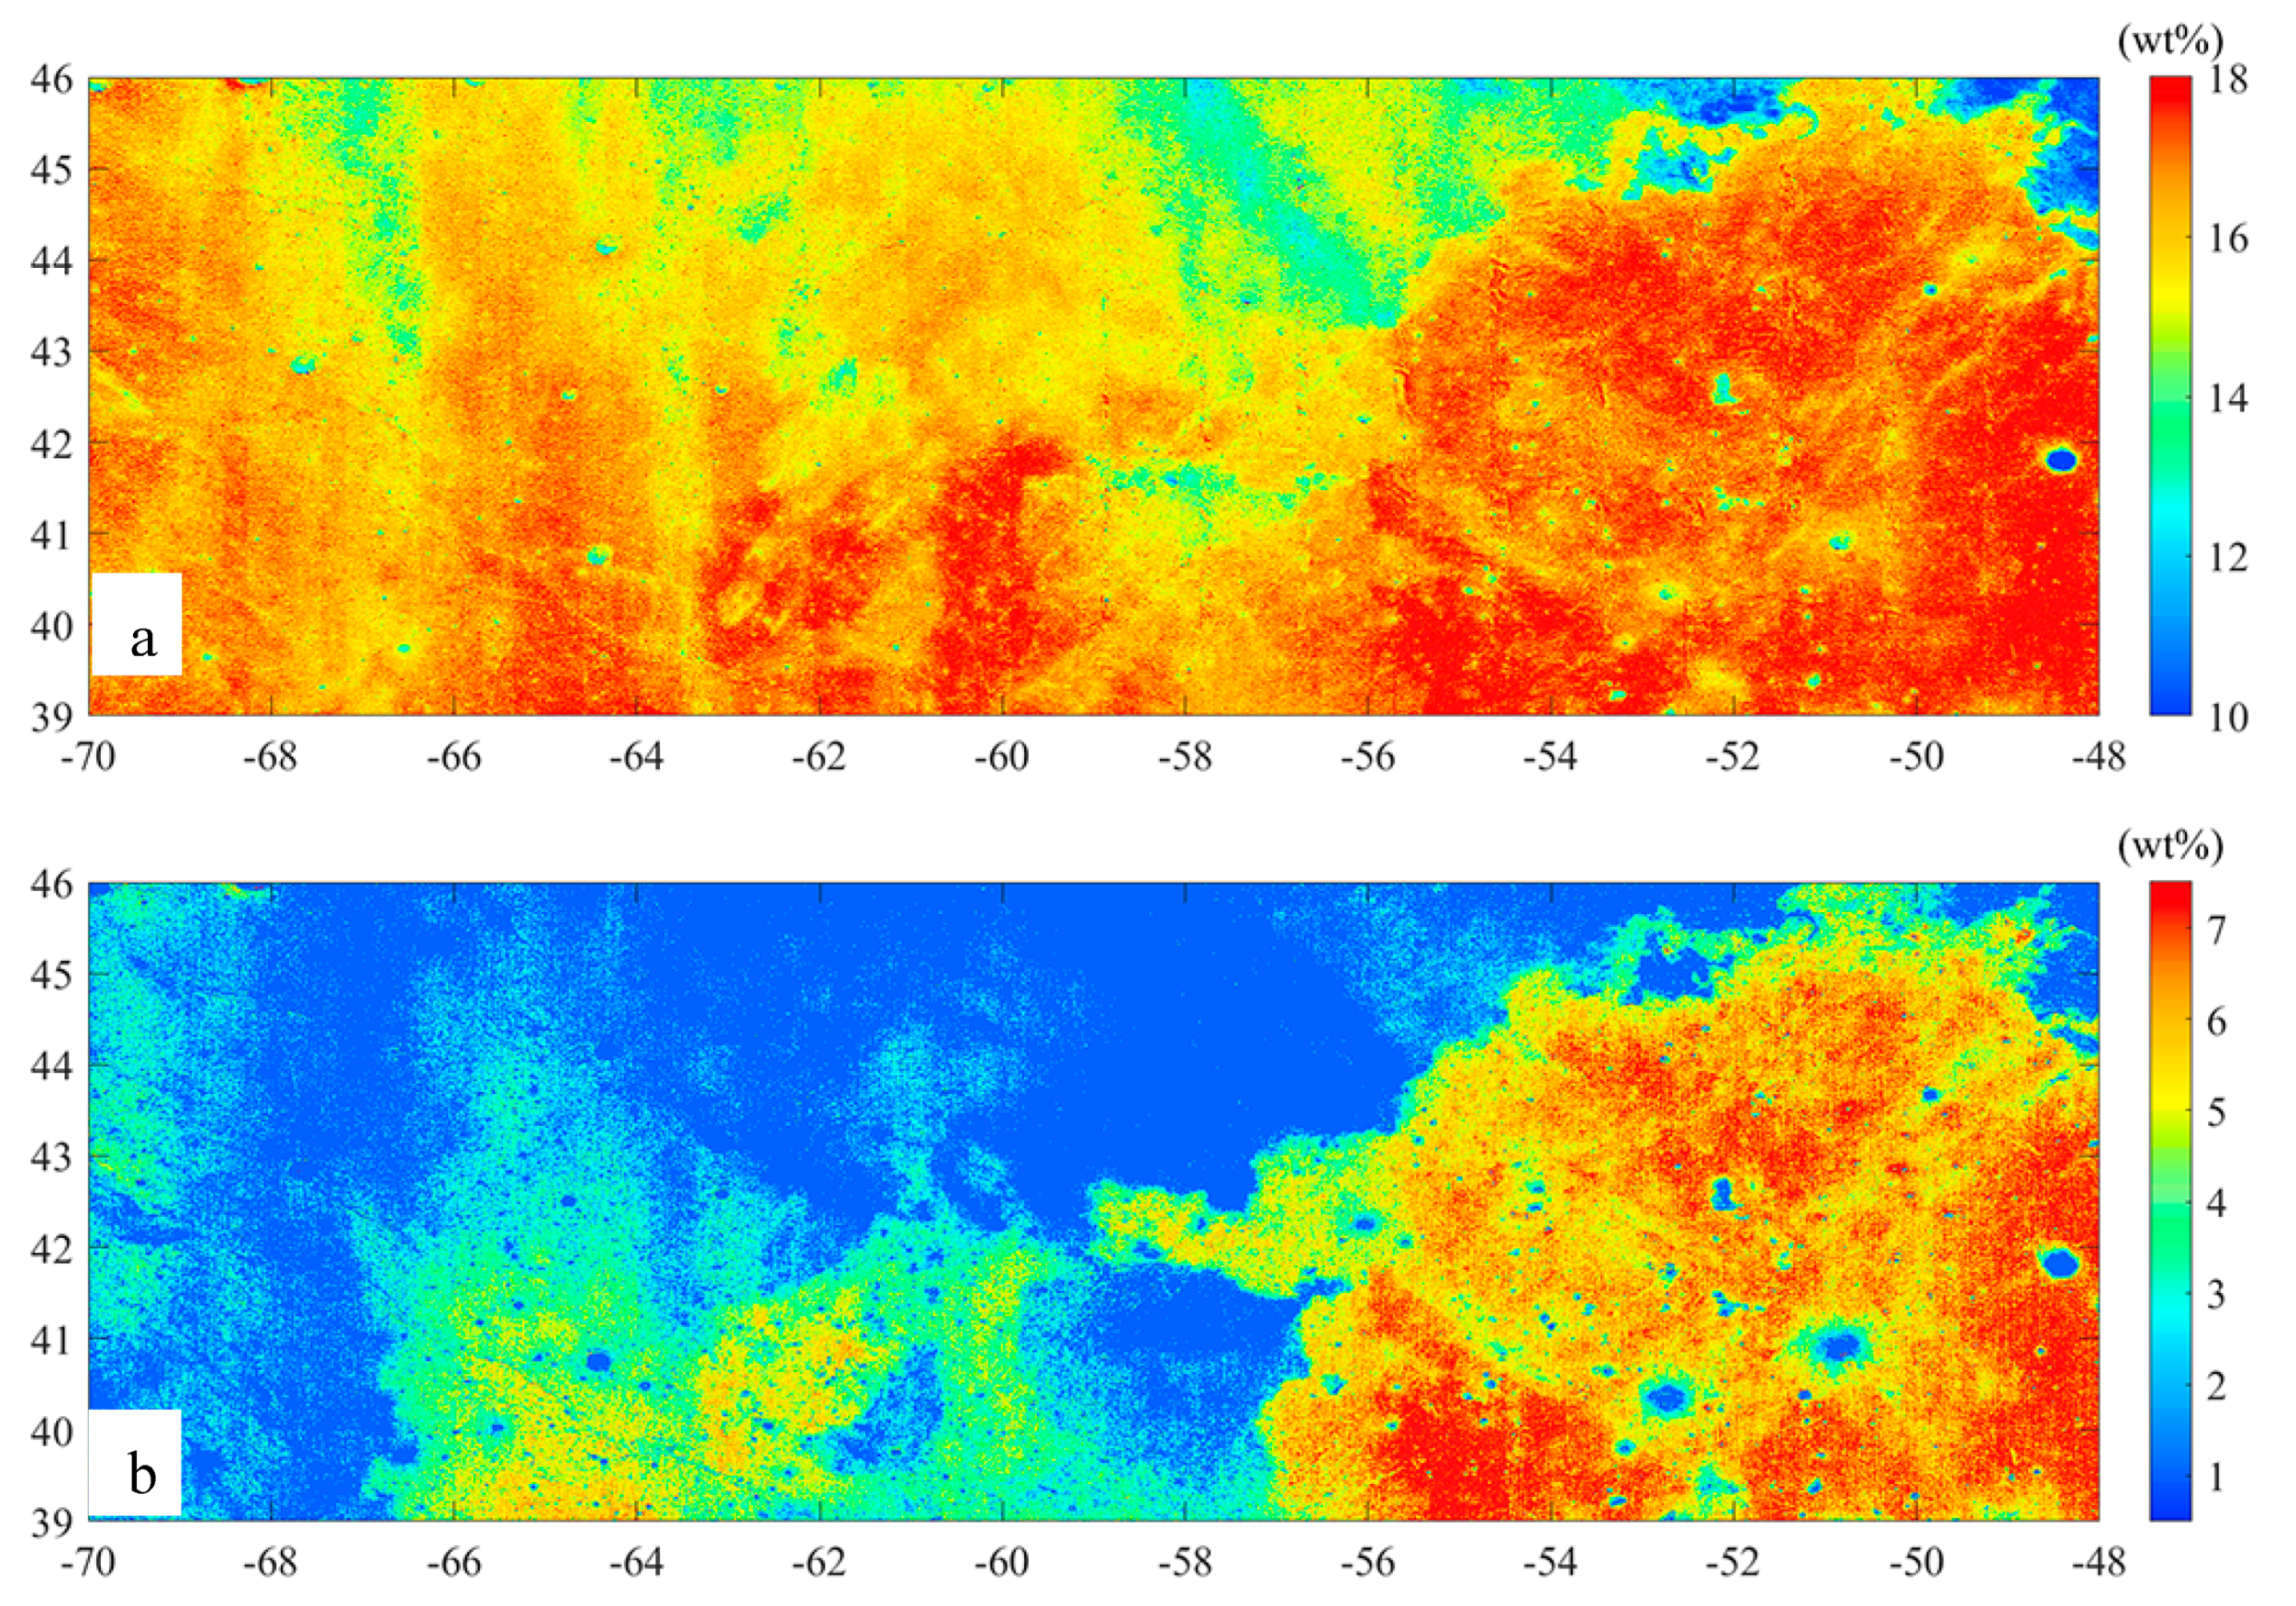
3.3. FeO and TiO2 Abundances

As mentioned before, the FeO and TiO2 abundances are the decisive factors for the TB of the mare units [42,56]. To address this issue, the FeO and TiO2 abundance maps (Figure 8) are derived from the Kaguya Multiband Imager (MI) data (five VIS bands at 415, 750, 900, 950, and 1000 nm; 20 m/pixel) following the methods of Otake et al. [47]. Kaguya MI data is available from the SELENE Data Archive (http://darts.isas.jaxa.jp/planet/pdap/selene/).
The FeO and TiO2 abundance maps (Figure 8) show that Em4 has the highest FeO and TiO2 abundances, followed by Im1, Em1, and Em3 units, and Im2 has the lowest values. Linear anomalies distributed along northwest and northeast directions indicate the presence of secondary craters and rays formed by foreign materials excavated by distant craters and laterally delivered to the region [2,26].

4. Results

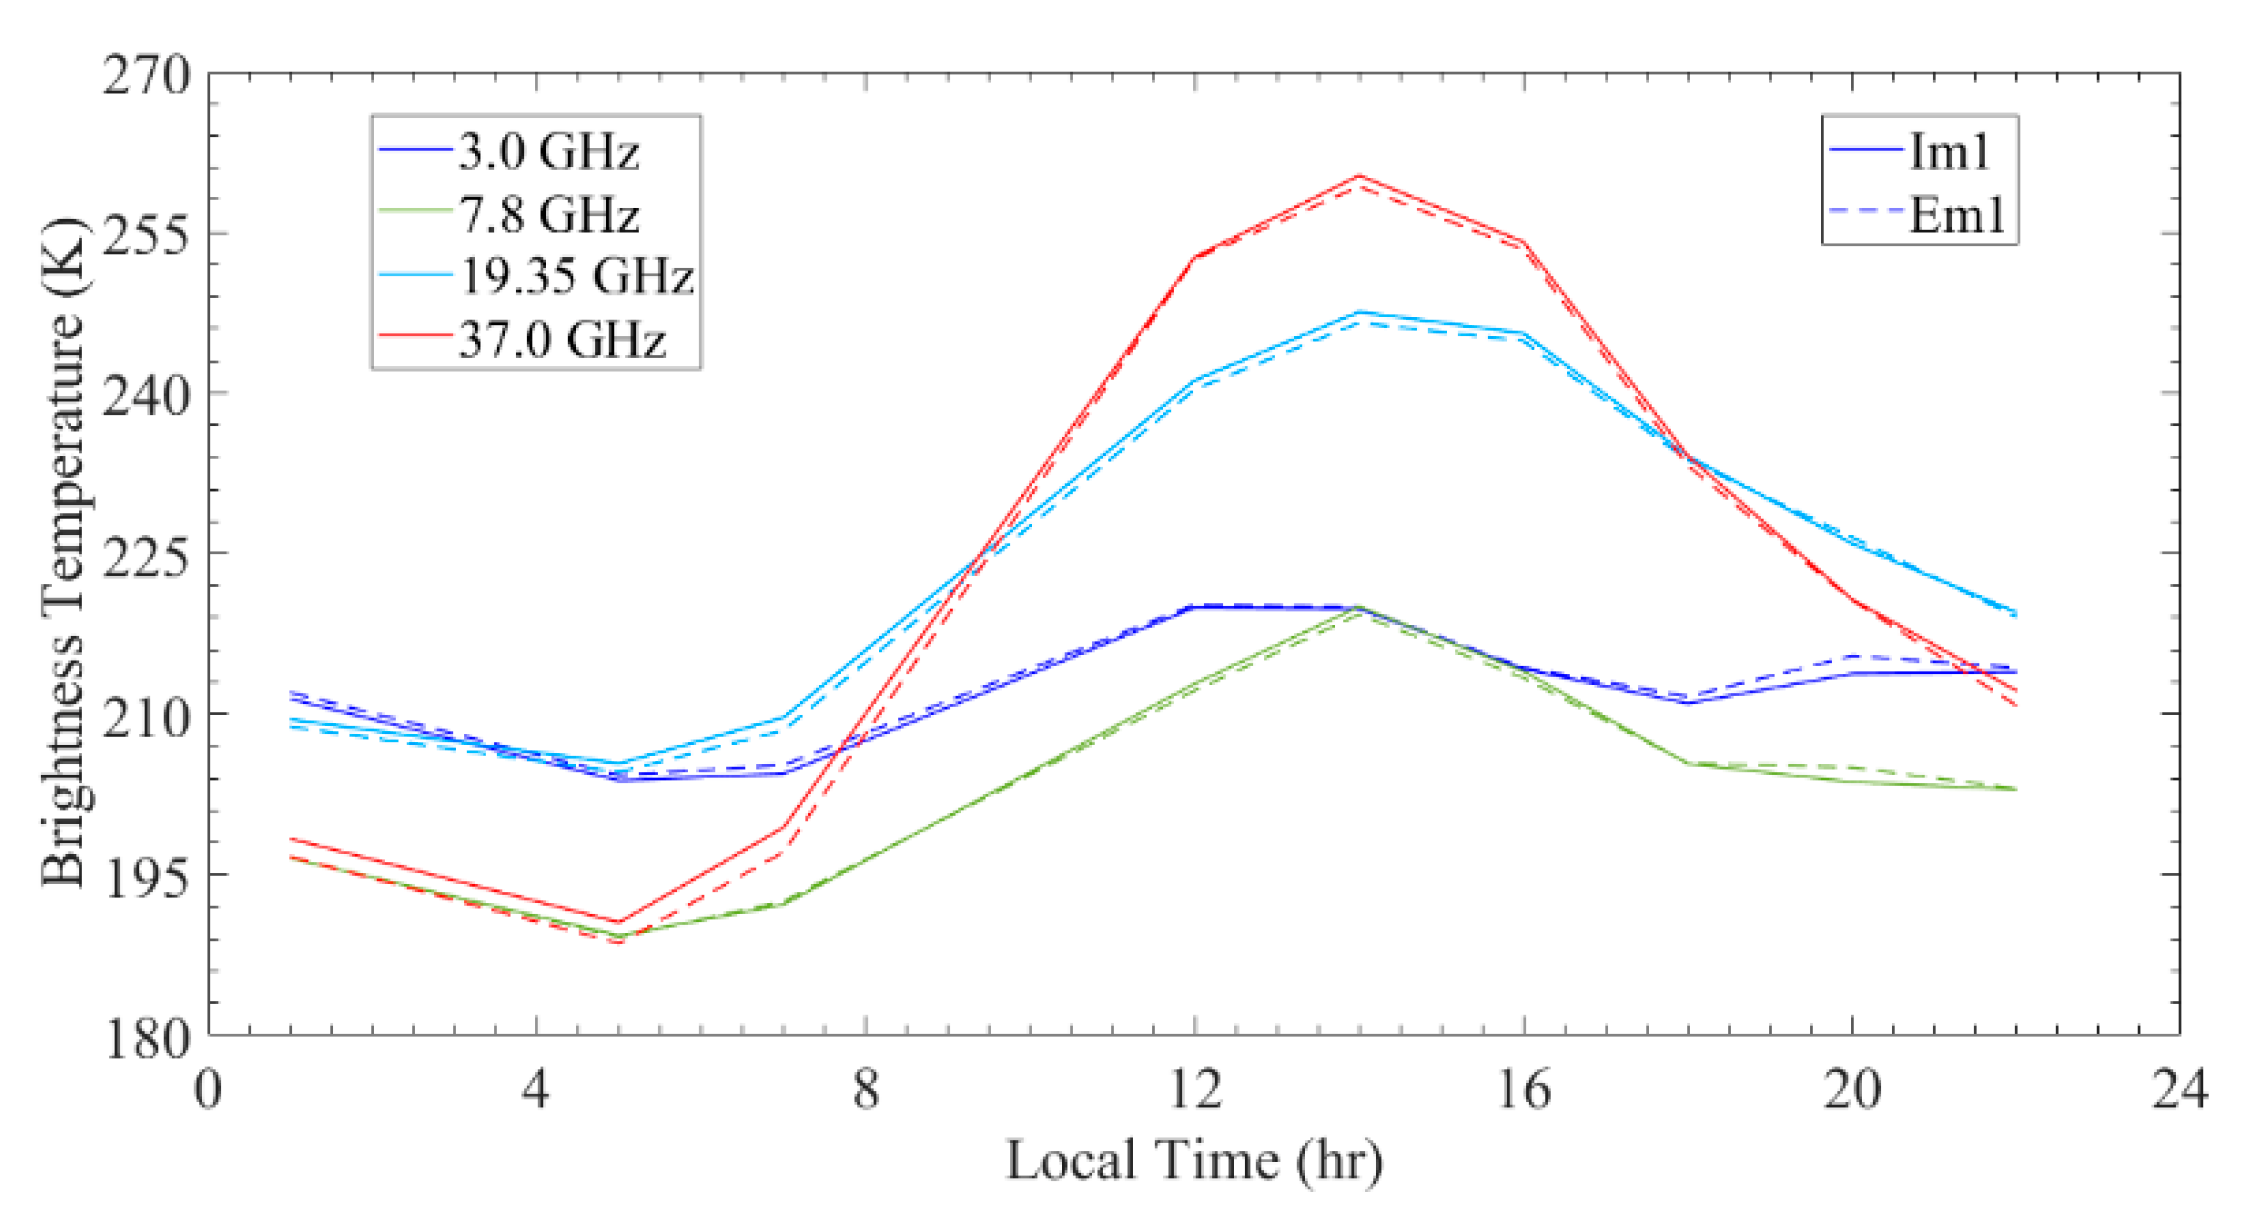
4.1. Imbrian-Aged Mare Units

Im1, Im2, and Im3 are Imbrian-aged mare units [2,14,57], which have relatively lower nTB values at noon, higher nTB values at night, and lower dTB values than their younger Eratosthenian-aged counterparts.
Im1 is the oldest mare unit (~3.42 Ga) in the southwestern part of the Rümker region [2]. Im1 has the third highest nTB at noon, and the nTB in its southern part is higher than that in the northern part (Figure 4). At night, Im1 has the third highest nTB in the extensive region at 3.0 GHz (Figure 5), while it is the second highest at the other three channels. The nighttime nTB in the central part is higher than its surroundings, distributed along a northwest direction, but lower than that in the Im2 unit. This appears at 7.8 GHz, 19.35, and 37 GHz but not at 3.0 GHz, suggesting the deposits at the surface are likely different from those at depth (larger 76.9 cm revealed by the 7.8-GHz microwave but less than 1 m indicated by the 3.0-GHz microwave). Figure 6 indicates that Im1 has the third highest dTB in this unit. The dTB in the northern part is several Kelvins lower than that in the southern part at 7.8, 19.35, and 37 GHz, and the dTB in the whole Im1 is homogeneously higher than Im2 at 3.0 GHz. These findings mean that the mare deposits in the northern part are heavily influenced by the ejecta from the Im2 unit in the shallow layer. This conclusion is supported by the emissivity (Figure 7) and compositional maps (Figure 8), where the boundary between Im1 and Im2 is not clear.
Im2 (~3.39 Ga) is the largest mare unit in the western and northwestern parts of the Rümker region. Im2 has the lowest nTB at noon (Figure 4), the highest nTB at night (Figure 5), and the lowest dTB values (Figure 6), respectively. The nTB and dTB performances agree well with their lowest FeO and TiO2 abundances according to the numerical simulation (Section 2). The nTB at 3.0 and 7.8 GHz in the northwestern part is relatively higher than that of the rest, no matter whether at noon or night. Notably, the noon nTB map (Figure 4) indicates a special region with considerably lower nTB centered at (63°W, 43.5°N, ~70 km in diameter). The nighttime nTB of this region is relatively lower than other places in this unit at 3.0 and 7.8 GHz but similar as the nearby place at other channels, indicating that this is a hidden structure. Furthermore, at 19.35 and 37 GHz, the nTB in the southwestern part is lowest at noon but highest at night. Im2 has the lowest dTB values compared to the other units (Figure 6). Here, the special nTB performances in the northwestern, southwestern, and that centered at (63°W, 43.5°N) are confirmed by the dTB maps, indicating the inhomogeneity of the mare deposits in Im2. Im2 has a higher nighttime emissivity but lower noon emissivity values (Figure 7).
Im3 (~3.16 Ga) is located in the northeastern parts of the Rümker region. The noon nTB in Im3 is higher than Im2 but lower than Em4, while the nighttime nTB is lower than Im2 but higher than Em4. The dTB is similar to that in Im1 at noon. In addition, the dTB in the southern part of Im3 is higher than that in the northern part. The night emissivity of Im3 is lower than Im2 but higher than Em4 (Figure 7), and the geologic boundaries are well consolidated in this unit.
Mean values of TB, nTB, and dTB of the Imbrian-aged mare basalts are summarized in Table 1. Table 1 shows that the nTB is lowest in Im2 at noon and highest at night, while the nTB is highest in Im1 at noon and it is lowest in Im3 at night. The mean dTB is highest in Im1, followed by Im3 and Im2. The dTB and nTB performances in Im2 agree well with its low FeO and TiO2 abundances (Figure 8) according to the numerical simulation (Section 2). However, the nTB performances in Im1 and Im3 are difficult to explain and are not consistent with the numerical simulation. We will discuss this phenomenon in Section 5.
Qian et al. [2] suggested that NE-orientated Pythagoras secondary ejecta may appear in Imbrian-aged mare units based on surface compositions (Figure 8); however, these linear features are not presented in the TB, nTB, and dTB maps, indicating the CELMS data is weakly affected by the ejecta or the ejecta layer is relatively thin.

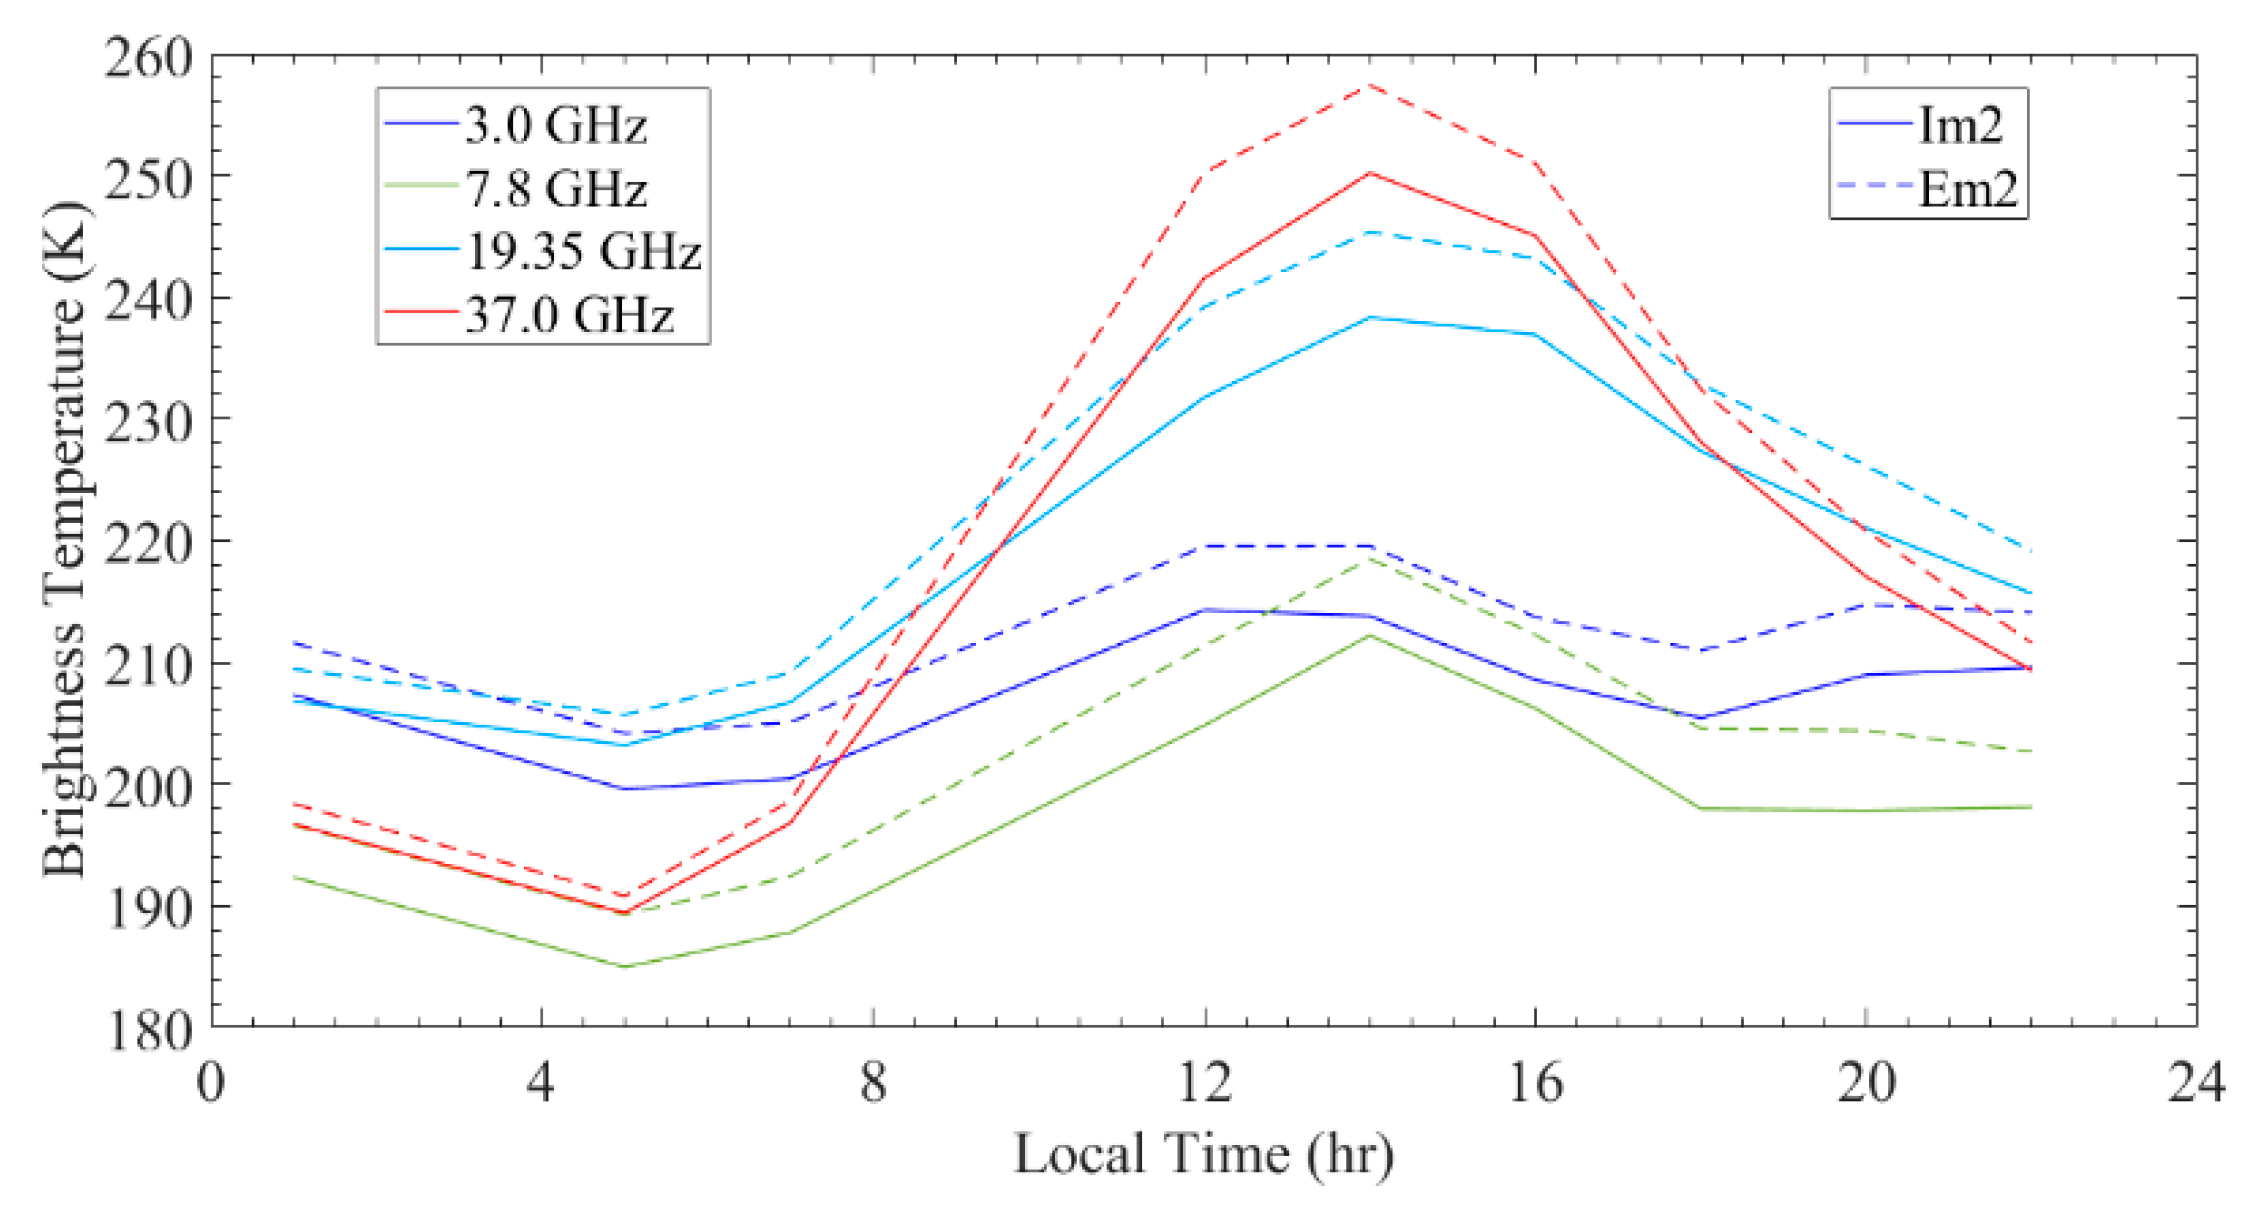
4.2. Eratosthenian-Aged Mare Units

Em1, Em2, Em3, and Em4 are Eratosthenian-aged mare units [2], which have relatively higher nTB at noon, lower nTB at night, and higher dTB values, corresponding to their higher FeO and TiO2 abundances.
Em1 (~2.30 Ga) embays Mons Rümker in the southwest, which presents the third highest nTB at noon and the second highest nTB at night as same as Im1. At noon, there is a small region with fairly low nTB at 3.0 GHz in the western part adjacent to the Em2 unit, and the area of this special region increases with the frequency. At night, the nTB becomes homogeneous at 19.35 and 37 GHz. The dTB maps indicate that the values here are lower than that in Em4 but higher than that in Im2. Moreover, the unit presents a largely homogeneous dTB distribution, and the values are very similar to those in Im1. The difference between Em1 and Im1 units is also not clear in the emissivity maps (Figure 7).
Em2 (~2.13 Ga) is a small patch in the middle southern part, which is surrounded by Im1 to the west and Em1 to the east. Em2 has the nearly lowest nTB at noon and highest at night as that in Im2 except for 3.0 GHz map (Figure 4 and Figure 5). At 3.0 GHz, the nTB is similar to the nearby units. In dTB maps, most part of Em2 unit is similar to Im1 and Em1 units at 3.0 GHz, but it is lower than Im1 and Em1 units at the other three channels. This means that the thermophysical features of the mare deposits in Em2 change significantly with depth.
Em3 (~1.51 Ga) is located to the east of Mons Rümker, whose thermophysical features are complex. At noon, the place adjacent to Em4 has the highest nTB, the place adjacent to Im2 has the third highest nTB, and the remaining place displays the second highest nTB (Figure 4). At night, the extensive area has the lowest nTB at 3.0 and 7.8 GHz as Em4, while it has the third lowest nTB at 19.35 and 37 GHz. The dTB is highest in the place adjacent to Em4, it is the third highest in the place adjacent to Im2, and it is the second highest in the remaining areas. Thus, Em3 is in the transition from the Ti-rich Em4 unit to the Ti-poor Im2 unit, and the change of the regolith thermophysical features with depth is great in the horizontal direction.
Em4 (~1.21 Ga) is the youngest mare unit in the eastern part of the Rümker region, and indicates the highest nTB at noon, lowest nTB at night, and highest dTB values. These nTB and dTB performances agree well with the highest FeO and TiO2 abundances according to the numerical simulation (Section 2). TB, nTB, and dTB maps show that the mare deposits are not homogeneous in this unit (Figure 4, Figure 5 and Figure 6). The following several observations have been made.
(1)
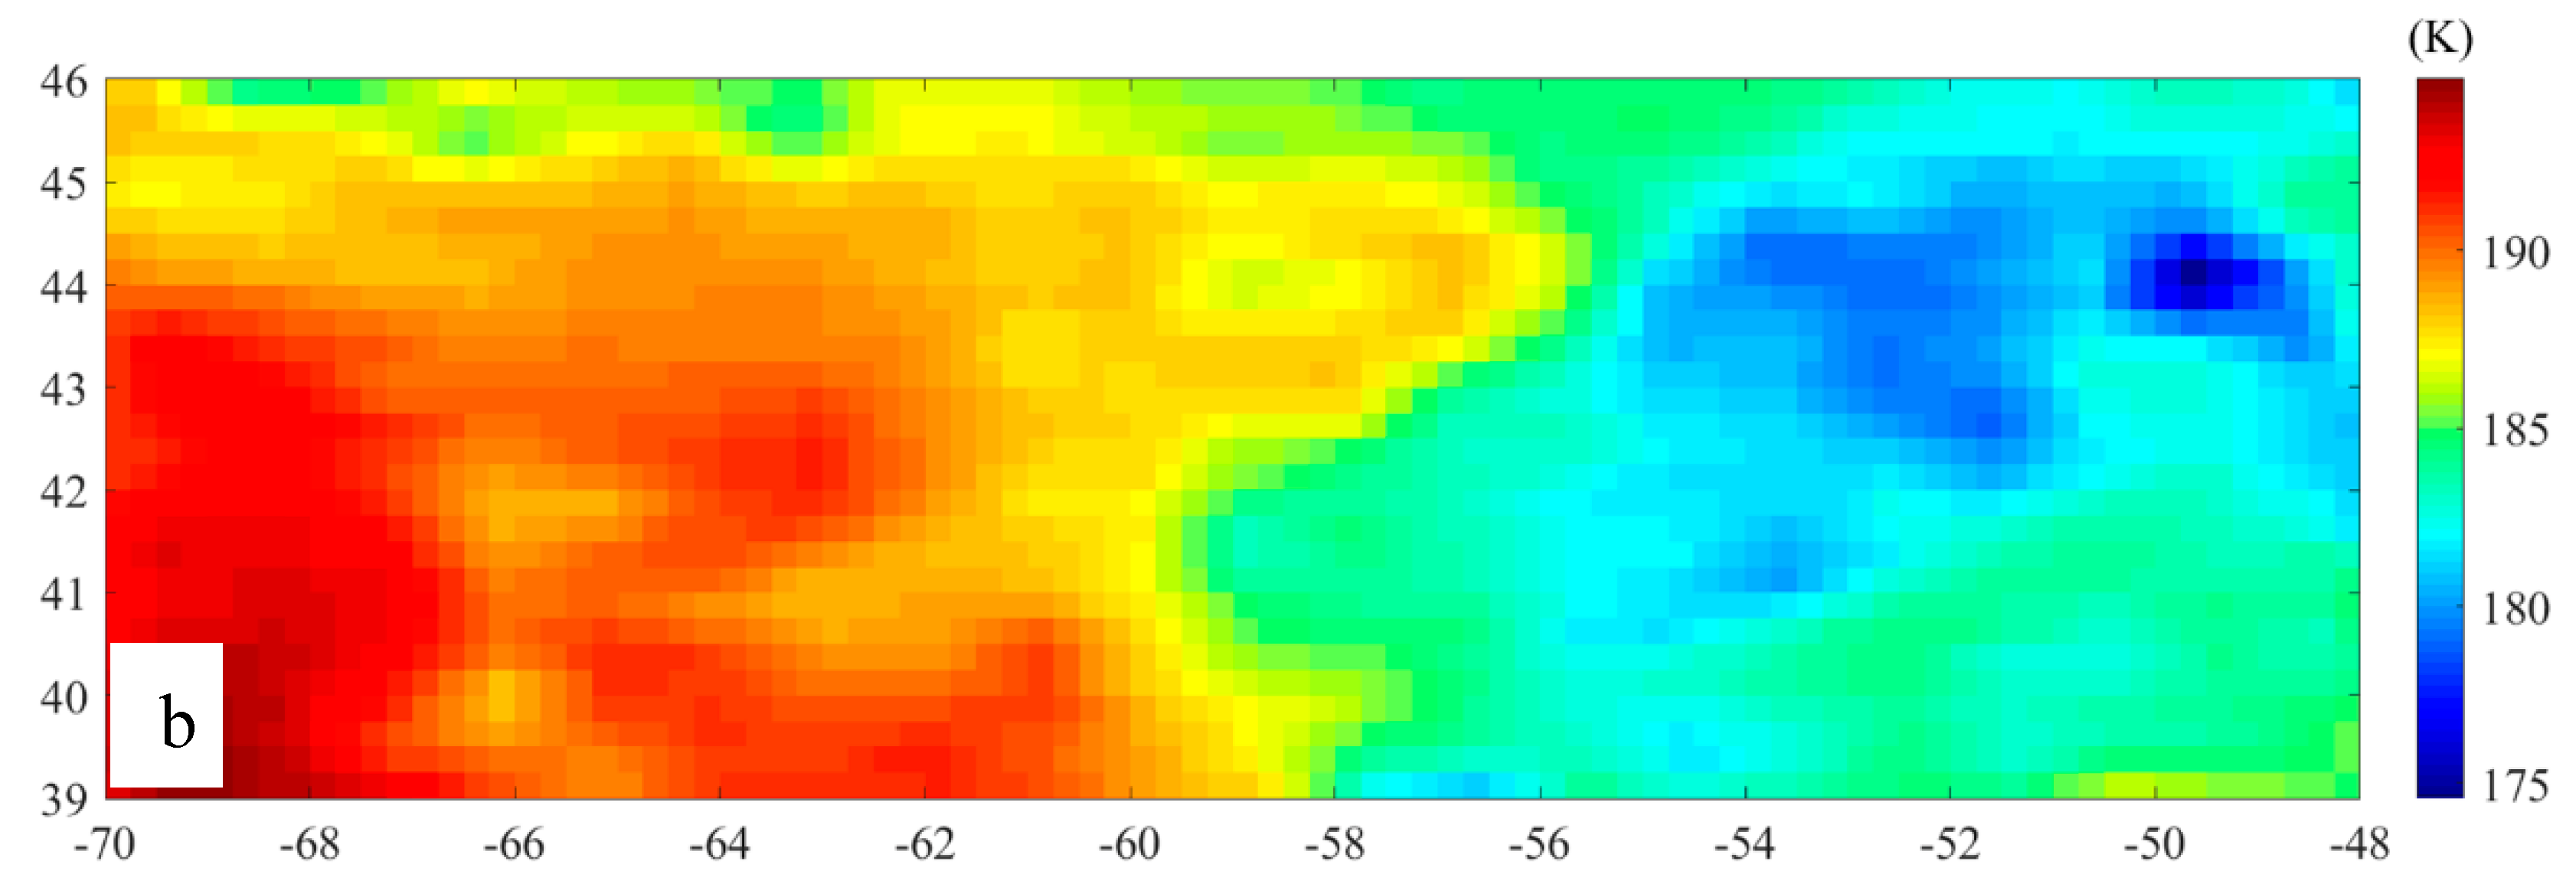
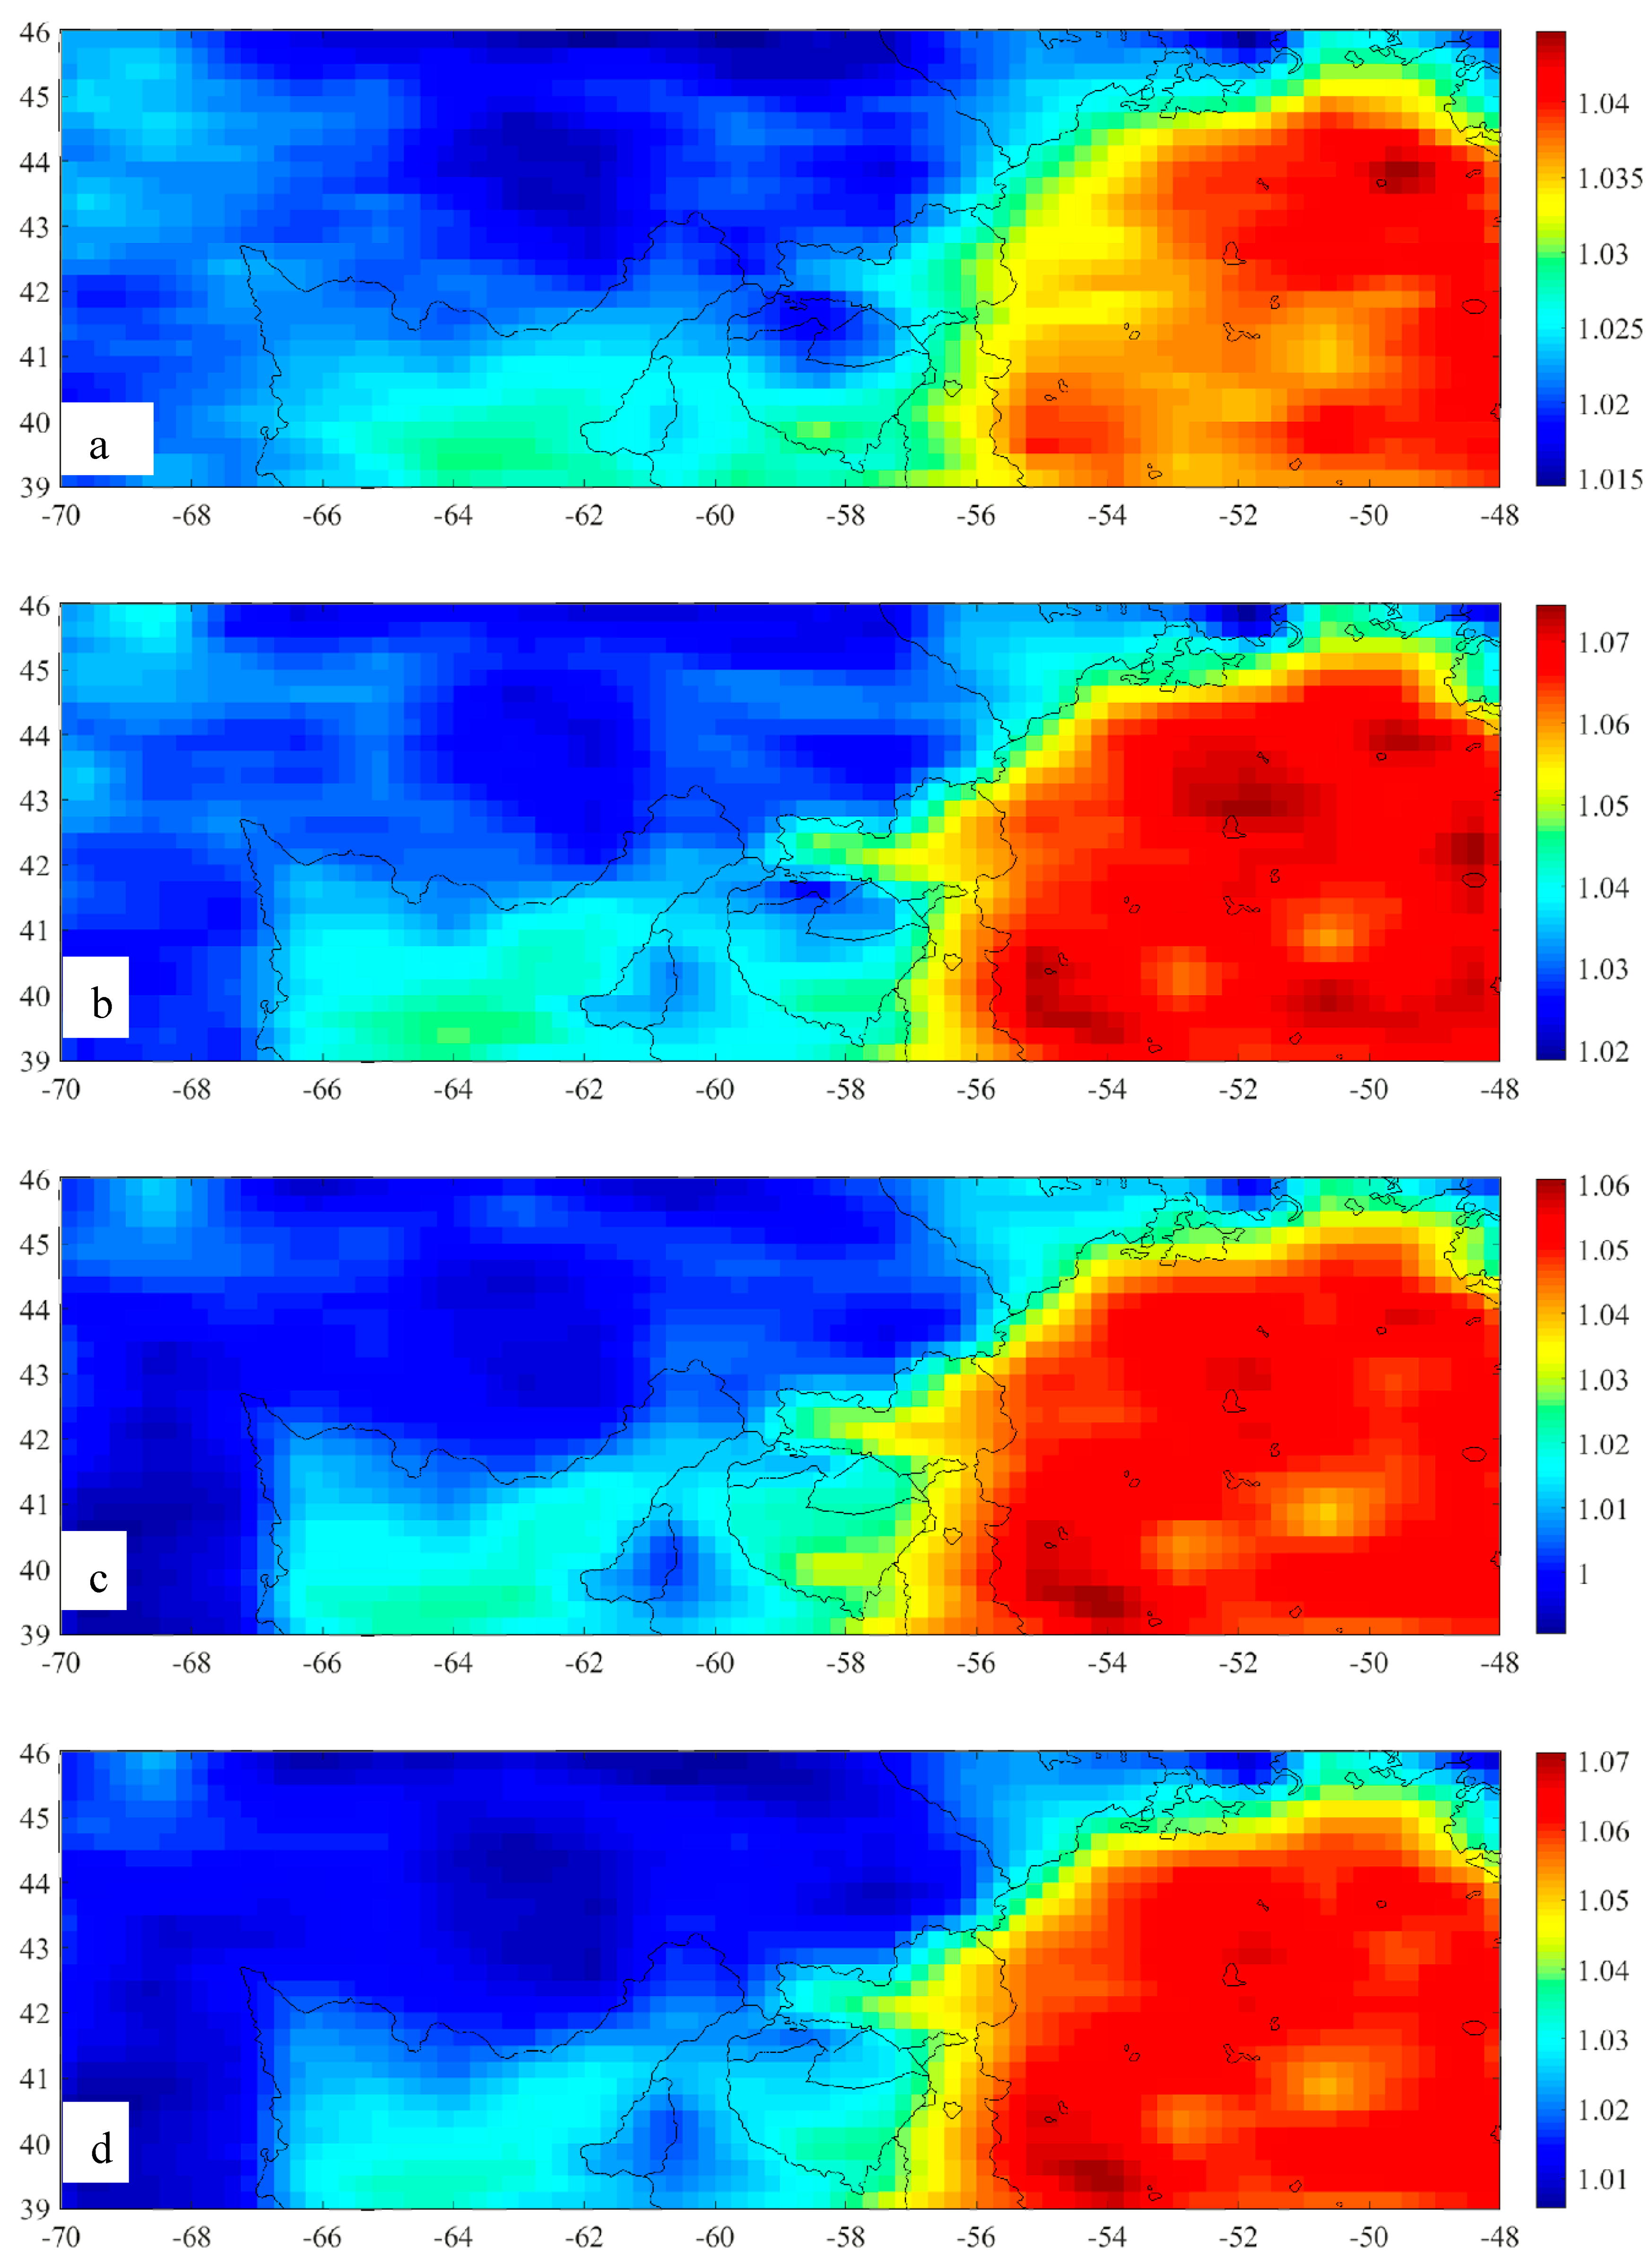
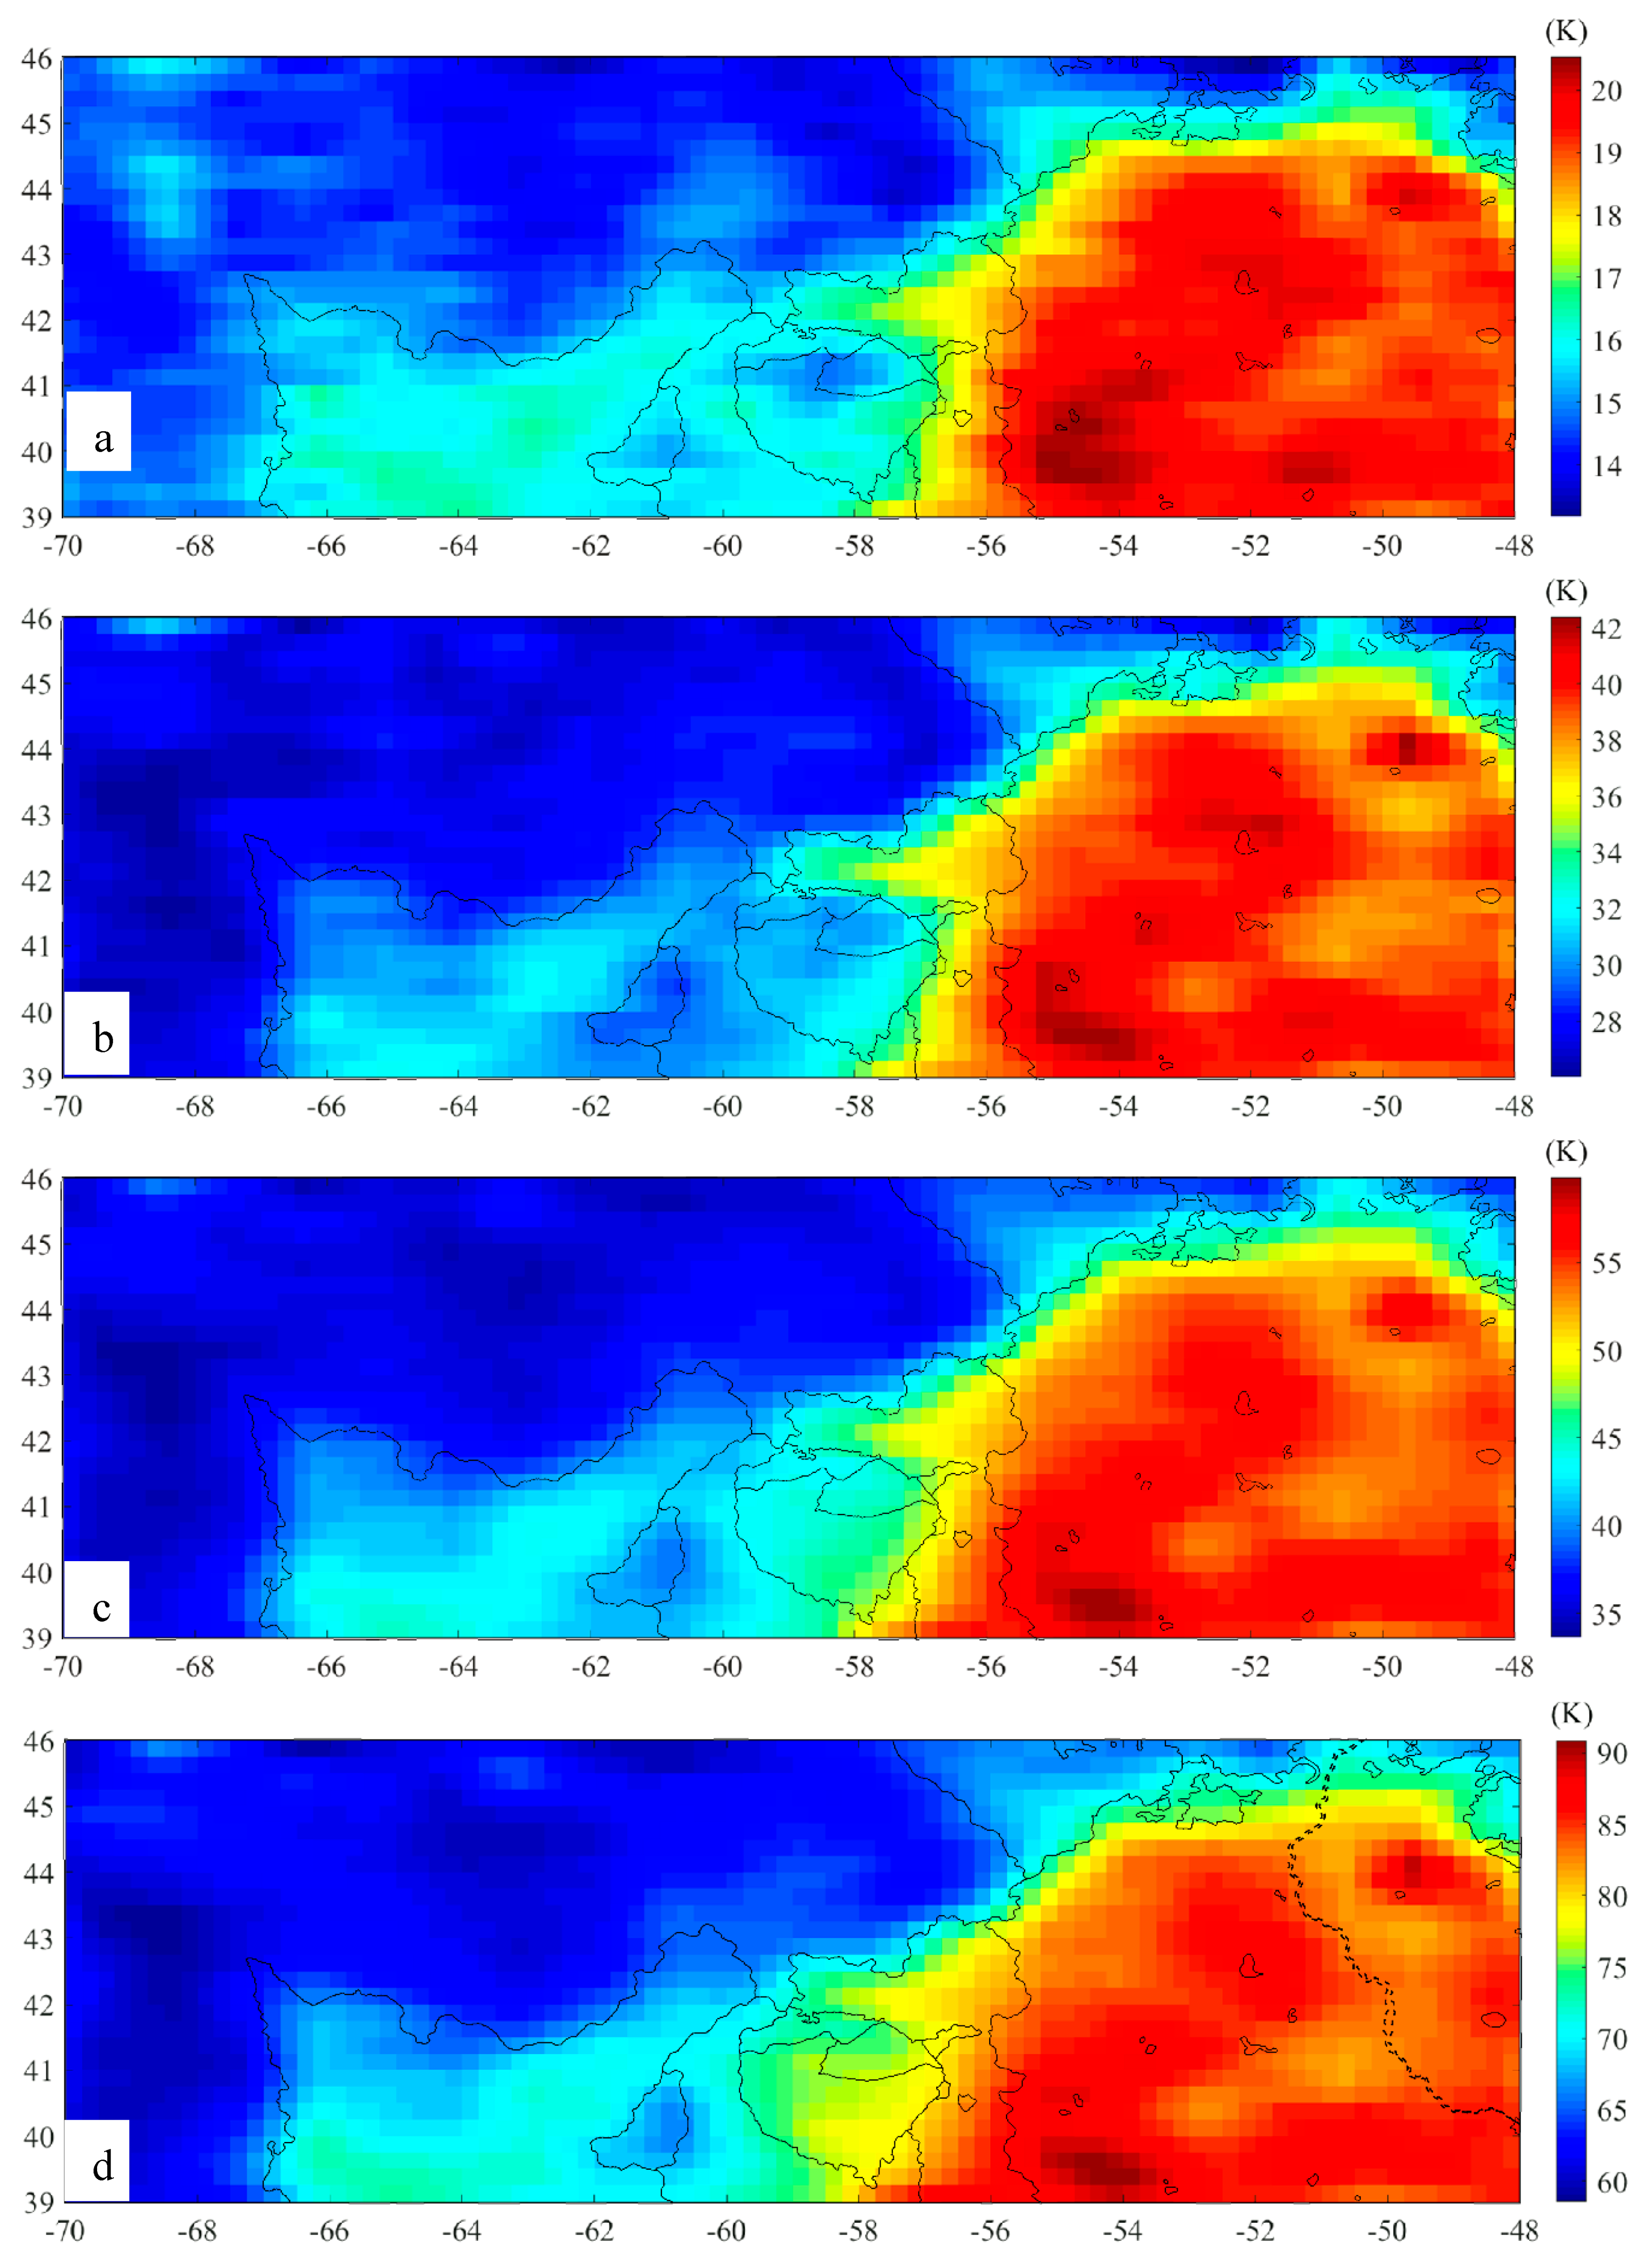
At noon, the 3.0 GHz nTB in the central and northwestern parts is lower than the remaining area, while they become homogeneously high in the other three channels. At night, the nTB in the western part is lower than that in the eastern part. In addition, the dTB of Em4 in the western and southern parts is homogeneously high (Figure 6).
(2)
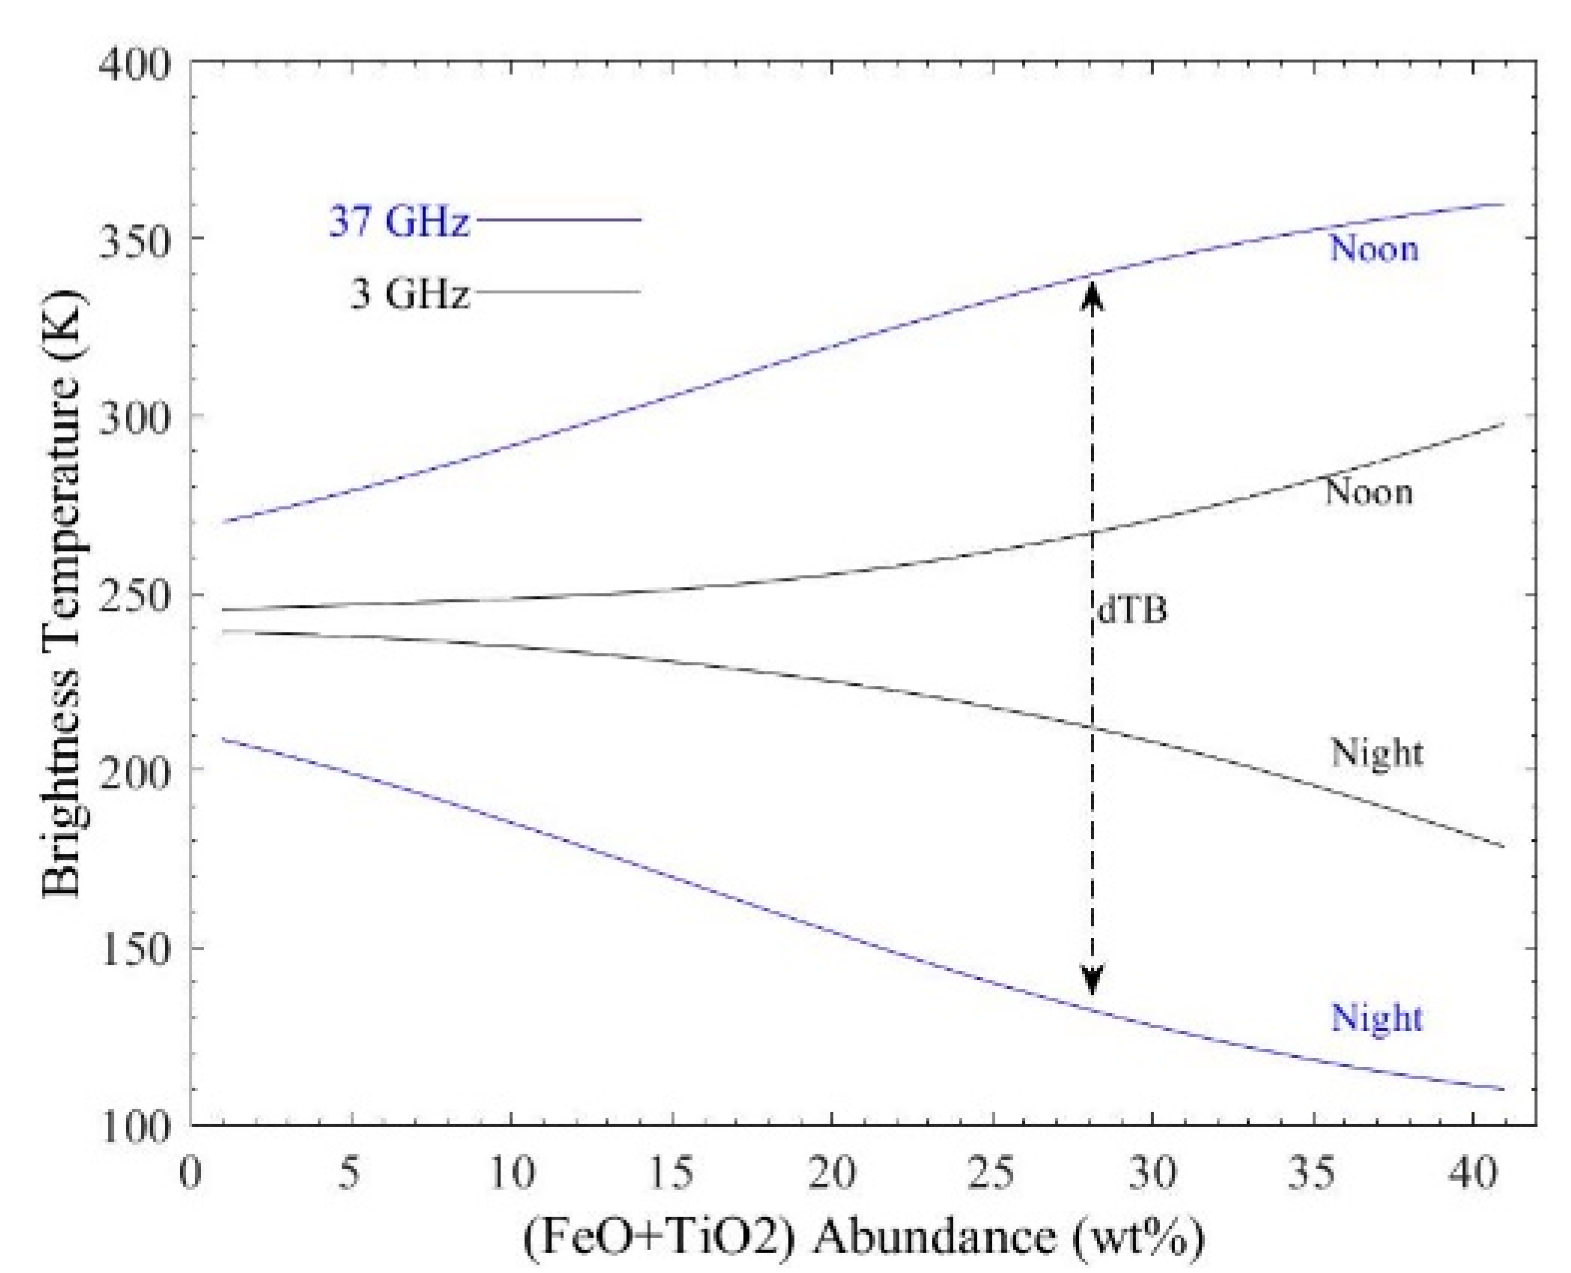
There exist relatively higher noontime nTB and dTB areas centered at (54.5°W, 39.5°N) and (49.5°W, 44.5°N), and their nTB at night is considerably low. The numerical simulation (Section 2) suggests that the FTA here should be very high in such conditions [40,42]. As shown by Figure 8, the FeO and TiO2 abundances are highest in the region centered at (54.5°W, 39.5°N), agreeing with the numerical simulation. However, the special TB values in the region centered at (49.5°W, 44.5°N) are not supported by the FeO and TiO2 maps.
(3)
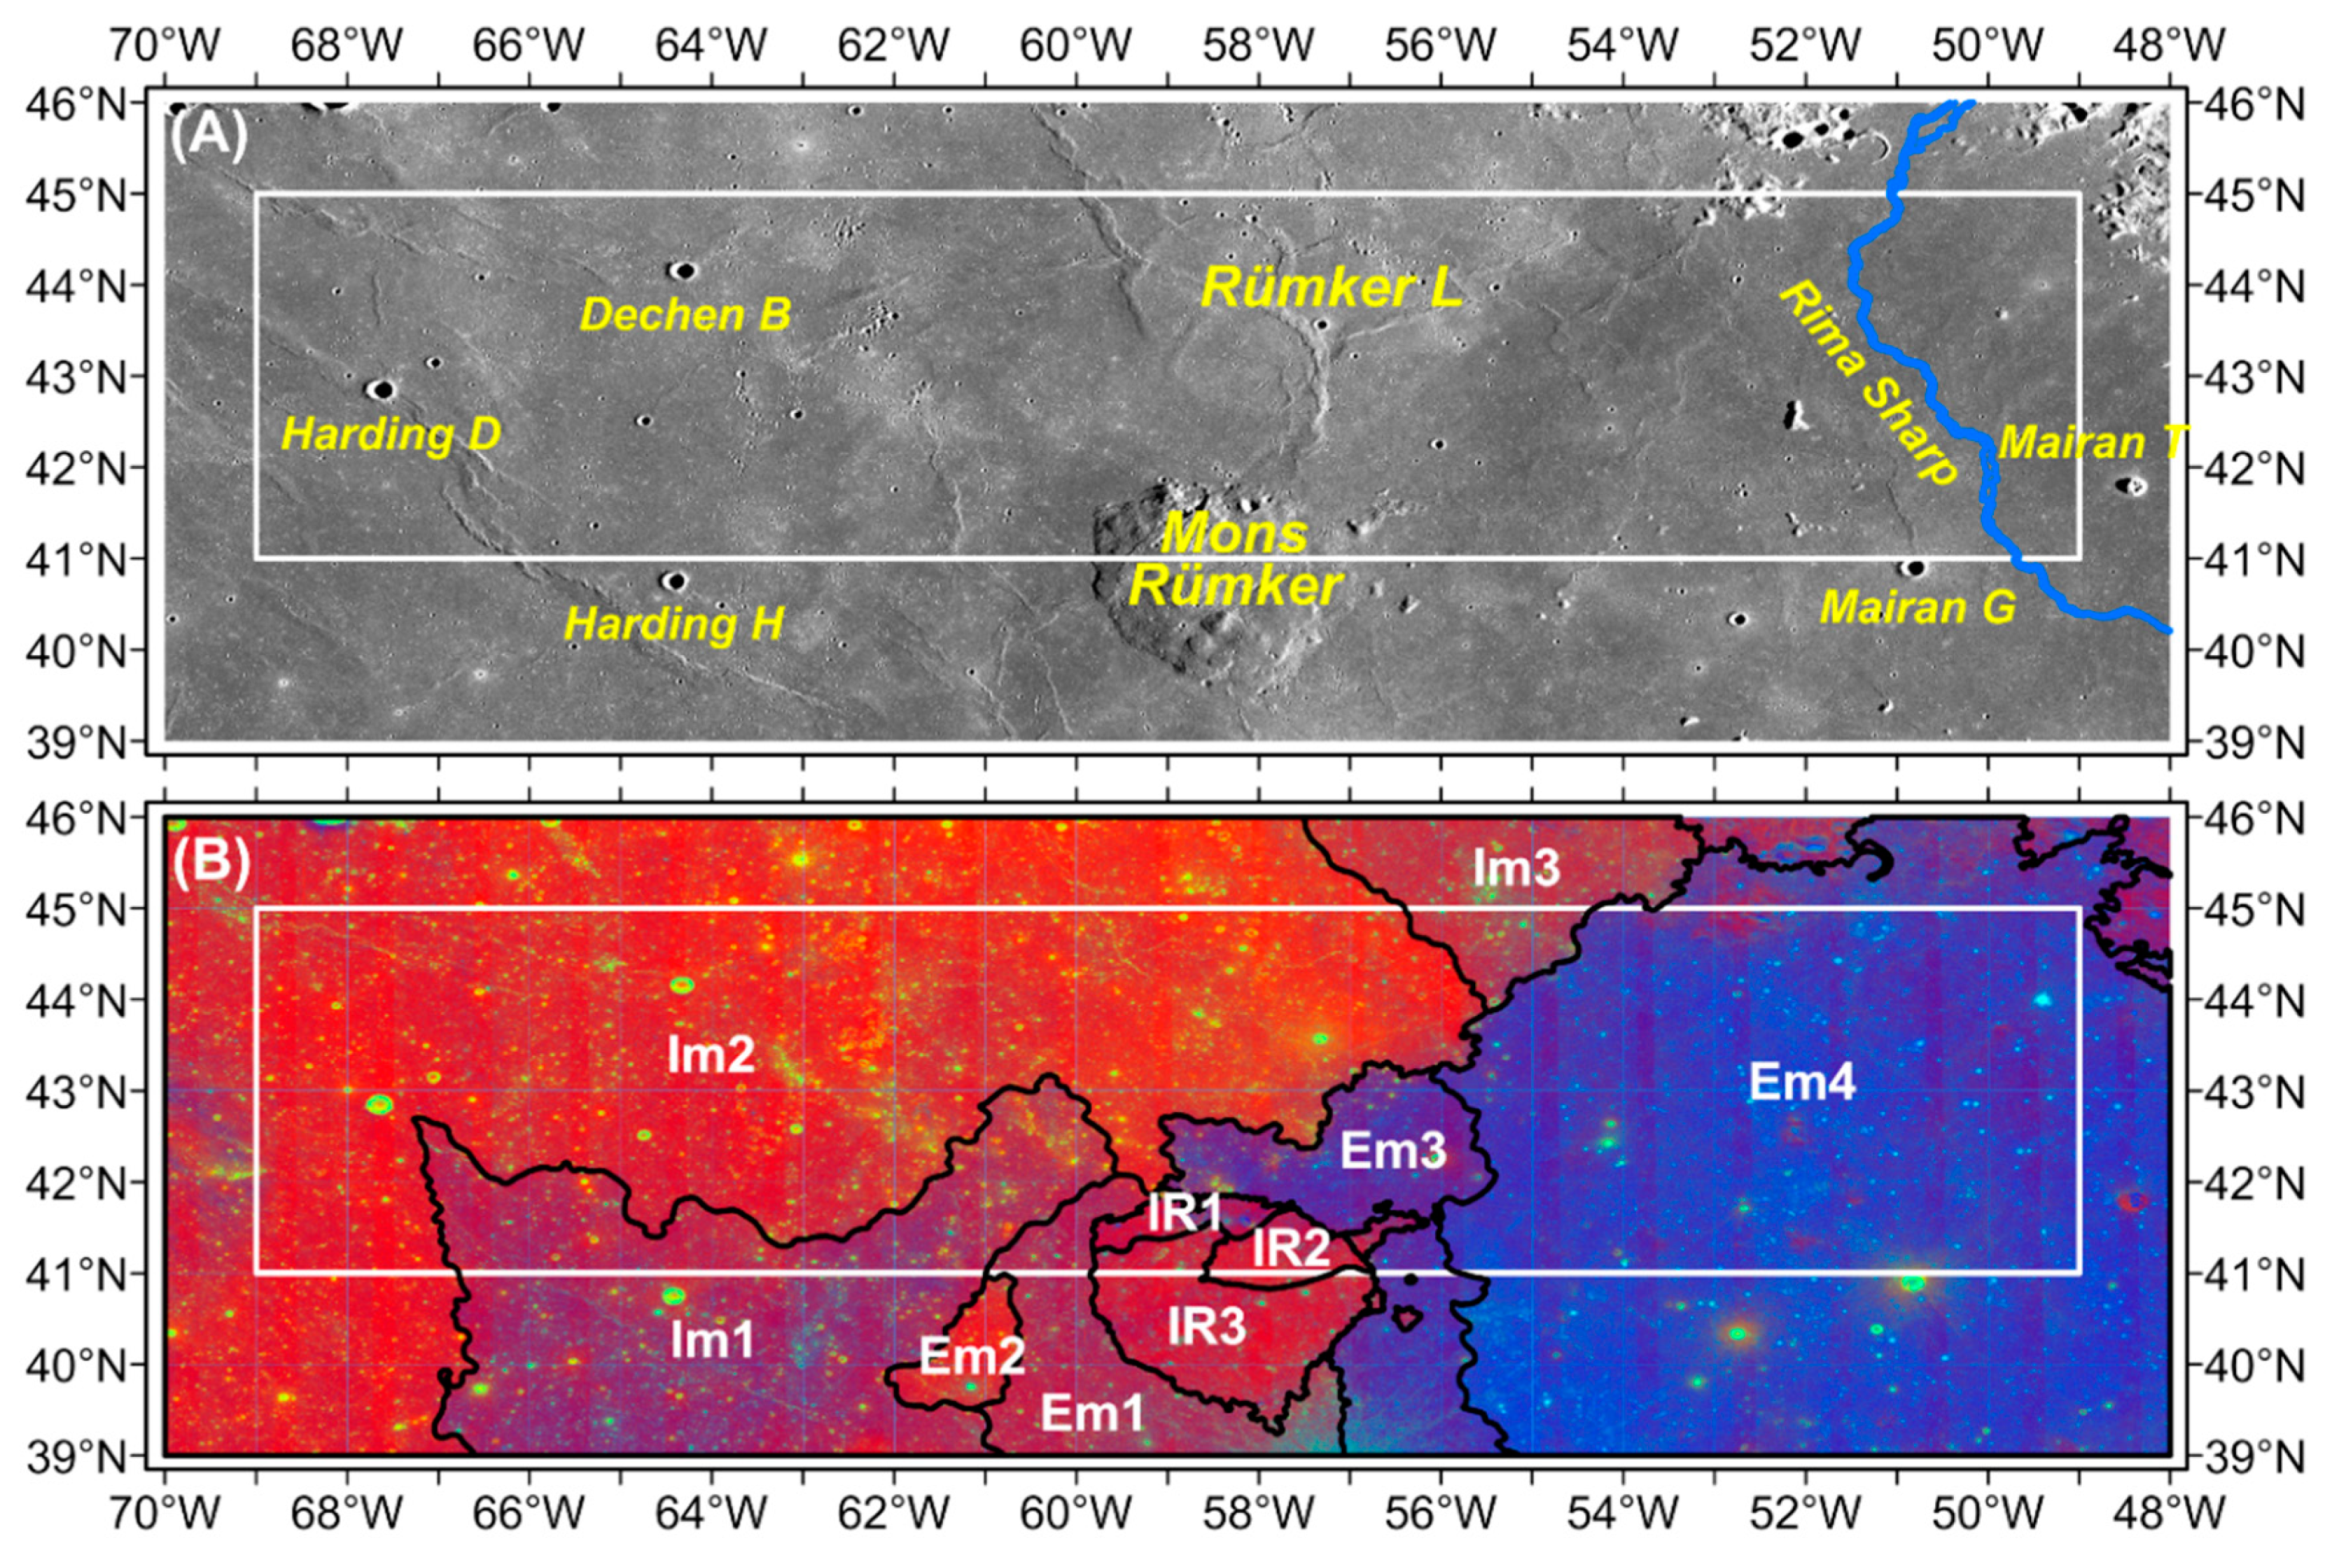
There occur relatively lower noontime nTB and dTB values in two patches centered at (53.0°W, 40.5°N) and (51.0°W, 41.0°N). In the optical images, they are two craters with diameters of 3.9 km and 5.8 km, respectively, excavating underlying low FeO and TiO2 materials. However, the area of the regions with relatively lower dTB is much more extensive than the craters range. Particularly, at 7.8, 19.35, and 37 GHz maps, the regions with relatively lower dTB extend to the east and north directions. Interestingly, Rima Sharp, the longest sinuous rille on the Moon [18] extends across the western part of the low-dTB zone (Figure 6d).
The mean TB, nTB, and dTB values of the Eratosthenian-aged mare basalts are summarized in Table 2. Table 2 indicates that the mean noontime nTB is highest in Em4, followed by Em3, Em1, and Em2. The mean dTB supports this sequence. The mean nighttime nTB indicates an inverse sequence, and it is highest in Em2, followed by Em1, Em3, and Em4. These TB performances agree perfectly with the numerical simulation by Meng et al. [30,42,51], who proposed that the regions with higher FeO and TiO2 abundances will display a higher TB in the daytime, a lower TB at night, and higher dTB values, supported by Qian et al. [2]’s TiO2 and FeO measurement (Figure 8). The sequence of the four units is critical to understand the basaltic volcanism in the Rümker region.

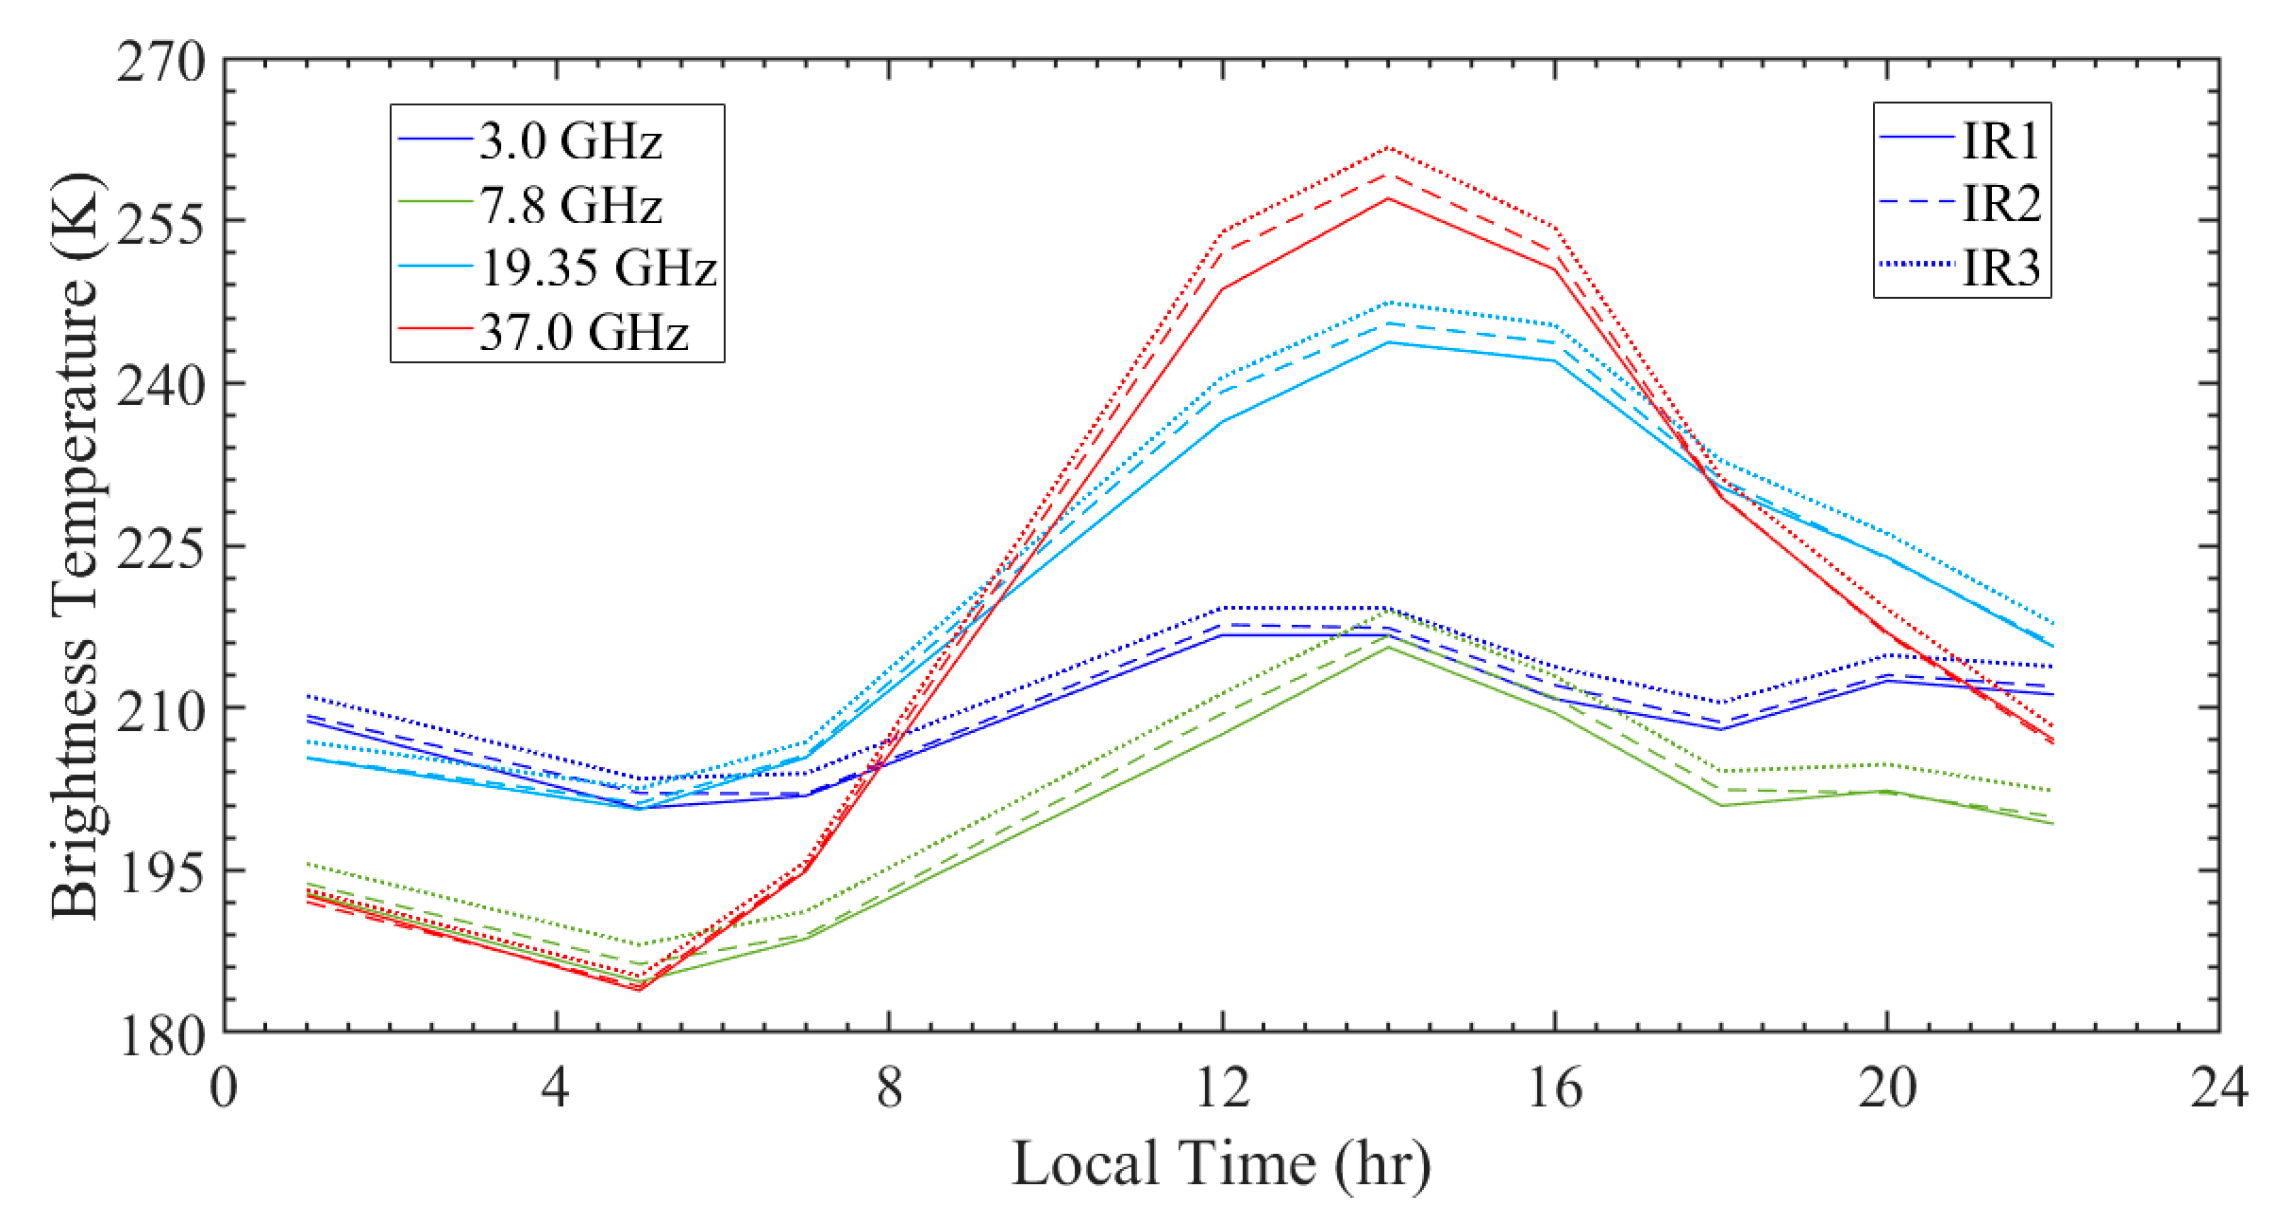
4.3. Rümker Plateau Units

IR1, IR2, and IR3 are Rümker plateau units [1], which have the third highest nTB at noon and night and a complex dTB performance.
IR1 (~3.71 Ga) is a lineated terrain in the northern and northeast part of Mons Rümker, formed by mixing of Iridum crater ejecta and basaltic materials. IR1 has much lower noon TB in the northern part than IR2 and IR3 (Figure 4). The nTB in the northern part has lowest values at 3.0 and 7.8 GHz, while it is similarly as low as IR2 and IR3 at 19.35 and 37 GHz (Figure 5). The dTB maps (Figure 6) in the northern part show that IR1 has similar values to IR2 and IR3 at 3.0, 7.8, and 19.35 GHz, while it is a bit lower than IR2 and IR3 at 37 GHz. Moreover, the difference of the TB performances between the IR1 in the northeastern part and the nearby Em3 is hard to identify in the nTB and dTB maps.
IR2 (~3.58 Ga) is in the northeast part of Mons Rümker between two IR1 patches, exhibiting lower TiO2 contents. As shown by Figure 4, the noon nTB at 3.0 GHz and 7.8 GHz is similarly as low as IR1, while it is similarly high as IR3 at 19.35 GHz and 37 GHz. Figure 5 shows that the nighttime nTB in IR2 is higher than IR1 at 3.0 GHz, 7.8 GHz, and 19.35 GHz but lower than the IR3 unit. At 37 GHz, the nTB in IR2 becomes similar to IR1 and IR3. The western part of IR2 has the lowest dTB over Mons Rümker only at 3.0 GHz, while the dTB in the remaining part of IR2 is as high as IR1 and IR3 (Figure 6).
IR3 (~3.51 Ga) occupies the main portion of Mons Rümker, and FeO and TiO2 abundances are higher than IR1 and IR2. The northern part of IR3 has low noon nTB as IR2 and IR3 at 3.0 GHz and the nTB in the southern part of IR3 is the highest in Mons Rümker (Figure 4). Figure 5 shows that the night nTB in IR3 is similar to IR1 and IR2 besides 3.0 GHz, while the nTB in the southern part of IR3 is still higher than the rest part of Mons Rümker. The dTB in the northern part of IR3 is similarly low as the western part of IR2 at 3.0 GHz, while the dTB difference among IR1, IR2, and IR3 is not clear at 7.8 GHz, 19.35 GHz, and 37 GHz (Figure 6).
The mean values of TB, nTB, and dTB of the Rümker plateau units are summarized in Table 3. Table 3 indicates that the mean noontime nTB is highest in IR3, followed by IR2 and IR1. This agrees with the numerical simulation as mentioned before, since the FeO and TiO2 contents are highest in the IR3 unit, followed by the IR2 and IR1 [1]. However, the nTB at night is difficult to understand, for the nTB in IR3 is still highest, followed by IR2 and IR1, which is opposite to the aforementioned numerical simulation. Additionally, the dTB in IR3 is highest, followed by IR2 and IR1 at 19.35 and 37 GHz; but the dTB in IR2 is lower than IR1 at 3.0 and 7.8 GHz.
Moreover, three issues about Mons Rümker should be mentioned.
(1)
The differences between IR1, IR2, and IR3 are rather slight compared to the mare basaltic units. We observed a relatively lower nTB in IR1 and a higher nTB in the southern part of IR3. Considering the large topographic fluctuation typical of Mons Rümker, the influence of the topography on TB should be taken into account. Here, the TB is enhanced in the southern part of IR3 for the surface slopes oriented to the solar illumination, and it is weakened in IR1 with the surface slopes opposite to the solar illumination. This implies that the elevated nTB in the south and the decreased nTB in the north are caused by the surface topography, for the effective solar illumination will be enhanced in the south and weakened in the north [29,46]. Additionally, the noon emissivity in Figure 7c also gives similar values in IR1, IR2, and IR3. This means that the low nTB in IR1 and the high nTB in the southern part of IR3 at noon are caused by the surface topography. The dTB maps effectively weaken the influence of the surface topography, which is better to describe the thermophysical features of the mare units. Thus, the similar dTB and noon emissivity values in IR1, IR2, and IR3 are likely to mean that the thermophysical features of the mare deposits in Mons Rümker are homogeneous.
(2)
A small patch centered at (58.5°W, 41.3°N) with rather low dTB at 3.0 GHz, including the aforementioned western part of IR2 and the northern part of IR3, should be noticed. The influence of the topography on the low-dTB anomaly can be excluded for the reason mentioned above. IR1 is in the slope opposite to the solar illumination and the dTB in IR1 is still higher than that in the patch. Thus, this low-dTB anomaly should be resulted from the thermophysical features of a special mare deposit. However, the anomaly is absent at the other three channels, indicating that this is a hidden construct on Mons Rümker.
(3)
We proposed that the nTB performances in Mons Rümker are abnormal. According to the numerical simulation, the mafic-rich deposit will have a higher TB at noon but a lower TB at night. However, the TB in IR3 is higher than IR1 no matter at noon or night. This means that the thermophysical features of the mare deposits in Mons Rümker are different from the Imbrian-aged and Eratosthenian-aged mare units, which should be interpreted to be an independent unit.

4.4. Other Units

Qian et al. [2] suggested that there also exists a highland unit and an Imbrian-aged dome unit in the study area, which is outlined and overlaid on the nTB and dTB maps. However, no special TB variations occur in these units.
This is mainly due to the low spatial resolution of the original CELMS data, which is about a degree per pixel. At such a scale, outcrops of the highland unit and the Imbrian-aged dome unit with small areas are not detected by the CELMS instrument. In addition, China’s CE-5 mission will not land on these units as the sampling sites.
Therefore, the thermophysical features of the two units are not discussed in this study.

5. Discussions

The generated nTB and dTB maps from CE-2 CELMS data give us a new view about the basaltic volcanism and sampling sites in Rümker region.

5.1. New Views of Geologic Units

The Rümker region, located in the anomalous Procellarum KREEP Terrane [5], is the site of volcanic activity of an extended duration (from Late Imbrian Period to Eratosthenian Period), forming an extensive mare basalt plain in the area [1,2,14,16]. Different authors have mapped the geological units in the Rümker region using different datasets, e.g., Clementine UVVIS data [14,16,23] and Kaguya MI data [1,2]. However, all of the previous studies rely on optical reflectance for subdividing geological units, which inevitably ignores the internal structure of a geological unit [26]. The CE-2 CELMS TB (Figure 3), nTB (Figure 4 and Figure 5), and dTB data (Figure 6) provide a new opportunity to gain insight into the geological units in the region, and these data and implications for the units are discussed below.
Firstly, the Im2 unit divided by Qian et al. [2] is confirmed by the nTB and dTB performances and its performances agree with the numerical simulation (Section 2).
Secondly, the majority of the Em4 unit has high noon nTB, low nighttime nTB, and high dTB values, agreeing well with its highest FeO and TiO2 abundances according to the numerical simulation (Section 2). However, the unit may extend southwestwardly on the basis of the similar nTB and dTB performances (Figure 4, Figure 5 and Figure 6); and its northern boundaries may extend more southwardly because the nTB at noon and dTB are lower than other places of the unit (Figure 5 and Figure 6). However, considering the poor spatial resolution and the large penetration ability of the CELMS data, we maintain the geological boundary outlined by Qian et al. [2].
Thirdly, the difference between Im1 and Em1 units is indistinguishable in the thermophysical data. The mean TB values and the change of the TB with time are nearly identical in the two units throughout the day (Figure 9). Additionally, the mean TiO2 (2.4 wt%) and FeO (16.8 wt%) abundances of Em1 are approximately the same as those of Im1 with TiO2 (2.4 wt%) and FeO (16.3 wt%) [2], and the emissivity in Im1 and Em1 is similar. Therefore, Im1 and Em1 can be combined into one thermophysical unit based on the above analysis. Because Im1 has clearly higher FeO and TiO2 abundances than Imbrian-aged Im2 and Im3, Im1 can be combined with Em1 in terms of their thermophysical properties.
Fourthly, the nTB of Em2 is distinctly different from the nearby Im1 and Em1 unit (lower at noon but higher at night). Notably, the nTB and dTB characteristics in Em2 are similar to Im2, which are apparently different from other units. The mean TB in Em2 indicates a similar behavior to Im2 as shown in Figure 10. It should be mentioned that the mean TB in Em2 is slightly higher than Im2 both in the daytime and at night, which probably could be explained by 1) the effective solar illumination in Em2 is higher than Im2 according to the numerical simulation [46,58,59], which makes the physical temperature in Em2 be higher than Im2; 2) the linear interpolation method to generate TB products (Figure 3, Figure 4, Figure 5 and Figure 6) will smooth the difference of the nearby regions (the relatively higher TB surrounding Em2 at noon will enhance the difference of the TB between Im2 and Em2; the relatively lower TB surrounding Em2 at night will decrease the difference of the TB between Im2 and Em2). The change of the mean TB with time is nearly identical between Em2 and Im2 (Figure 10), suggesting similar thermophysical feature of the mare deposits. Thus, Im2 and Em2 can be described as one single thermophysical unit according to their TB, nTB, and dTB behaviors; this similarity is further supported by their similar TiO2 (1.6 wt. %, Em2; 1.3 wt. %, Im2) and FeO abundances (16.2 wt. % Em2; 15.6 wt. %). Considered the lower FeO and TiO2 abundances in Em2 compared with Em1, Em3, and Em4, Em2 is combined with Im2.
Fifthly, the nTB in Mons Rümker is the third highest at noon as Em1 on the west, while it is the third highest at night as Em3 on the east. Such TB performances are opposite to the numerical simulation, indicating that this is a special geologic zone. However, the difference between the three Rümker plateau units (IR1, IR2, and IR3) is indistinguishable. Figure 11 is the change of TB with time in IR1, IR2, and IR3. Although the TB of IR1 in the northern part is lower than that of IR3 in the southern part, the change tendencies of the three units are similar (Figure 11), indicating similar thermophysical parameters. Meng et al. [30,44] suggested that the dTB values are slightly influenced by the surface topography, and the dTB is similar in the three units, particularly at 3.0, 19.35, and 37 GHz maps. In addition, IR1, IR2, and IR3 have similar emissivities (Figure 7). Thus, the IR1, IR2, and IR3 should be ascribed to a single thermophysical unit, named IR on the basis of the above analysis.
One more notable point is that there occurs a small patch centered at (58.5°W, 41.3°N) in Mons Rümker at 3.0 GHz dTB map as mentioned in Section 4.3, whose size is about 20 km × 50 km. The nTB and dTB at other channels are similar to its vicinity, indicating that this is a hidden terrain on Mons Rümker. We defined it as IRh unit.
Finally, the identification of Em3 is rather controversial, because Em3 has similar nTB and dTB behaviors to Em4 on the east and similar behaviors to Im1 and Em1 on the west. A small range in the eastern part with similar TB characteristics to Em4 is revealed by the 3.0 GHz nTB and dTB maps, with area becoming larger with the increasing frequency. This means that the regolith thermophysical parameters change greatly with depth in this unit. Interestingly, the emissivity in this unit is different from Em4 as seen in emissivity maps (Figure 7). In addition, Em3 has the relatively lower FeO and TiO2 abundances compared to Em4. Thus, we still maintain this unit in the new map. This unit is interpreted as a transition zone from the Ti-rich zone to Ti-poor zone.
Similar observations have also been made in Im3. The nTB at noon and the dTB in the northern part are lower than those in the southern part at 3.0 GHz, and the area with relatively lower nTB and dTB changes with frequency. The nTB and dTB in the northern part are similar to those in Im2, while the nTB and dTB in the southern part are similar to those in Im1 and Em1. This is another transition zone from the Ti-poor Im2 unit to Ti-rich Em1 unit. As shown by Figure 7, this unit has lower emissivity than Im2 but higher than Em4. Therefore, we maintain the unit distinction in the new map.
On the basis of the analysis described above, the mare basalt units in the CE-5 landing region have been combined into six units (IR, Im2, Im3, Em1, Em3, and Em4) and one hidden unit (IRh) using their thermophysical characteristics (Figure 12).
Therefore, the eruptive history of the Rümker region should be revisited. In previous studies, the correspondence between the age of the mare units and the FeO and TiO2 abundances is hard to understand [14,16]. Take the Eratosthenian-aged units for example, the mean noontime nTB is highest in Em4, followed by Em3, Em1, and Em2, and the mean nighttime nTB has an inverse sequence. These nTB performances agree well with the numerical simulation as shown in Figure 2 (Em1, Em2, Em3, and Em4 have 2.4, 1.6, 3.6, 6–7 wt. % TiO2 abundances and similar FeO abundances). However, this also means that the FeO and TiO2 abundances of the Eratosthenian-aged mare basalts decrease from Em1 (2.30 Ga) to Em2 (2.13 Ga), and then increase from Em2 (2.13 Ga) to Em4 (1.21 Ga). If Em2 is combined into Im2, the evolution of the FeO and TiO2 in the Eratosthenian-aged Em1, Em3, and Em4 will follow the Ti enrichment trends (younger mare deposits will have the higher FeO and TiO2 abundances) confirmed by Staid et al. [60], Zhang et al. [61], and Haruyama et al. [62]. Similar phenomena also exist in the Im1, Im2, and Im3 units.
In summary, we present a revised geological history of the Rümker region on the basis of the thermophysical data. The Im2 mare basalts are the oldest mare deposits (~3.39 Ga), which is extensively distributed in the whole Rümker region, including the subsurface underlying Em4 in the east of the landing region [2]. This can be verified by the typical craters centered at (53.0°W, 40.5°N) and (51.0°W, 41.0°N), where the mare deposit is interpreted as Im2 unit [2,14,16]. The volcanic activity of the Im2 era ended at about 3.39 Ga. Then, a smaller volume erupted at ~3.16 Ga, forming the Im3 mare basalts in the north of the landing region. Thereafter, extensive mare eruptions occur in the Em1 (~2.30 Ga), superposed on the Im2 unit in the southwest part of the Rümker region. Here, the Em2 unit mapped by Qian et al. [2] is likely the remanent of the Imbrian-aged Im2 mare basalts when Im1 erupted and covered the region. Thereafter, basaltic volcanism was active in the eastern part of the Rümker region (~1.21 Ga) forming the mare basalts there. Here, all the absolute model ages of the mare units are those estimated by Qian et al. [2] using CSFD measurements.
Moreover, such basaltic volcanism also means that the FeO and TiO2 abundances become higher in the younger mare deposits, which is essentially important to further study the thermal evolution of the Moon.

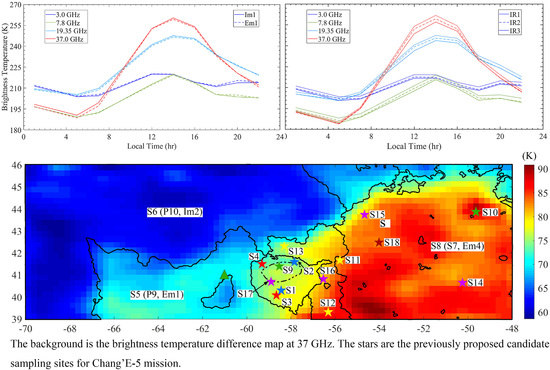
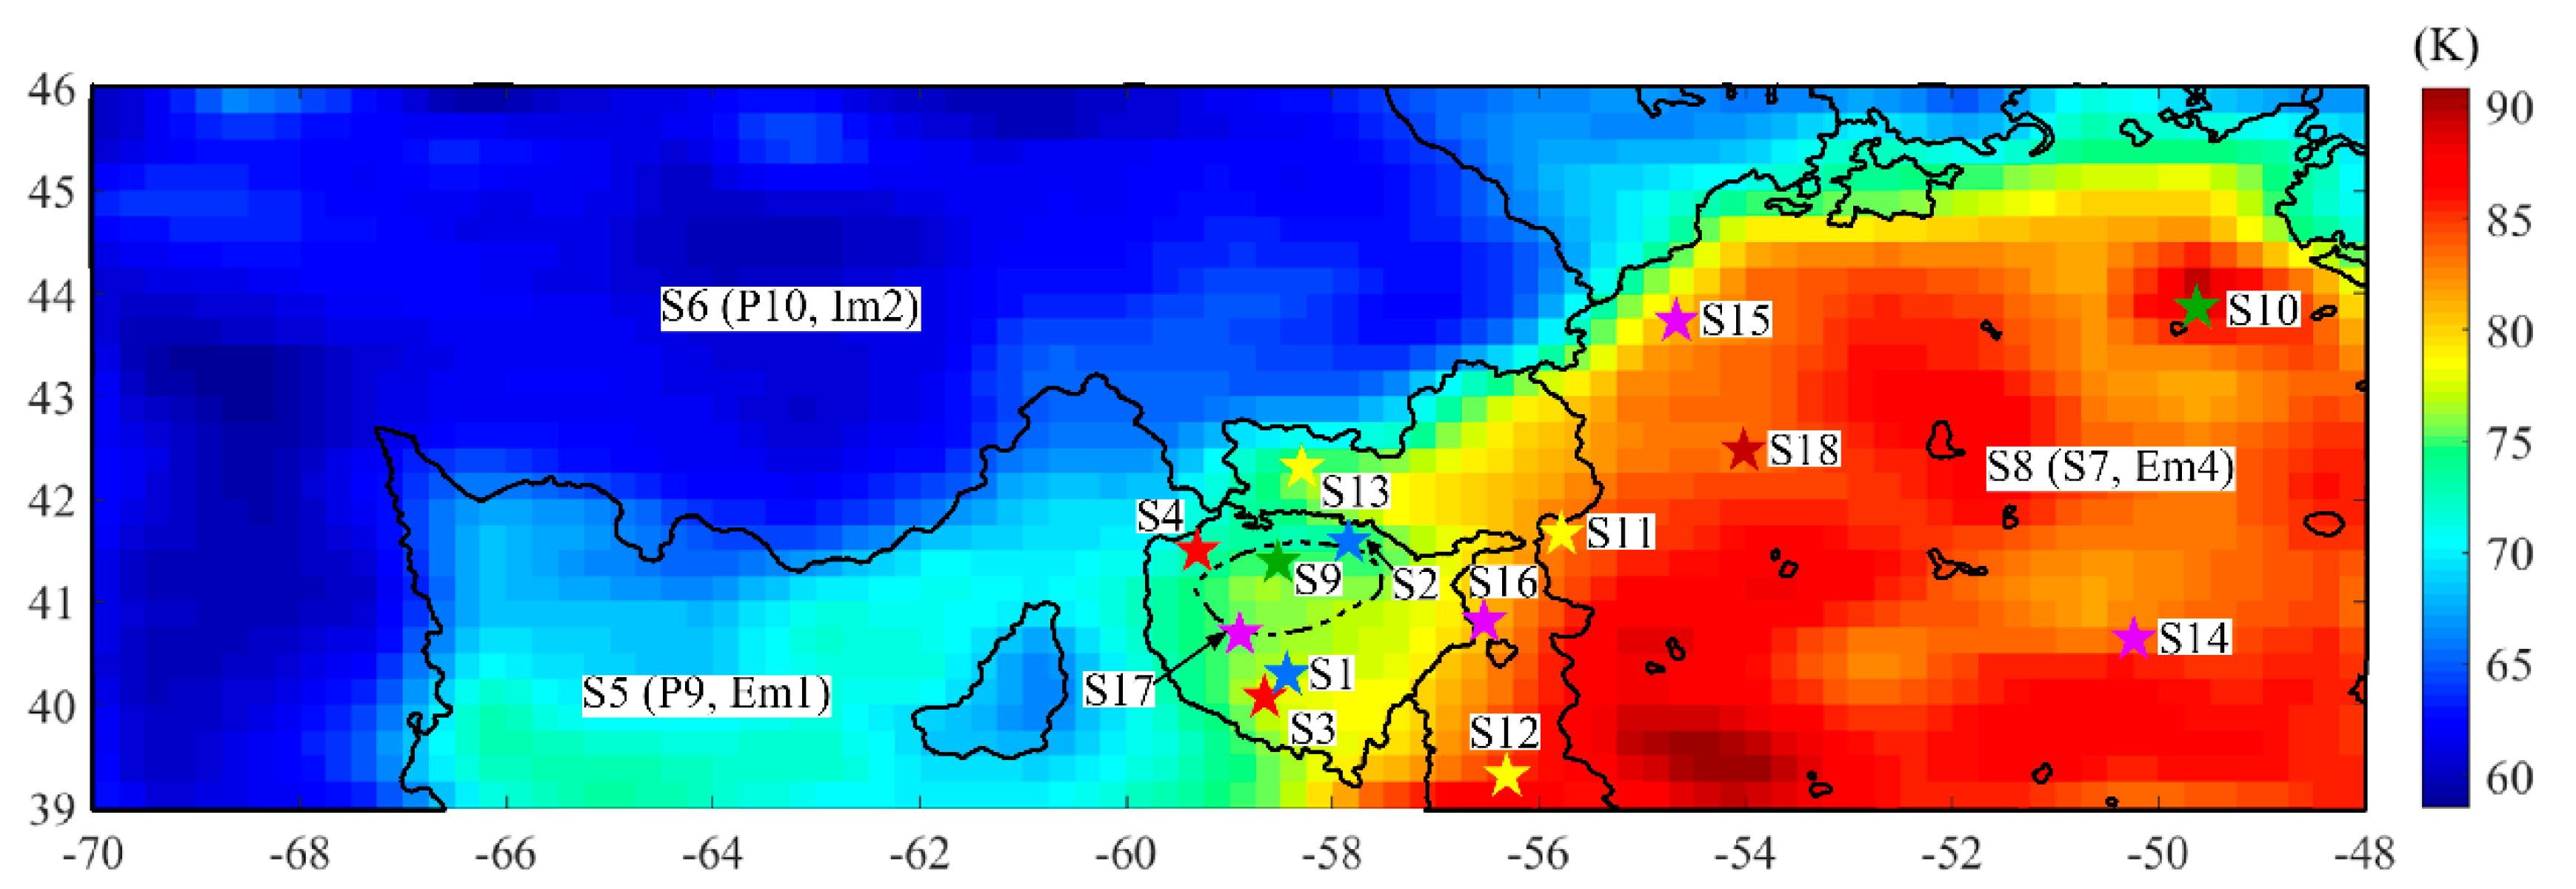
5.2. Scientifically Important Sampling Sites

The Chang’e-5 (CE-5) mission is China’s first lunar sample return mission, with a goal of returning samples from the Rümker region [4] (Figure 1). Detailed geological investigations of the area have been conducted recently by different researchers to assess its potential scientific value [1,2,22,26,27,63,64,65,66]. Within these analysis, 18 sampling sites or zones have been proposed and their scientific value evaluated [1,2,26,64,65,67] (Figure 13). The location and scientific value of the landing sites are summarized in Table 4.
In summary, the 18 sampling sites are proposed to answer the four following scientific questions.
(1) The samples from the young mare basalt (Em4) would provide new knowledges of (1) the geochemistry and mineralogy of its mantle source regions, (2) how the radioactive elements in Procellarum KREEP Terrane affects the generation of late-stage mare volcanism, (3) the late stage thermal evolution of the lunar interior, and (4) the impact chronology history of the Moon and the inner planets. Therefore, Em4 is always ranked as the first-priority sampling unit. Seven of the eighteen proposed landing sites are in Em4. Jolliff et al. [64], Ling et al. [63], and Qian et al. [2,27] suggested that sampling anywhere in the Em4 unit could return young mare materials and fulfill the desired scientific goals (Sites S7 and S8 in Table 4 and Figure 10), while Sites S10, S11, S14, S15, and S18 are provided by Ling et al. [63], Qian et al. [2], Giguere et al. [65], Chisenga et al. [29], and Xie et al. [26], respectively.
As shown by the dTB map at 37 GHz in Figure 13, the characteristics of the youngest mare deposit in Em4 are not homogeneous. Sites S11 and S15, located near the boundary of Em4, are homogeneous in the vertical direction according to the four-channel nTB and dTB maps. Sites S11 and S18 are located in a site with abnormally higher FeO and TiO2 abundances compared to the remaining areas in Em4. Site S14 is in a place with relatively thinner Em4 mare deposits, where the nTB and dTB maps indicate a distinctly different thermal behavior compared to its surroundings in Em4. The TB performances in Site S10 are interesting, and show the nearly highest noon nTB at 3.0 and 7.8 GHz, almost the lowest night nTB at 7.8, 19.35, and 37 GHz, and the highest dTB. Such TB behaviors are usually caused by high FeO and TiO2 abundances, but not supported by the compositional measurements in Figure 8, indicating that this is a special hidden structure.
(2) Mons Rümker is ranked as the second priority landing site, and six of the proposed eighteen landing sites are located in the unit, mainly proposed by Zhao et al. [1] and Qian et al. [2]. Generally, Sites S1, S2, S3, S4, and S17 are located in the new IR unit, while Site S9 is in the IRh unit which is thought to be a special hidden construct in this study. Due to the resolution limitation of the CELMS data, it is impossible to obtain the thermophysical properties of the proposed domes recommended by Zhao et al. [1].
(3) Em3 is ranked as the third priority landing site, which is mainly proposed by Ling et al. [63] and Giguere et al. [19], including Sites S12, S13, and S16. As mentioned in Section 4.2 and Section 5.1, the three sites are located in the transitional areas between the Ti-rich mare unit to the Ti-poor unit. Moreover, the nTB and dTB maps show that Site S12 likely belongs to Em4 at depth, while the regolith thermophysical features change greatly in Sites S13 and S16.
(4) Sites S5 (Em1 unit, referred to P9 unit by Hiesinger et al. [14]) and S6 (Im2 unit, referred to P10 unit by Hiesinger et al. [14]) are proposed by Ling et al. [63], and are located in the west part of the Rümker region.
Generally, according to the thermophysical features and their scientific potentials of the mare units, we proposed the following sites as the sampling candidates. Two sites are of judged to be of equal importance from the thermophyscial and scientific goals point of view (Table 4).
The first of these two highest priority sites is given to the Em4 unit proposed by Qian et al. [2], Giguere et al. [65], Chisenga et al. [29], and Xie et al. [26]. Here, Site S14 should be ranked as first, for it exists in a belt with relatively lower noon nTB and dTB values compared to the other place in Em4. The low-dTB belt indicates a strong correlation with Rima Sharp as shown in Figure 6d. Rima Sharp may be one of the magma sources of the Em4 mare basalts, which is currently under check by Qian et al. [27]. Besides, the density anomaly in this site was proposed as potential magma sources by Chisenga et al. [29]. Besides the scientific values mentioned in Table 4, the sampling study will give additional fundamental information about the basaltic evolution in the late stage of the Moon. Site S10 should be ranked as second in Em4, with the highest nTB at noon and the lowest nTB, indicating that there exists a hidden structure. Therefore, besides the scientific values mentioned by Qian et al. [2], the sampling deposits will indicate abundant information about the mare deposits covered by the impact ejecta. Therefore, the returned sample will provide opportunities to study the young mare basalts and the covered old basalts.
The second of these two highest priority sites is the Em1 unit, including Em1 and Im1 subdivided by Qian et al. [2]. The Rümker region has been thoroughly studied with multiple sources of optical data. The results all indicate that Em4 is the youngest mare unit and Im2 is almost the oldest mare deposit in this region. However, the ages of Im1 and Em1 are in debate. Hiesinger et al. [14] suggested an age of 3.47 Ga for the unit, while Qian et al. [2] proposed the age of 3.42 Ga for Im1 in the west and 2.30 for Em1 in the east. Moreover, there is a small region named Em2 by Qian et al. [2], which is not identified by Hiesinger et al. [14] but re-interpreted as Im2 according to the nTB and dTB characteristics. Therefore, we propose a landing site centered at (61°W, 41°N). Besides the scientific values mentioned by Ling et al. [63] and Giguere et al. [19], the sampling in this place will provide additional information about 1) to identify the ages of Im1, Em1, and Em2 interpreted by Qian et al. [27] and Hiesinger et al. [14], 2) to identify the relationship between Em1, Em2, Im1, and Im2 and then re-understand the basaltic volcanism in the Rümker region. The change of the FeO and TiO2 abundances with the age is a critical problem to study the thermal evolution of the Moon. However, the irregular change of the FeO and TiO2 abundances with age may be related to the existence of overturn in the lunar mantle. If the ages of the Em1, Em2, Im1, and Im2 can be accurately acquired through CE-5 sampling, a new view about the thermal evolution will be provided. Additionally, according to the studies by Xie et al. [26], there will exist the impact ejecta from IR, Im1, Em3, and Em4 units, which can fulfill the scientific values in Em4 proposed by other researchers.
The second priority is given to Site S9 in the northern part of Mons Rümker. The nTB and dTB characteristics show that the mare deposits in Mons Rümker are different from the nearby units. Besides the scientific goals mentioned by Zhao et al. [1,67], Qian et al. [2], and Chisenga et al. [29], the sampling in this location could help resolve the nature and origin of the hidden construct and the thermophysically similar distinctive mare deposits also found in Mare Moscoviense, Mare Nubium, and the Apollo basin [30,33,51].

6. Conclusions

In this study, the CELMS data from the CE-2 spacecraft is employed to study the thermophysical characteristics, properties, and distinctive features of the Rümker region. The main results are as follows.
(1)
In this analysis, we generated and combined (a) the TB, nTB, and dTB maps derived from the CE-2 CELMS data; (b) the emissivity maps derived by using LRO Diviner data, and (c) the simulated surface temperatures generated. On the basis of these data, the thermophysical properties of the previously mapped geological units are evaluated.
(2)
According to the nTB and dTB behavior and the emissivity features, the ten mare units interpreted by Qian et al. [27] can be reclassified into 7 units including a hidden construct named IRh on Mons Rümker.
(3)
The 18 CE-5 candidate sampling sites proposed by previous researchers are evaluated using the nTB, dTB, and emissivity performances. Finally, on the basis of their thermophysical properties, four candidate landing sites are suggested for the CE-5 mission. Both the Em4 and Em1 units would potentially provide the highest scientific return, followed by the IRh unit.

Author Contributions

Conceptualization, Z.M.; methodology, Z.M. and Y.Q.; software, J.L. and W.C.; validation, L.X. and J.W.H.; formal analysis, Z.M. and J.S.; investigation, Z.M. and J.P.; resources, Z.M. and S.C.; data curation, J.S. and J.L.; writing original draft preparation, Z.M.; writing review and editing, Y.Q., L.X., and J.W.H.; visualization, Z.M. and J.P.; supervision, S.C. and Z.K.; project administration, Z.M.; funding acquisition, S.C. and W.C. All authors have read and agreed to the published version of the manuscript.

Funding

This work was supported by the B-type Strategic Priority Research Program of Chinese Academy of Sciences (No. XDB41000000), the National Natural Science Foundation of China (No. 42071309, 41772346, 41372337, 41802246), a grant from State Key Laboratory of Resources and Environmental Information System, and the National Key R & D Program of China (No. 2016YFC0600501).

Acknowledgments

The authors express their thanks to the people helping with this work, and acknowledge the valuable suggestions from the peer reviewers. In this study, the CELMS data were downloaded from http://moon.bao.ac.cn/, the Kaguya MI data were downloaded from http://darts.isas.jaxa.jp/planet/pdap/selene/. We are grateful for allowing us to use their data.

Conflicts of Interest

The authors declare no conflict of interest regarding the publication of this paper.

References

  1. Zhao, J.; Xiao, L.; Qiao, L.; Glotch, T.D.; Huang, Q. The Mons Rümker volcanic complex of the Moon: A candidate landing site for the Chang’E-5 mission. J. Geophys. Res. Planets 2017, 122, 1419–1442. [Google Scholar] [CrossRef]
  2. Qian, Y.Q.; Xiao, L.; Zhao, S.Y.; Zhao, J.; Huang, J.; Flahaut, J.; Martinot, M.; Head, J.W.; Hiesinger, H.; Wang, G.X. Geology and Scientific Significance of the Rümker Region in Northern Oceanus Procellarum: China’s Chang’E-5 Landing Region. J. Geophys. Res. Planets 2018, 123, 1407–1430. [Google Scholar] [CrossRef] [Green Version]
  3. Pei, Z.; Wang, Q.; Tian, Y. Technology roadmap for Chang’E Program. J. Deep Space Explor. 2015, 2, 99–110. [Google Scholar]
  4. Li, C.; Wang, C.; Wei, Y.; Lin, Y. China’s present and future lunar exploration program. Science 2019, 365, 238–239. [Google Scholar] [CrossRef]
  5. Jolliff, B.L.; Gillis, J.J.; Haskin, L.A.; Korotev, R.L.; Wieczorek, M.A. Major lunar crustal terranes: Surface expressions and crust-mantle origins. J. Geophys. Res. Space Phys. 2000, 105, 4197–4216. [Google Scholar] [CrossRef] [Green Version]
  6. Kring, D.A.; Durda, D. A Global Lunar Landing Site Study to Provide the Scientific Context for Exploration of the Moon; Lunar and Planetary Institute: Houston, TX, USA, 2012. [Google Scholar]
  7. Committee on the Scientific Context for Exploration of the Moon; Board, S.S. Division on Engineering and Physical Sciences; National Research Council the Scientific Context for Exploration of the Moon. In The Scientific Context for Exploration of the Moon; The National Academies Press: Washington, DC, USA, 2007. [Google Scholar] [CrossRef]
  8. Prettyman, T.H.; Hagerty, J.J.; Elphic, R.C.; Feldman, W.C.; Lawrence, D.J.; McKinney, G.W.; Vaniman, D.T. Elemental composition of the lunar surface: Analysis of gamma ray spectroscopy data from Lunar Prospector. J. Geophys. Res. Space Phys. 2006, 111. [Google Scholar] [CrossRef]
  9. Wieczorek, M.A.; Neumann, G.A.; Nimmo, F.; Kiefer, W.S.; Taylor, G.J.; Melosh, H.J.; Phillips, R.J.; Solomon, S.C.; Andrews-Hanna, J.C.; Asmar, S.W.; et al. The Crust of the Moon as Seen by GRAIL. Science 2012, 339, 671–675. [Google Scholar] [CrossRef]
  10. Head, J.W.; Wilson, L. Generation, ascent and eruption of magma on the Moon: New insights into source depths, magma supply, intrusions and effusive/explosive eruptions (Part 2: Predicted emplacement processes and observations). Icarus 2017, 283, 176–223. [Google Scholar] [CrossRef] [Green Version]
  11. Wilson, L.; Head, J.W. Generation, ascent and eruption of magma on the Moon: New insights into source depths, magma supply, intrusions and effusive/explosive eruptions (Part 1: Theory). Icarus 2017, 283, 146–175. [Google Scholar] [CrossRef] [Green Version]
  12. Wieczorek, M.A.; Phillips, R.J. The “Procellarum KREEP Terrane”: Implications for mare volcanism and lunar evolution. J. Geophys. Res. Planets 2000, 105, 20417–20430. [Google Scholar] [CrossRef]
  13. Ziethe, R.; Seiferlin, K.; Hiesinger, H. Duration and extent of lunar volcanism: Comparison of 3D convection models to mare basalt ages. Planet. Space Sci. 2009, 57, 784–796. [Google Scholar] [CrossRef]
  14. Hiesinger, H.; Head, J.; Wolf, U.; Jaumann, R.; Neukum, G. Ages and stratigraphy of lunar mare basalts: A synthesis. Recent Adv. Curr. Res. Issues Lunar Stratigr. 2011, 477, 1–51. [Google Scholar]
  15. Morota, T.; Haruyama, J.; Ohtake, M.; Matsunaga, T.; Honda, C.; Yokota, Y.; Kimura, J.; Ogawa, Y.; Hirata, N.; Demura, H.; et al. Timing and characteristics of the latest mare eruption on the Moon. Earth Planet. Sci. Lett. 2011, 302, 255–266. [Google Scholar] [CrossRef]
  16. Hiesinger, H.; Head, J.W.; Wolf, U.; Jaumann, R.; Neukum, G. Ages and stratigraphy of mare basalts in Oceanus Procellarum, Mare Nubium, Mare Cognitum, and Mare Insularum. J. Geophys. Res. Planets 2003, 108. [Google Scholar] [CrossRef] [Green Version]
  17. Glotch, T.D.; Hagerty, J.J.; Lucey, P.; Hawke, B.R.; Giguere, T.A.; Arnold, J.A.; Williams, J.-P.; Jolliff, B.L.; Paige, D.A. The Mairan domes: Silicic volcanic constructs on the Moon. Geophys. Res. Lett. 2011, 38. [Google Scholar] [CrossRef] [Green Version]
  18. Hurwitz, D.M.; Head, J.W.; Wilson, L.; Hiesinger, H. Origin of lunar sinuous rilles: Modeling effects of gravity, surface slope, and lava composition on erosion rates during the formation of Rima Prinz. J. Geophys. Res. Planets 2012, 117. [Google Scholar] [CrossRef] [Green Version]
  19. Giguere, T.; Boyce, J.; Gillis-Davis, J.; Stopar, J. Lava Flows in Northeastern Oceanus Procellarum: Morphology, Composition, and Ages. In Proceedings of the 51st Lunar and Planetary Science Conference, Woodlands, TX, USA, 16–20 March 2020. Abstract 2356. [Google Scholar]
  20. Jia, M.; Yue, Z.; Di, K.; Liu, B.; Liu, J.; Michael, G. A catalogue of impact craters larger than 200 m and surface age analysis in the Chang’e-5 landing area. Earth Planet. Sci. Lett. 2020, 541. [Google Scholar] [CrossRef]
  21. Qian, Y.; Xiao, L.; Head, J. The Young Mare Basalts in Chang’E 5 Mission Landing Region, Northern Oceanus Procellarum. In Proceedings of the 51st Lunar and Planetary Science Conference, Woodlands, TX, USA, 16–20 March 2020. Abstract 1459. [Google Scholar]
  22. Wu, B.; Huang, J.; Li, Y.; Wang, Y.; Peng, J. Rock Abundance and Crater Density in the Candidate Chang’E-5 Landing Region on the Moon. J. Geophys. Res. Planets 2018, 123, 3256–3272. [Google Scholar] [CrossRef]
  23. Boroughs, L.L.; Spudis, P.D. The stratigraphy of lava flows in northern Oceanus Procellarum, Moon. In Proceedings of the 32nd Annual Lunar and Planetary Science Conference, Houston, TX, USA, 12–16 March 2001. Abstract 1192. [Google Scholar]
  24. Zhang, G.; Li, C.; Liu, D.; Liu, B.; Zhou, Q.; Gao, F.; Zhang, H.; Kong, D.; Ren, X. Storage, Processing, and Preparation Methods for China’s Returned Lunar Samples. In Proceedings of the 51st Lunar and Planetary Science Conference, Woodlands, TX, USA, 16–20 March 2020. Abstract 1394. [Google Scholar]
  25. Campbell, B.A.; Hawke, B.R.; Campbell, D.B. Surface morphology of domes in the Marius Hills and Mons Rümker regions of the Moon from Earth-based radar data. J. Geophys. Res. Planets 2009, 114. [Google Scholar] [CrossRef] [Green Version]
  26. Xie, M.; Xiao, Z.; Zhang, X.; Xu, A.-A. The Provenance of Regolith at the Chang’e-5 Candidate Landing Region. J. Geophys. Res. Planets 2020, 125. [Google Scholar] [CrossRef]
  27. Qian, Y.; Xiao, L.; Yin, S.; Zhang, M.; Zhao, S.; Pang, Y.; Wang, J.; Wang, G.; Head, J.W. The regolith properties of the Chang’e-5 landing region and the ground drilling experiments using lunar regolith simulants. Icarus 2020, 337. [Google Scholar] [CrossRef]
  28. Yue, Z.; Di, K.; Liu, Z.; Michael, G.; Jia, M.; Xin, X.; Liu, B.; Peng, M.; Liu, J. Lunar regolith thickness deduced from concentric craters in the CE-5 landing area. Icarus 2019, 329, 46–54. [Google Scholar] [CrossRef]
  29. Chisenga, C.; Yan, J.; Zhao, J.; Atekwana, E.A.; Steffen, R. Density Structure of the Rümker Region in the Northern Oceanus Procellarum: Implications for Lunar Volcanism and Landing Site Selection for the Chang’E-5 Mission. J. Geophys. Res. Planets 2020, 125. [Google Scholar] [CrossRef]
  30. Meng, Z.; Chen, S.; Wang, Y.; Wang, T.; Cai, Z.; Zhang, Y.; Zheng, Y.-C.; Hu, S. Reevaluating Mare Moscoviense And Its Vicinity Using Chang’e-2 Microwave Sounder Data. Remote. Sens. 2020, 12, 535. [Google Scholar] [CrossRef] [Green Version]
  31. Campbell, B.A.; Carter, L.M.; Hawke, B.R.; Campbell, D.B.; Ghent, R.R. Volcanic and impact deposits of the Moon’s Aristarchus Plateau: A new view from Earth-based radar images. Geology 2008, 36, 135–138. [Google Scholar] [CrossRef]
  32. Meng, Z.; Hu, S.; Wang, T.; Li, C.; Cai, Z.; Ping, J. Passive Microwave Probing Mare Basalts in Mare Imbrium Using CE-2 CELMS Data. IEEE J. Sel. Top. Appl. Earth Obs. Remote. Sens. 2018, 11, 3097–3104. [Google Scholar] [CrossRef]
  33. Meng, Z.; Wang, Y.; Chen, S.; Zheng, Y.-C.; Shi, J.; Wang, T.; Zhang, Y.; Ping, J.; Hou, L. MTE Features of Apollo Basin and Its Significance in Understanding the SPA Basin. IEEE J. Sel. Top. Appl. Earth Obs. Remote. Sens. 2019, 12, 2575–2583. [Google Scholar] [CrossRef]
  34. Liu, C.; Sun, H.-Y.; Meng, Z.-G.; Zheng, Y.-C.; Lu, Y.; Cai, Z.-C.; Ping, J.-S.; Gusev, A.; Hu, S. Retrieving volume FeO and TiO2 abundances of lunar regolith with CE-2 CELMS data using BPNN method. Res. Astron. Astrophys. 2019, 19, 066. [Google Scholar] [CrossRef]
  35. Zheng, Y.-C.; Chan, K.L.; Tsang, K.T.; Zhu, Y.-C.; Hu, G.P.; Blewett, D.T.; Neish, C. Analysis of Chang’E-2 brightness temperature data and production of high spatial resolution microwave maps of the Moon. Icarus 2019, 319, 627–644. [Google Scholar] [CrossRef]
  36. Hagfors, T. Microwave Studies of Thermal Emission from the Moon. In Advances in Astronomy and Astrophysics; Elsevier BV: Amsterdam, The Netherlands, 1971; Volume 8, pp. 1–28. [Google Scholar]
  37. Keihm, S.J. Effects of subsurface volume scattering on the lunar microwave brightness temperature spectrum. Icarus 1982, 52, 570–584. [Google Scholar] [CrossRef]
  38. Keihm, S.J. Interpretation of the lunar microwave brightness temperature spectrum: Feasibility of orbital heat flow mapping. Icarus 1984, 60, 568–589. [Google Scholar] [CrossRef]
  39. Jin, Y.; Yan, F.; Liang, Z. Simulation for remote sensing of the lunar soil and rock by using multi-channels microwave radiometers. Chin. J. Radio Sci. 2003, 18, 477–486. [Google Scholar]
  40. Wang, Z.; Li, Y.; Jiang, J.; Li, D. Lunar surface dielectric constant, regolith thickness, and 3He abundance distributions retrieved from the microwave brightness temperatures of CE-1 Lunar Microwave Sounder. Sci. China Earth Sci. 2010, 53, 1365–1378. [Google Scholar] [CrossRef]
  41. Meng, Z.; Zhang, J.; Cai, Z.; Ping, J.; Tang, Z.-S. Microwave Thermal Emission Features of Mare Orientale Revealed by CELMS Data. IEEE J. Sel. Top. Appl. Earth Obs. Remote. Sens. 2017, 10, 2991–2998. [Google Scholar] [CrossRef]
  42. Meng, Z.; Yang, G.; Ping, J.; Cai, Z.; Gusev, A.; Osei, E.M. Influence of (FeO+TiO2) abundance on the microwave thermal emissions of lunar regolith. Sci. China Earth Sci. 2016, 59, 1498–1507. [Google Scholar] [CrossRef]
  43. Heiken, G.H.; Vaniman, D.T.; French, B.M. Lunar Sourcebook, a User’s Guide to the Moon; Cambridge University Press: Cambridge, UK, 1991. [Google Scholar]
  44. Meng, Z.; Wang, Q.; Wang, H.; Wang, T.; Cai, Z. Potential Geologic Significances of Hertzsprung Basin Revealed by CE-2 CELMS Data. IEEE J. Sel. Top. Appl. Earth Obs. Remote. Sens. 2018, 11, 3713–3720. [Google Scholar] [CrossRef]
  45. Williams, J.-P.; Paige, D.; Greenhagen, B.T.; Sefton-Nash, E. The global surface temperatures of the Moon as measured by the Diviner Lunar Radiometer Experiment. Icarus 2017, 283, 300–325. [Google Scholar] [CrossRef] [Green Version]
  46. Zhiguo, M.; Yi, X.; Zhanchuan, C.; Shengbo, C.; Yi, L.; Hang, H. Influence of lunar topography on simulated surface temperature. Adv. Space Res. 2014, 54, 2131–2139. [Google Scholar] [CrossRef]
  47. Otake, H.; Ohtake, M.; Hirata, N. Lunar iron and titanium abundance algorithms based on SELENE (Kaguya) Multiband Imager data. In Proceedings of the 43rd Lunar and Planetary Science Conference, Woodlands, TX, USA, 19–23 March 2012. Abstract 1905. [Google Scholar]
  48. Cai, Z.; Lan, T. Lunar Brightness Temperature Model Based on the Microwave Radiometer Data of Chang’e-2. IEEE Trans. Geosci. Remote. Sens. 2017, 55, 5944–5955. [Google Scholar] [CrossRef]
  49. Zheng, Y.-C.; Tsang, K.; Chan, K.; Zou, Y.; Zhang, F.; Ouyang, Z.; Zheng, Y.-C. First microwave map of the Moon with Chang’E-1 data: The role of local time in global imaging. Icarus 2012, 219, 194–210. [Google Scholar] [CrossRef]
  50. Chan, K.L.; Tsang, K.T.; Kong, B.; Zheng, Y.-C. Lunar regolith thermal behavior revealed by Chang’E-doi:10.1109/tgrs.2017.27180271 microwave brightness temperature data. Earth Planet. Sci. Lett. 2010, 295, 287–291. [Google Scholar] [CrossRef]
  51. Meng, Z.; Chen, S.; Zheng, Y.; Cheng, W.; Zhu, Y.; Cai, Z.; Zhang, Y.; Cao, W.; Hou, L. Mare Deposits Identification and Feature Analysis in Mare Australe Based On CE-2 CELMS Data. J. Geophys. Res. Planets 2020. [Google Scholar] [CrossRef]
  52. Hu, G.-P.; Chan, K.L.; Zheng, Y.-C.; Xu, A.-A. A Rock Model for the Cold and Hot Spots in the Chang’E Microwave Brightness Temperature Map. IEEE Trans. Geosci. Remote. Sens. 2018, 56, 5471–5480. [Google Scholar] [CrossRef]
  53. Meng, Z.; Wang, H.H.; Zheng, Y.-C.; Wang, Y.; Miyamoto, H.; Cai, Z.C.; Ping, J.S.; Zhu, Y.Z. Several Geological Issues of Schrödinger Basin Exposed by CE-2 CELMS Data. Adv. Astron. 2019, 2019, 3926082. [Google Scholar] [CrossRef]
  54. Jiang, J.; Wang, Z.; Zhang, X.; Zhang, D.; Li, Y.; Lei, L.; Zhang, W.; Cui, H.; Guo, W.; Li, D. China probe CE-1 unveils world first moon-globe microwave emission map: The microwave moon some exploration results of Chang’E-1 microwave sounder. Remote Sens. Technol. Appl. 2009, 24, 409–422. [Google Scholar]
  55. Zhu, Y.; Zheng, Y.; Fang, S.; Zou, Y.; Pearson, S. Analysis of the brightness temperature features of the lunar surface using 37 GHz channel data from the Chang’E-2 microwave radiometer. Adv. Space Res. 2019, 63, 750–765. [Google Scholar] [CrossRef]
  56. Meng, Z.; Chen, S.; Wang, Y.; Cheng, W.; Jin, S.; Cai, Z.; Hu, S. Complex Mare Deposits Revealed by CE-2 CELMS Data in Mare Nubium. IEEE J. Sel. Top. Appl. Earth Obs. Remote. Sens. 2020, 13, 2475–2484. [Google Scholar] [CrossRef]
  57. Stöffler, D.; Ryder, G. Stratigraphy and Isotope Ages of Lunar Geologic Units: Chronological Standard for the Inner Solar System. Space Sci. Rev. 2001, 96, 9–54. [Google Scholar] [CrossRef]
  58. Hao, W.; Zhu, C.; Li, F.; Yan, J.; Ye, M.; Barriot, J.-P. Illumination and communication conditions at the Mons Rümker region based on the improved Lunar Orbiter Laser Altimeter data. Planet. Space Sci. 2019, 168, 73–82. [Google Scholar] [CrossRef]
  59. Zhong, Z.; Yan, J.; Xiao, Z. Lunar Regolith Temperature Variation in the Rümker Region Based on the Real-Time Illumination. Remote. Sens. 2020, 12, 731. [Google Scholar] [CrossRef] [Green Version]
  60. Staid, M.I.; Pieters, C.M.; Besse, S.; Boardman, J.; Dhingra, D.; Green, R.; Head, J.W.; Isaacson, P.; Klima, R.; Kramer, G.; et al. The mineralogy of late stage lunar volcanism as observed by the Moon Mineralogy Mapper on Chandrayaan-1. J. Geophys. Res. Planets 2011, 116. [Google Scholar] [CrossRef]
  61. Zhang, X.-Y.; Ouyang, Z.-Y.; Zhang, X.-M.; Chen, Y.; Tang, X.; Xu, A.-A.; Tang, Z.-S.; Wu, Y. Study of the continuum removal method for the Moon Mineralogy Mapper (M3) and its application to Mare Humorum and Mare Nubium. Res. Astron. Astrophys. 2016, 16, 115. [Google Scholar] [CrossRef]
  62. Ohtake, M.; Matsunaga, T.; Haruyama, J.; Yokota, Y.; Morota, T.; Honda, C.; Ogawa, Y.; Torii, M.; Miyamoto, H.; Arai, T.; et al. The global distribution of pure anorthosite on the Moon. Nature 2009, 461, 236–240. [Google Scholar] [CrossRef] [PubMed]
  63. Ling, Z.; Liu, C.; Jolliff, B.; Zhang, J.; Li, B.; Sun, L.; Chen, J.; Liu, J. Spectral and Mineralogical Analysis of Chang’e-5 Candidate Landing Site in Northern Oceanus Procellarum. In Proceedings of the 48th Lunar and Planetary Science Conference, Woodlands, TX, USA, 20–24 March 2017. Abstract 2079. [Google Scholar]
  64. Jolliff, B.; Wang, A.; Ling, Z.; Zhang, J. Scientific context and objectives for Chang’E-4 and Chang’E-5 missions. In Proceedings of the 3rd Beijing International Forum on Lunar and Deep-Space Exploration, Beijing, China, 19–22 September 2017. [Google Scholar]
  65. Giguere, T.; Gillis-Davis, J.; Trang, D.; Jolliff, B. Analysis of the Rumker Hills Region: Chang’e 5 Landing Site Assessment. In Proceedings of the 49th Lunar and Planetary Science Conference, Woodlands, TX, USA, 19–23 March 2018. Abstract 2844. [Google Scholar]
  66. Michael, G.; Yue, Z.; Gou, S.; Di, K. Dating Individual Several-km Lunar Impact Craters from the Rim Annulus in Region of Planned Chang’E-5 Landing. In Proceedings of the 50th Lunar and Planetary Science Conference, Woodlands, TX, USA, 18–22 March 2019. Abstract 2837. [Google Scholar]
  67. Zhao, J.; Xiao, L.; Qiao, L. The Mons Rümker Volcanic Complex of the Moon: A Candidate Landing Site for Chang’e-5 Mission. In Proceedings of the 47th Lunar and Planetary Science Conference, Woodlands, TX, USA, 21–25 March 2016. Abstract 1758. [Google Scholar]
Figure 1. (A) CE-5 landing region in northern Oceanus Procellarum. Mons Rümker is a huge volcanic complex in the south of the CE-5 landing region. The basemap is a Kaguya TC Morning Map. (B) The geological units are summarized by Qian et al. [2]. IR1, IR2, and IR3 are Rümker plateau units; Im1, Im2, and Im3 are Imbrian-aged low-Ti mare basalts; Em1, Em2, Em3, and Em4 are Eratosthenian-aged high-Ti mare basalts.
Remotesensing 12 03272 g001
Figure 2. The relation between simulated TB with FTA at noon and night.
Remotesensing 12 03272 g002
Figure 3. TB maps of the Rümker region at 37 GHz. (a) noon and (b) night.
Remotesensing 12 03272 g003aRemotesensing 12 03272 g003b
Figure 4. Normalized TB maps at noon: (a) 3.0 GHz, (b) 7.8 GHz, (c) 19.35 GHz, and (d) 37.0 GHz. The black lines denote the geologic boundaries of Qian et al. [2].
Remotesensing 12 03272 g004
Figure 5. Normalized TB maps at night: (a) 3.0 GHz, (b) 7.8 GHz, (c) 19.35 GHz, and (d) 37.0 GHz. The black lines denote the geologic boundaries of Qian et al. [2].
Remotesensing 12 03272 g005
Figure 6. dTB Map of the Rümker region. (a) 3.0 GHz, (b) 7.8 GHz, (c) 19.35 GHz, and (d) 37.0 GHz. The black lines denote the geologic boundaries of Qian et al. [2]. The dashed line at Figure 6d indicates Rima Sharp, the longest sinuous rille on the Moon [18].
Remotesensing 12 03272 g006
Figure 7. (a) LRO Diviner surface temperature product, (b) nighttime emissivity, and (c) noon emissivity maps of the Rümker region. The black lines denote the geologic boundaries of Qian et al. [2].
Remotesensing 12 03272 g007
Figure 8. FeO (a) and TiO2 (b) abundances of the Rümker region.
Remotesensing 12 03272 g008
Figure 9. Change of TB with time in the Im1 and Em1 units. The data point is at 1 a.m., 5 a.m., 7 a.m., 12 p.m., 2 p.m., 4 p.m., 6 p.m., 8 p.m., and 10 p.m.
Remotesensing 12 03272 g009
Figure 10. Change of mean TB with time in the Im2 and Em2 units. The data point is at 1 a.m., 5 a.m., 7 a.m., 12 p.m., 2 p.m., 4 p.m., 6 p.m., 8 p.m., and 10 p.m.
Remotesensing 12 03272 g010
Figure 11. Change of mean TB with time in IR1, IR2, and IR3 units. The data point is at 1 a.m., 5 a.m., 7 a.m., 12 p.m., 2 p.m., 4 p.m., 6 p.m., 8 p.m., and 10 p.m.
Remotesensing 12 03272 g011
Figure 12. Geological units of the Rümker region. The basemap is the dTB at 37 GHz.
Remotesensing 12 03272 g012
Figure 13. Proposed sampling sites in the Rümker region. The background is the dTB map at 37 GHz, the black lines outline the updated geological units combined on the basis of the CELMS data. Suggested sampling sites are marked by blue stars [67], red stars [1], green stars [2], yellow stars [65], purple stars [29], and brown stars [26]. Additionally, Site S5 was proposed by Ling et al. [63], and S8 was proposed by Ling et al. [63], Jolliff et al. [64], Qian et al. [2,27], and Xie et al. [26].
Remotesensing 12 03272 g013
Table 1. The mean TB, nTB, and dTB values of the Im1, Im2, and Im3 units.
Channel
(GHz)
UnitsTB (K)dTB (K)nTB
NightNoonNightNoon
3.0Im1203.8219.816.01.00701.0262
Im2199.6213.814.21.00821.0178
Im3197.5212.915.41.00521.0223
7.8Im1189.3220.030.71.00701.0412
Im2185.0212.227.31.00961.0272
Im3181.4212.030.51.00231.0365
19.35Im1205.4247.642.21.01611.0286
Im2203.2238.435.11.02301.0102
Im3199.0239.340.41.00971.0235
37.0Im1190.6260.369.71.02831.0162
Im2189.4250.260.81.03930.9972
Im3184.4252.167.71.01951.0140
Table 2. The mean TB, nTB, and dTB values of the Em1, Em2, Em3, and Em4 units.
Channel
(GHz)
UnitsTB (K)dTB (K)nTB
NightNoonNightNoon
3.0Em1204.28219.9915.711.00701.0256
Em2204.18219.5615.381.00771.0248
Em3200.22217.7417.521.00011.0272
Em4199.83219.4119.580.99981.0366
7.8Em1189.16219.3130.151.00451.0362
Em2189.29218.5129.221.00661.0338
Em3183.67219.6836.010.99051.0523
Em4182.50222.5940.090.98611.0680
19.35Em1204.59246.5441.951.01111.0230
Em2205.71245.3839.671.01761.0193
Em3199.16248.4849.3170.99461.0435
Em4196.95252.6255.670.98481.0625
37.0Em1188.59259.2670.671.01671.0108
Em2190.82257.4466.621.02971.0049
Em3183.30262.2578.950.99801.0354
Em4180.73266.0585.320.98531.0520
Table 3. The mean TB, nTB, and dTB values of the IR1, IR2, and IR3 units.
Channel
(GHz)
UnitsTB (K)dTB (K)nTB
NightNoonNightNoon
3.0IR1200.70216.7016.000.99871.0188
IR2202.11217.3615.251.00421.0206
IR3203.44219.4916.051.00561.0244
7.8IR1184.70215.6030.900.99161.0287
IR2186.33216.6530.320.99861.0321
IR3188.00218.9730.971.00201.0376
19.35IR1200.60243.7443.140.99881.0202
IR2201.19245.5044.311.00061.0262
IR3202.53247.4344.901.00311.0293
37.0IR1183.87257.0473.170.99821.0112
IR2184.25259.3475.090.99921.0188
IR3185.21261.7676.551.00051.0232
Table 4. Proposed sampling site in the Rümker region.
SpotsLocationUnitScientific Value
S1(58.45°W, 40.33°N) Z1IR1. Provide information on the formation of lunar domes
2. Improve CSFD dating method
S2(57.85°W, 41.61°N) Z1IR1. Help us analyze the evolutionary history of Mons Rümker
2. Shed light on the age of some large impact events on the Moon
S3(58.66°W, 40.11°N) Z2IR1. Study the origin of lunar domes
2. Constrain the duration of Mons Rümker volcanism
3. Improve CSFD dating method
S4(59.31°W, 41.52°N) Z2IR1. Study the origin of lineated terrain
2. Check if pyroclastic materials exist
3. Determine the age of large impact events on the Moon
4. Improve CSFD dating method
S5(P9) LEm1/Im21. Help us evaluate the compositional properties of the young and old basaltic units
2. Be especially critical for evaluation of the lunar impact crater statistics and planetary remotely sensed chronology
S6(P10) LIm21. Help us evaluate the compositional properties of the young and old basaltic units
2. Be especially critical for evaluation of the impact crater statistics and planetary remotely sensed chronology
S7(P58) LEm4
/Em3
1. Help us evaluate the compositional properties of the young and old basaltic units
2. Be especially critical for evaluation of the lunar impact crater statistics and planetary remotely sensed chronology
3. Decipher some of the unresolved questions in late stage volcanism on the Moon
S8(Em4 Unit) Q,J,LEm41. Unsampled new rock type
2. Extent of lunar volcanism duration
3. Properties of late stage lunar volcanism
4. Deep mantle properties
5. Concentration mechanism of Th and its role in late stage volcanism
6. Precise isotopic age of young volcanism
7. Impact cratering flux history
8. Improving CSFD dating method and chronology
S9(58.53°W, 41.41°N) QIRh1. Origin of lunar domes
2. Property of the magma source
3. The duration of Mons Rümker volcanism
4. Impact cratering flux history
5. Improve CSFD dating method and chronology
S10(49.85°W, 43.68°N) QEm41. Rock-type characteristic of the dome
2. Origin of the silica-rich domes
3. Properties of the magma source
4. Evolution of magmas
5. Influence of Th in silica dome formation
6. The mechanism of Th concentration
S11(55.78°W, 41.69°N) GEm41. Provide measurements of trace element and major element chemistry/mineralogy of various regolith components
2. Fill in gaps in the lunar thermal evolution time scale
3. Obtain most precise age determination
4. The regolith consist of a complex mix of both local and distal material via impact cratering
S12(56.31°W, 39.35°N) GEm31. Provide measurements of trace element and major element chemistry/mineralogy of various regolith components
2. Fill in gaps in the lunar thermal evolution time scale
3. Obtain most precise age determination
4. The regolith consist of a complex mix of both local and distal material via impact cratering
S13(58.3°W, 42.33°N) GEm31. Provide measurements of trace element and major element chemistry/mineralogy of various regolith components
2. Fill in gaps in the lunar thermal evolution time scale
3. Obtain most precise age determination
4. The regolith consists of a complex mix of both local and distal material via impact cratering
5. Provides for greater availability of helium-3
S14(50.24°W, 40.67°N) CEm41. A possible conduit for transportation of youngest basaltic magma/lavas with high Fe and Ti from the mantle to the surface
2. A higher chance of sampling lava flows derived from the mantle different from other young basaltic surface materials
S15(54.67°W, 43.75°N) CEm41. Increase the possibility of collecting samples of materials representing a long time span
2. The landing site features an unusual structure on the derivative maps
S16(56.53°W, 40.84°N) CEm31. Provide information on the early Eratosthenian volcanism
2. Provide knowledge on the differences in composition, mode of emplacement of the Imbrian and widespread volcanism
3. Provide knowledge that leads to the formation of the Imbrian and widespread volcanism
S17(58.9°W, 40.72°N) CIR1. Provide information on the Imbrian/Eratosthenian transition
2. Provide potential samples of the Rümker complex uncontaminated by the mare deposits
S18(53.94°W, 42.46°N) XEm41. The areas are covered by a thin-layer ejecta from nearby craters, in which a deeper drill has a higher possibility sampling older and more DSPs.
2. The core samples may contain basaltic materials from Em4, Im1, Im2, and Im3.
Note: the alphabet Z1 is Zhao et al. [67], Z2 is Zhao et al. [1], L is Ling et al. [63], Q is Qian et al. [2], J is Jolliff et al. [64], G is Giguere et al. [65], C is Chisenga et al. [29], and X is Xie et al. [26].

