Article

Combining and Comparing an Unmanned Aerial Vehicle and Multiple Remote Sensing Satellites to Calculate Long-Term River Discharge in an Ungauged Water Source Region on the Tibetan Plateau

1
College of Water Sciences, Beijing Normal University, Beijing Key Laboratory of Urban Hydrological Cycle and Sponge City Technology, Beijing 100875, China
2
School of Geography and Environmental Science, Guizhou Normal University, Guiyang 100089, China
3
Beijing Weather Modification Office, Beijing 550001, China
4
School of Biological Sciences, Georgia Institute of Technology, 310 Ferst Dr NW, Atlanta, GA 30332, USA
5
Gangarosa Department of Environment Health, Rollins School of Public Health, Emory University, Atlanta, GA 30322, USA
6
State Key Laboratory of Remote Sensing Science, Faculty of Geographical Science, Beijing Normal University, Beijing Key Laboratory for Remote Sensing of Environment and Digital Cities, Beijing 100875, China
7
Tibet Water Resources Department, Lhasa 850000, China
*
Author to whom correspondence should be addressed.
Remote Sens. 2020, 12(13), 2155; https://doi.org/10.3390/rs12132155
Submission received: 3 June 2020 / Revised: 1 July 2020 / Accepted: 3 July 2020 / Published: 6 July 2020
(This article belongs to the Section Remote Sensing in Geology, Geomorphology and Hydrology)

Abstract

:
Research into global water resources is challenged by the lack of ground-based hydrometric stations and limited data sharing. It is difficult to collect good quality, long-term information about river discharges in ungauged regions. Herein, an approach was developed to determine the river discharges of 24 rivers in ungauged regions on the Tibetan Plateau on a long-term scale. This method involved coupling the Manning–Strickler formula, and data from an unmanned aerial vehicle (UAV) and the Gaofen-2, SPOT-5, and Sentinel-2 satellites. We also compared the discharges calculated by using the three satellites’ data. Fundamental information about the rivers was extracted from the UAV data. Comparison of the discharges calculated from the in-situ measurements and the UAV data gave an R2 value of 0.84, an average NSE of 0.79, and an RMSE of 0.11 m3/s. The river discharges calculated with the GF-2 remote sensing data and the in-situ experiments for the same months were compared and the R2, RMSE, and the NSE were 0.80, 1.8 m3/s, and 0.78, respectively. Comparing the discharges calculated over the long term from the measured in-situ data and the SPOT-5 and Sentinel-2 data gave R2 values of 0.93 and 0.92, and RMSE values of 2.56 m3/s and 3.16 m3/s, respectively. The results showed that the GF-2 and UAV were useful for calculating the discharges for low-flow rivers, while the SPOT-5 or the Sentinel-2 satellite gave good results for high-flow river discharges in the long-term. Our results demonstrate that the discharges in ungauged tributaries can be reliably estimated in the long-term with this method. This method extended the previous research, which described river discharge only in one period and provided more support to the monitoring and management of the tributaries in ungauged regions.

Graphical Abstract

1. Introduction

Half a billion people in the world currently experience severe water scarcity year-round. Rivers are the main source of freshwater for humans and natural ecological systems. Therefore, to ensure human health and wellbeing, it is very important to monitor river discharge and manage water resources [1,2,3].
River discharge data are mainly collected by traditional ground-based hydrometric stations. Hydrometric stations, however, are sparsely distributed in most areas of the world, particularly in developing countries [4,5]. The situation is getting worse, as the number of traditional ground-based hydrometric stations has been decreasing globally year-by-year [2,6,7]. In addition, data from these hydrometric stations are not generally publicly available [8]. Thus, we urgently need to find new ways to derive information about river discharge [9].
Traditional hydrometric stations, hydrological models, and remote sensing technology are the three methods most frequently used to obtain water source data. Traditional hydrometric stations can generate continuous observations at points on the ground. However, the total number of hydrometric stations worldwide has decreased considerably. Through the 1980s, approximately 2000 hydrometric stations were closed down worldwide [2,6]; from 1995 to 2000, the number of hydrometric stations that reported discharge data to the World Meteorological Organization’s Global Runoff Data Center decreased by 90% [7]. In Russia, the operational capacity of hydrometric stations has declined by 25% to 35% since 1985, and there have been decreases in capacity of between 15% and 60% across other former Soviet states. Even in Canada and the USA, the number of river discharge stations has declined by 25% since 1990, with 100 river gauges with long records lost each year [8]. Hydrological research, therefore, has been severely curtailed by the lack of information from hydrometric stations.
Hydrological models that allow the discharge to be calculated continuously can improve the spatial coverage of river discharge information, with empirical hydrological models, conceptual hydrological models, and distributed/semi-distributed hydrological models among the most frequently used. However, models rely on in-situ data from a limited number of hydrometric stations, which means that model parameters are difficult to obtain, particularly in ungauged areas.
Recently, remote sensing has been applied to monitor river discharge, because remote sensing images can provide information about hydraulic elements such as the width of the river and flow velocity, from which river discharge information can be calculated. At present, five remote sensing monitoring methods are frequently used. The first one is the river water balance method [10,11] that allows calculations of the river discharge across a large area using the parameters derived from remote sensing data. The second one is the river cross-section water level method [12], the river discharge can be obtained by combining hydrological models with water level data of river cross-sections from satellite surveys (e.g., TOPEX/Poseidon, ENVISAT). The third one is the river lengthways slope method [4], which uses the lengthways slope data of a river and gives better results for the river cross-section than the water level method; it performs well along long river sections as even coarse satellite elevation data can be used in calculations. The fourth one is the water surface width method that uses water surface boundaries and the river width retrieved from high-precision remote sensing data (e.g., UAV—unmanned aerial vehicle data) to calculate the discharge [13,14]. The fifth one is the slope-area method that is combined with UAV data to estimate river discharge [15] using three different formulas in the Tibetan Plateau and Xinjiang Province, the overall qualification rate of the calculated discharge from the three formulas was 70%, and the average Nash–Sutcliffe efficiency coefficient was 0.97. River discharge attenuation coefficients in the arid desert [16] over the short term were also calculated by using this method in the Xinjiang Province, the base of runoff attenuation in the lower reaches of the Hotan River is 40%. These two previous studies showed that combining the UAV and traditional hydrological formulas could achieve fast and accurate river discharges in the ungauged area.
The remote sensing monitoring approach also has limitations. First, remote sensing monitoring has been mostly applied to large rivers [17], and, as the spatial resolution of remote sensing is a serious constraint, it is easier to obtain information about large rivers than smaller rivers using a range of sources of remote sensing data. Remote sensing data and hydrologic models have to be integrated [14], and there has been very little research about the feasibility of this approach, especially for medium-sized and small rivers. Second, while UAVs have already been used to estimate river discharge [15,16], these studies only calculated river discharge values over short periods. However, to manage water sources effectively, particularly tributaries in ungauged areas, more hydrological information is needed over longer periods of time.
This study tried to extend the previous studies [15,16] and addressed the issues mentioned above as follows: (1) UAV remote sensing was used to obtain image data for tributaries in ungauged water source regions on the Tibetan Plateau; (2) multi-sources remote sensing data were coupled with a traditional river discharge formula to calculate the river discharge over a long time scale; (3) the discharges calculated from three different remote sensing data for rivers were compared and analyzed. The Tibetan Plateau, known as the “Asian Water Tower”, provides water resources for more than 1.4 billion people, so our study is very important for ongoing human health and wellbeing.

2. Materials and Methods

2.1. Study Area

The study area is in northwestern China (Figure 1). Hydrologically, this area is ungauged and is an important water source for China and Central Asia [18]. There are 37 third-grade rivers (R3), 83 fourth-grade rivers (R4), and 357 fifth-grade rivers (R5) in the area, according to the stream order of the Ministry of Water Resources of China (http://www.mwr.gov.cn). However, because of the complex geographical conditions and high costs to construct the monitoring infrastructure, there are only 191 traditional hydrometric stations.
The study area spans the northern and southern Kunlun Mountains and is on the northern edge of the Tibetan Plateau (Figure 1), which provides water resources for more than 1.4 billion people [19]. This area is a key source of water for the main part of the Tibetan Plateau (southern Kunlun Mountains) and the Central Asian desert oasis region (northern Kunlun Mountains). The average elevation of the study area is 3584 m above sea level, and there is permanent snow and glaciers in the mountains. The wet season (May to October) and dry season (November to April) are well-defined. The area has three main features, as follows. Glacial melt is the main source of water for the rivers, and the annual precipitation is less than 200 mm [20]. The water supply in the region is strongly influenced by temperature variations caused by global climate change [21]. Oasis farming accounts for more than 90% of, and dominates, the total water consumption in the northern Kunlun Mountains [22,23].
The present study focused on 13 rivers in the northern Kunlun Mountains and 11 rivers in the southern Kunlun Mountains, where in-situ experiments (UAV flying, river discharge surveys, and depth surveys) were carried out and the river discharges were calculated (Figure 1). The river discharge was also calculated for the Kaqun cross-section (112601). To validate the performance of the method, we compared the river discharge data from the hydrometric measurements against those calculated for the period from 2009 to 2018. The UAV flight path and take-off/landing point are shown in Figure 1. The imaging pattern of the camera on the UAV was set to the orthographic projection pattern to minimize the geometric distortion of images.

2.2. Methods

2.2.1. Framework and Flowchart of this Study

In this section, we provide information about the remote sensing data applied in the study. The river discharges in the long-term were calculated using a six-step process (Figure 2). The first step was surveying and imaging the land surface and river cross-section terrain. The river cross-section should have a stable bank and be as straight as possible, meanwhile, it should be far from human influence. Topographic information and elevation data were collected by an optical remote sensing camera and a global positioning system (GPS) loaded on the UAV. The second step involved processing the UAV data and retrieving the hydrological parameters (e.g., river width, elevation difference of the river cross-sections) that described the river channel topography. Remote sensing images from the UAV, with a spatial resolution of 0.05 m, were processed using Pixel4D software. To weaken the geometrical distortion of the UAV images, the rivers were set in the center of the flight route (Figure 1). The land surface information was processed directly in ArcGIS 10.5, and the hydrological parameters were obtained from remote sensing data. In the third step, the river discharge was calculated using the Manning–Strickler formula, which is based on empirical equations. In the fourth step, river discharge, water depth, and flow velocity were surveyed in-situ (Figure 1 and Figure 2). In the fifth step, the river discharge was validated and analyzed using the survey discharge data from the in-situ experiments and data from the Kaqun hydrometric station. The results from the discharge calculations and the retrieved parameters were validated against the in-situ measurements. The discharges calculated from 2009 to 2018 were validated with the in-situ discharge data from the Kaqun hydrometric station. In the last step, we compared and analyzed the long-term river discharge calculated from three different remote sensing satellites.

2.2.2. The Formula Used to Calculate River Discharge

The Manning–Strickler formula (MSF) was used in this study to calculate the river discharge. This empirical formula is generally used to calculate the average water flow and velocity in a channel or a conduit that is not completely enclosed [24]. It is also used to estimate the water flow of a natural river, based on the assumption that the velocity is stable and the roughness of the river channel is confirmed at the same time [25,26,27,28].
The river discharge was calculated by the following function:
Q = V · A
where Q is the river flow in m3/s, V is the water flow velocity in m/s, and A is the area of the river cross-section in m2, which is determined by the water depth and the width of the water surface.
The water flow velocity, a key parameter in the MSF, is calculated with the following function [29]:
V = k n · R 2 / 3 · J
where k is a conversion constant (m1/3/s) with a value of 1 in this study, n is the roughness coefficient and is an indicator of the river channel roughness; R is the hydraulic radius, which depends on the shape of the river cross-section, and J is the hydraulic gradient that describes the slope of the vertical river channel section.
The hydraulic radius was calculated by the following function:
R = A / S
where S is the wet perimeter of the river (m) when water flows through it.
The hydraulic gradient was obtained using the following equation:
J = Δ H / L
where ΔH is the elevation difference (in m) between two points on the contour of the water table and L is the horizontal distance (m) between the two points.
Therefore, river discharge can be finally calculated as:
Q = k n · A 5 / 3 / S 2 / 3 · Δ H L

2.2.3. Geometric Description of the River Profile

The area of the river cross-section is needed for the formula. The river profile is described with a geometric approximation method. From the in-situ experiments and surveys, we found that the river profile was either triangular, trapezoidal, or rectangular (Figure 3). The length of the river was derived from the UAV images by using the ArcGIS software. The parameters used to describe the river profile were calculated from in-situ experiments and UAV images. For example, the river depth was obtained by the in-situ surveying, and the river width was extracted from the UAV images because they have coordinates collected by the GPS on the UAV. The topography of the riverbank was calculated from digital surface model (DSM) images from the UAV, and the DSM data were created by using the elevation information collected by the GPS.

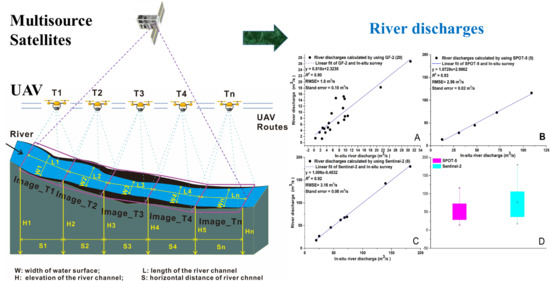
2.2.4. Application of the UAV and Three Remote Sensing Satellites

The river discharge was calculated using data collected by a UAV and remote sensing satellites. The UAV had cameras with three spectral channels and a GPS, so it contributed to the river discharge in two ways (Figure 4). First, the camera on the UAV platform was used to capture precise information about the river channel. Flying automatically in preset routes, the UAV continuously recovered images of the river channel surface at a high spatial resolution (5 cm) and sent the images to the base station in real-time. The hydrological parameters used to calculate the discharge, including river channel width, river water surface width, and river channel length, were then determined precisely from the UAV images. Second, topographical data of the river channel were also acquired from the elevation survey undertaken by the GPS on the UAV. As the images are taken by the camera, the GPS records the horizontal and vertical coordinates of the visual images. The elevation and the horizontal distance of the river channel were generated and calculated from the vertical coordinates.
The input data for the formula were determined from the UAV surveys, calculations of the UAV data, prior knowledge, and the in-situ measurements (Table 1). The elevation differences (ΔH) and the horizontal distance (L) between the two points on the river channel were determined directly from UAV images. The river cross-section area (A) and the wet perimeter of the river (S) were computed using data from UAV images (i.e., the water width and the length of the river channel) and in-situ surveys (used to obtain the water depth). The conversion factor (k) was a constant. The roughness coefficient (n) was taken from a previous study in this region [30], in which the roughness coefficient was determined based on the number of stones and the characteristics of soil in the river channel. A lookup table that included different roughness coefficients for many rivers in this area was created. The water depth (h) in the MSF was determined using in-situ measurements in the first computational process.
A is the area of the river cross-section in m2, ΔH is the elevation difference between two points on the contour of the water table in m, L is the horizontal distance between the two points in m, k is a conversion constant in m1/3/s, R is the hydraulic radius, n is the roughness coefficient and is an indicator of the river channel roughness, S is the wet perimeter of the river in m, J is the hydraulic gradient, and h is the average water depth in m.
The width of the water surface at the Kaqun river section (112601) from 2009 to 2018 was obtained from the remote sensing data. In this study, we used images from the Gaofen-2 (GF-2), Systeme Probatoire d’Observation de la Terre-5 (SPOT-5), and the Sentinel-2 (Table 2). The Gaofen-2, launched by China in 2014, has a spatial resolution of 1 m in the Pan band and 4 m in the multi-spectrum bands, which meant that the images were particularly useful for giving measurements of narrow river widths. We used GF-2 data in November 2017 to obtain the water surface width of the river, the data selected due to the in-situ experiments were also carried out in November 2017. The GF-2 data were available for 20171101, 20171113, 20171117, 20171121, 20171125, and 20171129. The SPOT-5 was launched by the France Space Agency Center National d’études Spatiales (CNES) in 2002. We used the Pan band of the SPOT-5 from 2009 to 2013 because of its high spatial resolution of 2.5 m. The spatial resolution of the SPOT-5 was lower than the GF-2, we wanted to compare their performances to calculate the discharge. Data in the spatial resolution of 10 m were also readily available from the Sentinel-2 for 2015 to 2018 (https://scihub.copernicus.eu/dhus/#/home), they were also used to calculate the river discharge and their validation were checked and compared. The visible bands including the blue, green, and red channels from the Sentinel-2 were used in this study. The SPOT-5 data were used for five periods (20090517, 20100910, 20110817, 20130806, and 20130906) and Sentinel-2 data were used for eight periods (20150714, 20150821, 20160518, 20150717, 20170523, 20170925, 20180523, and 20180619). These dates were selected because the quality (cloud cover) of the satellite images met the requirements of this study. The raw remote sensing data were geometrically rectified and the coordinates were unified.

2.2.5. Measuring the Water Depth over Long Time Periods

The water depth is needed to calculate the river discharge. The fact that it is difficult to directly survey the water depth accurately with a UAV or other type of remote sensing satellite posed a challenge for our method. To address this issue, we considered the relationship between the river water depth and the width of the water surface for triangular or trapezoidal river cross-sections (Figure 5) and found that, for these river cross-sections, there was a tangential relationship between the width of the water surface (W_trapezoid and W_triangle in Figure 5) and the water depth (H_trapezoid and H_triangle). The α_ trapezoid and α_ triangle angles can be surveyed, so the width of the water surface can be obtained as long as there are UAV or satellite data for the river channel section. However, this relationship did not apply to rectangular river channels.

2.2.6. Data Analysis and Parameter Sensitivity Analysis

We applied various metrics, including the determination coefficient (R2), root-mean-square error (RMSE), error ratio, and Nash-Sutcliffe efficiency coefficient (NSE), to assess the performance of the MSF method. The determination coefficient reflects the credibility of a measured value, and the NSE is generally used to verify the quality of runoff simulation results [31]. The NSE is used to evaluate the effect of a river discharge calculation, and values close to 1.0 indicate a good simulation result. The NSE is calculated with the following formula:
N S E = 1 t = 1 t ( Q m t Q c t ) 2 t = 1 t ( Q m t Q m ¯ ) 2
where Qc is the calculated discharge, Qm is the measured discharge, Q m ¯ is the average measured discharge, and t is the simulation time. We also performed a sensitivity analysis to determine the key parameters in the three methods.

2.3. Materials

2.3.1. UAV Flights and Data Processing

A rotor style Phantom-4-pro UAV (Dajiang Company, Shenzhen, China, https://www.dji.com/cn) was used in this study, the specifications of which are listed in Table 3. The UAV was equipped with an automatic control system linked to a telemetry module. A similar module was used in the ground controller that was connected to Pix4D software (https://www.pix4d.com/) to plan the flight path and manage the UAV flight. The UAV was equipped with a camera system linked to an embedded GPS that collected photogrammetry data. The UAV sensor operated in the red (R), green (G), and blue (B) spectral channels. The precision of the UAV data has been validated in an earlier study. The spatial resolution was 0.51 cm and elevation resolution was 4.39 cm [30], which means that the quality of the data used in this study was high.
A two-person team performed the flights over the cross-section areas of 24 rivers from 3 November to 5 December 2017 (Figure 1). The UAV take-off location was the same for each flight. The temporal variation in the UAV flights at each river was five days. Six flights were conducted in this period, generating a set of six measurements. We did the flights at this time of the year because of the seasonality of these rivers and chose a period of the year when the discharges were low to facilitate the in-situ experiments (e.g., surveys of water depth). The take-off and landing sites were located as close to the center of the flight area as possible, and the flight path was a photogrammetry grid (Figure 1). The distance between the flight paths was 80 m, and an 80% forward and side overlap was set. The flight area measured 300 × 500 m. The UAV was at an altitude of 120 m, chosen to allow for ground surface features, such as glacier caps, trees, and mountains and so that the remote sensing images would have a spatial resolution of 0.05 m. When processing the UAV images, the imaging points (center of the camera objective) and the instantaneous imaging time and location were shown and checked (Figure 1).
The images were obtained in the RAW format during the flight and then converted to JPEG format in Pix4D software. All images had 3D georeferenced information (X, Y, Z) registered by the autopilot recorder mounted on the UAV. Images showing the 24 river channels were processed into an orthophoto with a resolution of 0.05 m and a digital elevation model (DEM) with a 0.20 m resolution in the original WGS84 coordinate system. The Cloth Simulation Filtering algorithm [32] was used to create the orthophoto and DEM. To obtain the river channel data, the orthophoto was converted to the Albers system in ArcGIS 10.5 software. The parameters for the MSF formula were then directly generated using the processed images.

2.3.2. In-Situ Experimental Data

The in-situ flow velocity, river discharge, and water depth were measured when the UAV was flying over the river. The flow velocities were measured using a surface velocity radar (SVR, USA), and the river discharge was measured with a Ponolflow-VA (USA, Acoustic Doppler flow instrument, range of depth 0–5 m). The water depths were surveyed with a staff gauge at the same temporal scale as the river discharge. The elevation of the naked riverbank was used to describe the river profile surveyed using an electronic total station (MS60, Germany). All the in-situ survey data were used to validate the results calculated by the formula or to provide input data.

3. Results

3.1. Validation of the River Discharges Calculated from the UAV

Validation of the river discharge from the calculated results from the MSF over the study period are shown in Figure 6. The MSF gave different results for the river discharges in different locations and river discharges. The R2 value, standard error, and RMSE were 0.84, 0.09 m3/s, and 0.11 m3/s, respectively. The MSF function used in this study performed well and had determination coefficients greater than 0.80, and so gave better results when calculating the discharge of big rivers than for smaller rivers. The average NSE for the MSF for all the calculated river discharges was 0.79, which means that the formula selected in this method was appropriate for this ungauged area. The method used in this study can also supply satisfactory river discharge data compared to the data from the traditional hydrometric stations.

3.2. Performance of the Three Sources of Remote Sensing Data for Calculating the River Discharges

The river discharges calculated from the GF-2, SPOT-5, and Sentinel-2 satellites were checked and compared (Figure 7). We used GF-2 data in November 2017, so that it corresponded with the timing of the in-situ measurements. The images included 20 river cross-sections (Figure 7A), so we calculated the discharges for these cross sections by using the GF-2 data. The R2 value, RMSE, and standard error between the in-situ discharges and those calculated discharges were 0.80, 1.8 m3/s, and 0.10 m3/s, respectively.
We also compared the discharges monitored at the Kaqun hydrometric station and those calculated from the SPOT-5 and Sentinel-2 data in the long-term. We selected, checked, and processed high-quality remote sensing images for the river cross-sections. The river widths were extracted at the Kaqun hydrometric, and then the river discharges were calculated in five periods using the river widths from the SPOT-5 and Sentinel-2. Five periods, all of which were during the high-flow period from May to September, were collected from the SPOT-5 (Figure 7B). The R2 value, RMSE, and standard error between the in-situ discharges and those calculated from the SPOT-5 were 0.93, 2.56 m3/s, and 0.02 m3/s, respectively. Eight river discharges (Figure 7C) in different periods were calculated by using the Sentinel-2 data; the R2 value, RMSE, and standard error between the measured and calculated discharges were 0.92, 3.16 m3/s, and 0.08 m3/s, respectively. The NSE values of the river discharges calculated from the GF-2, SPOT-5, and Sentinel-2 were 0.77, 0.94, and 0.93, respectively.
The three sources of remote sensing data gave good results for calculating the river discharge in this area even though the spatial resolutions were different. The results from the GF-2 were not as good as those from the other two satellites; but in fact, the discharges calculated from the GF-2 data were from the dry season and the river widths were narrow, this influenced its performance. The data from the SPOT-5 and Sentinel-2 satellites were used to calculate the discharges in the wet season from May to October, and the SPOT-5 gave better results than the Sentinel-2 (Figure 7B–D). Furthermore, both data sets gave better results for large river discharges. When the river discharge was smaller than 20 m3/s, the error exceeded 10%. However, there was little difference between the river discharge results calculated from the data from the SPOT-5 and Sentinel-2.

3.3. Comparison of the River Discharges Calculated from the UAV and GF-2 Data

We compared the river discharges calculated from the UAV and GF-2 because they were all calculated for November 2017 (Figure 8). By using the UAV data, the R2 was higher, and the RMSE and standard error were lower when calculating the discharge compared to the GF-2 data, which shows that results from the UAV data were better than those from the GF-2 (Figure 6 and Figure 8). This meant that the measurements of the water surface widths of the rivers from the UAV data were more precise than those from the GF-2 data. In fact, the calculated discharges from the UAV and GF-2 were good for discharges greater than 10 m3/s but, when the river discharge was lower than 5 m3/s, the UAV gave better results than the GF-2. The average river discharges calculated from the UAV data were higher than those from the GF-2 because of the higher spatial resolution. The spatial resolution of the UAV data was at the centimeter level and GF-2 data was at the 1-meter level. Despite the lower spatial resolution of the GF-2 data, the precision of the river discharges from the GF-2 can be used in comparison with the UAV. This is because rivers are linear features, so it is easy to detect and extract the river width. The GF-2 and UAV data both gave good results for the river discharge of the small rivers in this area.

4. Discussion

4.1. Key Parameters and Accuracy of the Method for the Study Area

Sensitivity analysis was used to identify the parameters that influenced the results calculated by the MSF formula (Figure 9). This analysis showed that the water depth, roughness coefficient ( n ), hydraulic gradient, and hydraulic radius were the most influential parameters. The water depth, hydraulic radius, and hydraulic gradient had a strong influence on the river discharge results. For the MSF used in this study, when the water depth, hydraulic radius, and hydraulic gradient were each increased by 10%, the resulting river discharges increased by 6.5% (water depth), 5.9% (hydraulic radius), and 4.1% (hydraulic gradient).
These results are similar to those reported previously [30,33,34,35]. In this study, the hydraulic radius was determined by the wet perimeter and the river cross-section area, which were influenced by the elevation data from the UAV and the water depth surveys. The water depth and the hydraulic radius had similar effects on the river discharge. The hydraulic gradient was calculated from the elevation difference and the horizontal distance of the water surface and, of all the parameters measured, these two were the most strongly influenced by the accuracy of the UAV remote sensing data.

4.2. Method Applicability and Advice for Using this Method

In this study, we extended the previous research [15], which achieved the river discharge in one period by just using a UAV. However, the temporal resolution of the UAV was not as good as satellite remote sensing, so it was difficult to get river cross-section information continuously. When the basic river information was obtained from the UAV and in-situ experiment, river width was the only unknown parameter to calculate the river discharge in the long-term. This parameter can be obtained by using satellite remote sensing but multi-source remote sensing has different and various spatial resolutions, their applicability should be checked, and this study has done the job.
The study relied on measurements of the river profile and water depth. Here, the river cross-sections were described using triangular, trapezoidal, and rectangular shapes. As the river depth was measured in-situ, we were able to calculate the river discharge for all three river cross-section shapes. We calculated the long-term discharges for the triangular and trapezoidal river types when there were remote sensing data for the water surface width. There was a tangential relationship between the water depth and surface width for the triangular and trapezoidal river types (Figure 5). But for the rectangular rivers, it is difficult to use this method because the relationship between the water depth and surface width can’t be created.
To calculate continuous river discharge using our method, there should be a constant and stable relationship between the water depth and water surface width. Therefore, to ensure good results from this method, the river channel should be as straight as possible to ensure that the water velocity is constant; the slopes of the river channel must be stable, to ensure a constant relationship between the water depth and the width of the water surface, and the study river should be as far from human influences as possible.

4.3. Advantages and Disadvantages of UAV Optical Remote Sensing

Optical remote sensing and elevation data from the UAV supported the calculation of river discharges in this study. The UAV remote sensing had three advantages, namely, the high spatial resolution of its images, its flexibility, and cost advantage. A high spatial resolution is a basic feature of UAV remote sensing, and because the UAV flights are at a relatively low altitude imaging issues from the atmosphere are avoided [36,37]. Highly accurate information about the river channel (e.g., river width and section length) and elevation values (e.g., the elevation of the water surface and the difference between two river channel points) can be extracted directly from remote sensing images. Land surface information and more data from larger areas can be generated from the mobile measurements collected by UAVs than from point surveys combined with ground-based traditional hydrometric stations. UAV data are also cost-effective and, for example, the cost of obtaining river discharge data with a UAV is approximately one-tenth that of collecting data traditionally at hydrometric stations.
The UAV method applied in this study also has some limitations. For example, it was not possible to determine all the hydrologic parameters, such as the water depth and flow velocity, from the UAV data in this study. Accurate water depth data must, therefore, be measured in-situ with sonar or a sounding rod [38,39]. While ocean water depths can be obtained from remote sensing data [40], river water depth cannot, because visible light from the sensors rarely reaches the river bottom due to the influence of particulate matter in the water on the optical path [41]. While flow velocity can be surveyed with large UAV platforms, this would increase the cost considerably, thereby reducing the cost-effectiveness of the technique. Continuous surveys are another limitation; while UAVs can be used to obtain river channel information, they cannot be used to monitor river discharge at short time steps (e.g., seconds or minutes) like a traditional hydrologic station. Also, UAVs have a limited range and cannot fly in bad weather conditions.

4.4. Using Data from Multiple Remote Sensing Sources Extended the Application of this Method

More data from satellite remote sensing were used to calculate river discharges in this area compared to the previous study [16] because the satellite data have a higher temporal resolution than the UAV. In this study, the data from the three satellites stretched over 4 to 5 days, and this means that there were many data available to support the river discharge calculations. We proved that the GF-2 data and the UAV data were similarly effective for calculating the discharge for the small rivers in the study area. While the data from the Sentinel-2 or SPOT-5, which has a higher temporal resolution than the UAV, gave good results for large discharges. We achieved good calculated river discharge results from multiple remote sensing sources, which was not only because of the high spatial resolution but also because rivers are linear features, they were easy to detect in the remote sensing images. More importantly, we were able to extend the applicability of the method by using data from multiple remote sensing satellites. If long-term river monitoring data are needed, data from multiple remote sensing satellites should be considered because of their good temporal resolution.
In the future, we should be able to connect this method with multiple space satellite platforms, and, after the initial calculations are done, river discharges could be monitored in the long-term. Once the river width is known, the river discharges could be monitored and calculated in the long-term using UAVs or data from multiplatform satellites, including optical remote sensing (e.g., Landsat [42]), thermal infrared remote sensing [43], microwave remote sensing [44], and/or LiDAR remote sensing [45].

5. Conclusions

In this study, we used UAV and multiple-source remote sensing data including the GF-2, SPOT-5, and Sentinel-2, to calculate the river discharge with the MSF formula for an ungauged water source region of the Tibetan Plateau. The R2 value, average NSE, and RMSE between the in-situ survey results and the results from the UAV data were 0.84, 0.79, and 0.11 m3/s, respectively. We then calculated the discharges with the GF-2 remote sensing data for November 2017 and achieved R2, RMSE, and standard error values of 0.80, 1.8 m3/s, and 0.78 between the discharge calculated from the in-situ results and the GF-2 data, respectively. For long-term discharges calculated using the SPOT-5 data for the Kaqun river cross-section (112601), the R2, RMSE, standard error, and NSE values were 0.93, 2.56 m3/s, 0.02 m3/s, and 0.94. The R2, RMSE, standard error, and NSE values between the discharge calculated with the measured data and the calculated discharges from the Sentinel-2 were 0.92, 3.16 m3/s, 0.08 m3/s, and 0.93, respectively. The UAVs captured precise river channel information that was used to calculate river discharges. Then the remote sensing and UAV data were combined to calculate the river discharge. The GF-2 and UAV gave good results for the low flow rivers, while the SPOT-5 and Sentinel-2 gave good results for the high flow rivers in the long-term. With this method, remote sensing data and hydrological formulas were integrated to obtain accurate values of the discharge from tributaries in the Tibetan Plateau. We believe that this method will be useful for the hydrological model researchers and water resource managers worldwide.

Author Contributions

H.L. and S.Y. had the original idea that is applied in this research; H.L. wrote the manuscript; P.W., F.H., and J.W. gave their hard work to obtain the data used in this research; T.G. gave great help in the in-situ experiments; Y.W., X.R., and L.S. polished the manuscript. All authors have read and agreed to the published version of the manuscript.

Funding

This research was funded by National Natural Science Foundation of China (Grant Nos. U1812401, 41801334, U1603241, 41875044), the National Key Project for R&D (Nos. 2018YFC0407900), the Fundamental Research Funds for the Central Universities (2017NT11), Science Foundation of Beijing (8192021).

Conflicts of Interest

The authors declare no conflict of interest.

References

  1. Barnett, T.P.; Adam, J.C.; Lettenmaier, D.P. Potential impacts of a warming climate on water availability in snow-dominated regions. Nature 2005, 438, 303. [Google Scholar] [CrossRef]
  2. Hannah, D.M.; Demuth, S.; van Lanen, H.A.; Looser, U.; Prudhomme, C.; Rees, G.; Stahl, K.; Tallaksen, L.M. Large-scale river flow archives: Importance, current status and future needs. Hydrol. Process. 2011, 25, 1191–1200. [Google Scholar] [CrossRef]
  3. Di Baldassarre, G.; Uhlenbrook, S. Is the current flood of data enough? A treatise on research needs for the improvement of flood modelling. Hydrol. Process. 2012, 26, 153–158. [Google Scholar] [CrossRef]
  4. Schumann, C.M.; Bloss, C.S.; Barnes, C.C.; Wideman, G.M.; Carper, R.A.; Akshoomoff, N.; Pierce, K.; Hagler, D.; Schork, N.; Lord, C.; et al. Longitudinal magnetic resonance imaging study of cortical development through early childhood in autism. J. Neurosci. 2010, 30, 4419–4427. [Google Scholar] [CrossRef] [PubMed]
  5. Zhao, C.S.; Zhang, C.B.; Yang, S.T.; Liu, C.M.; Xiang, H.; Sun, Y.; Yang, Z.Y.; Zhang, Y.; Yu, X.Y.; Shao, N.F.; et al. Calculating e-flow using UAV and ground monitoring. J. Hydrol. 2017, 552, 351–365. [Google Scholar] [CrossRef]
  6. Calmant, S.; Seyler, F. Continental surface waters from satellite altimetry. C. R. Geosci. 2006, 338, 1113–1122. [Google Scholar] [CrossRef]
  7. Conway, D.; Persechino, A.; Ardoin-Bardin, S.; Hamandawana, H.; Dieulin, C.; Mahé, G. Rainfall and water resources variability in sub-Saharan Africa during the twentieth century. J. Hydrometeorol. 2009, 10, 41–59. [Google Scholar] [CrossRef]
  8. Dinar, S. The geographical dimensions of hydro-politics: International freshwater in the Middle East, North Africa, and Central Asia. Eurasian Geogr. Econ. 2012, 53, 115–142. [Google Scholar] [CrossRef]
  9. Alsdorf, D.E.; Rodríguez, E.; Lettenmaier, D.P. Measuring surface water from space. Rev. Geophys. 2007, 45. [Google Scholar] [CrossRef]
  10. Syed, T.H.; Famiglietti, J.S.; Chambers, D.P.; Willis, J.K.; Hilburn, K. Satellite-based global-ocean mass balance estimates of interannual variability and emerging trends in continental freshwater discharge. Proc. Natl. Acad. Sci. USA 2010, 107, 17916–17921. [Google Scholar] [CrossRef] [Green Version]
  11. Lee, H.; Beighley, R.E.; Alsdorf, D.; Jung, H.C.; Shum, C.K.; Duan, J.; Andreadis, K. Characterization of terrestrial water dynamics in the Congo Basin using GRACE and satellite radar altimetry. Remote Sens. Environ. 2011, 115, 3530–3538. [Google Scholar] [CrossRef] [Green Version]
  12. Nerem, R.S.; Chambers, D.P.; Choe, C.; Mitchum, G.T. Estimating mean sea level change from the TOPEX and Jason altimeter missions. Mar. Geod. 2010, 33, 435–446. [Google Scholar] [CrossRef]
  13. Tarpanelli, A.; Brocca, L.; Lacava, T.; Melone, F.; Moramarco, T.; Faruolo, M.; Pergola, N.; Tramutoli, V. Toward the estimation of river discharge variations using MODIS data in ungauged basins. Remote Sens. Environ. 2013, 136, 47–55. [Google Scholar] [CrossRef]
  14. Sichangi, A.W.; Wang, L.; Yang, K.; Chen, D.; Wang, Z.; Li, X.; Zhou, J.; Liu, W.; Kuria, D. Estimating continental river basin discharges using multiple remote sensing data sets. Remote Sens. Environ. 2016, 179, 36–53. [Google Scholar] [CrossRef] [Green Version]
  15. Yang, S.; Wang, P.; Lou, H.; Wang, J.; Zhao, C.; Gong, T. Estimating river discharges in ungauged catchments using the slope–area method and unmanned aerial vehicle. Water 2019, 11, 2361. [Google Scholar] [CrossRef] [Green Version]
  16. Yang, S.; Wang, J.; Wang, P.; Gong, T.; Liu, H. Low altitude Unmanned Aerial Vehicles (UAVs) and satellite remote sensing are used to calculated river discharge attenuation coefficients of ungauged catchments in arid desert. Water 2019, 11, 2633. [Google Scholar] [CrossRef] [Green Version]
  17. Sun, W.C.; Ishidaira, H.; Bastola, S. Towards improving river discharge estimation in ungauged basins: Calibration of rainfall-runoff models based on satellite observations of river flow width at basin outlet. Hydrol. Earth Syst. Sci. 2010, 14, 2011. [Google Scholar] [CrossRef] [Green Version]
  18. Bolch, T. Hydrology: Asian glaciers are a reliable water source. Nature 2017, 545, 161. [Google Scholar] [CrossRef] [Green Version]
  19. Wang, Y.; Zhang, Y.; Chiew, F.H.; McVicar, T.R.; Zhang, L.; Li, H.; Qin, G. Contrasting runoff trends between dry and wet parts of eastern Tibetan Plateau. Sci. Rep. 2017, 7, 15458. [Google Scholar] [CrossRef] [PubMed]
  20. Ferguson, R.I. Runoff from glacierized mountains: A model for annual variation and its forecasting. Water Resour. Res. 1985, 21, 702–708. [Google Scholar] [CrossRef]
  21. Yao, T.; Wang, Y.; Liu, S.; Pu, J.; Shen, Y.; Lu, A. Recent glacial retreat in high Asia in China and its impact on water resource in Northwest China. Sci. China Ser. D 2004, 47, 1065–1075. [Google Scholar] [CrossRef]
  22. He, C.; Zhong, L. Problem of agricultural water conservancy development in xinjiang and countermeasures to them. J. Water Resour. Archit. Eng. 2003, 04, 46–48. (In Chinese) [Google Scholar]
  23. Shahgedanova, M.; Afzal, M.; Severskiy, I.; Usmanova, Z.; Saidaliyeva, Z.; Kapitsa, V.; Kasatkin, N.; Dolgikh, S. Changes in the mountain river discharge in the northern Tien Shan since the mid-20th Century: Results from the analysis of a homogeneous daily streamflow data set from seven catchments. J. Hydrol. 2018, 564, 1133–1152. [Google Scholar] [CrossRef]
  24. McDowell, D.M. A general formula for estimation of the rate of transport of non-cohesive bed-load. J. Hydraul. Res. 1989, 27, 355–361. [Google Scholar] [CrossRef]
  25. Lv, W. The discussion about the Manning-Strickler formula applied in the rapidly varied flow. Guangai Paishui 1993, 12, 38–40. (In Chinese) [Google Scholar]
  26. Sun, Z.; Donahue, J. Statistically derived bedload formula for any fraction of nonuniform sediment. J. Hydraul. Eng. 2000, 126, 105–111. [Google Scholar] [CrossRef]
  27. Sikder, M.S.; Hossain, F. Understanding the geophysical sources of uncertainty for Satellite Interferometric (SRTM)-based discharge estimation in river deltas: The case for Bangladesh. IEEE J. Sel. Top Appl. 2014, 8, 523–538. [Google Scholar] [CrossRef]
  28. Wu, Q.; Zhao, Z.; Liu, L.; Granger, D.E.; Wang, H.; Cohen, D.J.; Wu, X.; Ye, M.; Bar-Yosef, O.; Lu, B.; et al. Outburst flood at 1920 BCE supports historicity of China’s Great Flood and the Xia dynasty. Science 2016, 353, 579–582. [Google Scholar] [CrossRef]
  29. Rebolho, C.; Andréassian, V.; Le Moine, N. Inundation mapping based on reach-scale effective geometry. Hydrol. Earth Syst. Sci. 2018, 22, 5967–5985. [Google Scholar] [CrossRef] [Green Version]
  30. Xie, B. Analysis of the regularity of the river roughness coefficient in the Aletain mountainous area in Xinjiang. J. Water Res. Water Eng. 2007, 3, 101–103. [Google Scholar]
  31. Cai, M.; Yang, S.; Zeng, H.; Zhao, C.; Wang, S. A distributed hydrological model driven by multi-source spatial data and its application in the Ili River Basin of Central Asia. Water Resour. Manag. 2014, 28, 2851–2866. [Google Scholar] [CrossRef]
  32. Zhang, C.; Yang, S.; Zhao, C.; Lou, H.; Zhang, Y.; Bai, J.; Wang, Z.; Guan, Y.; Zhang, Y. Topographic data accuracy verification of small consumer UAV. J. Remote Sens. 2018, 22, 185–195. [Google Scholar]
  33. Zhang, W.; Qi, J.; Wan, P.; Wang, H.; Xie, D.; Wang, X.; Yan, G. An easy-to-use airborne LiDAR data filtering method based on cloth simulation. Remote Sens. 2016, 8, 501. [Google Scholar] [CrossRef]
  34. Candela, A.N.G.E.L.A.; Noto, L.V.; Aronica, G. Influence of surface roughness in hydrological response of semiarid catchments. J. Hydrol. 2005, 313, 119–131. [Google Scholar] [CrossRef]
  35. Kalyanapu, A.J.; Burian, S.J.; McPherson, T.N. Effect of land use-based surface roughness on hydrologic model output. J. Spat. Hydrol. 2010, 9. [Google Scholar]
  36. Colomina, I.; Molina, P. Unmanned aerial systems for photogrammetry and remote sensing: A review. ISPRS J. Photogramm. 2014, 92, 79–97. [Google Scholar] [CrossRef] [Green Version]
  37. Pajares, G. Overview and current status of remote sensing applications based on unmanned aerial vehicles (UAVs). Photogramm. Eng. Remote Sens. 2015, 81, 281–330. [Google Scholar] [CrossRef] [Green Version]
  38. Kubecka, J.; Duncan, A. Diurnal changes of fish behavior in a lowland river monitored by a dual-beam echosounder. Fish Res. 1998, 35, 55–63. [Google Scholar] [CrossRef]
  39. Maxwell, S.L.; Smith, A.V. Generating river bottom profiles with a dual-frequency identification sonar (DIDSON). N. Am. J. Fish Manag. 2007, 27, 1294–1309. [Google Scholar] [CrossRef]
  40. Kerr, J.M.; Purkis, S. An algorithm for optically-deriving water depth from multispectral imagery in coral reef landscapes in the absence of ground-truth data. Remote Sens. Environ. 2018, 210, 307–324. [Google Scholar] [CrossRef]
  41. Eugenio, F.; Marcello, J.; Martin, J. High-resolution maps of bathymetry and benthic habitats in shallow-water environments using multispectral remote sensing imagery. IEEE Trans. Geosci. Remote. 2015, 53, 3539–3549. [Google Scholar] [CrossRef]
  42. Irons, J.R.; Dwyer, J.L.; Barsi, J.A. The next Landsat satellite: The Landsat data continuity mission. Remote Sens. Environ. 2012, 122, 11–21. [Google Scholar] [CrossRef] [Green Version]
  43. Anderson, M.C.; Norman, J.M.; Diak, G.R.; Kustas, W.P.; Mecikalski, J.R. A two-source time-integrated model for estimating surface fluxes using thermal infrared remote sensing. Remote Sens. Environ. 1997, 60, 195–216. [Google Scholar] [CrossRef]
  44. Entekhabi, D.; Njoku, E.G.; O’Neill, P.E.; Kellogg, K.H.; Crow, W.T.; Edelstein, W.N.; Entin, J.K.; Goodman, S.D.; Jackson, T.J.; Johnson, J.; et al. The soil moisture active passive (SMAP) mission. Proc. IEEE 2010, 98, 704–716. [Google Scholar] [CrossRef]
  45. Lim, K.; Treitz, P.; Wulder, M.; St-Onge, B.; Flood, M. LiDAR remote sensing of forest structure. Prog. Phys. Geogr. 2003, 27, 88–106. [Google Scholar] [CrossRef] [Green Version]
Figure 1. Study area and in-situ river hydrological parameters. R3 is a third-grade river, R4 is a fourth-grade river, and R5 is a fifth-grade river.
Remotesensing 12 02155 g001
Figure 2. Flowchart of this study.
Remotesensing 12 02155 g002
Figure 3. Schematic of the three river profiles. W is the river width, S is the length of the cross-section of the river channel, and H is the water depth.
Remotesensing 12 02155 g003
Figure 4. Schematic of the river channel survey and hydrological parameters obtained from the UAV. W is the width of the water surface, L is the length of the river channel, H is the elevation of the river channel, and S is the horizontal distance of the river channel.
Remotesensing 12 02155 g004
Figure 5. Sketch map of the relationship between the river water depth and the width of the water surface for triangular or trapezoidal river cross-sections.
Remotesensing 12 02155 g005
Figure 6. Validation of the calculated river discharge from the UAV.
Remotesensing 12 02155 g006
Figure 7. Comparison of the river discharges from the GF-2, SPOT-5, and Sentinel-2. (A): Performance of the GF-2 for calculating the river discharge; (B): Performance of the SPOT-5 for calculating the river discharge; (C): Performance of the Sentinel-2 for calculating the river discharge; (D): Comparison of the river discharges from the SPOT-5 and Sentinel-2.
Remotesensing 12 02155 g007
Figure 8. Comparison of the discharge results calculated from the UAV and GF-2 data.
Remotesensing 12 02155 g008
Figure 9. Sensitivity analysis of the key parameters in the formula.
Remotesensing 12 02155 g009
Table 1. Parameters used in the calculations of the formula.
MethodKey Parameters in the FormulaUAV SurveyUAV CalculationPrior Knowledge In-Situ Measurement
MSF1) A; 2) Δ H
3) L; 4) k
5) R; 6) n
7) S; 8) J
9) h
1) Δ H
2) L
1) A; 2) R
3) S; 4) J
1) k
2) n
1) h
Table 2. Remote sensing data from the GF-2, SPOT-5, and Sentinel-2 satellites.
Date SourceSelected BandSpatial ResolutionTemporal
Resolution
Spectral
Range
Selected
Date
GF-2Pan1 m5 d450–900 nm20171101
20171113
20171117
20171121
20171125
20171129
SPOT-5Pan2.5 m26/4-5 d490–690 nm20090517
20100910
20110817
20130806/0906
Sentinel-2Visible
(blue, green, red)
10 m5 dBlue: 490 nm
Green: 560 nm
Red: 665 nm
20150714/0821
20160518/0717
20170523/0925
20180523/0619
Table 3. Specifications of the aerial remote sensing data and the UAV platform used in this study.
Name of Flight ParametersValue of Flight Parameters
UAV typePhantom-4-pro
Aircraft Weight1338 g
Max Ascent Speed
Max Descent Speed
Max Speed
Max Service Ceiling Above
Max Flight Time
Operating Temperature
Satellite Positioning
Systems
S-mode: 6 m/s; P-mode: 5 m/s
S-mode: 4 m/s; P-mode: 3 m/s
72 kph (S-mode); 58 kph (A-mode); 50 kph (P-mode)
6000 m
Approx. 30 min
0–40 °C
GPS/GLONASS
Controllable RangePitch: –90 to +30°
CameraFC300X
Camera type
Sensor
Sensor Bands
Lens
ISO Range
Mechanical Shutter
Electronic Shutter
Max Image Size
Still Photography Modes
Photo
1″CMOS; Effective pixels: 20 M
3 (R, G, B)
FOV (Field of View) 84°, 8.8 mm, f/2.8–f/11
100–3200 (Auto)
8-1/2000 s
8-1/8000 s
3:2 Aspect Ratio: 5472 × 3648
Single Shot, Burst Shooting: 3/5/7/10/14 frames
JPEG, RAW, JPEG + RAW

