1. Introduction
One possibility to monitor and evaluate forest vegetation is to use Earth Observation (EO) methods. EO provides unique information for the purpose of observing dynamic phenomena on the Earth’s surface [
1]. Satellites are equipped with various sensors that provide images with information that the human eye cannot see. This is especially useful for detecting the early stages of forest disturbance when there are no visual signs of damage [
2]. One of the most beneficial outputs based on EO is the worldwide databases of status and changes of forest areas [
3], the databases of forest area changes for Eastern Europe [
4], or the databases of systematically addressed changes in forest areas, both in North and South America (e.g., in Brazil and Colombia) [
1,
5,
6,
7,
8,
9]. Other authors evaluated a forest affected by bark beetles with vegetation indices from Landsat images, and the subsequent pixel classification achieved a total accuracy of 80–82% [
10] or focused on the classification of three categories of the forest using the maximum likelihood classifier: healthy trees, damaged trees, and grasslands [
11].
The forest bark beetle calamity itself can be divided into the green-attack (without visible damage), followed by a red-attack (the first visible phase of the death of trees), and finally a gray-attack (dead trees). This method successfully separated the red-attack trees from the healthy trees and the grasslands using the RGI (red green index) and reflectivity in the green band with an overall classification accuracy of 86%. The SWIR (short-wavelength infrared) band effect was demonstrated in detecting forest disturbances using time series (TS) methods [
12]. In Central Europe, evaluations of the state and changes in forest vegetation using Landsat have been presented by many studies [
13,
14,
15,
16]. EO data have often been used in the evaluation of forests in Czechia, which have been struggling with long-term disturbances (wind calamities or the subsequent bark beetle invasions) [
17,
18,
19,
20,
21].
To determine the state and the changes of the forest vegetation from the satellite images, the key information was found in the spectral properties of the vegetation species studied [
22]. The suitability of the multispectral data and the vegetation indices calculated from these could differ in the monitoring of the forest vegetation and how it was proven in various studies [
20,
23,
24,
25,
26,
27,
28]. The unanswered question is of which real spectral differences measured during the observed years are relevant to determine the characteristics and individual phases of the forest disturbance. TS methods are often used for the evaluation of the forest changes. For TS purposes, a whole range of satellite data can be used. For choosing a data type, the availability and suitability of the images, especially in terms of time and the radiometric and spatial resolution, need to be considered [
29].
Due to the availability of the free access archive, Landsat’s satellite imagery archive is one of the most commonly used archives for a wide range of disciplines [
30]. Landsat data provides visible, NIR (near-infrared) and SWIR bands that have often been used in the evaluation of forest degradation affected by a disturbance, e.g., the bark beetle calamity. Landsat TM data have proved to be effective for detecting the red-attack phase of the bark beetle disturbance [
31]. From a temporal point of view, it is appropriate to use the Landsat mission data for a longer TS, especially as their time coverage is longer than 40 years. However, looking at the number of acquisitions per year, the 16-day temporal resolution is a limiting factor that is even lower due to cloud coverage, especially in mountainous areas [
1,
30]. In the case when there are only a few images during the year, then only one chosen reference image per year is often used [
19]. Some studies tried to combine a range of different types of satellite data, e.g., Landsat with MODIS data [
32]. In the case of a long TS period (more than 20 years), various radiometric and spectral resolutions of the acquired data can influence the results of the TS due to different types of sensors [
33].
The Copernicus program has brought a new revolution in EO monitoring. ESA is developing new missions of satellites called Sentinels specifically for the operational needs of the Copernicus program. The images are received via two parallel missions 2A and 2B and in the case of the overlapping scenes, the temporal resolution is less than five days [
34]. The Sentinel-2 multispectral optical dataset is now available with the ambition to provide data with better resolutions (spatial, temporal, and spectral) than the traditional data like Landsat. The Sentinel-2 data have been available since 2015; therefore, the archive is ready to be tested with the TS analyses. The spectral vegetation indices calculated from Sentinel-2 have a potential for mapping and detecting changes induced by bark beetle attack, particularly based on the red-edge bands or water-related indices. These changes are limitedly detectable by Landsat-8 due to the lower spectral and spatial resolution of the OLI sensor; see the comparable study [
2] with 67% accuracy for Sentinel-2 and 36% accuracy for Landsat 8.
Several articles have been written for the TS of the Sentinel-2 data, e.g., focused on mapping floodplain grassland plant communities, where the authors dealt with the variability in the water content using TS, especially with TS using the support vector machine and random forest classifiers [
35]. Other authors [
36] focused on observing the Cotton Belt using the TS of the Sentinel-2 data. The authors used random forest classification and several kinds of vegetation indices for their time survey. The temporal and spatial resolution played an important role in the observation of the TS [
37,
38,
39]. For this reason, a fusion of the Landsat 8 and Sentinel-2, called harmonized datasets, has been designed [
40,
41,
42].
Few articles have been written for the TS of the Sentinel-2 focused on forest vegetation, e.g., that dealt with the recognition of unhealthy cork oaks (
Quercus suber) [
43]. Based on a multitemporal comparison (using vegetation indices), researchers found that while in the wetter part of the year, the differences were small, and, during the drier part of the year (September and October), the differences between the healthy and unhealthy cork oak stands were more significant. Another study focused on forest growth using the Sentinel-2 TS [
44] and attempted to determine how to distinguish bamboo forests (
Phyllostachys pubescens) from coniferous or deciduous forests using the annual course of the vegetation indices (NDVI, NDMI, etc.). The results prove that May is the best month to distinguish bamboo stands from other forest types. Another study [
45] showed that the classification of forest types using the random forest method based on the Sentinel-2 TS proved a high relevancy of the red-edged bands.
A perspective method in the processing of RS data is cloud computing. The Sentinel Hub is one of the most used cloud-based applications, and this application allows effective and end-user friendly processing and analysis of the EO data (
https://www.sentinel-hub.com). It is a user interface app for the semi-automatic satellite data analysis created by Sinergise [
46]. This platform provides satellite images from various missions, e.g., Sentinel, Landsat, or MODIS. The Sentinel Hub allows the downloading, the visualization of the satellite imageries, scripting to calculate the vegetation indices, classifications, and other analyses, as well as using WMS (Web Map Service) services to extract the selected values for the given site and period [
46,
47].
One of the current problems in the forest ecosystems of central Europe is bark beetle calamities [
18]. Their overgrowth is closely related to the climate change and the spread of non-indigenous coniferous trees in central Europe, e.g., spruce (
Picea abies) [
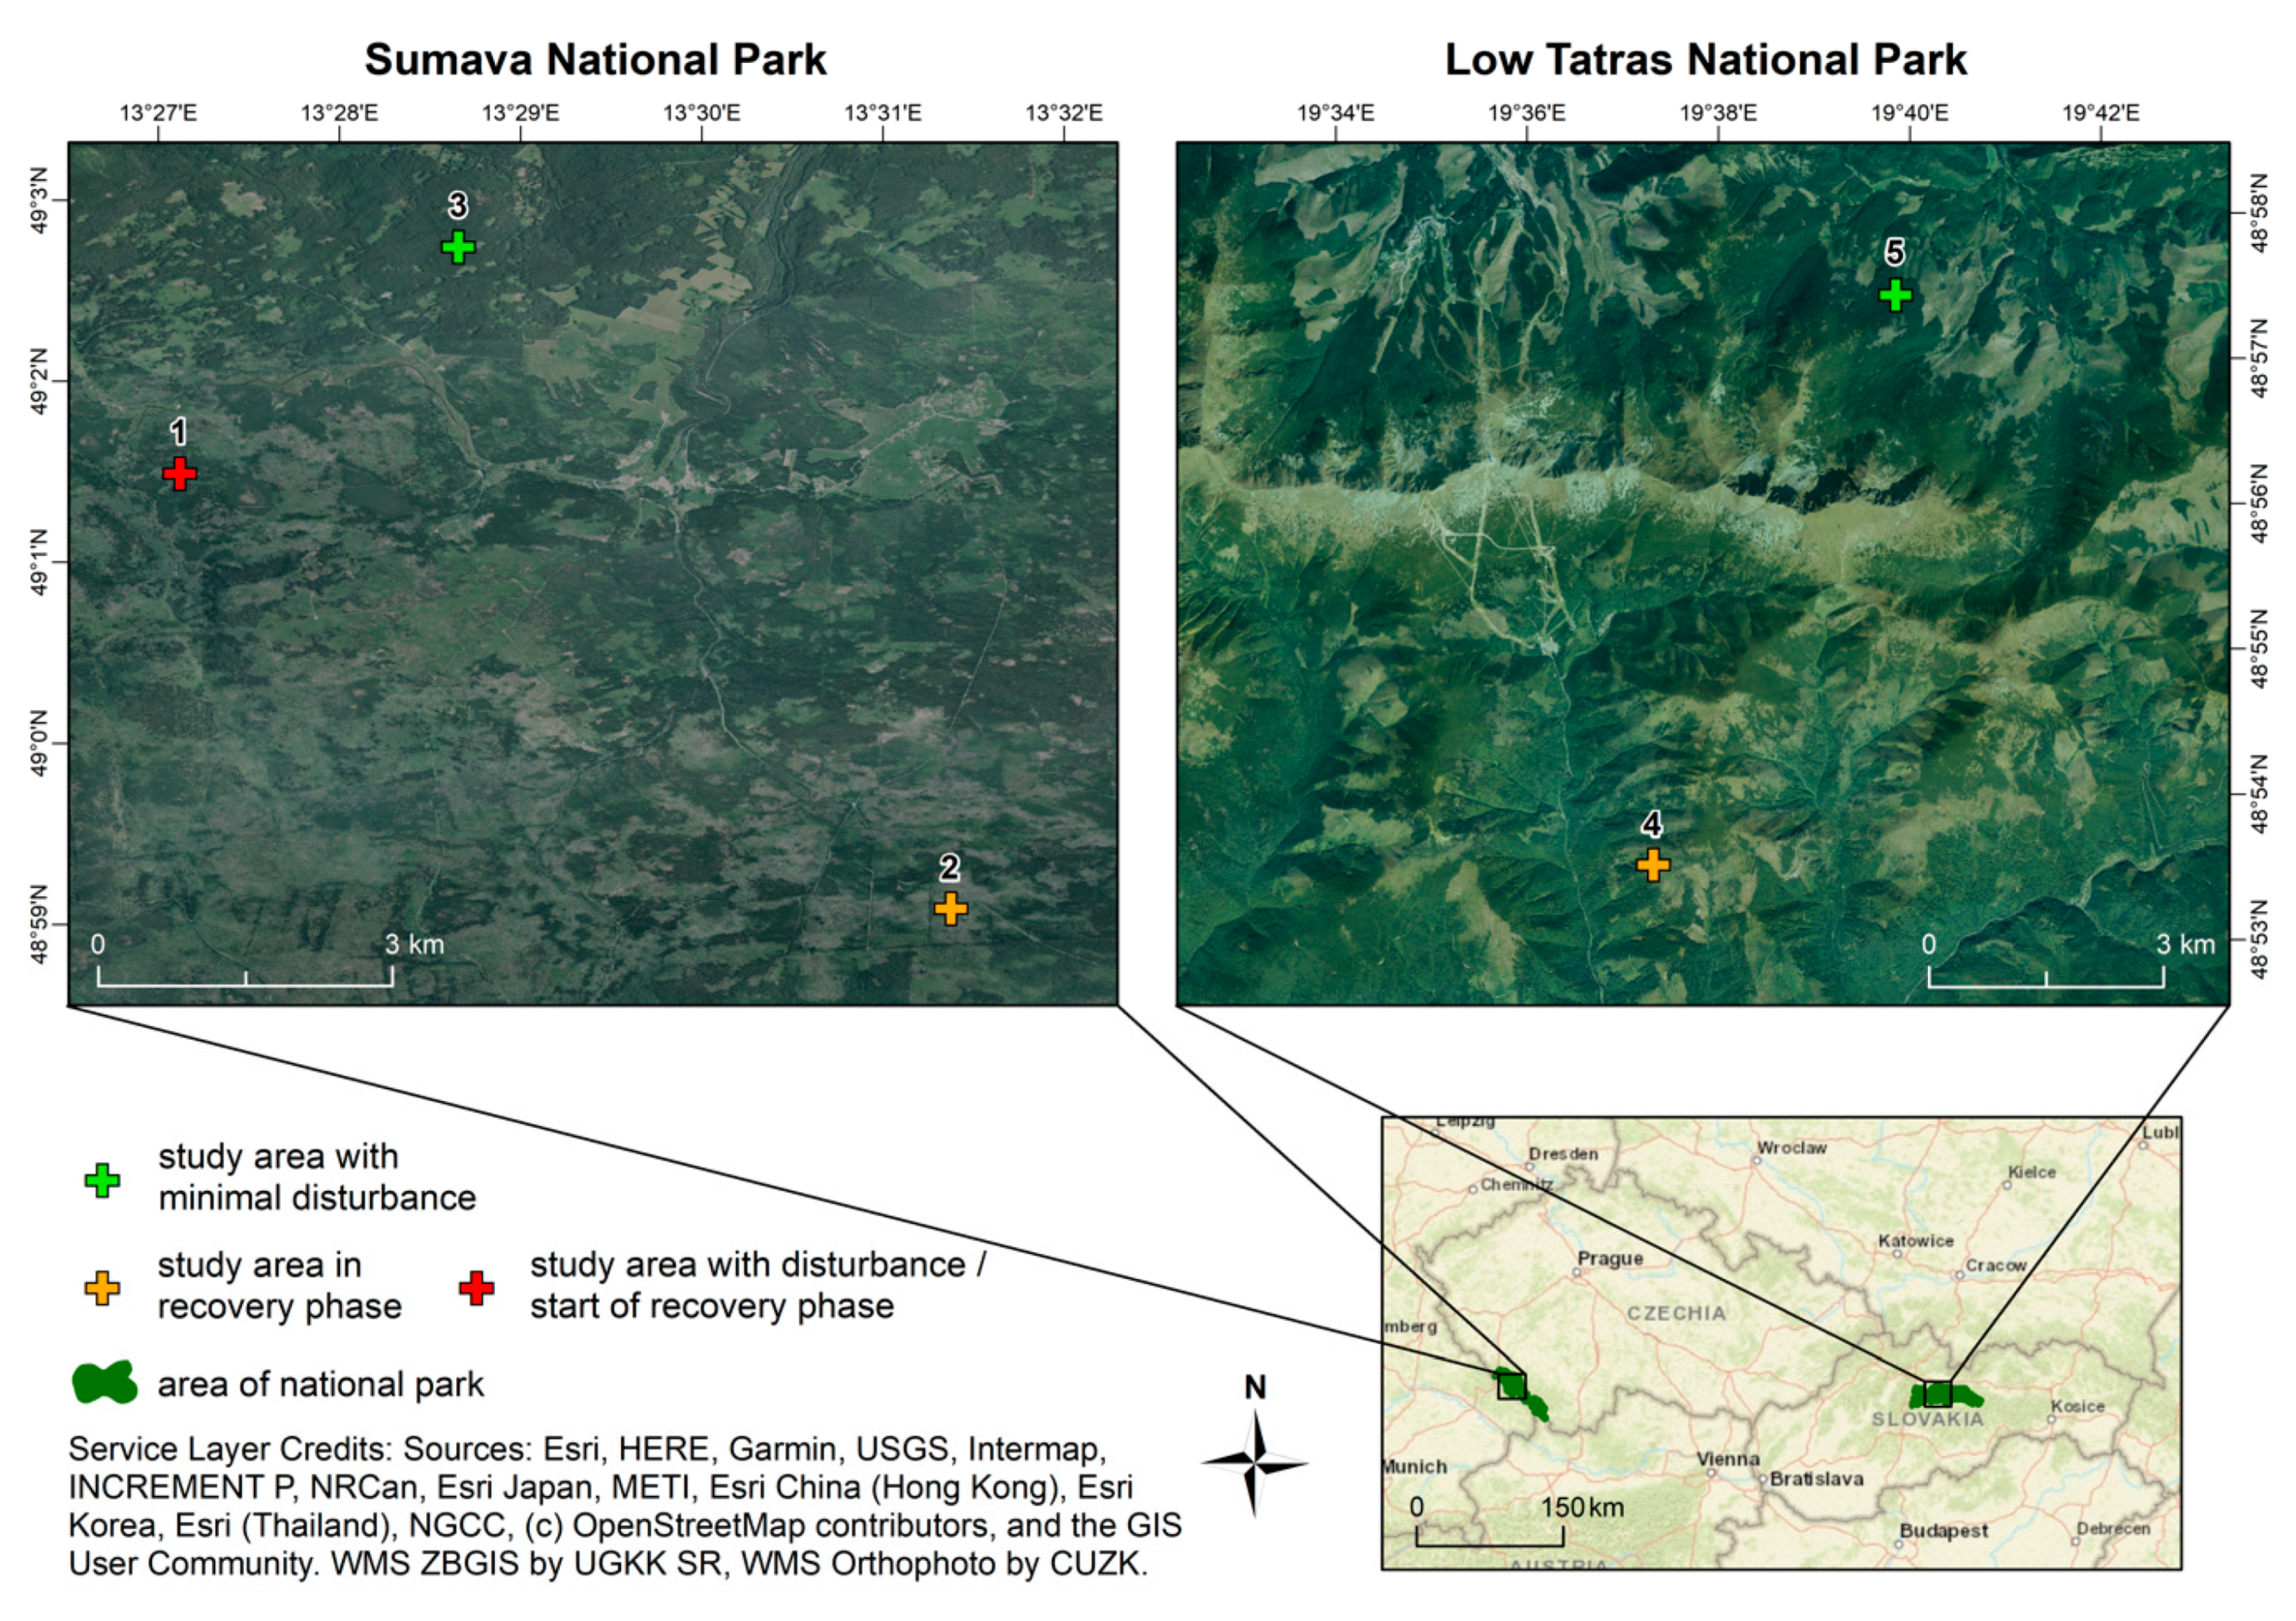
48]. This study is focused on an evaluation of the changes in the forest vegetation in selected areas of the Low Tatras National Park (Slovakia) and the Sumava National Park (Czechia) using the TS methods. The analysis of the TS is based on Sentinel-2 images (description in
Table A1; with a comparison to the Landsat data). Due to the dynamic changes in the forests in Czechia and Slovakia that occurred over the last several years, it is a suitable opportunity to apply the Sentinel-2 TS for the detection of disturbing events (bark beetle) and to evaluate the forest health status during the individual stages of the disturbance (forest conditions before, during, and after the disturbance events). From this point of view, the main aim and novelty of this study is to use and test the Sentinel-2 data for the evaluation of the dynamic forest changes. The selected vegetation indices and their trajectories of the TS were interpreted and validated in relation to the in situ data investigated during field research or provided by the Administration of National Parks. In the process of collecting and evaluating the data, we cooperated with the Low Tatras National Park and the Sumava National Park. An important part of this study is the evaluation of the applicability of the EO/Sentinel-2 data and the methods in the forest management and the nature protection of national parks. For this reason, big data/cloud data methods of the Sentinel Hub were used.
The main objectives of this study were:
To test the Sentinel-2 data in the TS analyses for the selected case studies in Czechia and Slovakia within a three-year period of 2017–2019 and to evaluate the benefits of the Sentinel-2 data for monitoring the forest changes.
To compare the Sentinel-2 and Landsat temporal and spatial resolution for the TS analyses of the forest vegetation in mountainous areas.
To evaluate the relevancy of the vegetation indices in the study of the forest changes and the health of the forest vegetation using the Sentinel-2 data.
To perform TS analyses and compare the results in the different types of areas affected by the bark beetle invasion (the disturbed and renewing forest ecosystems).
To discuss the positives and perspectives of the Sentinel-2 data in the TS of forest changes in comparison to the traditional data used, e.g., Landsat.
To process the satellite data and perform analyses in the cloud-based tool (Sentinel Hub) and discuss the positives and negatives of cloud-based systems for end-users in forestry research and management.
We would like to give responses for these research questions:
What are the main positives of the Sentinel-2 data in the evaluation of the forest vegetation affected by the disturbances? What type of change in the forest is possible to detect by Sentinel-2? What are the positives using Sentinel-2 data in the TS in comparison with the traditional satellite data, e.g., Landsat?
What are the positives of processing and analyzing the data in a cloud-based tool (Sentinel Hub)?
What vegetation indices derived from the bands of the Sentinel-2 data are useful for the detection of the forest affected by a bark beetle invasion? Which vegetation indices based on these data could detect the disturbances that occurred and individual recovery phases in the forest of mountainous areas? Are the vegetation indices, traditionally used for Landsat data, usable for the Sentinel-2 data?
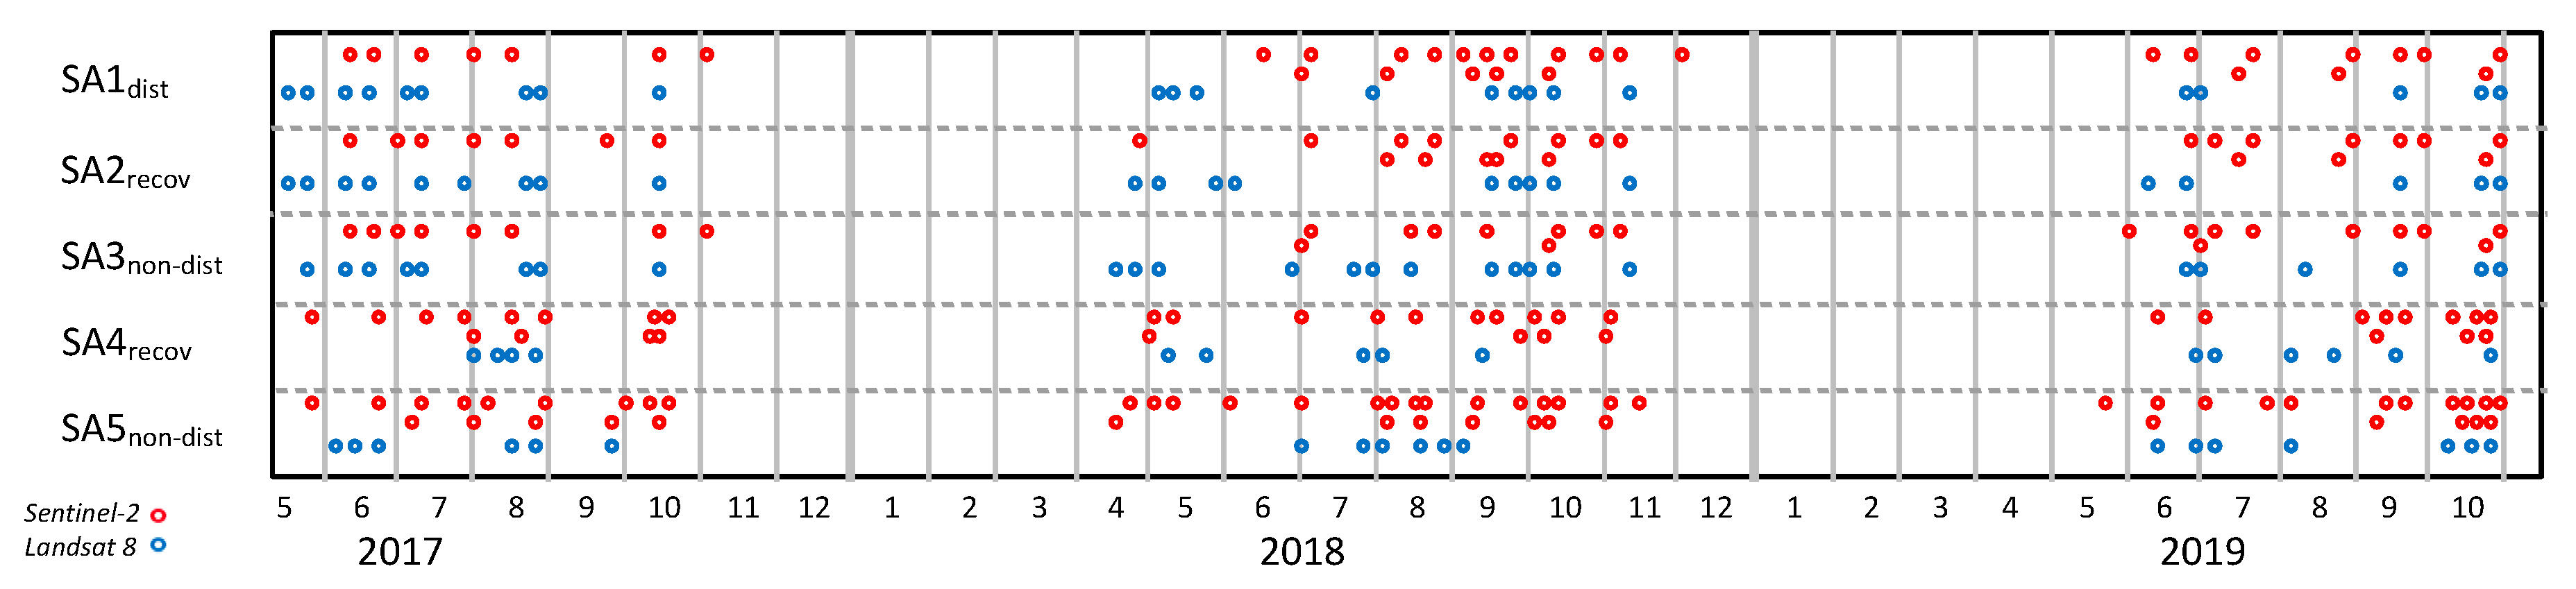
How many cloud-free images of Sentinel-2 are available for the TS analysis in our mountainous areas case studies annually? What is the progress of the data availability per year in comparison with the Landsat data? Is the temporal resolution of the Sentinel-2 data sufficient to detect the changes and the health of the forest within the year?
4. Discussion
Disturbance phenomena, such bark beetle and wind calamities, are one of the most urgent problems in the forest ecosystems of Central Europe. Their overgrowth is closely related to climate changes and the spread of non-indigenous coniferous trees in Central Europe, e.g., spruce (Picea abies). In both observed national parks (the Sumava National Park in Czechia and the NAPANT in Slovakia), spruce is the dominant tree. The dominance of spruce monocultures was caused by foresters due to market-oriented forest management. Currently, under new environmental politics and under the influence of the climate changes, national parks have implemented more environmentally oriented and sustainable management practices, often without any interventions of the foresters. The primary task of that management is to achieve a natural and environmentally stable forest. Spruce monocultures, higher temperatures and abiotic calamities can cause the appropriate conditions for bark beetle calamities. On the other hand, a sustainable management should create a natural ecosystem suitable for richer communities of species compared to the spruce monoculture.
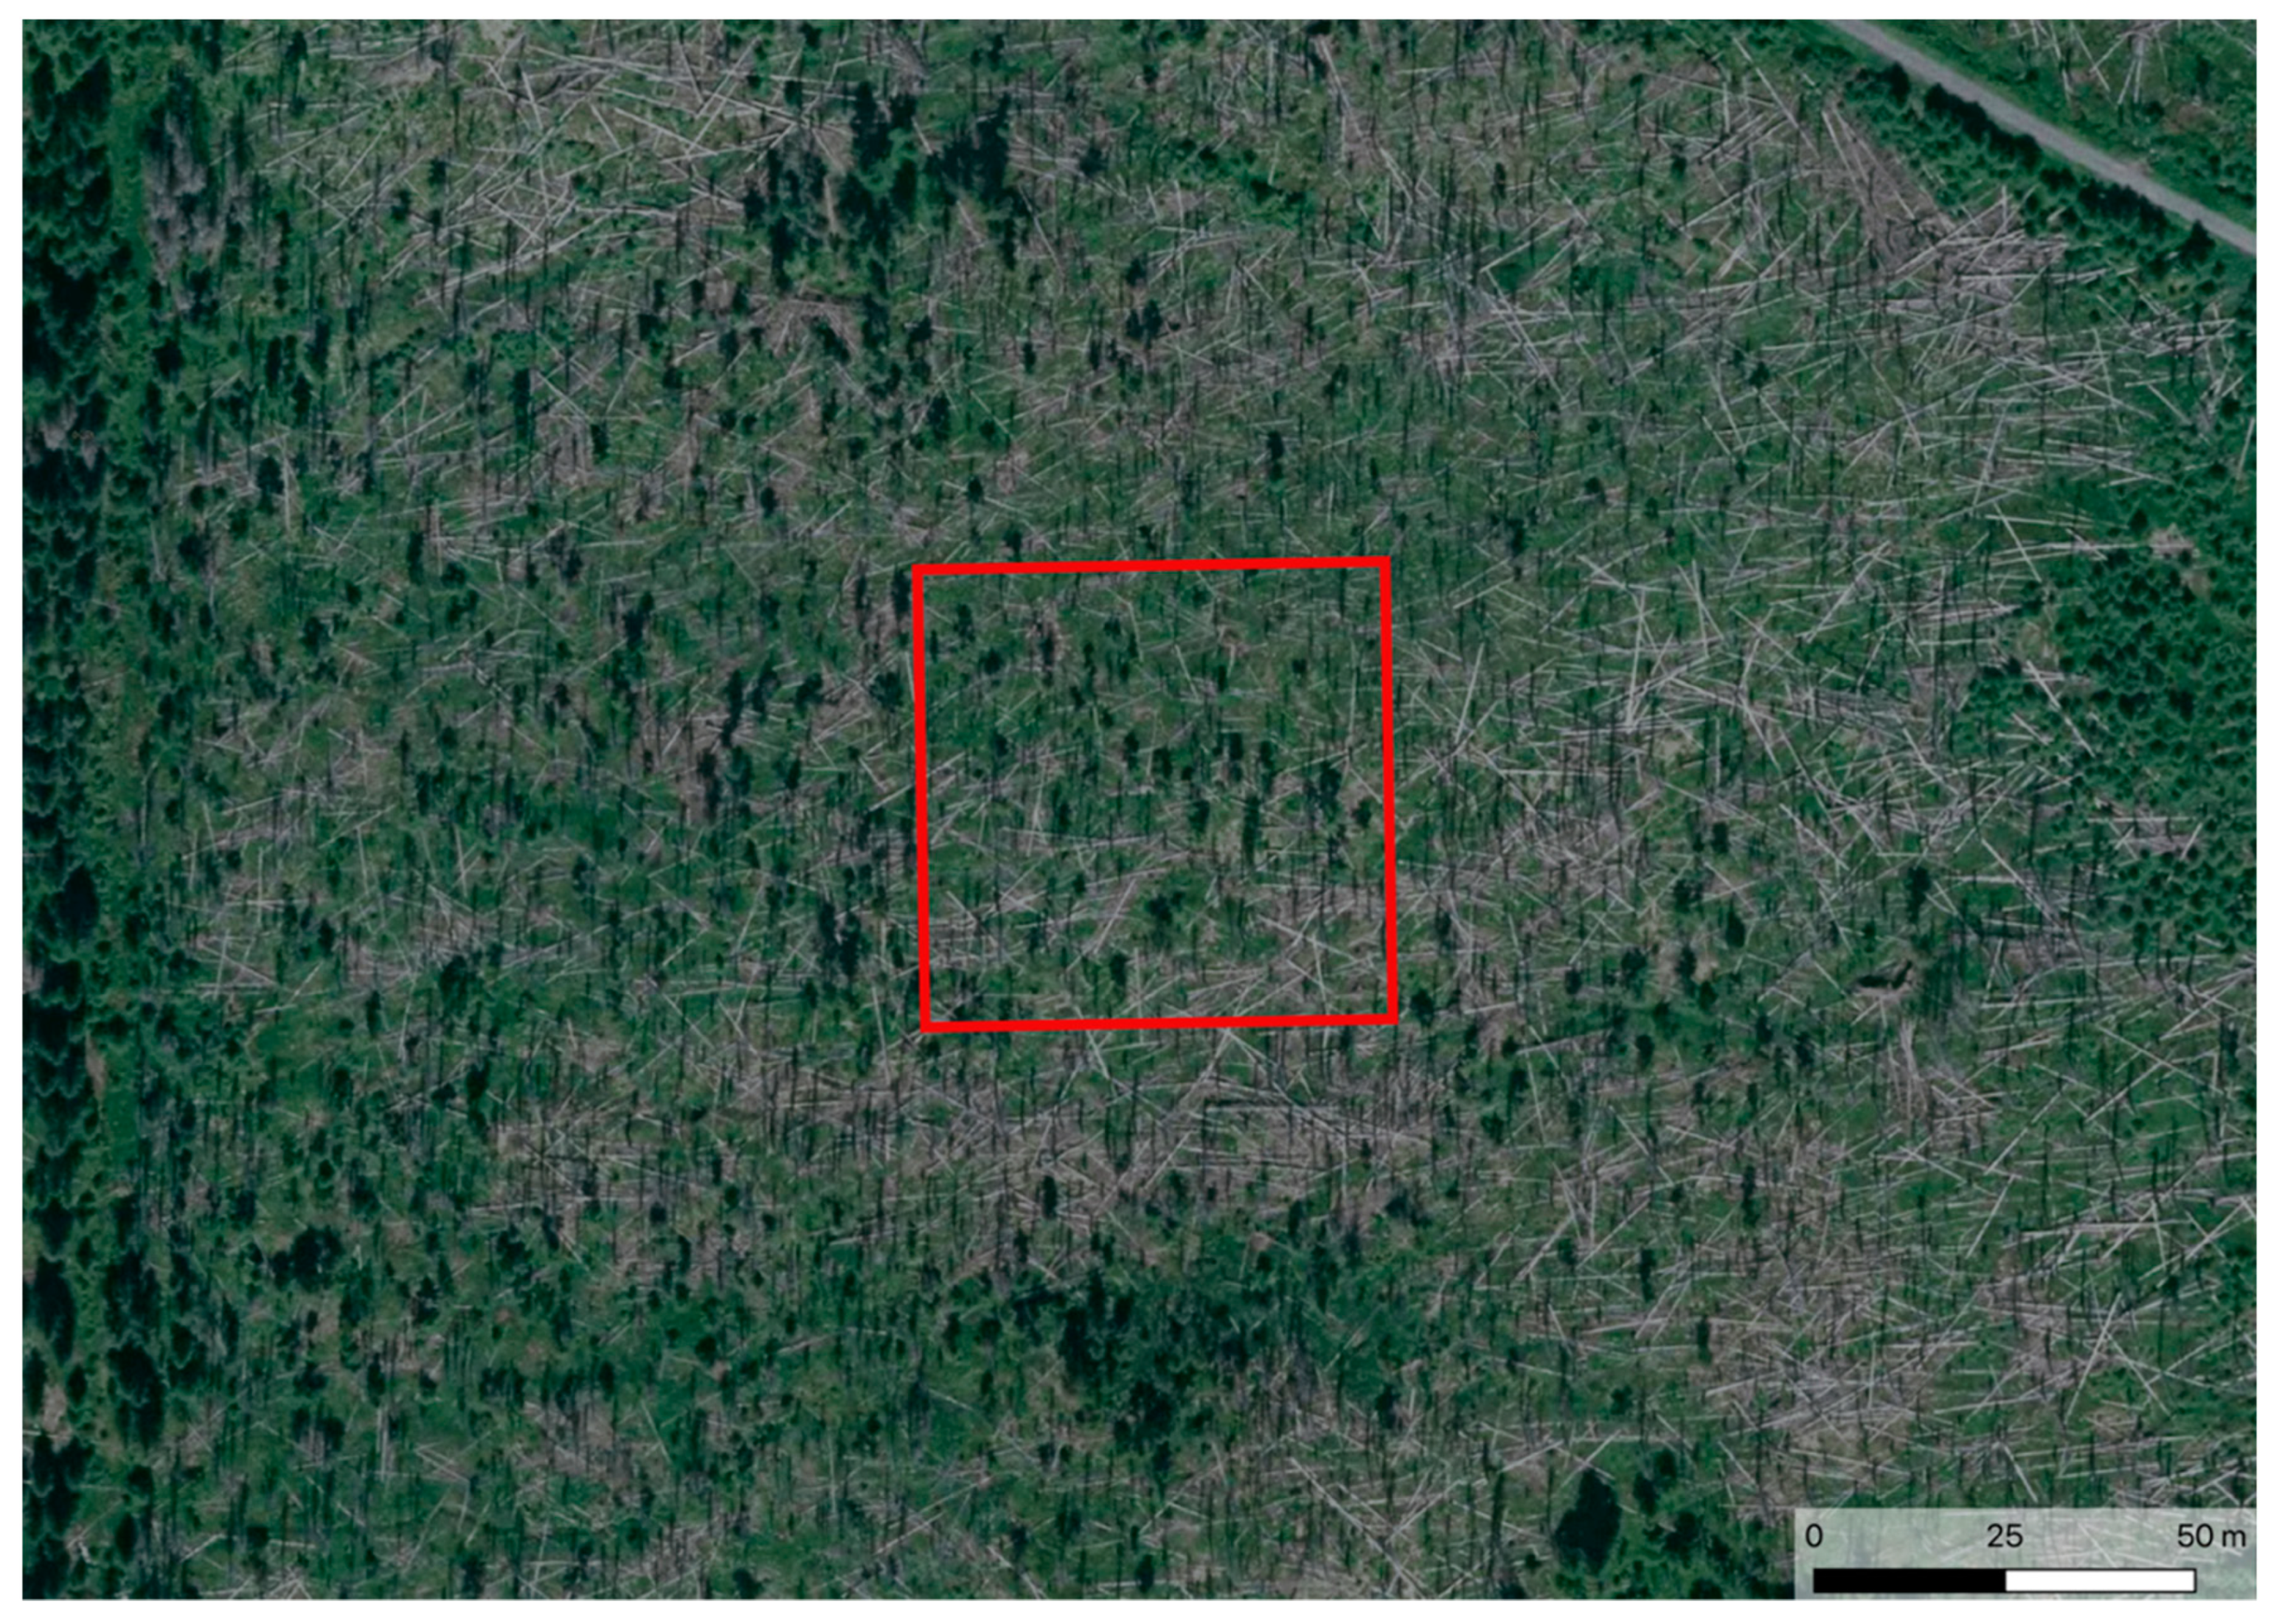
Different approaches are now visible in forest management in Europe. The forests in the NAPANT national park are mostly forestry managed. In the case of the occurrence of a bark beetle outbreak, the obligation of the owner/administrator to cut down the forest in the intervention zone exists. Typically, more than half of the dead trees are harvested after the calamity. However, about 15% of the national park area is currently in a non-intervention mode (SA4recov). In the case of a bark beetle occurrence, an obligation of the owner/administrator to cut down the forest in intervention zone exists, despite the value of the nonprofit functions in the nature–close management of forests. On the other hand, a forest management practice with very limited intervention was implemented in the Sumana NP. Hence, a natural renewal of the forest ecosystem has been taking place in the Sumava NP on a prevailing area. New small trees and shrubs are visible in the recovery territories (SA2recov).
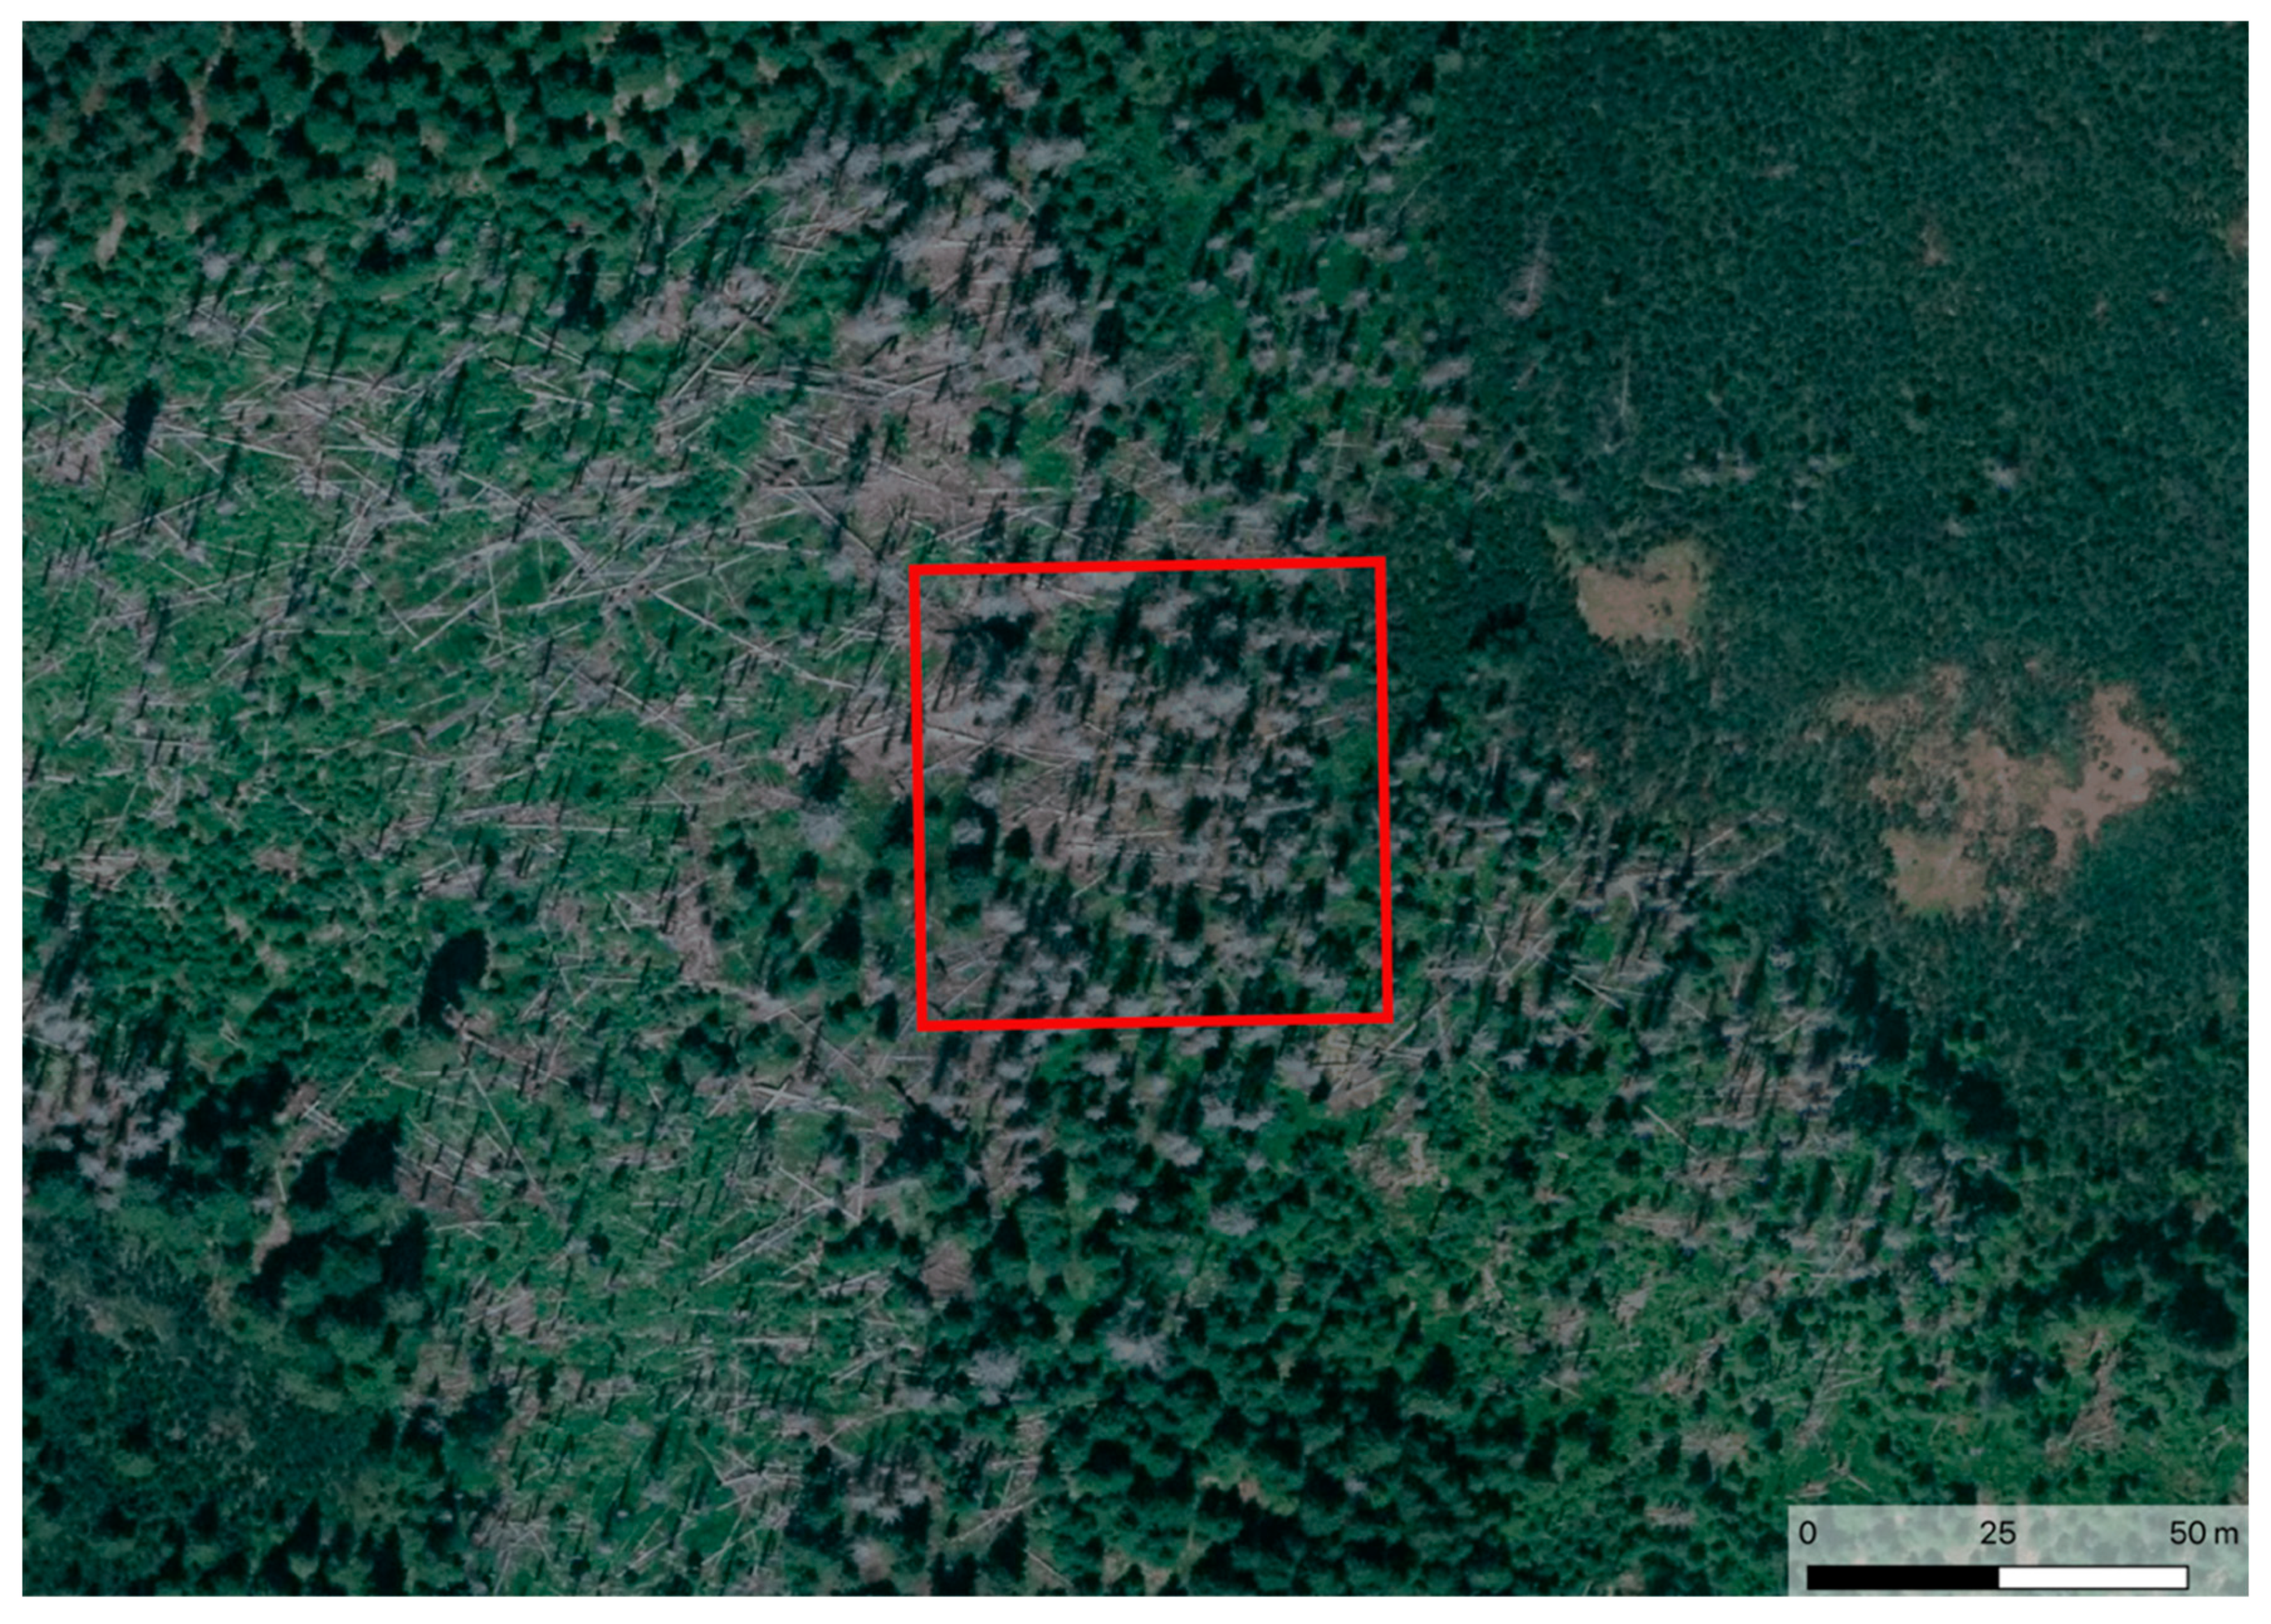
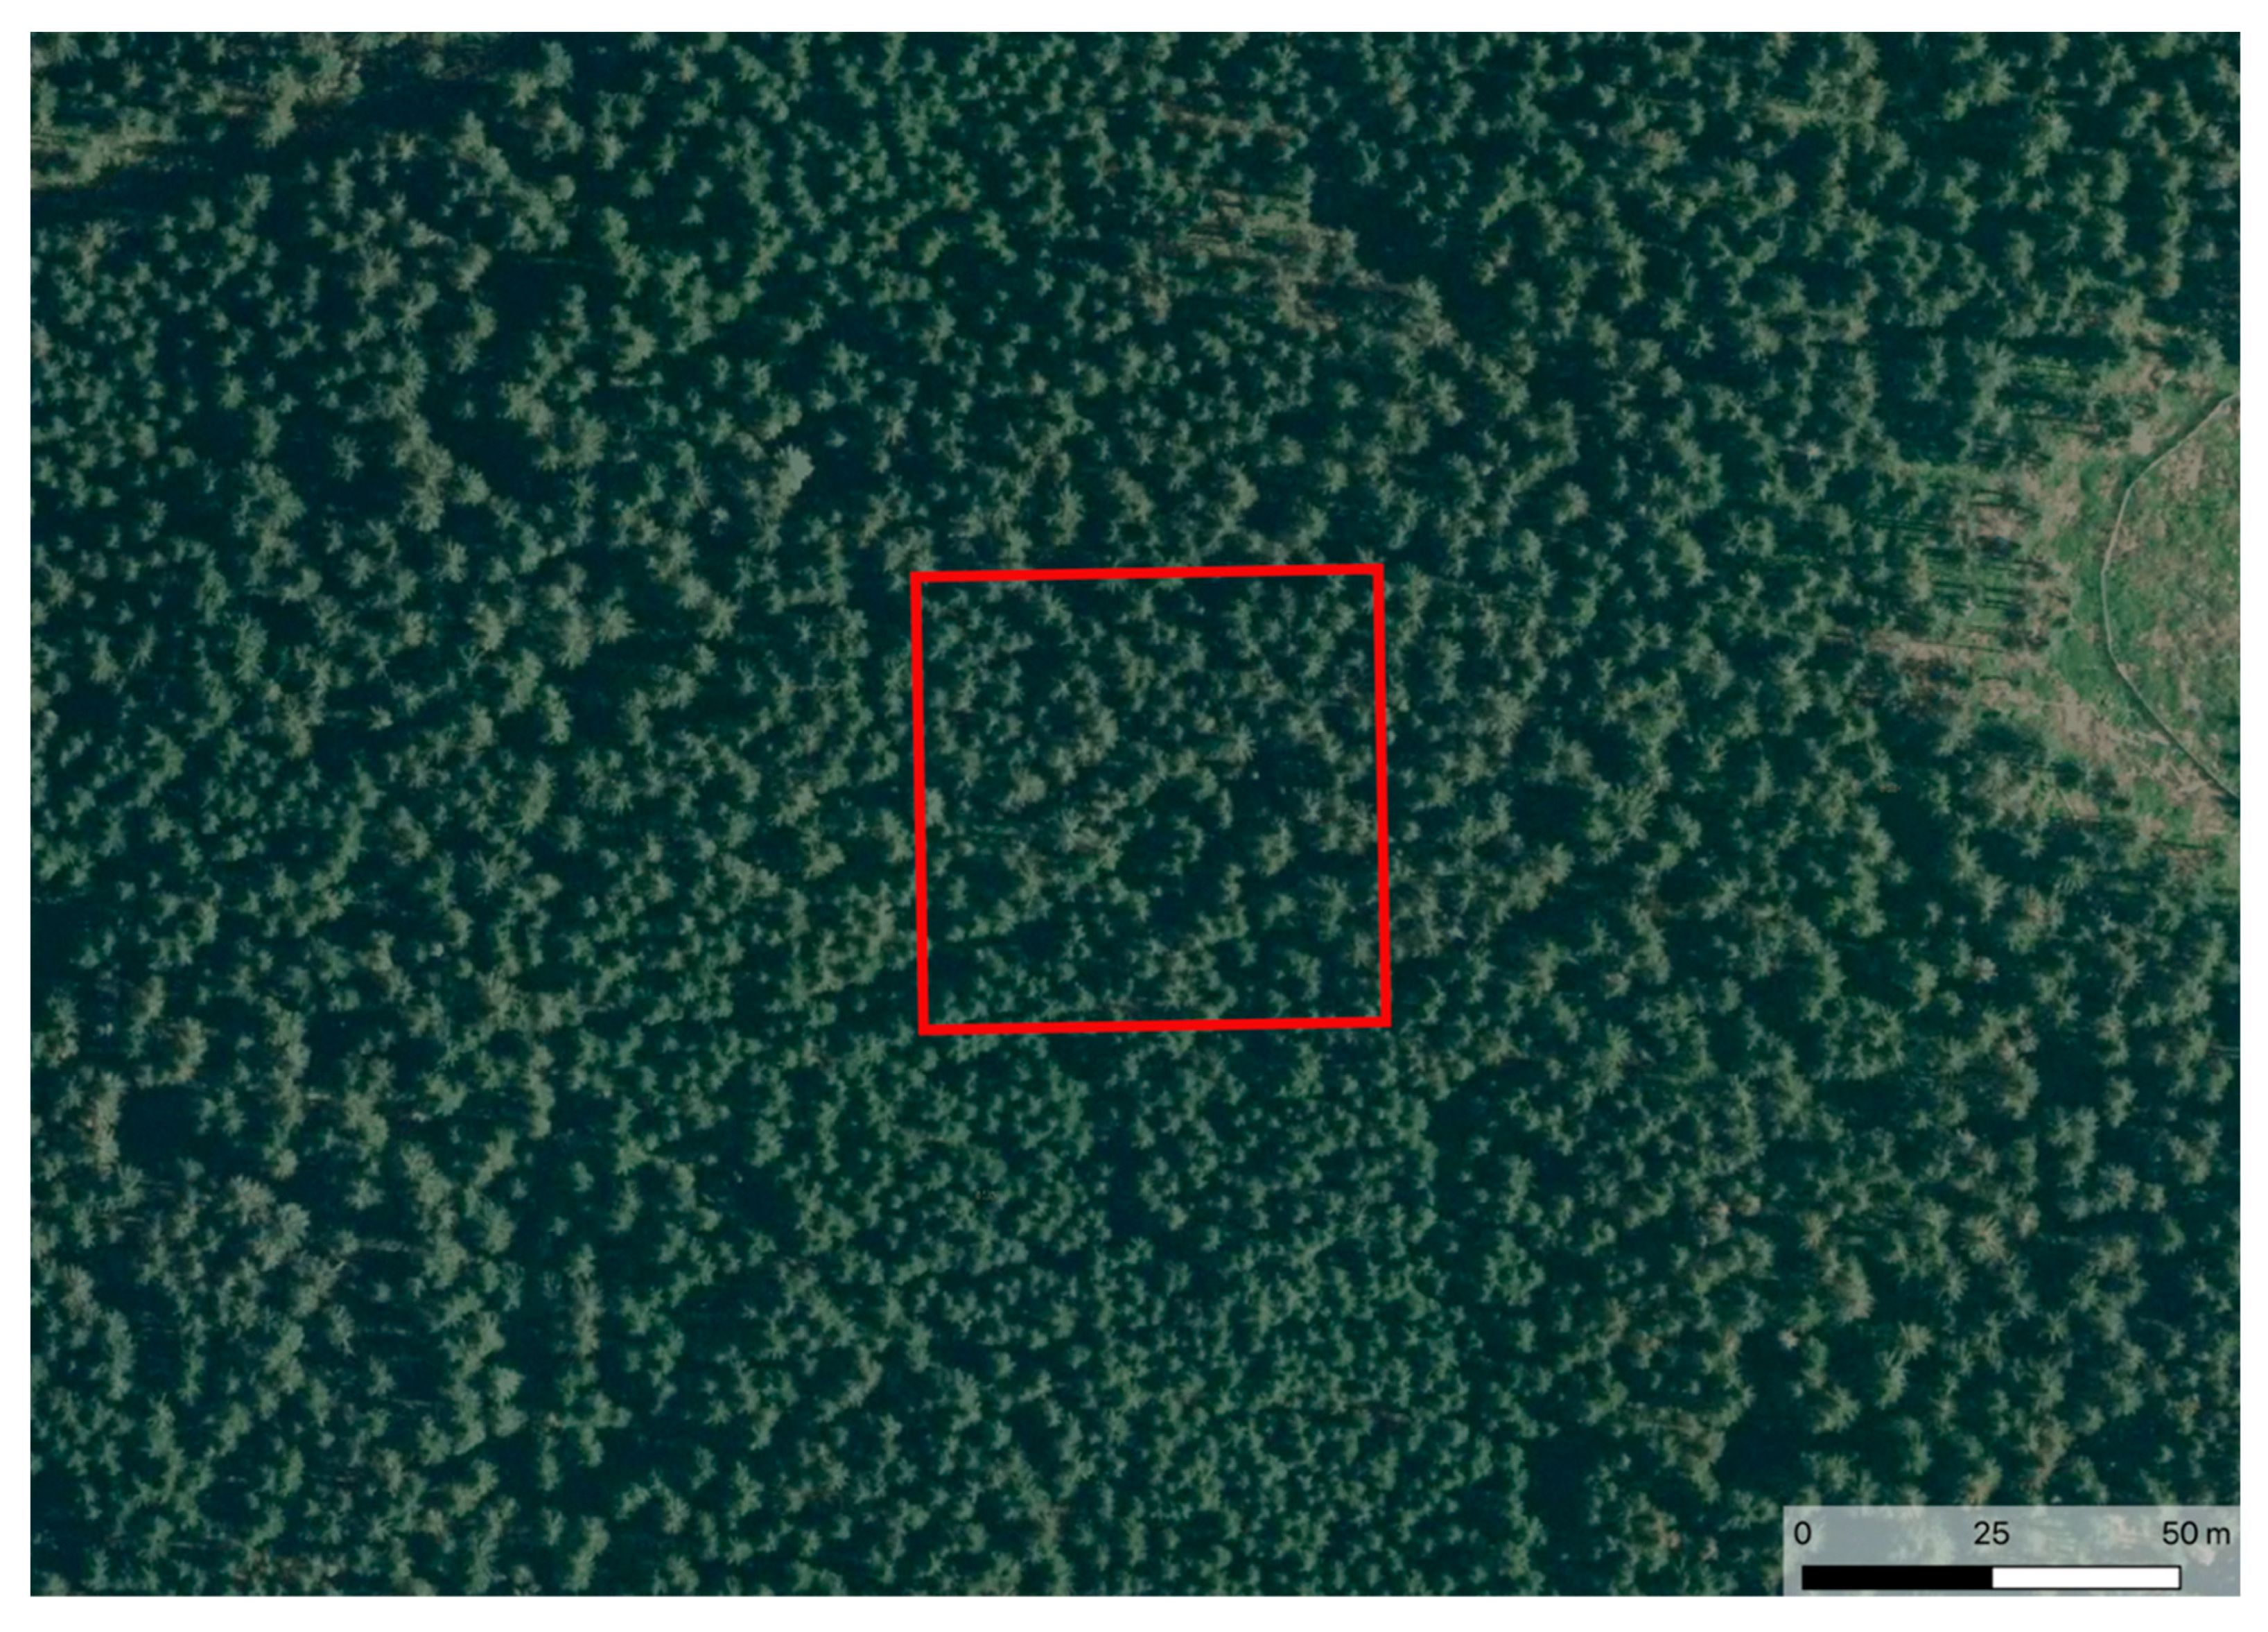
In this study, we applied and tested the Sentinel-2 data for the evaluation and monitoring of the forest ecosystems in Czechia (the Sumava National Park) and Slovakia (the NAPANT). Due to the dynamic changes in the forests in Czechia and Slovakia that occurred over the last years, there exists a suitable opportunity to apply the Sentinel-2 TS for the detection of disturbance events (bark beetle) and to evaluate the forest health (forest condition before, during, and after the disturbance events). For this reason, the study areas represent a forest under different circumstances and development (the dead trees after a bark beetle outbreak, the recovery mode after a bark beetle outbreak, and the forest vegetation without any significant influence). The selected vegetation indices and their trajectories of the TS were interpreted and validated in relation to the in situ data investigated during the field research or provided by the administration of the national parks and to the aerial photographs.
The Copernicus Program with the Sentinel-2 data has brought new opportunities and perspectives in the landscape/forest monitoring. Thanks to the temporal and spatial resolution, we were able to obtain a short TS for observing the health status and changes in the forest ecosystems [
59]. Due to the advanced parameters of the Sentinel mission (e.g., two satellites—Sentinel A and Sentinel B), the Sentinel-2 data allowed us to observe the status and changes of the vegetation repeatedly in a short time period (5 days or less) with multispectral characteristics in the data (13 bands). The Sentinel’s TS with the higher temporal and spatial resolution were undoubtedly one of the greatest benefits of studying regional or even global phenomena [
60]. Other authors [
61] claimed that the probability of acquired cloud-free pixels by the Landsat 8 during a summer period in the U.S. was 0.78.
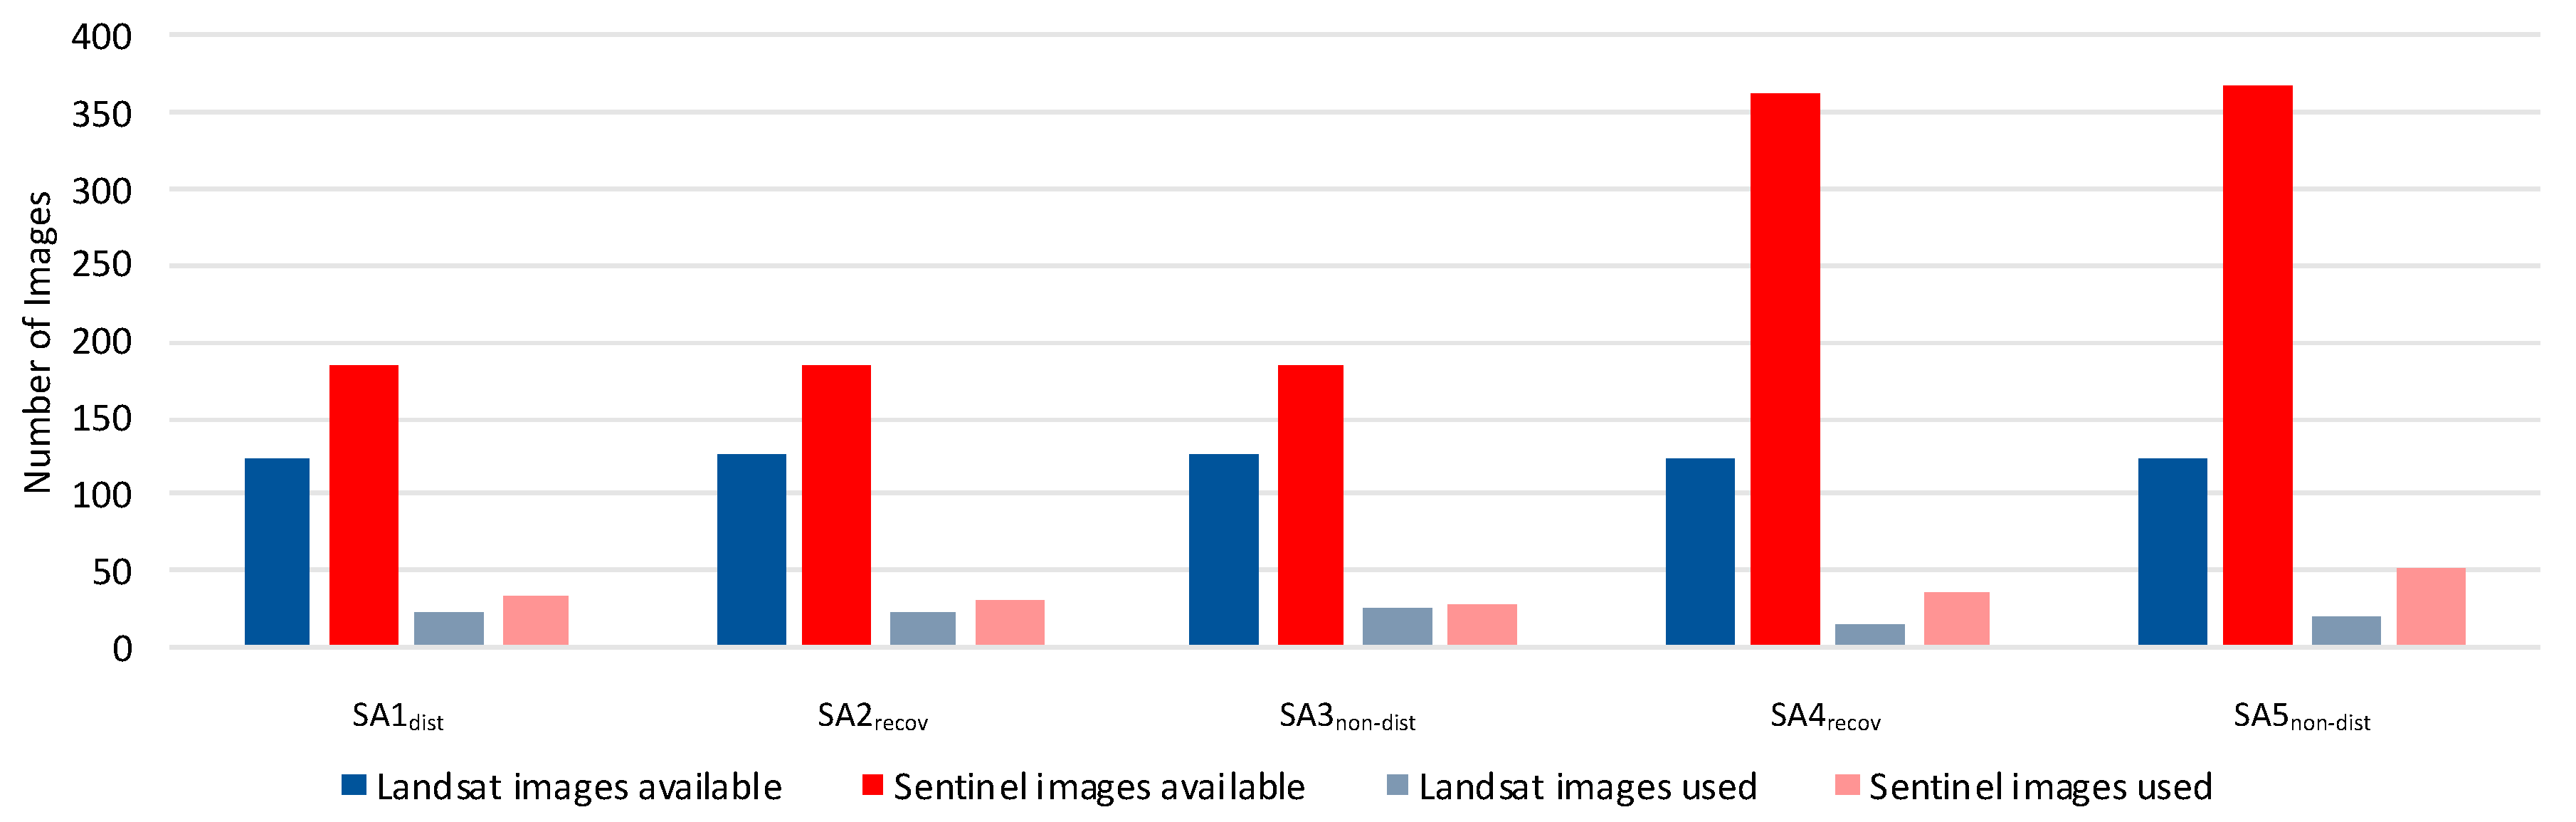
This fact often led researchers to study the changes in the forest over several years rather than during the seasons of the year (phenophases). We proved, in this study, that the Sentinel-2 data had a significantly higher density in the TS when compared with the Landsat 8 data. Clearly, many more images of the Sentinel-2 (2A and 2B), compared with the Landsat images, were available for all the areas in 2018 and 2019. Due to the launch of the Sentinel-2B, the temporal resolution rapidly increased. This resolution is a very important factor for the evaluation of the forest with dynamic changes (e.g., under a disturbance aspect) in mountainous areas where cloud cover is a relevant problem. The Sentinel-2 data brings a new dimension in the data availability and its improved temporal resolution using two satellites (2A and 2B) was more suitable for the monitoring of the forest dynamic than the traditionally used Landsat data.
Concerning the processing of the data with a lower temporal resolution (such as Landsat), several preprocessing steps for preparing the datasets are necessary. To obtain comparable results, it is necessary to use normalization [
20,
62,
63], cross-calibration methods, specialized harmonizing algorithms (like LandsatLinkr [
29]), or to use other methods (like LandTrendr [
64,
65]). However, in the case of the Sentinel-2 data, normalization methods were not necessary for processing for the TS when using the entire set of measurements with a high temporal resolution (outliers caused by inhomogeneity of the environment during the year may be filtered out—or the data may be fit).
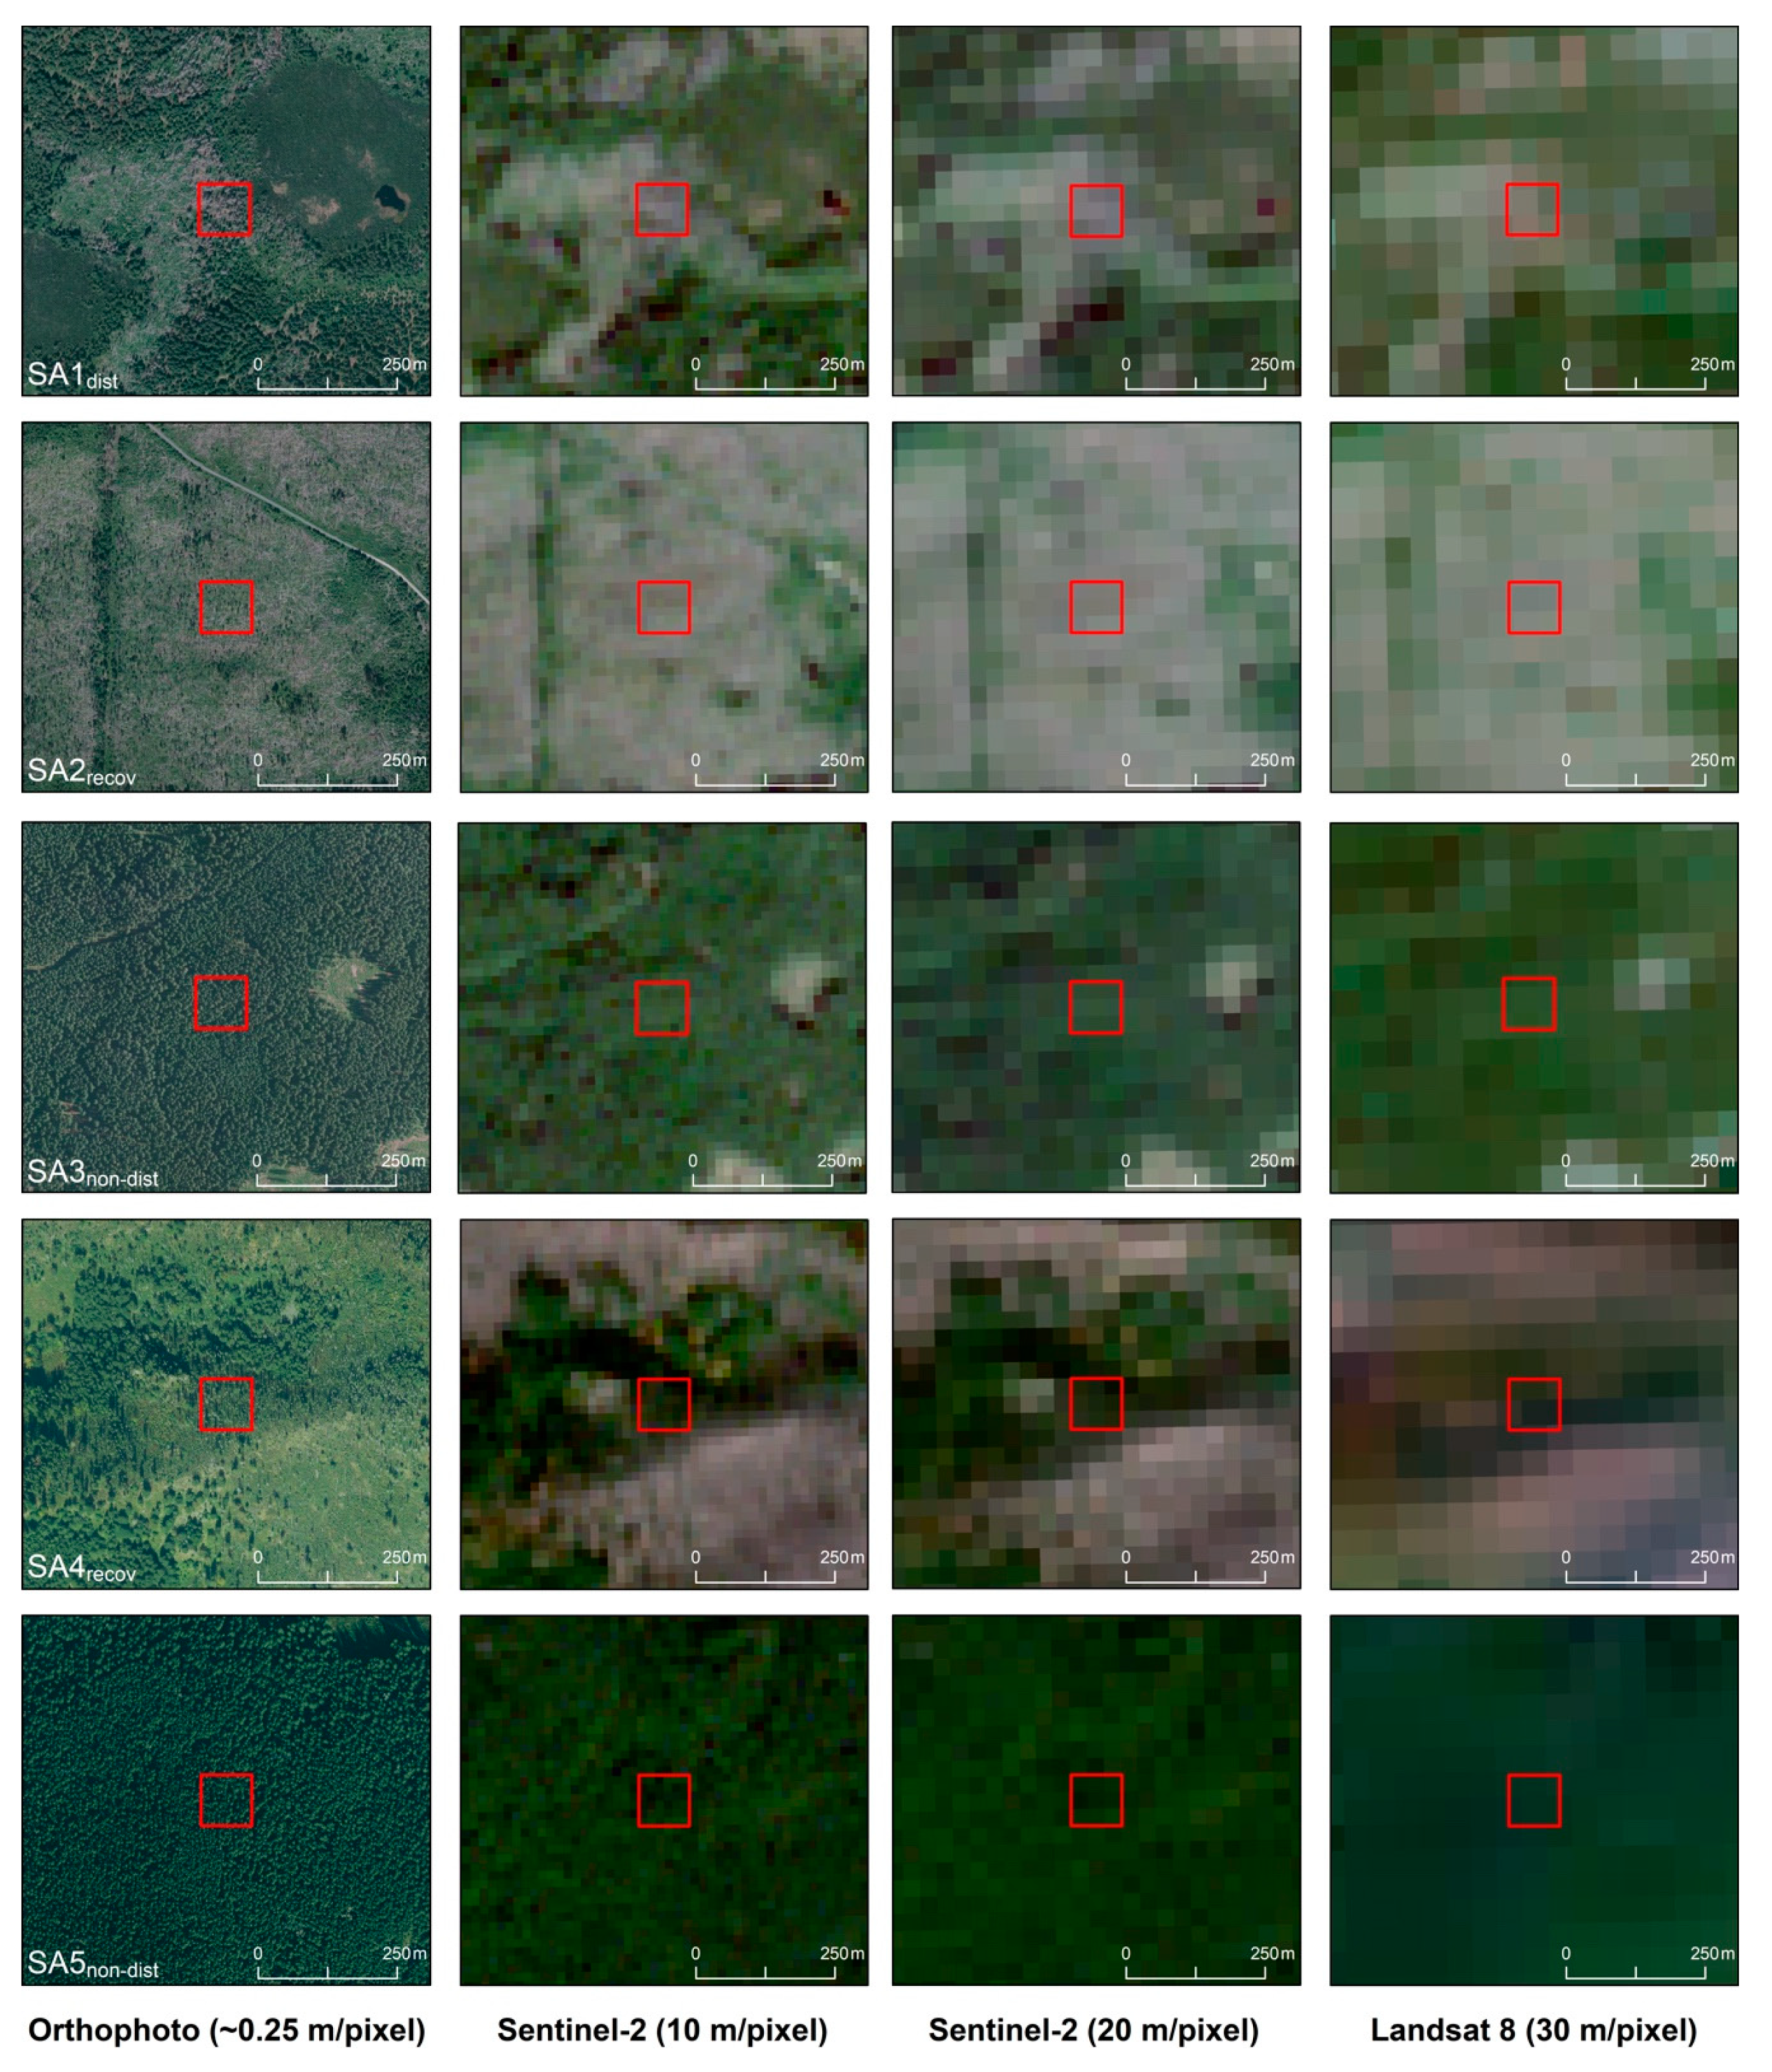
The Sentinel-2 data brought much sharper images, especially due to the 10-m resolution bands. This spatial resolution allowed us to better recognize individual elements, such as damaged forests, shadows, clouds, and other covers. However, due to the low spatial resolution of Landsat, it was difficult to detect cirrus clouds. For the Landsat 8 data, it was possible to use panchromatic images with a 15-m resolution and to perform pan-sharpening methods to obtain a better spatial resolution. However, this was only possible for visible bands and this approach required complex image preprocessing.
The cloud-based Sentinel Hub application was used for the processing and analysis of the Sentinel-2 data. The cloud-based tools allowed for the effective and end-user friendly processing and analysis of the EO data. An advantage of the Sentinel Hub was the option to prepare and use scripts in the Configuration Utility for the semi-automatic processing of the data and the calculation of the indices from the Sentinel-2 data (NDVI, NDMI, tasseled cap greenness, and tasseled cap wetness). The Sentinel Hub also contained prepared algorithms for the calculation of the most used indices. Performing land use/land cover classifications and other image analyses was also possible. Several programming scripts using JavaScript language were written for the calculation of the vegetation indices in this study.
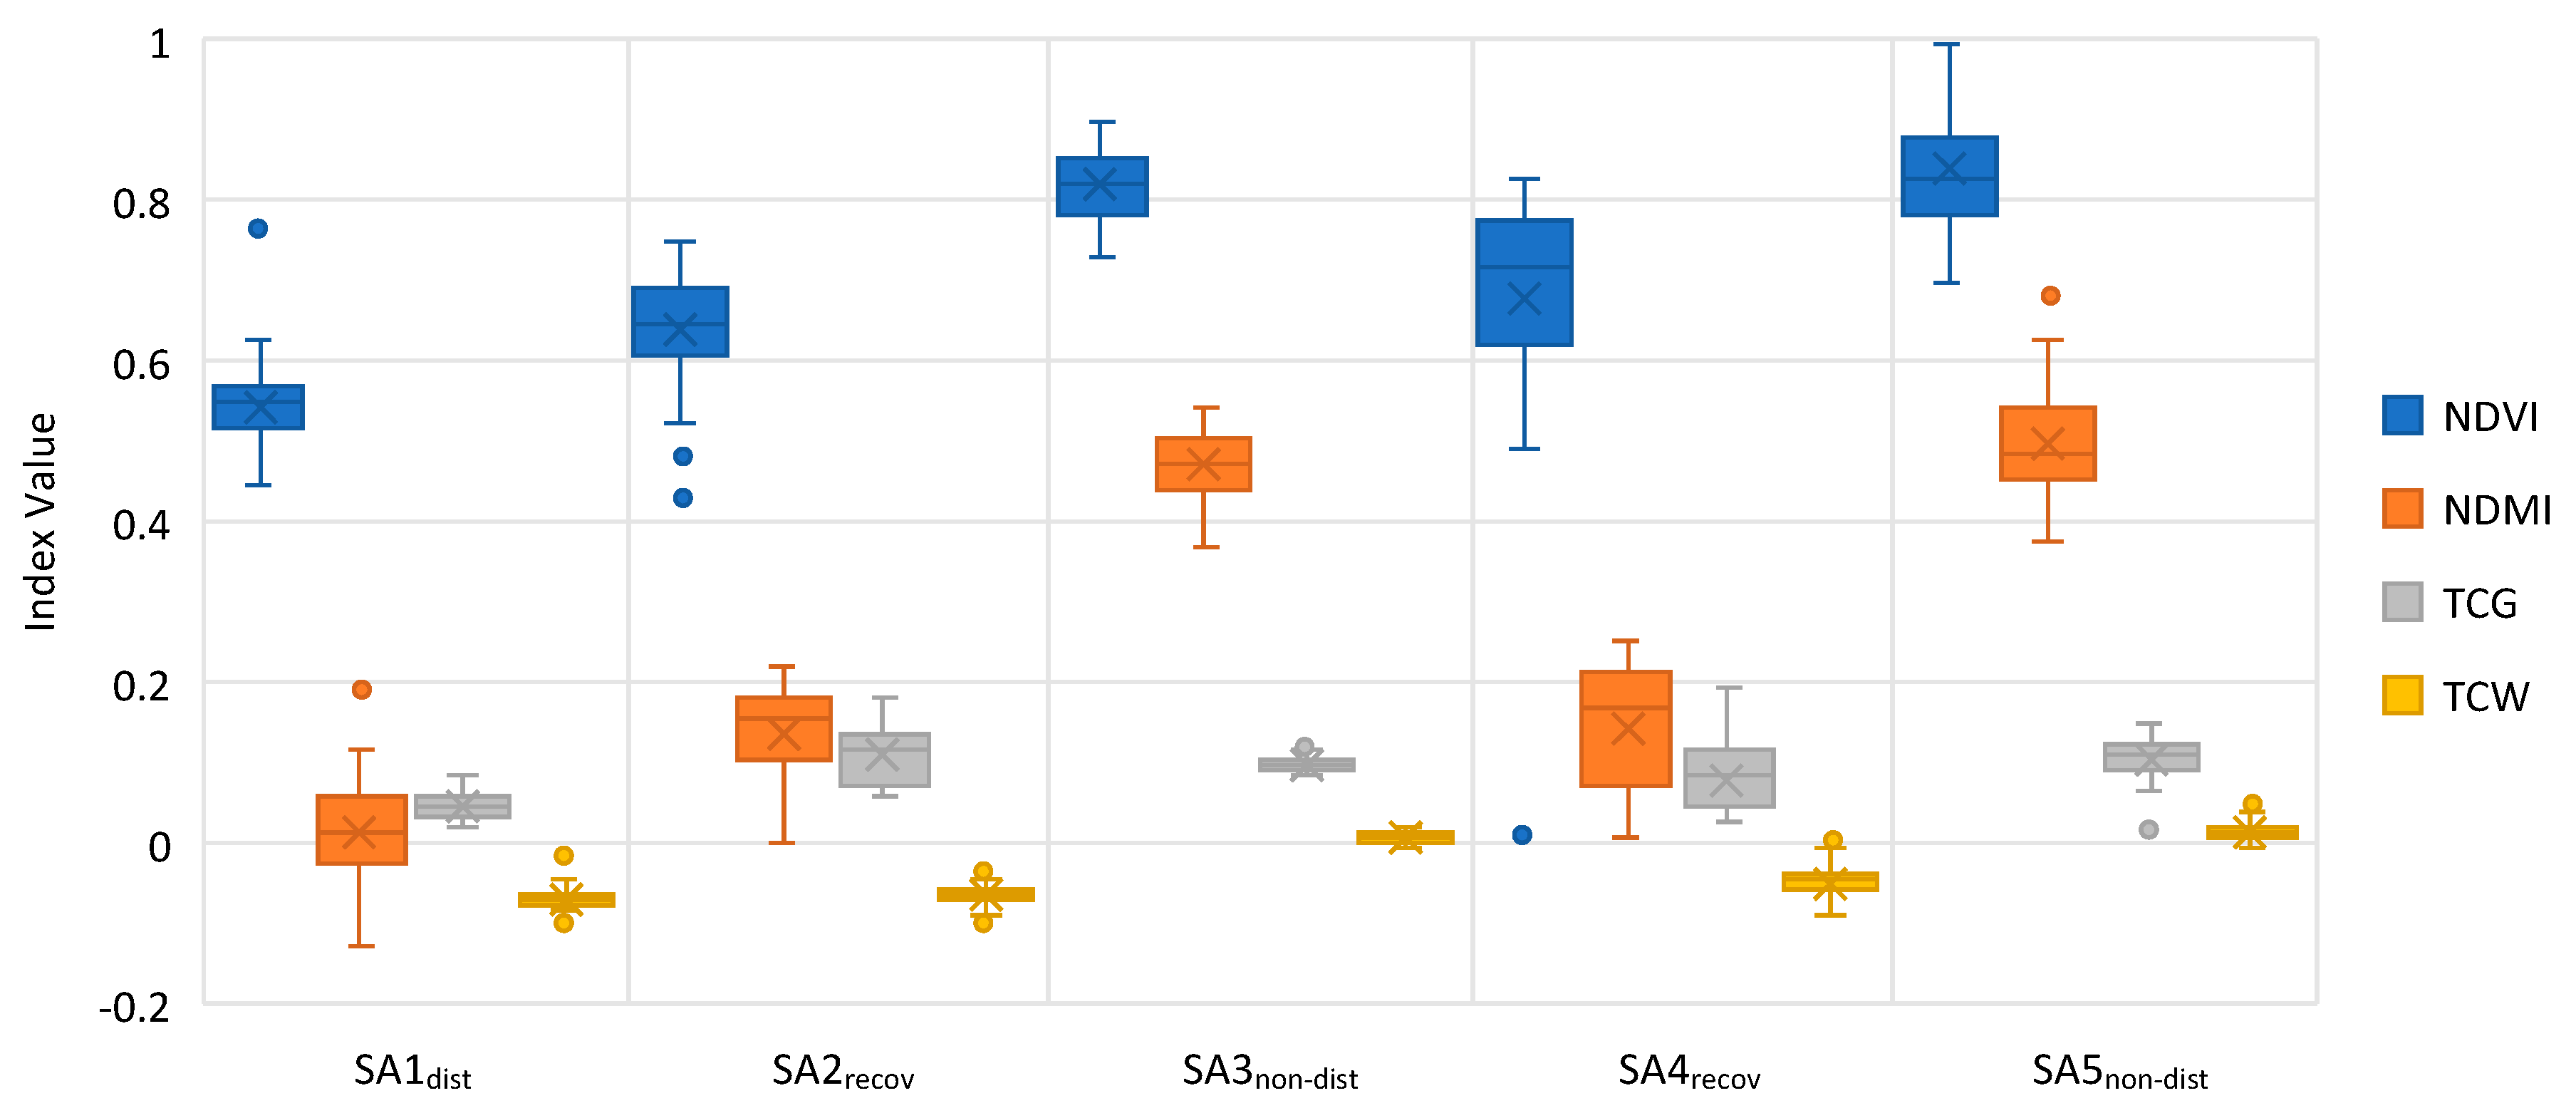
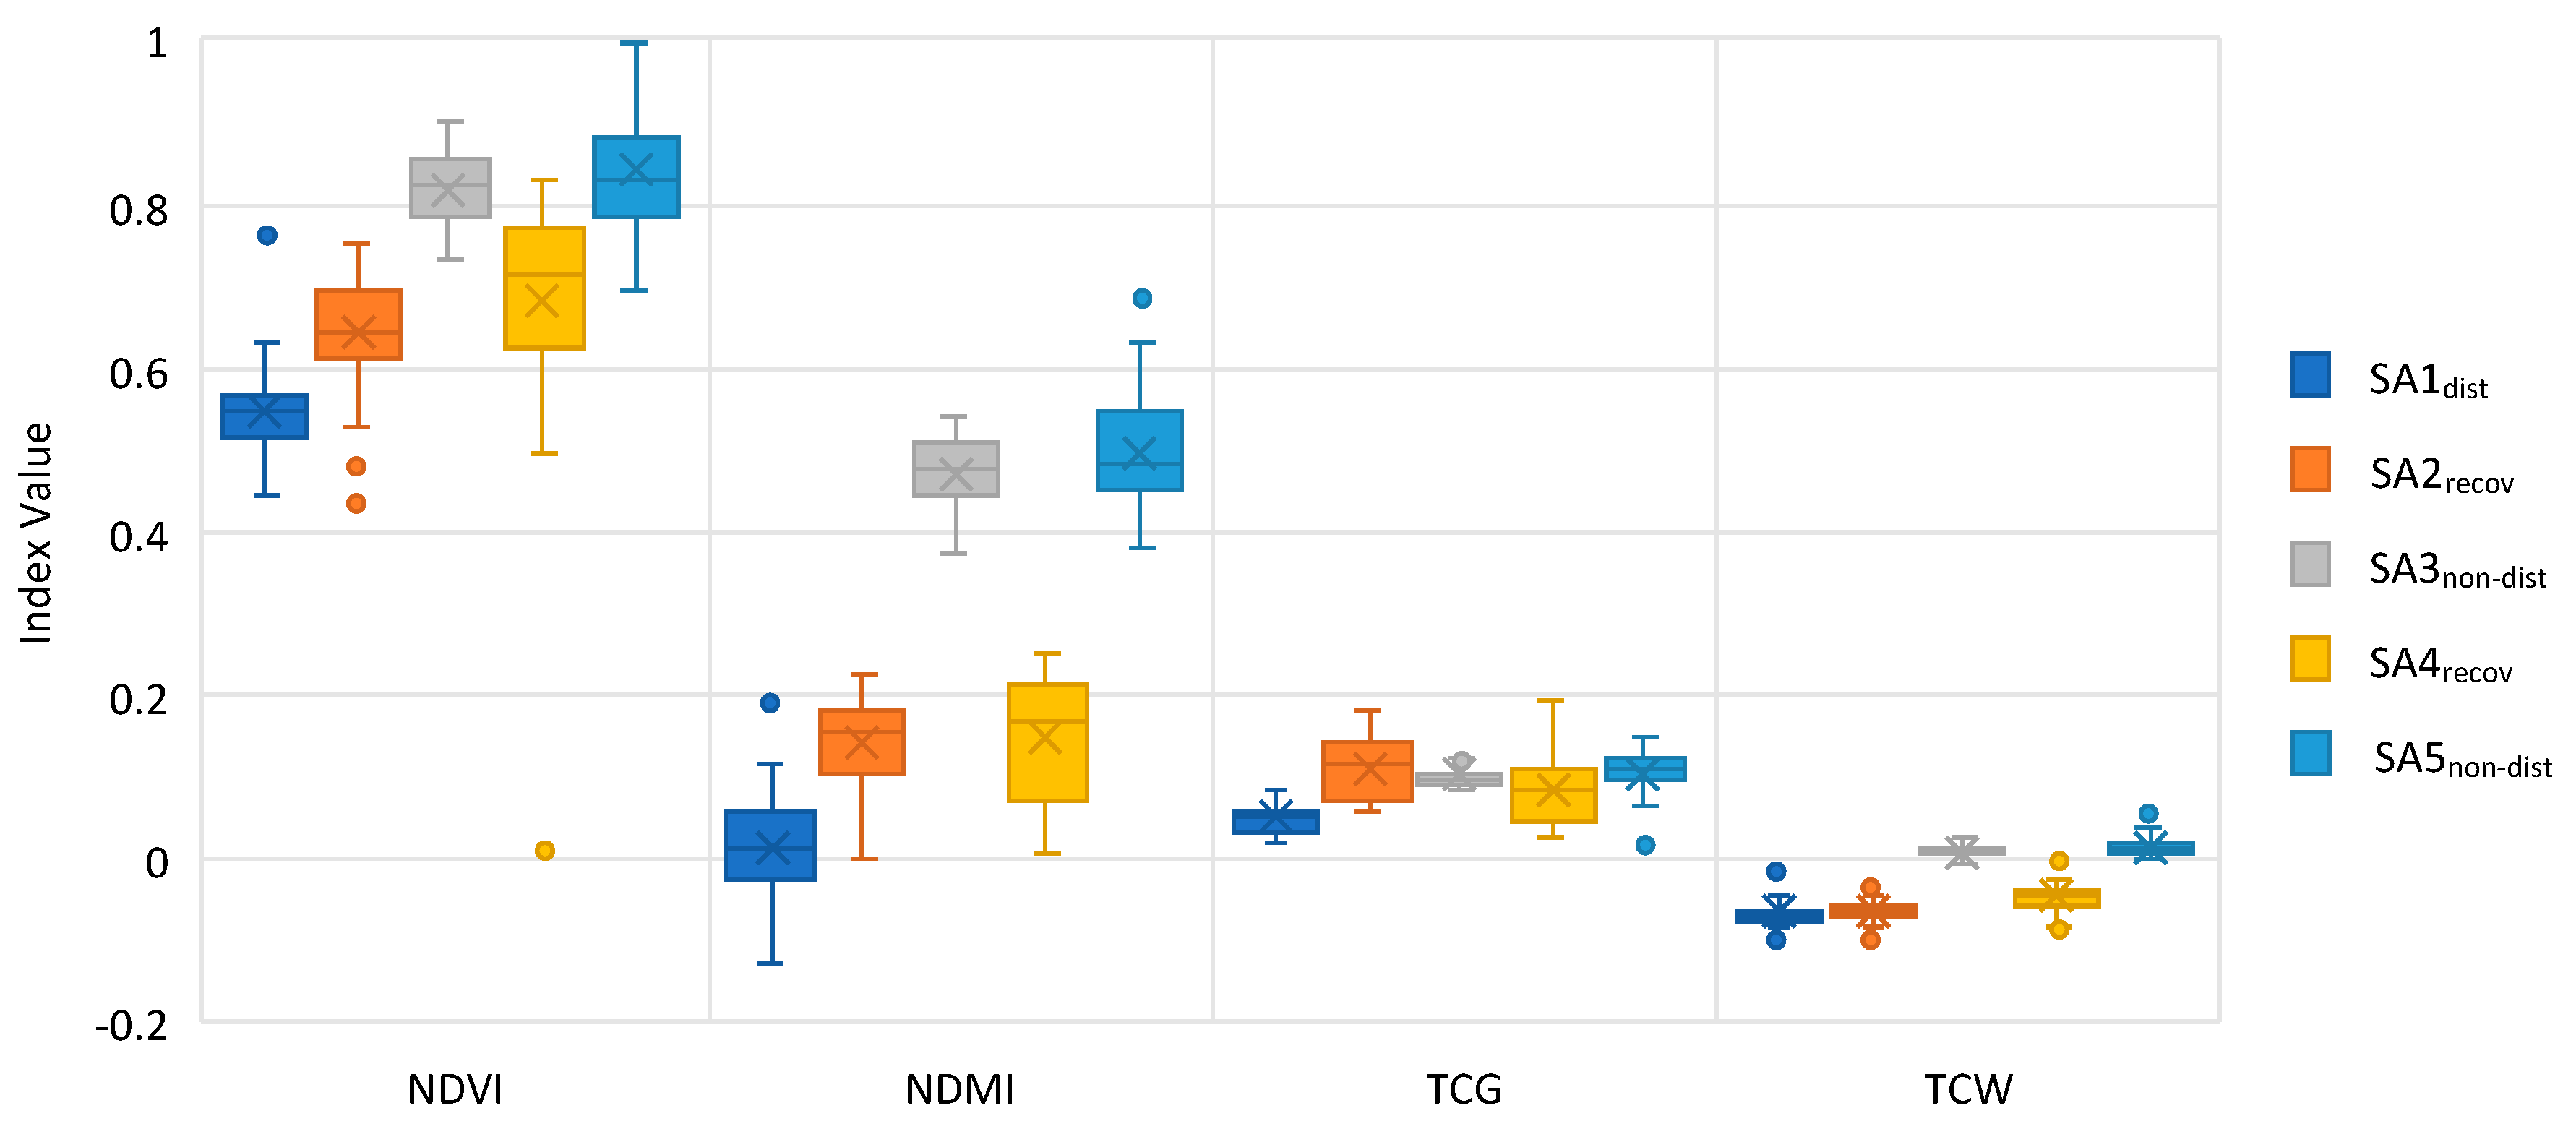
The impact of the disturbances on the forest vegetation was evaluated using the NDVI, NDMI, TCG, and TCW indices. The trends (similarities and differences) in the values of the studied indices were analyzed using the TS methods. We found that the vegetation indices NDVI, NDMI, and TCW were able to distinguish healthy and disturbed/damaged forests and they gave most relevant results for the research purposes of this study. The reflectivity of the healthy forest vegetation was higher in the NIR band than the SWIR; however, the SWIR reflectivity was higher in the case of disturbances. This aspect played an important role as the SWIR bands responded sensitively in the case of the degradation of the forest. The NDMI index using the SWIR band was evidently able to precisely distinguish the individual types of areas affected by disturbances (without disturbance and under disturbance or after disturbance in the individual phases of recovery). The values of the disturbed and recovery areas did not overlap with the undisturbed areas and create specific groups in the TS chart.
The values of the NDMI for the unaffected areas ranged approximately from 0.37 to 0.69, and the areas affected by the disturbances or in a recovery phase had evidently lower values of the NDMI with a range from −0.12 to 0.28. The orthogonal TCW index had a similar ability; however, it was not able to precisely distinguish the disturbed and recovery phases/areas. The values of the TCW index were documented from −0.10 to 0.00 in the disturbed and recovery areas and from 0.00 to 0.03 for the unaffected areas. The NDVI index, which is based on the visible band and the NIR ratios, was able to reflect an evolution of the plants and shrubs that quickly covered the disturbed area during the recovery phase (see
Figure 10). Concerning the TCG index, the abilities of this index did allow us to detect the disturbances in the gray-attack phase. However, it was difficult to distinguish the different recovery phases of the study areas. Our results are in accordance with comparable studies [
66,
67]. The novelty of this study was to use and test the Sentinel-2 data in the TS of the dynamic forest changes; therefore, we did not find any similar studies with comparable results of the value indices in the TS analysis based on Sentinel-2 data.
An important finding gained in this study was the high relevance of the data of the forest management practices in the national parks. The data contained in the forest management plans appeared to be excellent as a source for the validation of the results of the EO/TS investigation. The forest management plans contained a wide range of useful information, and this information is regularly updated. The data from the in situ research provided highly detailed data on the recovery of the forest ecosystems, especially with regards to the restoration of the herbaceous and woody undergrowth.
The use of the Sentinel-2 data in the evaluation of the forest vegetation and the consequences of the differentiated approaches to conservation and forestry activities provided excellent capacities and opportunities for the monitoring of the forest and the implementation of the EO data and the TS method into the protection and management of the forest. In addition, the new Landsat 9 (with similar OLI and TIRS sensor) will be sent into orbit soon (March 2021). If the Landsat 8 is still working in the following years, the new temporal coverage of the Landsat images will be higher (similar to Sentinel-2A and Sentinel-2B). The harmonization of the Landsat 8 (or Landsat 9) and Sentinel-2 data could also increase the temporal coverage of the TS [
68]. The possibilities to increase the temporal and spectral resolution can be seen in the data fusion of optical and SAR data also (e.g., Sentinel-1 and Sentinel-2). From the method point of view, it would be useful to test an application of the cloud-based Google Earth Engine (GEE), which allows for the analogical analyses of the EO data, such as the Sentinel Hub. Another idea is to carry out a comparative study in other national parks in Europe and validate our achieved results in the different forest ecosystems.

 ,
, 
