Article

Sentinel-2 Data in an Evaluation of the Impact of the Disturbances on Forest Vegetation

1
Department of Applied Geoinformatics and Cartography, EO4Landscape Research Team, Faculty of Science, Charles University, 12843 Prague, Czech Republic
2
Department of Geoinformatics, Faculty of Mining and Geology, VSB–Technical University of Ostrava, 70800 Ostrava-Poruba, Czech Republic
3
Administration of the Low Tatras National Park, State Nature Conservation of the Slovak Republic (NAPANT), 97401 Banska Bystrica, Slovakia
*
Author to whom correspondence should be addressed.
Remote Sens. 2020, 12(12), 1914; https://doi.org/10.3390/rs12121914
Submission received: 8 April 2020 / Revised: 18 May 2020 / Accepted: 23 May 2020 / Published: 13 June 2020
(This article belongs to the Special Issue Monitoring Forest Change with Remote Sensing)

Abstract

:
In this article, we investigated the detection of forest vegetation changes during the period of 2017 to 2019 in the Low Tatras National Park (Slovakia) and the Sumava National Park (Czechia) using Sentinel-2 data. The evaluation was based on a time-series analysis using selected vegetation indices. The case studies represented five different areas according to the type of the forest vegetation degradation (one with bark beetle calamity, two areas with forest recovery mode after a bark beetle calamity, and two areas without significant disturbances). The values of the trajectories of the vegetation indices (normalized difference vegetation index (NDVI) and normalized difference moisture index (NDMI)) and the orthogonal indices (tasseled cap greenness (TCG) and tasseled cap wetness (TCW)) were analyzed and validated by in situ data and aerial photographs. The results confirm the abilities of the NDVI, the NDMI and the TCW to distinguish disturbed and undisturbed areas. The NDMI vegetation index was particularly useful for the detection of the disturbed forest and forest recovery after bark beetle outbreaks and provided relevant information regarding the health of the forest (the individual stages of the disturbances and recovery mode). On the contrary, the TCG index demonstrated only limited abilities. The TCG could distinguish healthy forest and the gray-attack disturbance phase; however, it was difficult to use this index for detecting different recovery phases and to distinguish recovery phases from healthy forest. The areas affected by the disturbances had lower values of NDVI and NDMI indices (NDVI quartile range Q2–Q3: 0.63–0.71; NDMI Q2–Q3: 0.10–0.19) and the TCW index had negative values (Q2–Q3: −0.06–−0.05)). The analysis was performed with a cloud-based tool—Sentinel Hub. Cloud-based technologies have brought a new dimension in the processing and analysis of satellite data and allowed satellite data to be brought to end-users in the forestry sector. The Copernicus program and its data from Sentinel missions have evoked new opportunities in the application of satellite data. The usage of Sentinel-2 data in the research of long-term forest vegetation changes has a high relevance and perspective due to the free availability, distribution, and well-designed spectral, temporal, and spatial resolution of the Sentinel-2 data for monitoring forest ecosystems.

1. Introduction

One possibility to monitor and evaluate forest vegetation is to use Earth Observation (EO) methods. EO provides unique information for the purpose of observing dynamic phenomena on the Earth’s surface [1]. Satellites are equipped with various sensors that provide images with information that the human eye cannot see. This is especially useful for detecting the early stages of forest disturbance when there are no visual signs of damage [2]. One of the most beneficial outputs based on EO is the worldwide databases of status and changes of forest areas [3], the databases of forest area changes for Eastern Europe [4], or the databases of systematically addressed changes in forest areas, both in North and South America (e.g., in Brazil and Colombia) [1,5,6,7,8,9]. Other authors evaluated a forest affected by bark beetles with vegetation indices from Landsat images, and the subsequent pixel classification achieved a total accuracy of 80–82% [10] or focused on the classification of three categories of the forest using the maximum likelihood classifier: healthy trees, damaged trees, and grasslands [11].
The forest bark beetle calamity itself can be divided into the green-attack (without visible damage), followed by a red-attack (the first visible phase of the death of trees), and finally a gray-attack (dead trees). This method successfully separated the red-attack trees from the healthy trees and the grasslands using the RGI (red green index) and reflectivity in the green band with an overall classification accuracy of 86%. The SWIR (short-wavelength infrared) band effect was demonstrated in detecting forest disturbances using time series (TS) methods [12]. In Central Europe, evaluations of the state and changes in forest vegetation using Landsat have been presented by many studies [13,14,15,16]. EO data have often been used in the evaluation of forests in Czechia, which have been struggling with long-term disturbances (wind calamities or the subsequent bark beetle invasions) [17,18,19,20,21].
To determine the state and the changes of the forest vegetation from the satellite images, the key information was found in the spectral properties of the vegetation species studied [22]. The suitability of the multispectral data and the vegetation indices calculated from these could differ in the monitoring of the forest vegetation and how it was proven in various studies [20,23,24,25,26,27,28]. The unanswered question is of which real spectral differences measured during the observed years are relevant to determine the characteristics and individual phases of the forest disturbance. TS methods are often used for the evaluation of the forest changes. For TS purposes, a whole range of satellite data can be used. For choosing a data type, the availability and suitability of the images, especially in terms of time and the radiometric and spatial resolution, need to be considered [29].
Due to the availability of the free access archive, Landsat’s satellite imagery archive is one of the most commonly used archives for a wide range of disciplines [30]. Landsat data provides visible, NIR (near-infrared) and SWIR bands that have often been used in the evaluation of forest degradation affected by a disturbance, e.g., the bark beetle calamity. Landsat TM data have proved to be effective for detecting the red-attack phase of the bark beetle disturbance [31]. From a temporal point of view, it is appropriate to use the Landsat mission data for a longer TS, especially as their time coverage is longer than 40 years. However, looking at the number of acquisitions per year, the 16-day temporal resolution is a limiting factor that is even lower due to cloud coverage, especially in mountainous areas [1,30]. In the case when there are only a few images during the year, then only one chosen reference image per year is often used [19]. Some studies tried to combine a range of different types of satellite data, e.g., Landsat with MODIS data [32]. In the case of a long TS period (more than 20 years), various radiometric and spectral resolutions of the acquired data can influence the results of the TS due to different types of sensors [33].
The Copernicus program has brought a new revolution in EO monitoring. ESA is developing new missions of satellites called Sentinels specifically for the operational needs of the Copernicus program. The images are received via two parallel missions 2A and 2B and in the case of the overlapping scenes, the temporal resolution is less than five days [34]. The Sentinel-2 multispectral optical dataset is now available with the ambition to provide data with better resolutions (spatial, temporal, and spectral) than the traditional data like Landsat. The Sentinel-2 data have been available since 2015; therefore, the archive is ready to be tested with the TS analyses. The spectral vegetation indices calculated from Sentinel-2 have a potential for mapping and detecting changes induced by bark beetle attack, particularly based on the red-edge bands or water-related indices. These changes are limitedly detectable by Landsat-8 due to the lower spectral and spatial resolution of the OLI sensor; see the comparable study [2] with 67% accuracy for Sentinel-2 and 36% accuracy for Landsat 8.
Several articles have been written for the TS of the Sentinel-2 data, e.g., focused on mapping floodplain grassland plant communities, where the authors dealt with the variability in the water content using TS, especially with TS using the support vector machine and random forest classifiers [35]. Other authors [36] focused on observing the Cotton Belt using the TS of the Sentinel-2 data. The authors used random forest classification and several kinds of vegetation indices for their time survey. The temporal and spatial resolution played an important role in the observation of the TS [37,38,39]. For this reason, a fusion of the Landsat 8 and Sentinel-2, called harmonized datasets, has been designed [40,41,42].
Few articles have been written for the TS of the Sentinel-2 focused on forest vegetation, e.g., that dealt with the recognition of unhealthy cork oaks (Quercus suber) [43]. Based on a multitemporal comparison (using vegetation indices), researchers found that while in the wetter part of the year, the differences were small, and, during the drier part of the year (September and October), the differences between the healthy and unhealthy cork oak stands were more significant. Another study focused on forest growth using the Sentinel-2 TS [44] and attempted to determine how to distinguish bamboo forests (Phyllostachys pubescens) from coniferous or deciduous forests using the annual course of the vegetation indices (NDVI, NDMI, etc.). The results prove that May is the best month to distinguish bamboo stands from other forest types. Another study [45] showed that the classification of forest types using the random forest method based on the Sentinel-2 TS proved a high relevancy of the red-edged bands.
A perspective method in the processing of RS data is cloud computing. The Sentinel Hub is one of the most used cloud-based applications, and this application allows effective and end-user friendly processing and analysis of the EO data (https://www.sentinel-hub.com). It is a user interface app for the semi-automatic satellite data analysis created by Sinergise [46]. This platform provides satellite images from various missions, e.g., Sentinel, Landsat, or MODIS. The Sentinel Hub allows the downloading, the visualization of the satellite imageries, scripting to calculate the vegetation indices, classifications, and other analyses, as well as using WMS (Web Map Service) services to extract the selected values for the given site and period [46,47].
One of the current problems in the forest ecosystems of central Europe is bark beetle calamities [18]. Their overgrowth is closely related to the climate change and the spread of non-indigenous coniferous trees in central Europe, e.g., spruce (Picea abies) [48]. This study is focused on an evaluation of the changes in the forest vegetation in selected areas of the Low Tatras National Park (Slovakia) and the Sumava National Park (Czechia) using the TS methods. The analysis of the TS is based on Sentinel-2 images (description in Table A1; with a comparison to the Landsat data). Due to the dynamic changes in the forests in Czechia and Slovakia that occurred over the last several years, it is a suitable opportunity to apply the Sentinel-2 TS for the detection of disturbing events (bark beetle) and to evaluate the forest health status during the individual stages of the disturbance (forest conditions before, during, and after the disturbance events). From this point of view, the main aim and novelty of this study is to use and test the Sentinel-2 data for the evaluation of the dynamic forest changes. The selected vegetation indices and their trajectories of the TS were interpreted and validated in relation to the in situ data investigated during field research or provided by the Administration of National Parks. In the process of collecting and evaluating the data, we cooperated with the Low Tatras National Park and the Sumava National Park. An important part of this study is the evaluation of the applicability of the EO/Sentinel-2 data and the methods in the forest management and the nature protection of national parks. For this reason, big data/cloud data methods of the Sentinel Hub were used.
The main objectives of this study were:
  • To test the Sentinel-2 data in the TS analyses for the selected case studies in Czechia and Slovakia within a three-year period of 2017–2019 and to evaluate the benefits of the Sentinel-2 data for monitoring the forest changes.
  • To compare the Sentinel-2 and Landsat temporal and spatial resolution for the TS analyses of the forest vegetation in mountainous areas.
  • To evaluate the relevancy of the vegetation indices in the study of the forest changes and the health of the forest vegetation using the Sentinel-2 data.
  • To perform TS analyses and compare the results in the different types of areas affected by the bark beetle invasion (the disturbed and renewing forest ecosystems).
  • To discuss the positives and perspectives of the Sentinel-2 data in the TS of forest changes in comparison to the traditional data used, e.g., Landsat.
  • To process the satellite data and perform analyses in the cloud-based tool (Sentinel Hub) and discuss the positives and negatives of cloud-based systems for end-users in forestry research and management.
We would like to give responses for these research questions:
  • What are the main positives of the Sentinel-2 data in the evaluation of the forest vegetation affected by the disturbances? What type of change in the forest is possible to detect by Sentinel-2? What are the positives using Sentinel-2 data in the TS in comparison with the traditional satellite data, e.g., Landsat?
  • What are the positives of processing and analyzing the data in a cloud-based tool (Sentinel Hub)?
  • What vegetation indices derived from the bands of the Sentinel-2 data are useful for the detection of the forest affected by a bark beetle invasion? Which vegetation indices based on these data could detect the disturbances that occurred and individual recovery phases in the forest of mountainous areas? Are the vegetation indices, traditionally used for Landsat data, usable for the Sentinel-2 data?
  • How many cloud-free images of Sentinel-2 are available for the TS analysis in our mountainous areas case studies annually? What is the progress of the data availability per year in comparison with the Landsat data? Is the temporal resolution of the Sentinel-2 data sufficient to detect the changes and the health of the forest within the year?

2. Materials and Methods

2.1. Study Areas

2.1.1. In Situ and Auxiliary Data

Two types of study areas, with a significant and without any significant impact of a disturbance on the forest, were selected in the Sumava National Park (Sumava NP, Czechia) and the Low Tatras National Park (NAPANT, Slovakia). The study areas were selected based on: (1) the forest archive documents of the national parks, which provided data on the status of the forests and their management, the area and category of the forests, the average age of the stock and the predominant tree species representation; (2) the in situ research and field observations focused on the height, age, and density of the trees, the plant and species composition, the characteristics of the plant undergrowth, the visual observations of the conditions of the individual trees; and (3) the aerial photo archives from the Czech Office for Surveying, Mapping and Cadastre (CUZK; orthophoto for Czechia), the office of Geodesy, Cartography and Cadastre Authority of the Slovak Republic (UGKK SR; orthophoto for Slovakia), Mapy.cz (GEODIS, TopGis for Czechia and EUROSENSE, GEODIS for Slovakia), and Google Earth Pro (for both countries). The archive data and aerial photographs were helpful for the selection of the suitable study areas, the investigation of the forest status and changes as well as for the validation of the results achieved by the TS analysis of the Sentinel-2 data. The field research was carried out repeatedly in the summer and autumn of the years 2017, 2018, and 2019. The study areas were localized by a global navigation satellite system receiver (Trimble Geoexplorer 6000 Geo XT GPS).

2.1.2. Study Area Description

The study areas are located in the Sumava National Park (Sumava NP, Czechia) and the Low Tatras National Park (NAPANT, Slovakia). The Low Tatras are among the most important mountainous regions of Slovakia with a maximum height of 2043 m above sea level at the summit of Dumbier. The declaration of the Low Tatras National Park occurred in 1978. The national park covers an area of approximately 728 km2 with a buffer zone of more than 1102 km2. NAPANT is one of the largest protected areas, not only in Slovakia, but in the entire Carpathians. Due to its large size, the diverse soil substrate, and the variation in the forms of relief, the Low Tatras are a part of the area with the highest diversity of plant species in Slovakia. The dominant plant community in the area is forest, with the presence of extensive forest ecosystems [28]. The Sumava mountains are an extensive mountain range on the border of Czechia, Austria, and Germany. The mean altitude is 928 m above sea level. In Czechia, since 1963, the territory has been managed as a protected landscape area, and as a national park since 1991. The area of the national park is approximately 681 km2 [19,49]. The dominant land cover is a coniferous forest, which is under pressure from biotic, abiotic, and anthropogenic influences [14,15].
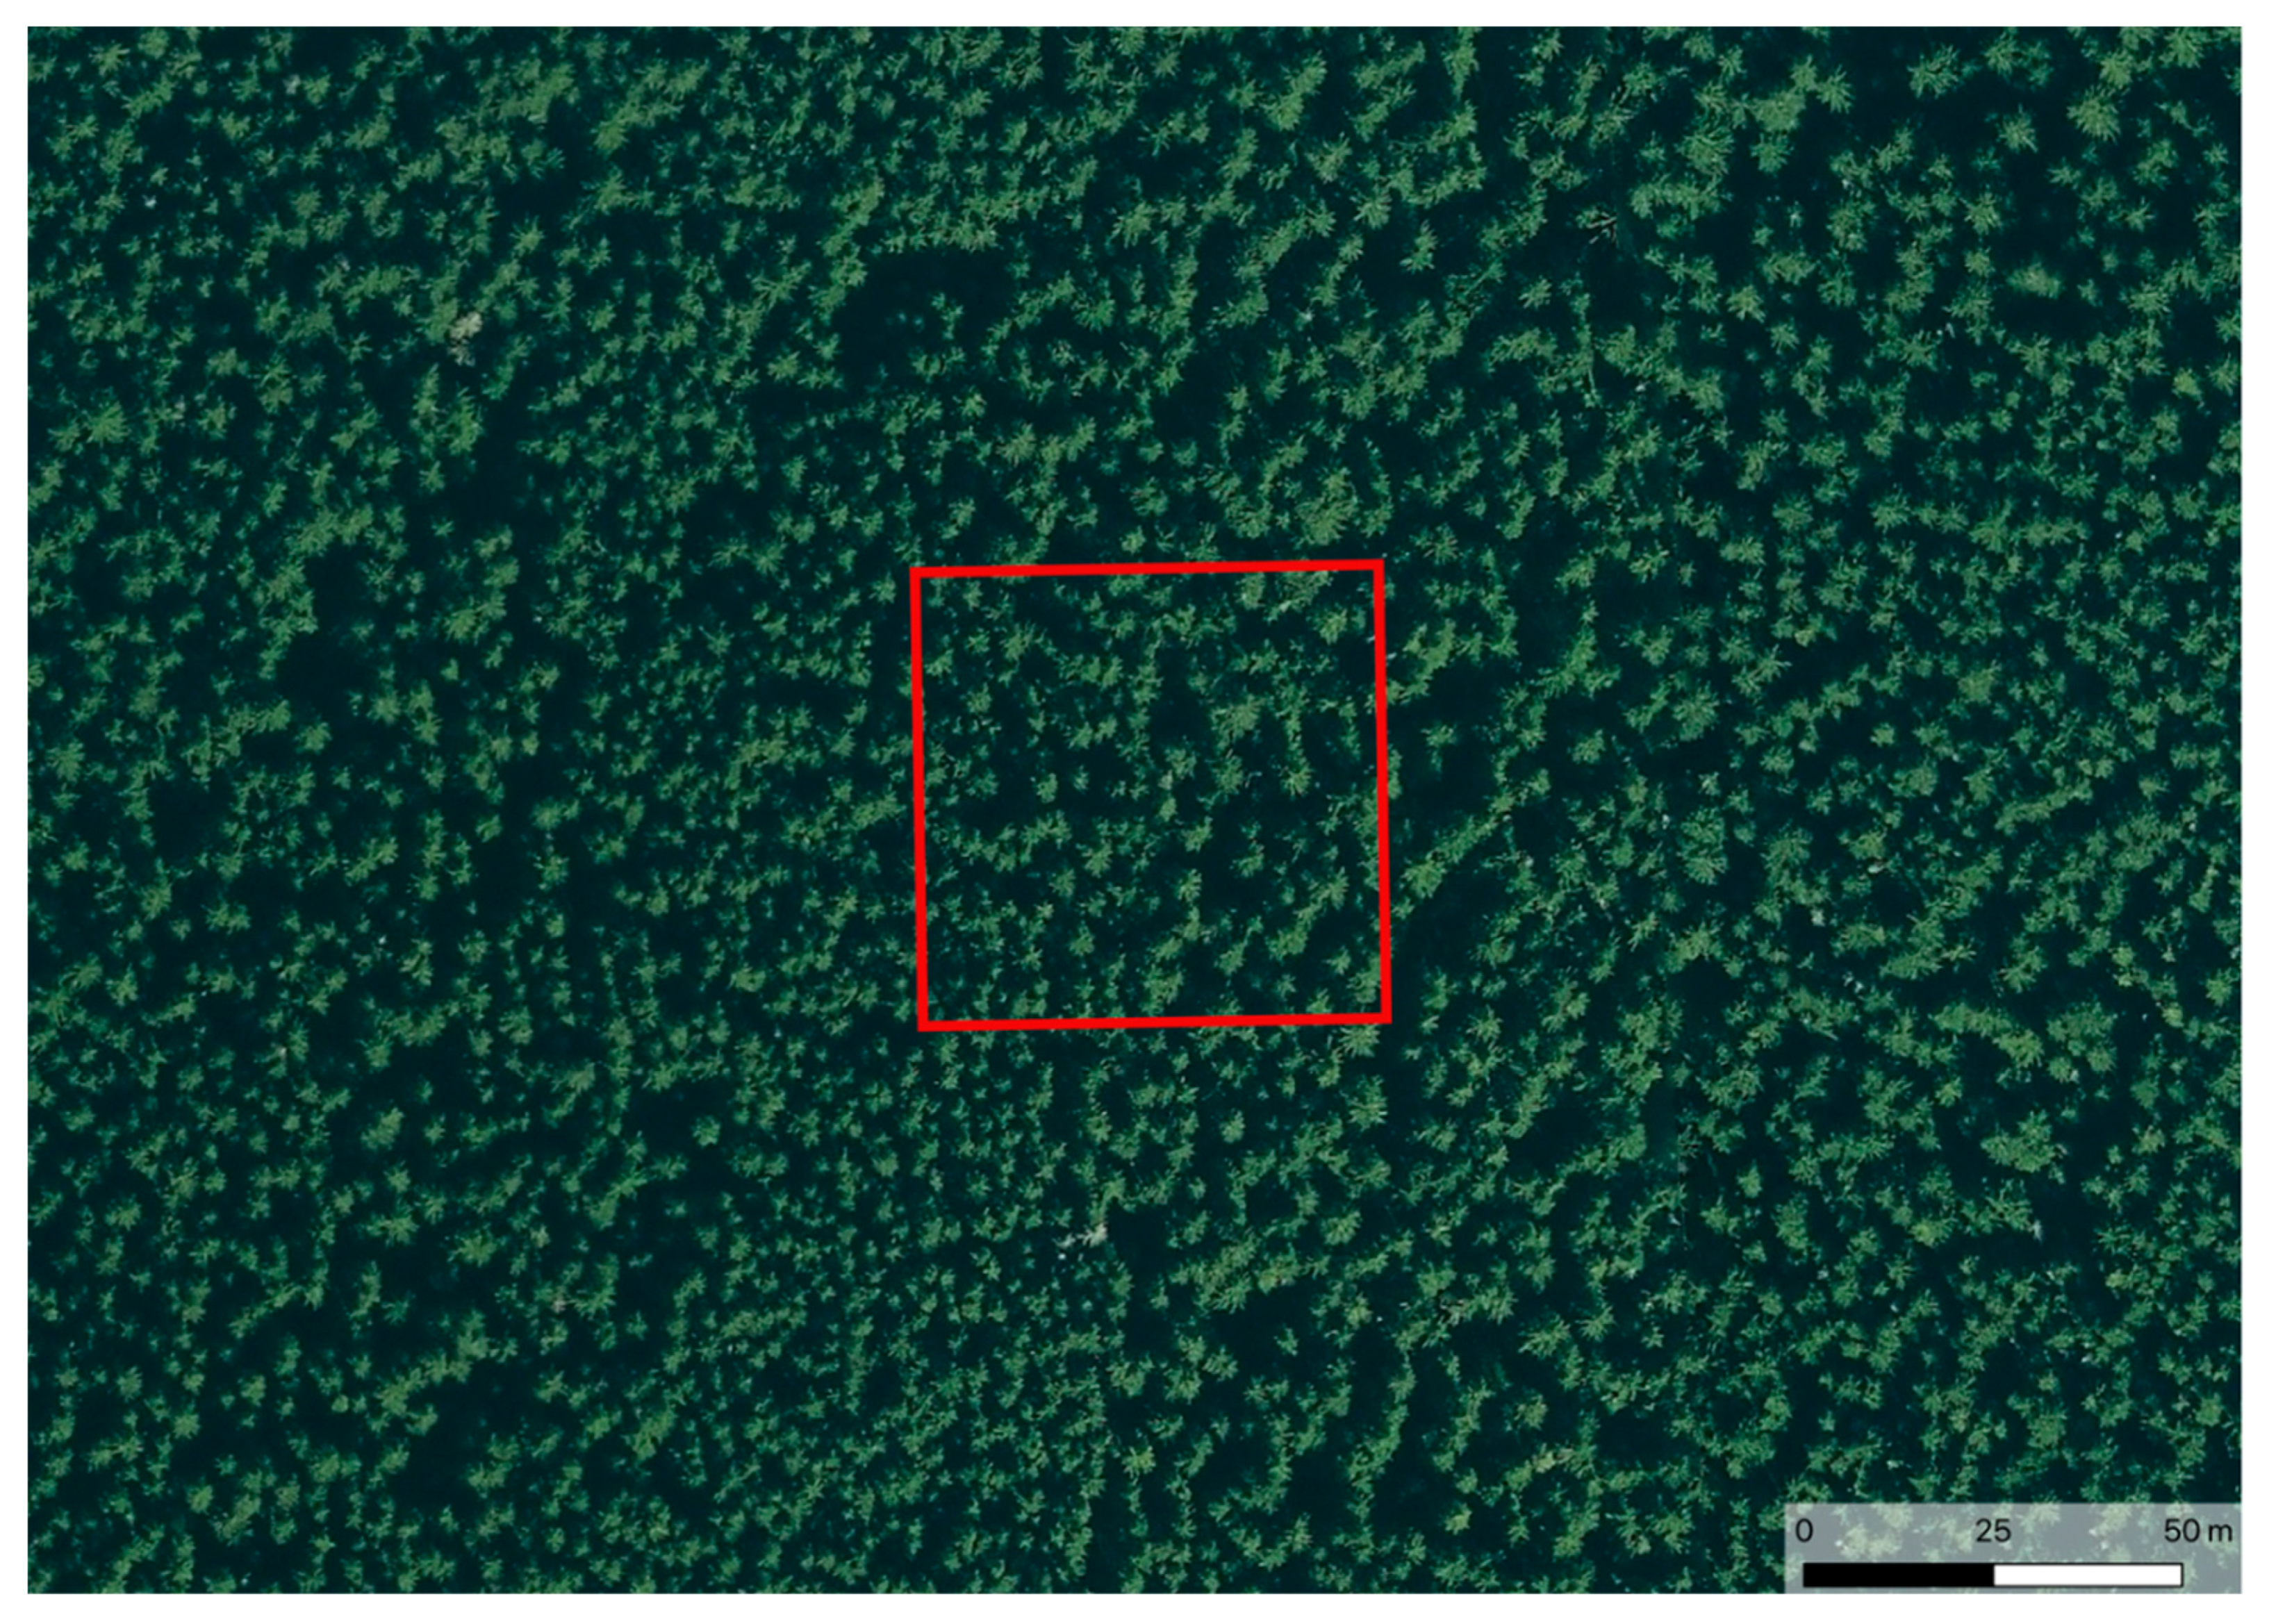
In total, five study areas of interest were selected (three in the Sumava NP and two in the NAPANT), where the field research was conducted (Table 1). All the study areas are depicted in the map (Figure 1). The study areas represent different areas according to the type of the forest vegetation degradation (areas affected by a disturbance and areas without any significant disturbances). The extent of all the study areas was defined as 60 × 60 m (3600 m2). This extent ensures pure pixels (unmixed) of the individual forest type and it is compatible with the 10-/20-m bands of the Sentinel-2 (6 × 6/3 × 3 pixels).
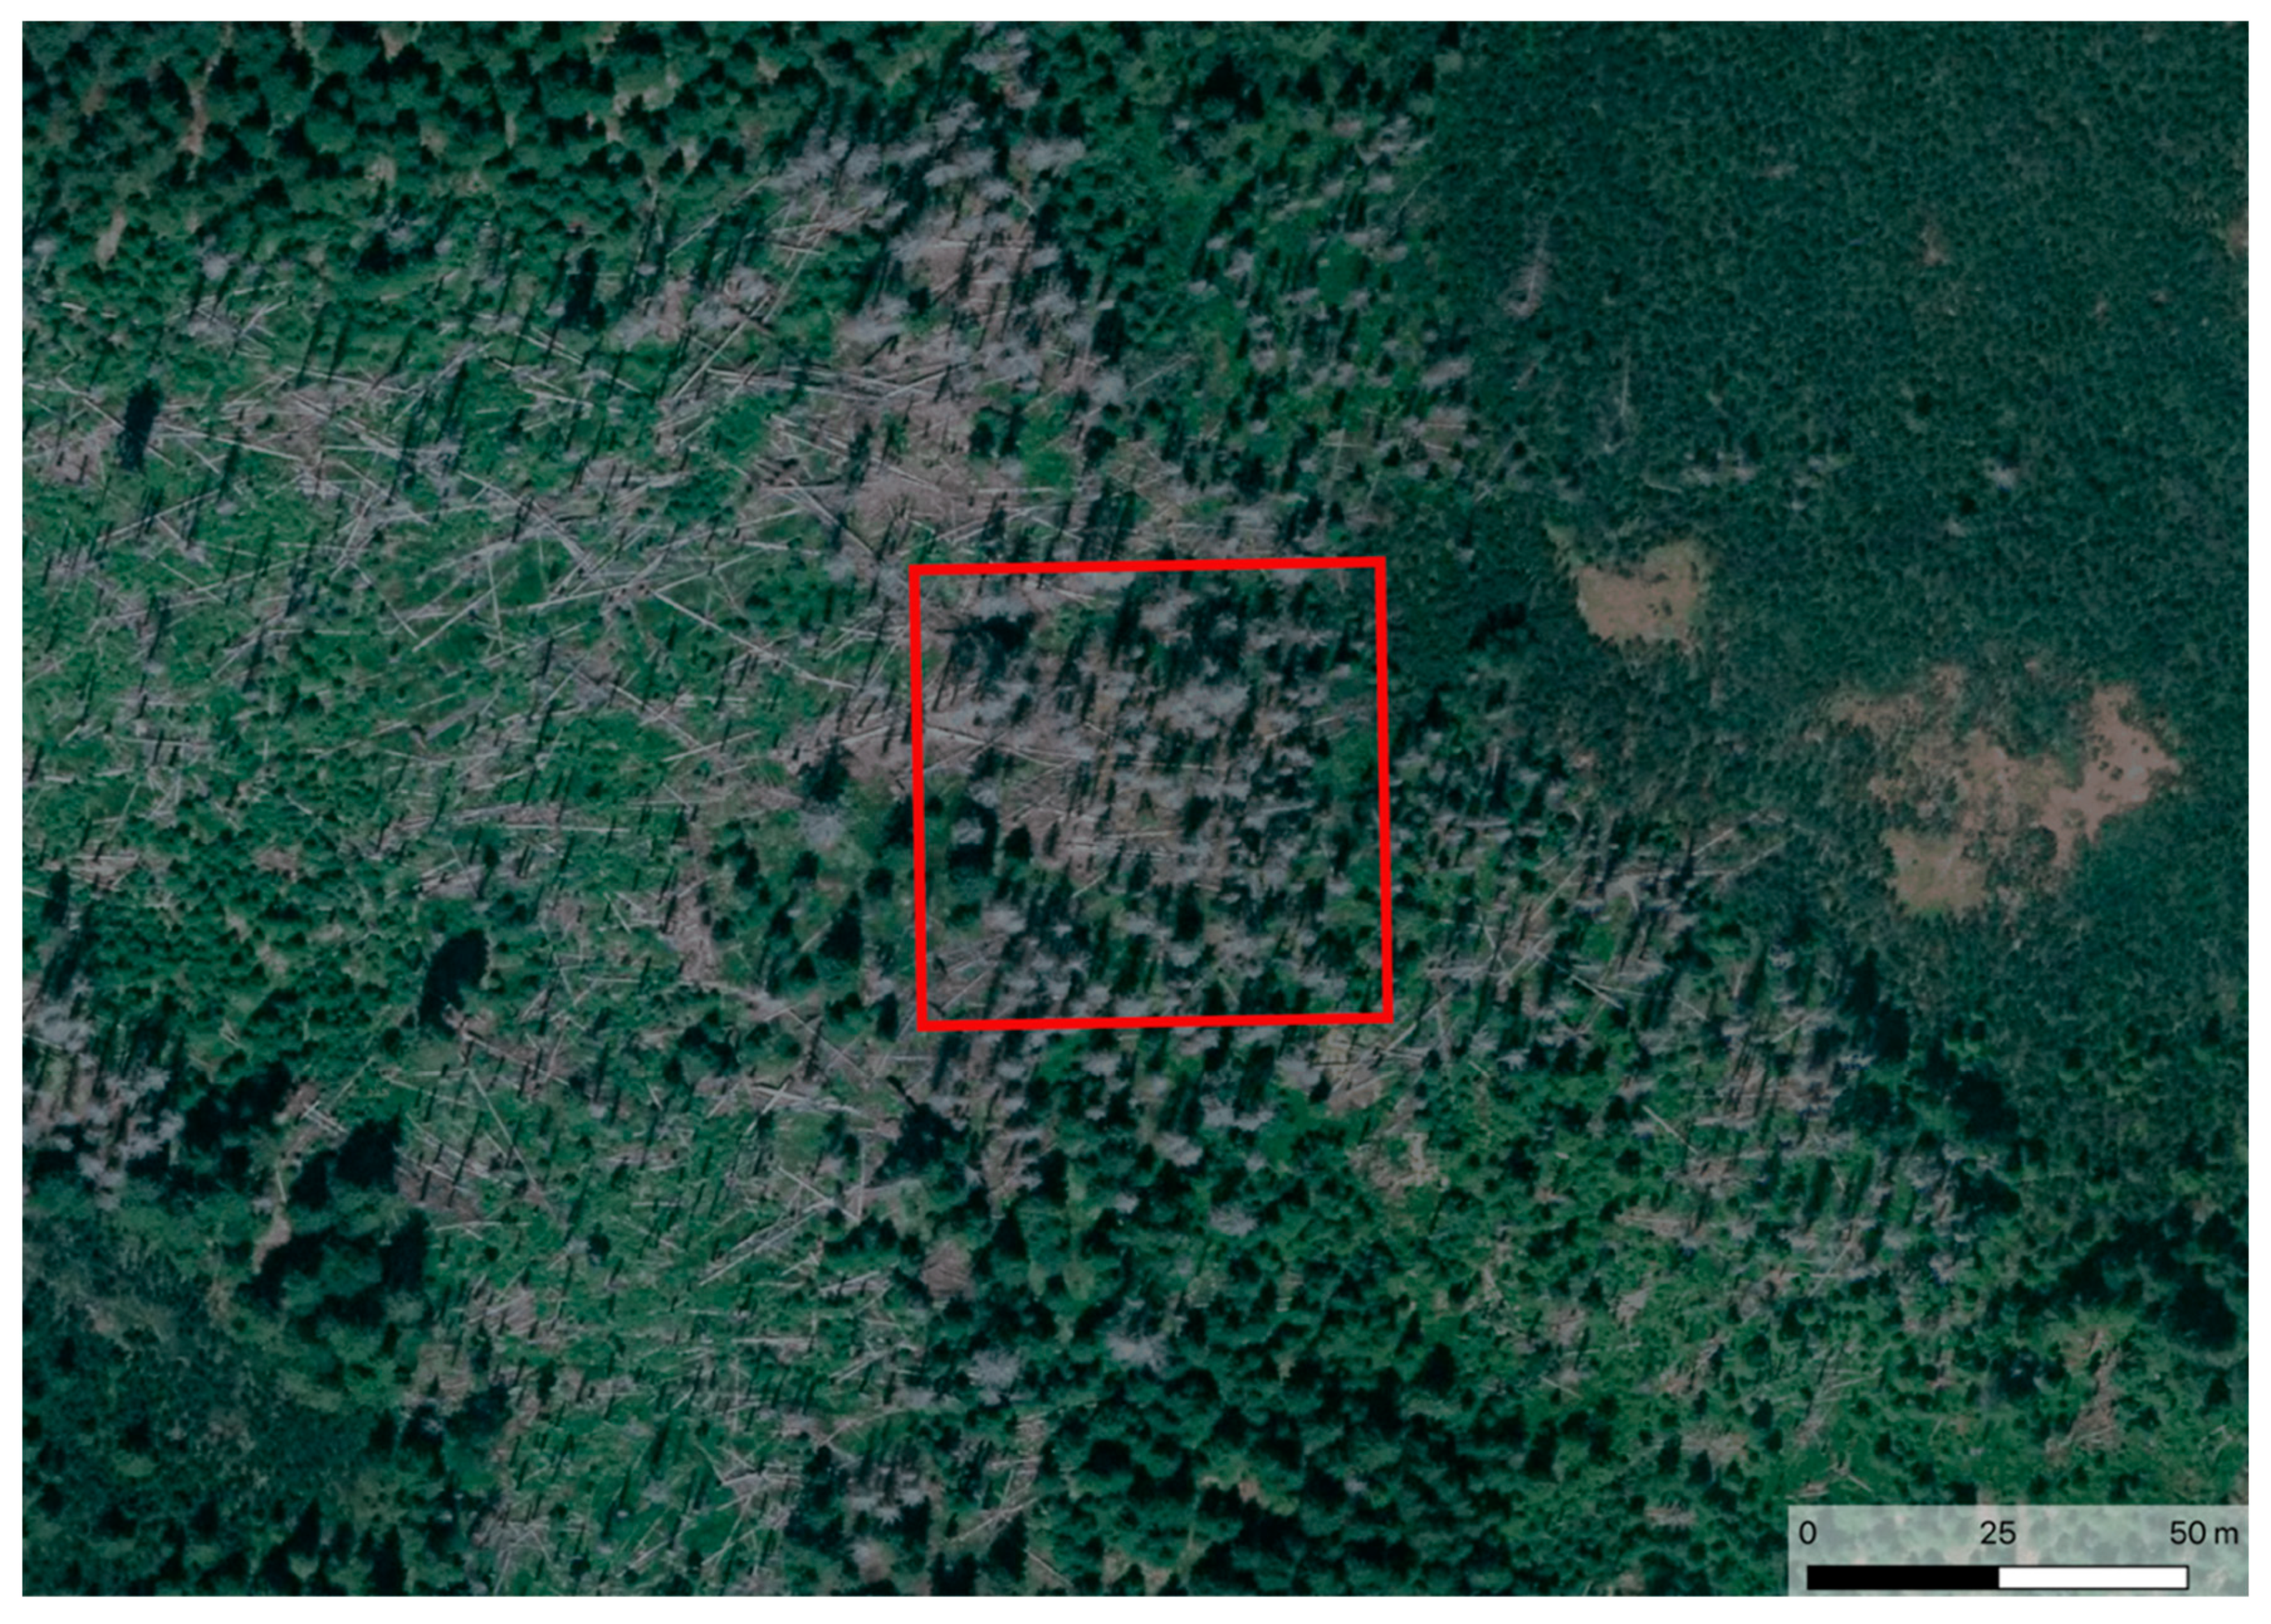
The study area 1 (SA1dist) area was selected in the Sumava NP. In this area, a bark beetle attack occurred in 2015 (the red attack). A gray-attack prevailed in 2016–2017 and the study area has been in recovery phase since 2018 (Figure 2). The average altitude is 1040 m above sea level.
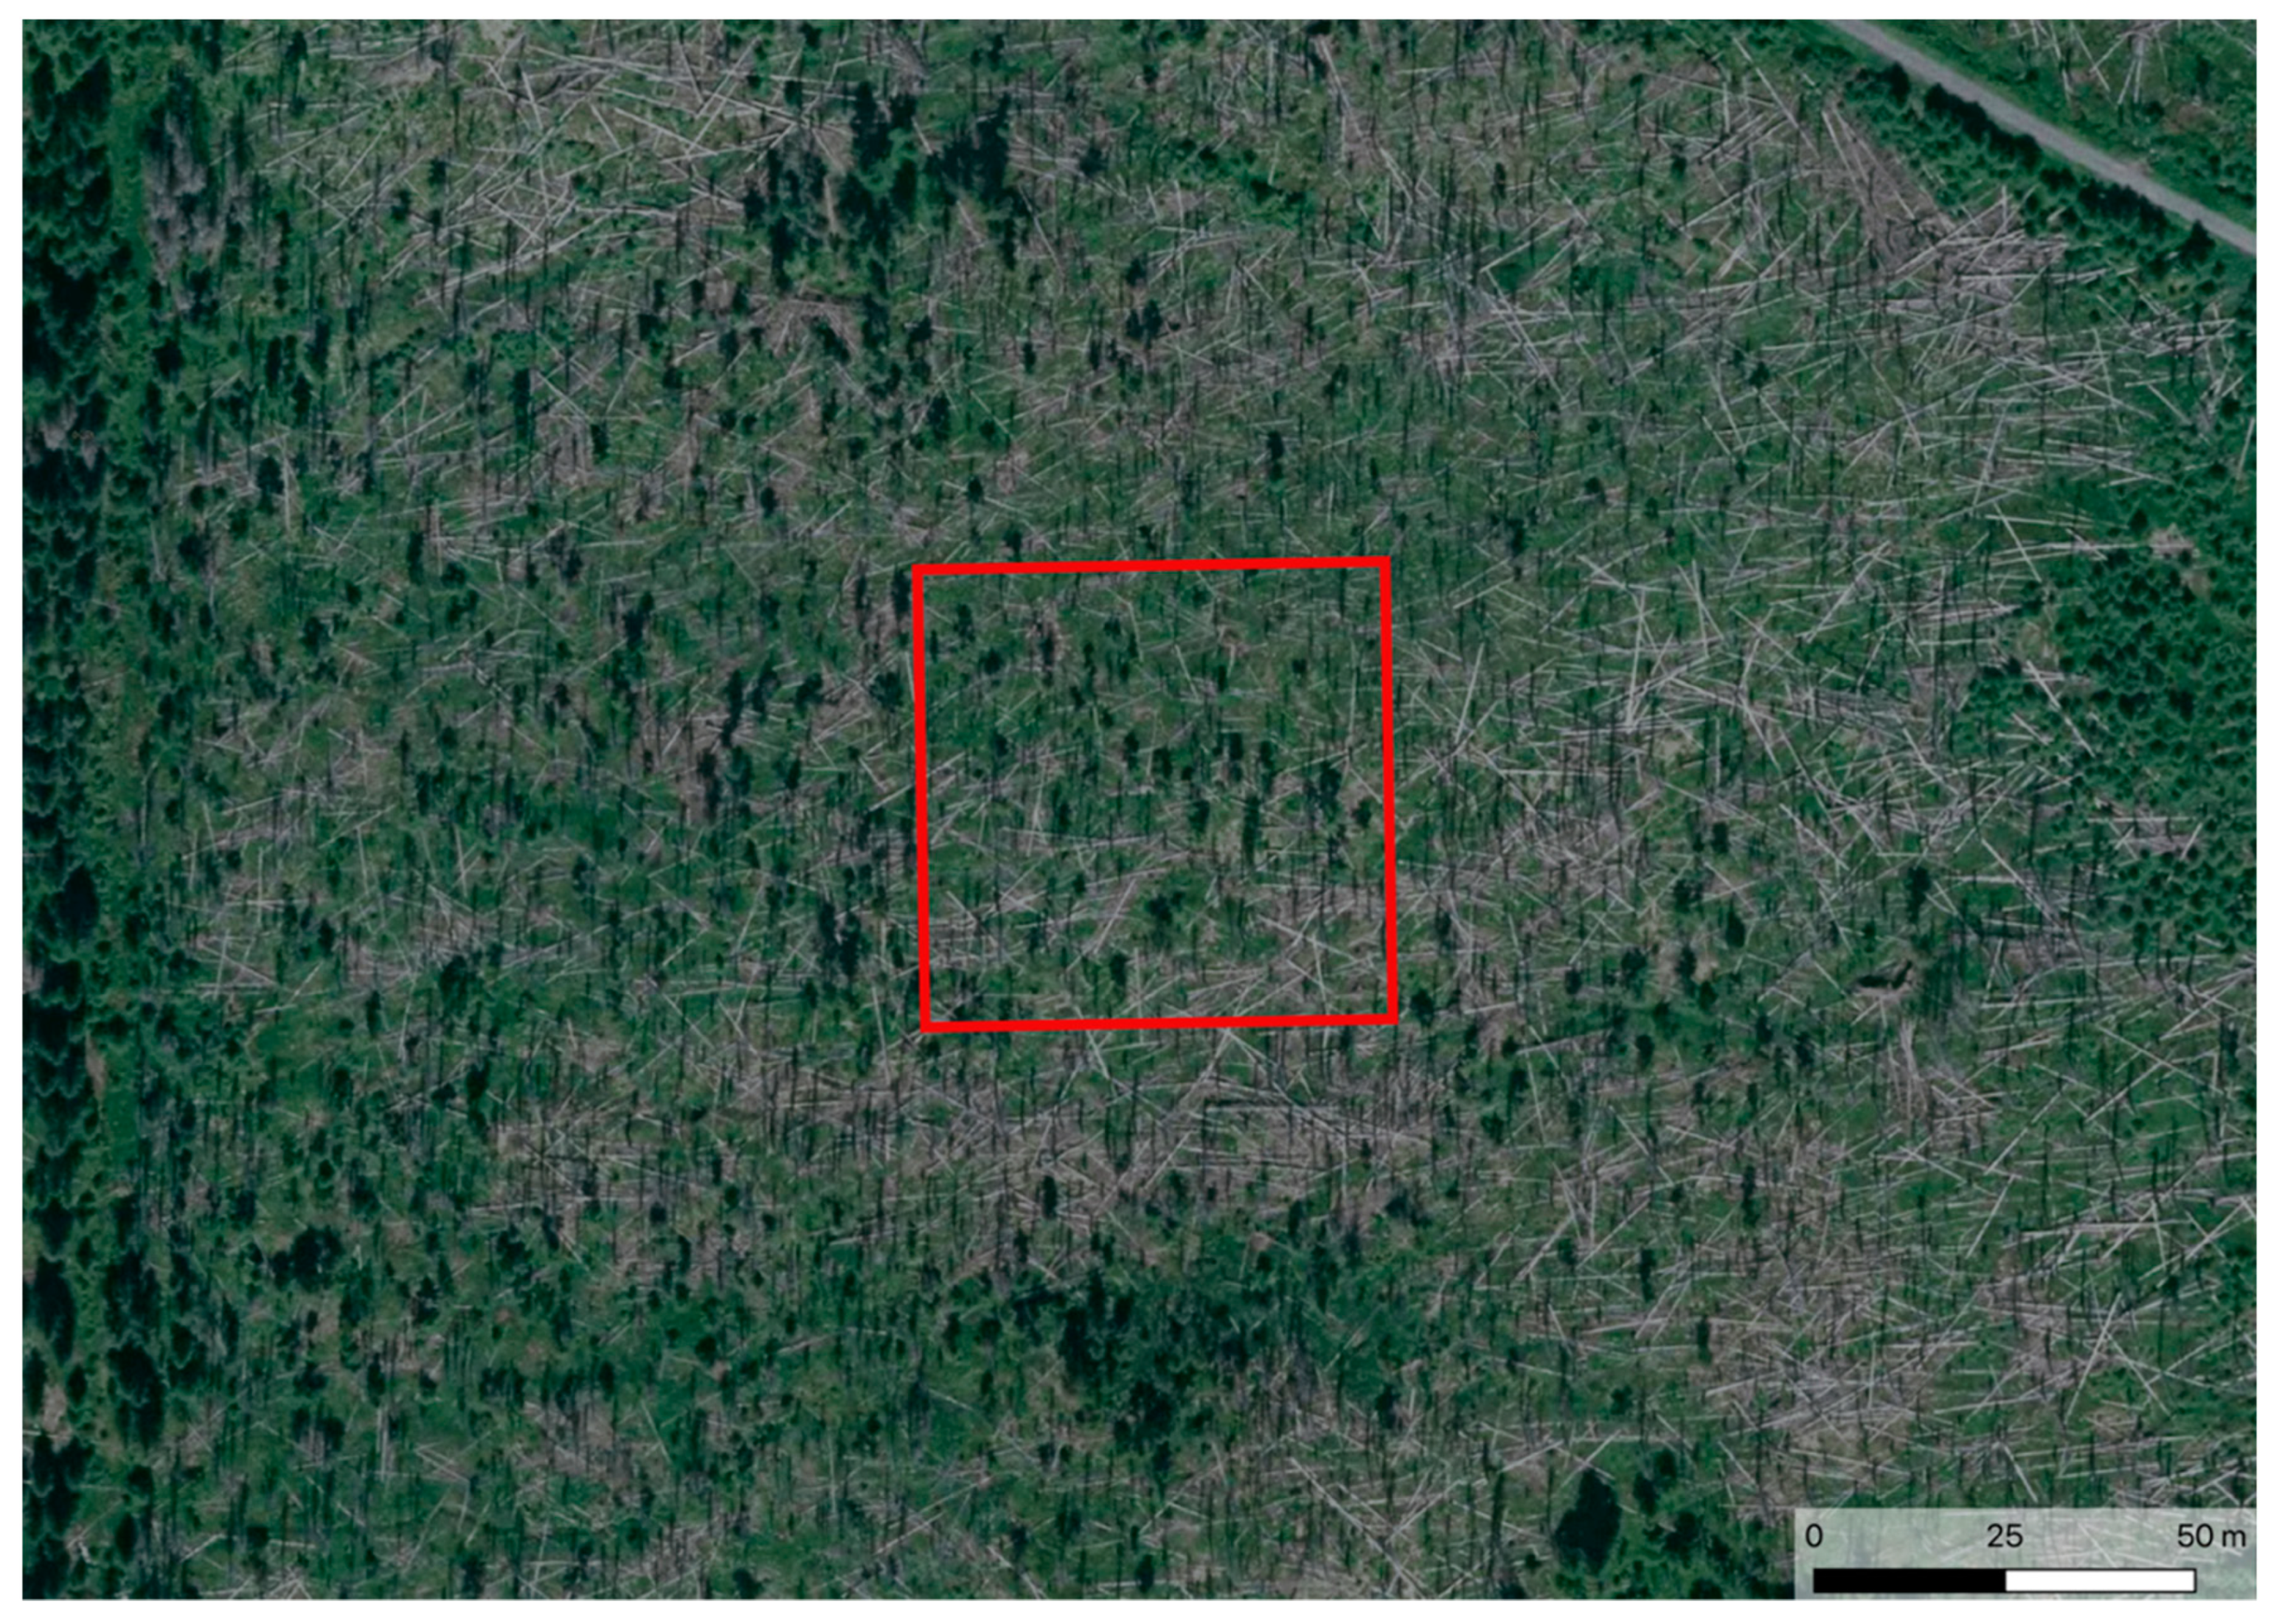
The study area 2 (SA2recov) represents a place where a massive bark beetle attack occurred in the Sumava NP with the culmination around the year 2012 (the disturbance occurred between 2009–2012). Currently, the slow renewal of the ecosystem is taking place without any forest management intervention. More than 50% of the area is still covered by non-logged dead trees (spruces). Although this SA2recov is a wetland area, the location has been under pressure from drought over the years since 2017. New small trees (spruces) and shrubs are visible in the territory (Figure 3). The average altitude is 1160 m above sea level.
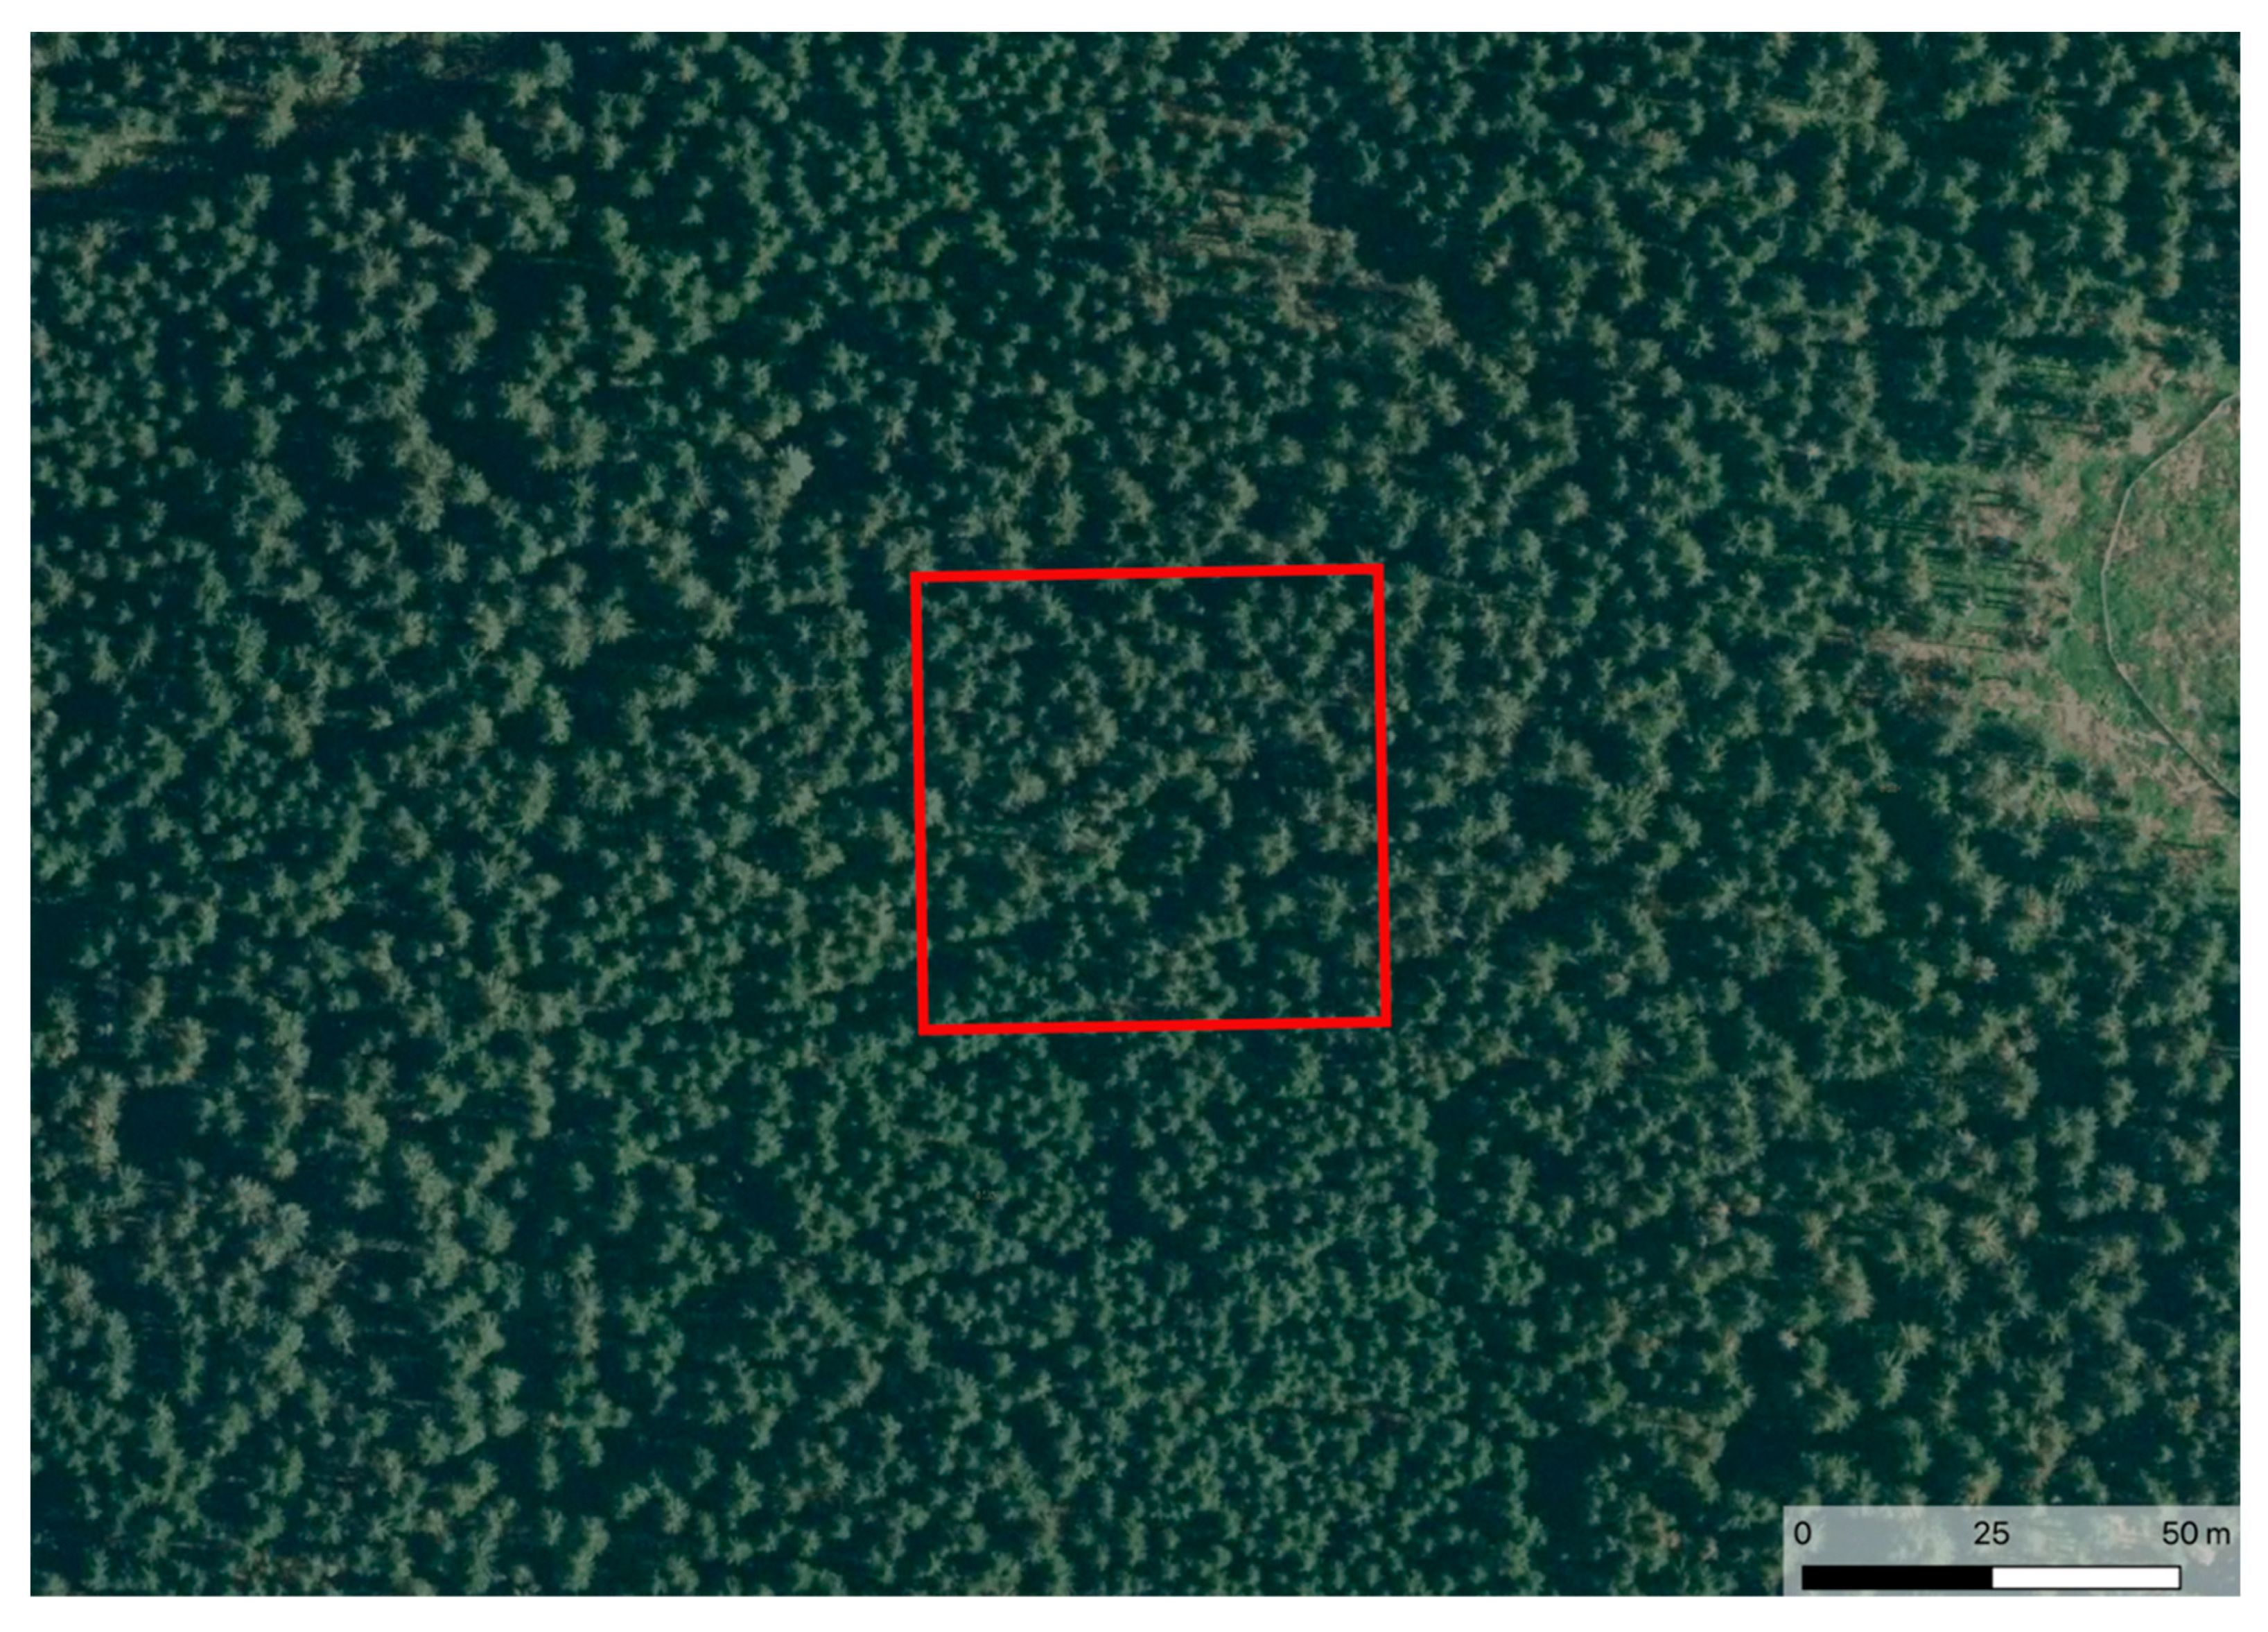
The study area 3 (SA3non-dist) located in the Sumava NP has not incurred any significant calamity or disturbance over the past 30 years. The altitude is approximately 1035 m above sea level (Figure 4). This is a forest ecosystem covered by grass and moss in the undergrowth that maintains a stable humidity. However, in recent years, we can see the impact of the drought on the forest. A reduction in the number of needles on the trees during the long-term field survey was observed.
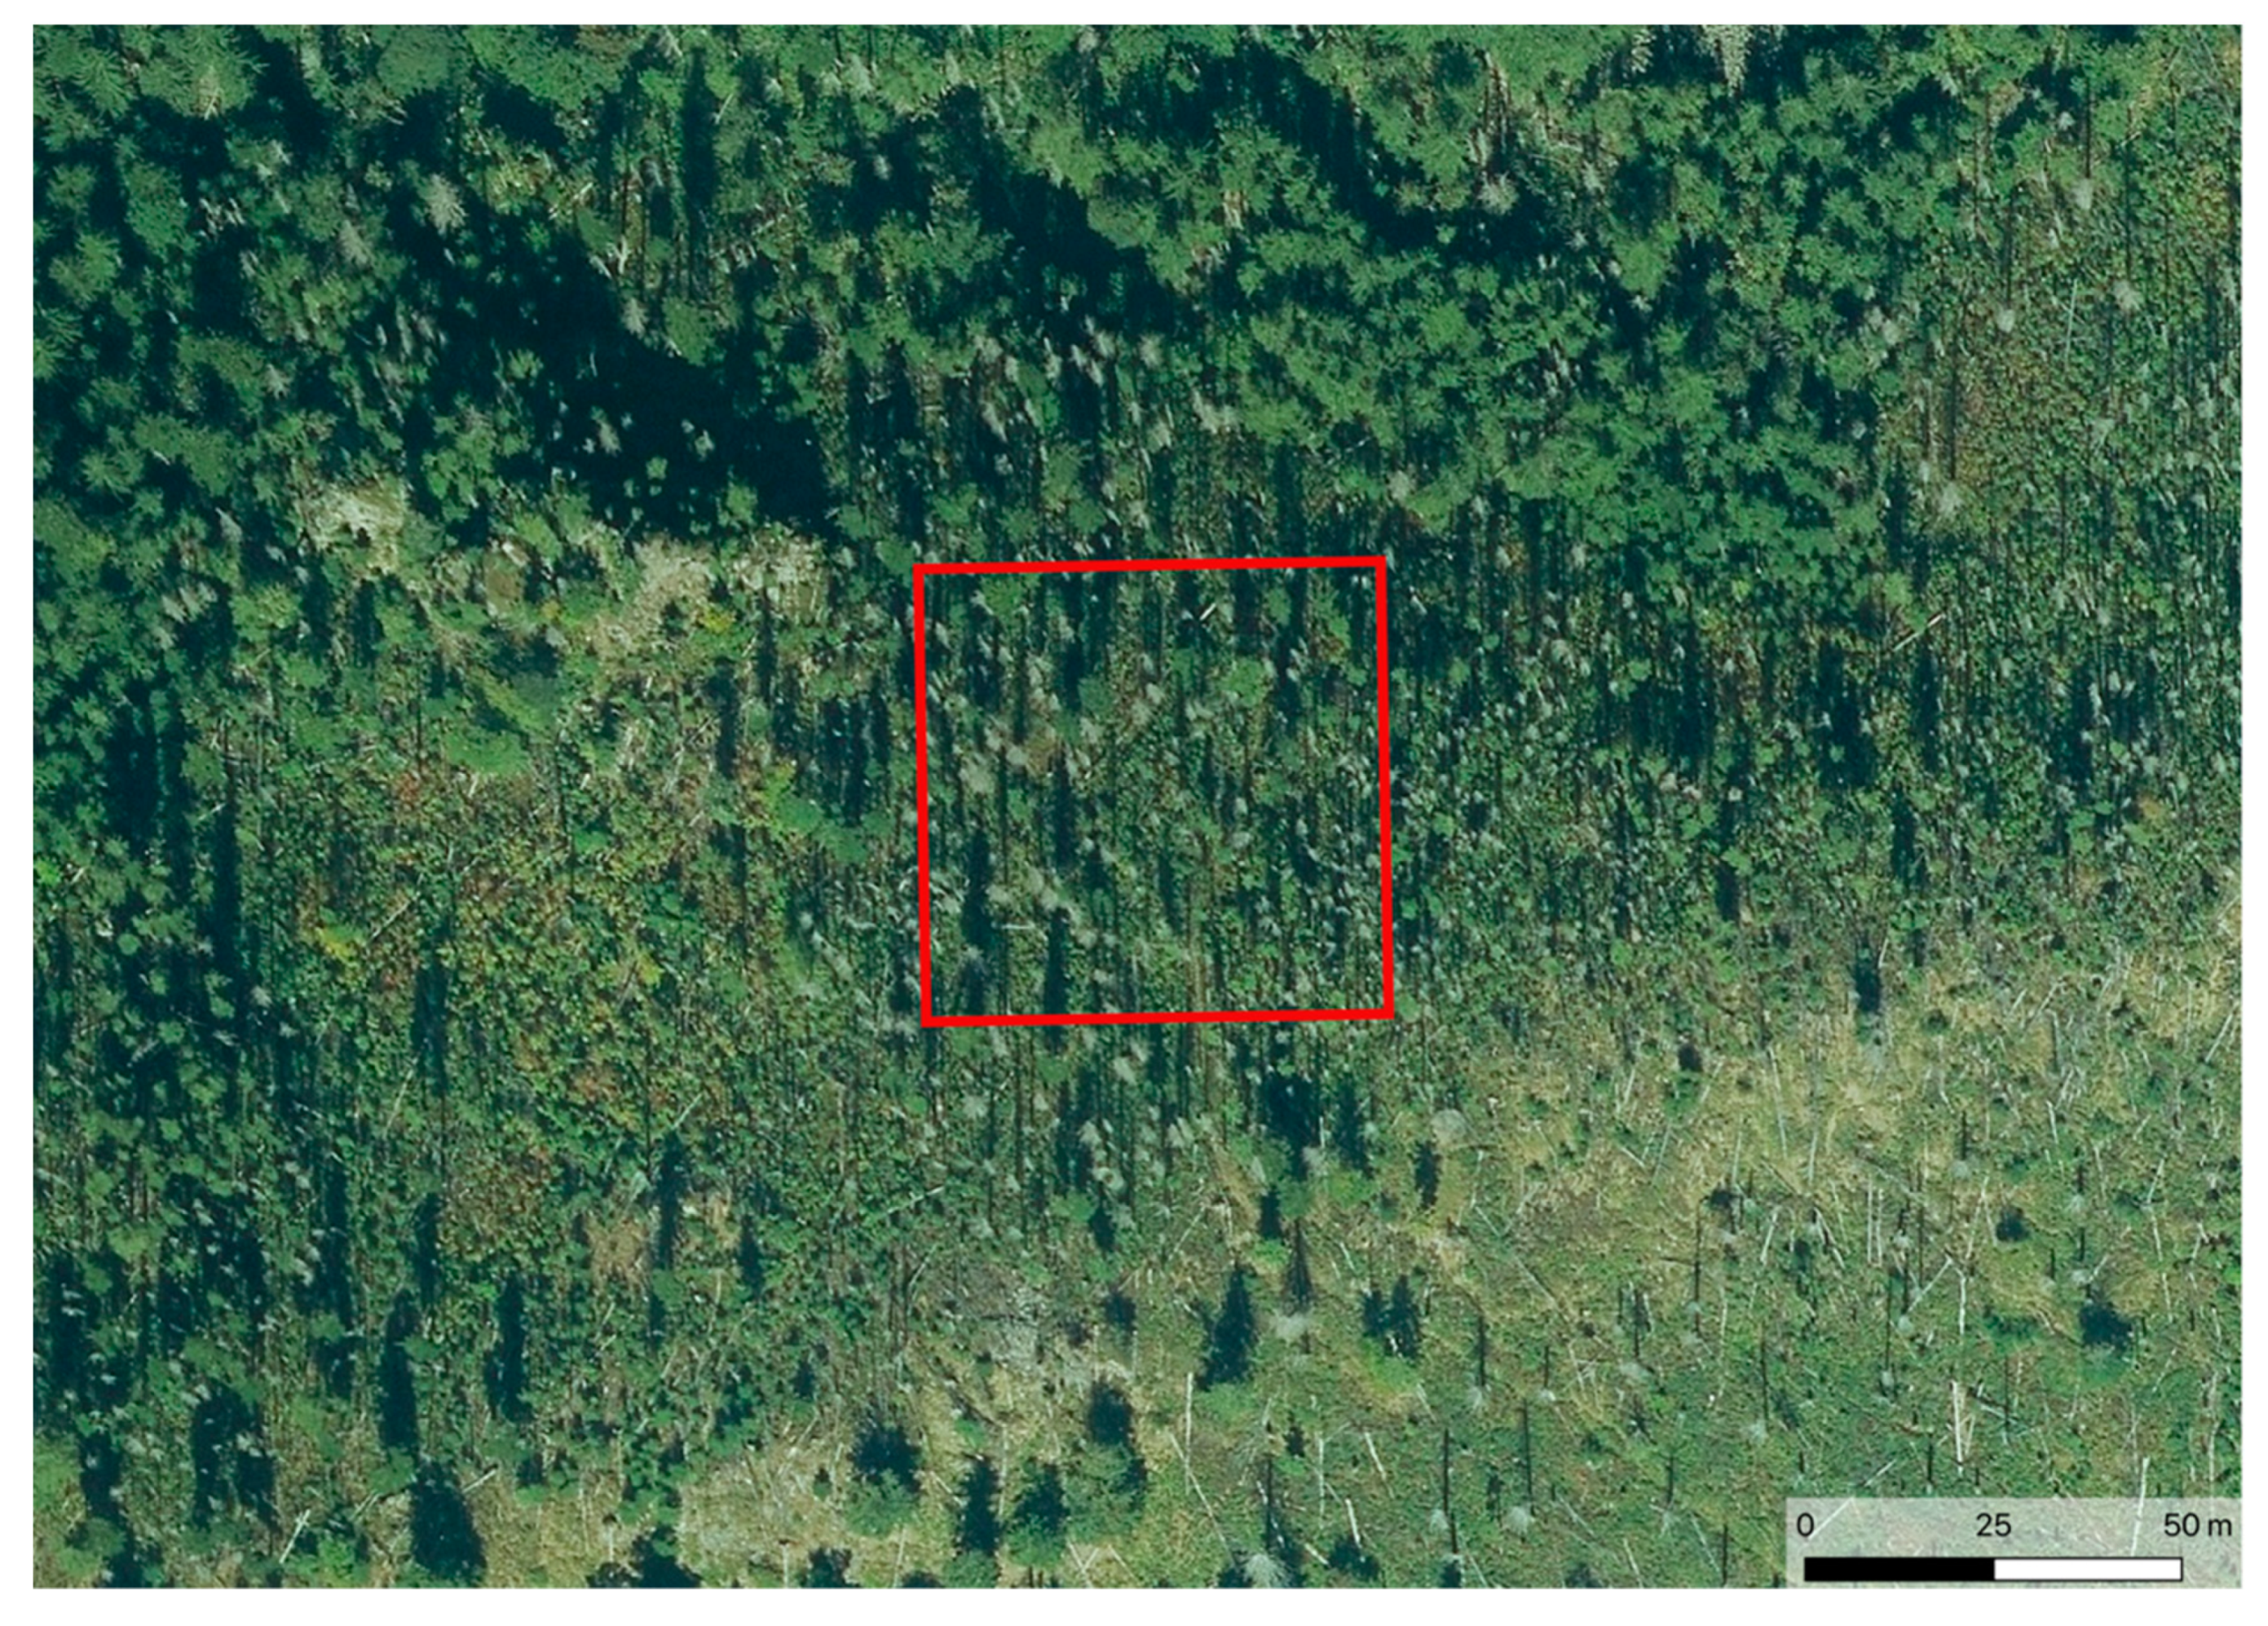
The study area 4 (SA4recov) is located in the NAPANT with an average altitude of 1300 m above sea level. This study area represents a place where the bark beetle outbreak gave rise to a decline in the spruce trees on the upper edge of the forest line level between the years 2007–2012 (Figure 5). In 2007, the wind calamity Kyrill took place, which caused, after 2007, a massive expansion of the bark beetle calamity in the surrounding areas. After the disturbance, the damaged trees were not logged and, currently, the recovery phase is still in progress.
The study area 5 (SA5non-dist) is located in the NAPANT and represents a place without any disturbance, with approximately 70-year-old trees clearly in good condition (Figure 6). The average altitude is 1335 m above sea level. The predominant representation of the forest trees is spruce (Picea abies), which naturally creates a functioning ecosystem of mountain spruce forests in the NAPANT.

2.2. Optical Data

2.2.1. Sentinel-2

For this study, the atmospherically corrected Sentinel-2 L2A data (using the Sen2Cor correction) without snow and cloud cover were used. The cloud and snow cover were identified by visual interpretation of the images using true and false color RGB band combinations. We worked with Sentinel-2 L2A data (sensed by satellites 2A and 2B) with 10- and 20-m spatial resolution. The Sentinel-2 data were used for the calculation of the vegetation indices and TS analysis.

2.2.2. Landsat 8

The second source of satellite data was the Landsat 8 images with a 30-m spatial resolution. Landsat 8 data were used for the evaluation of the temporal and spatial resolution based on a comparison with the Sentinel-2.
Both the available Sentinel-2 and Landsat 8 data were retrieved from the Sentinel Hub archive. The completeness of the archive of the Sentinel Hub application was validated/checked using the Copernicus Open Access Hub (for Sentinel-2) and using the United States Geological Survey (USGS) Earth Explorer (for Landsat 8). The observation period was from 28 March 2017 (release of Sentinel-2 L2A data) to 31 December 2019.

2.3. Data Processing

2.3.1. Evaluation of the Spatial and Temporal Resolution

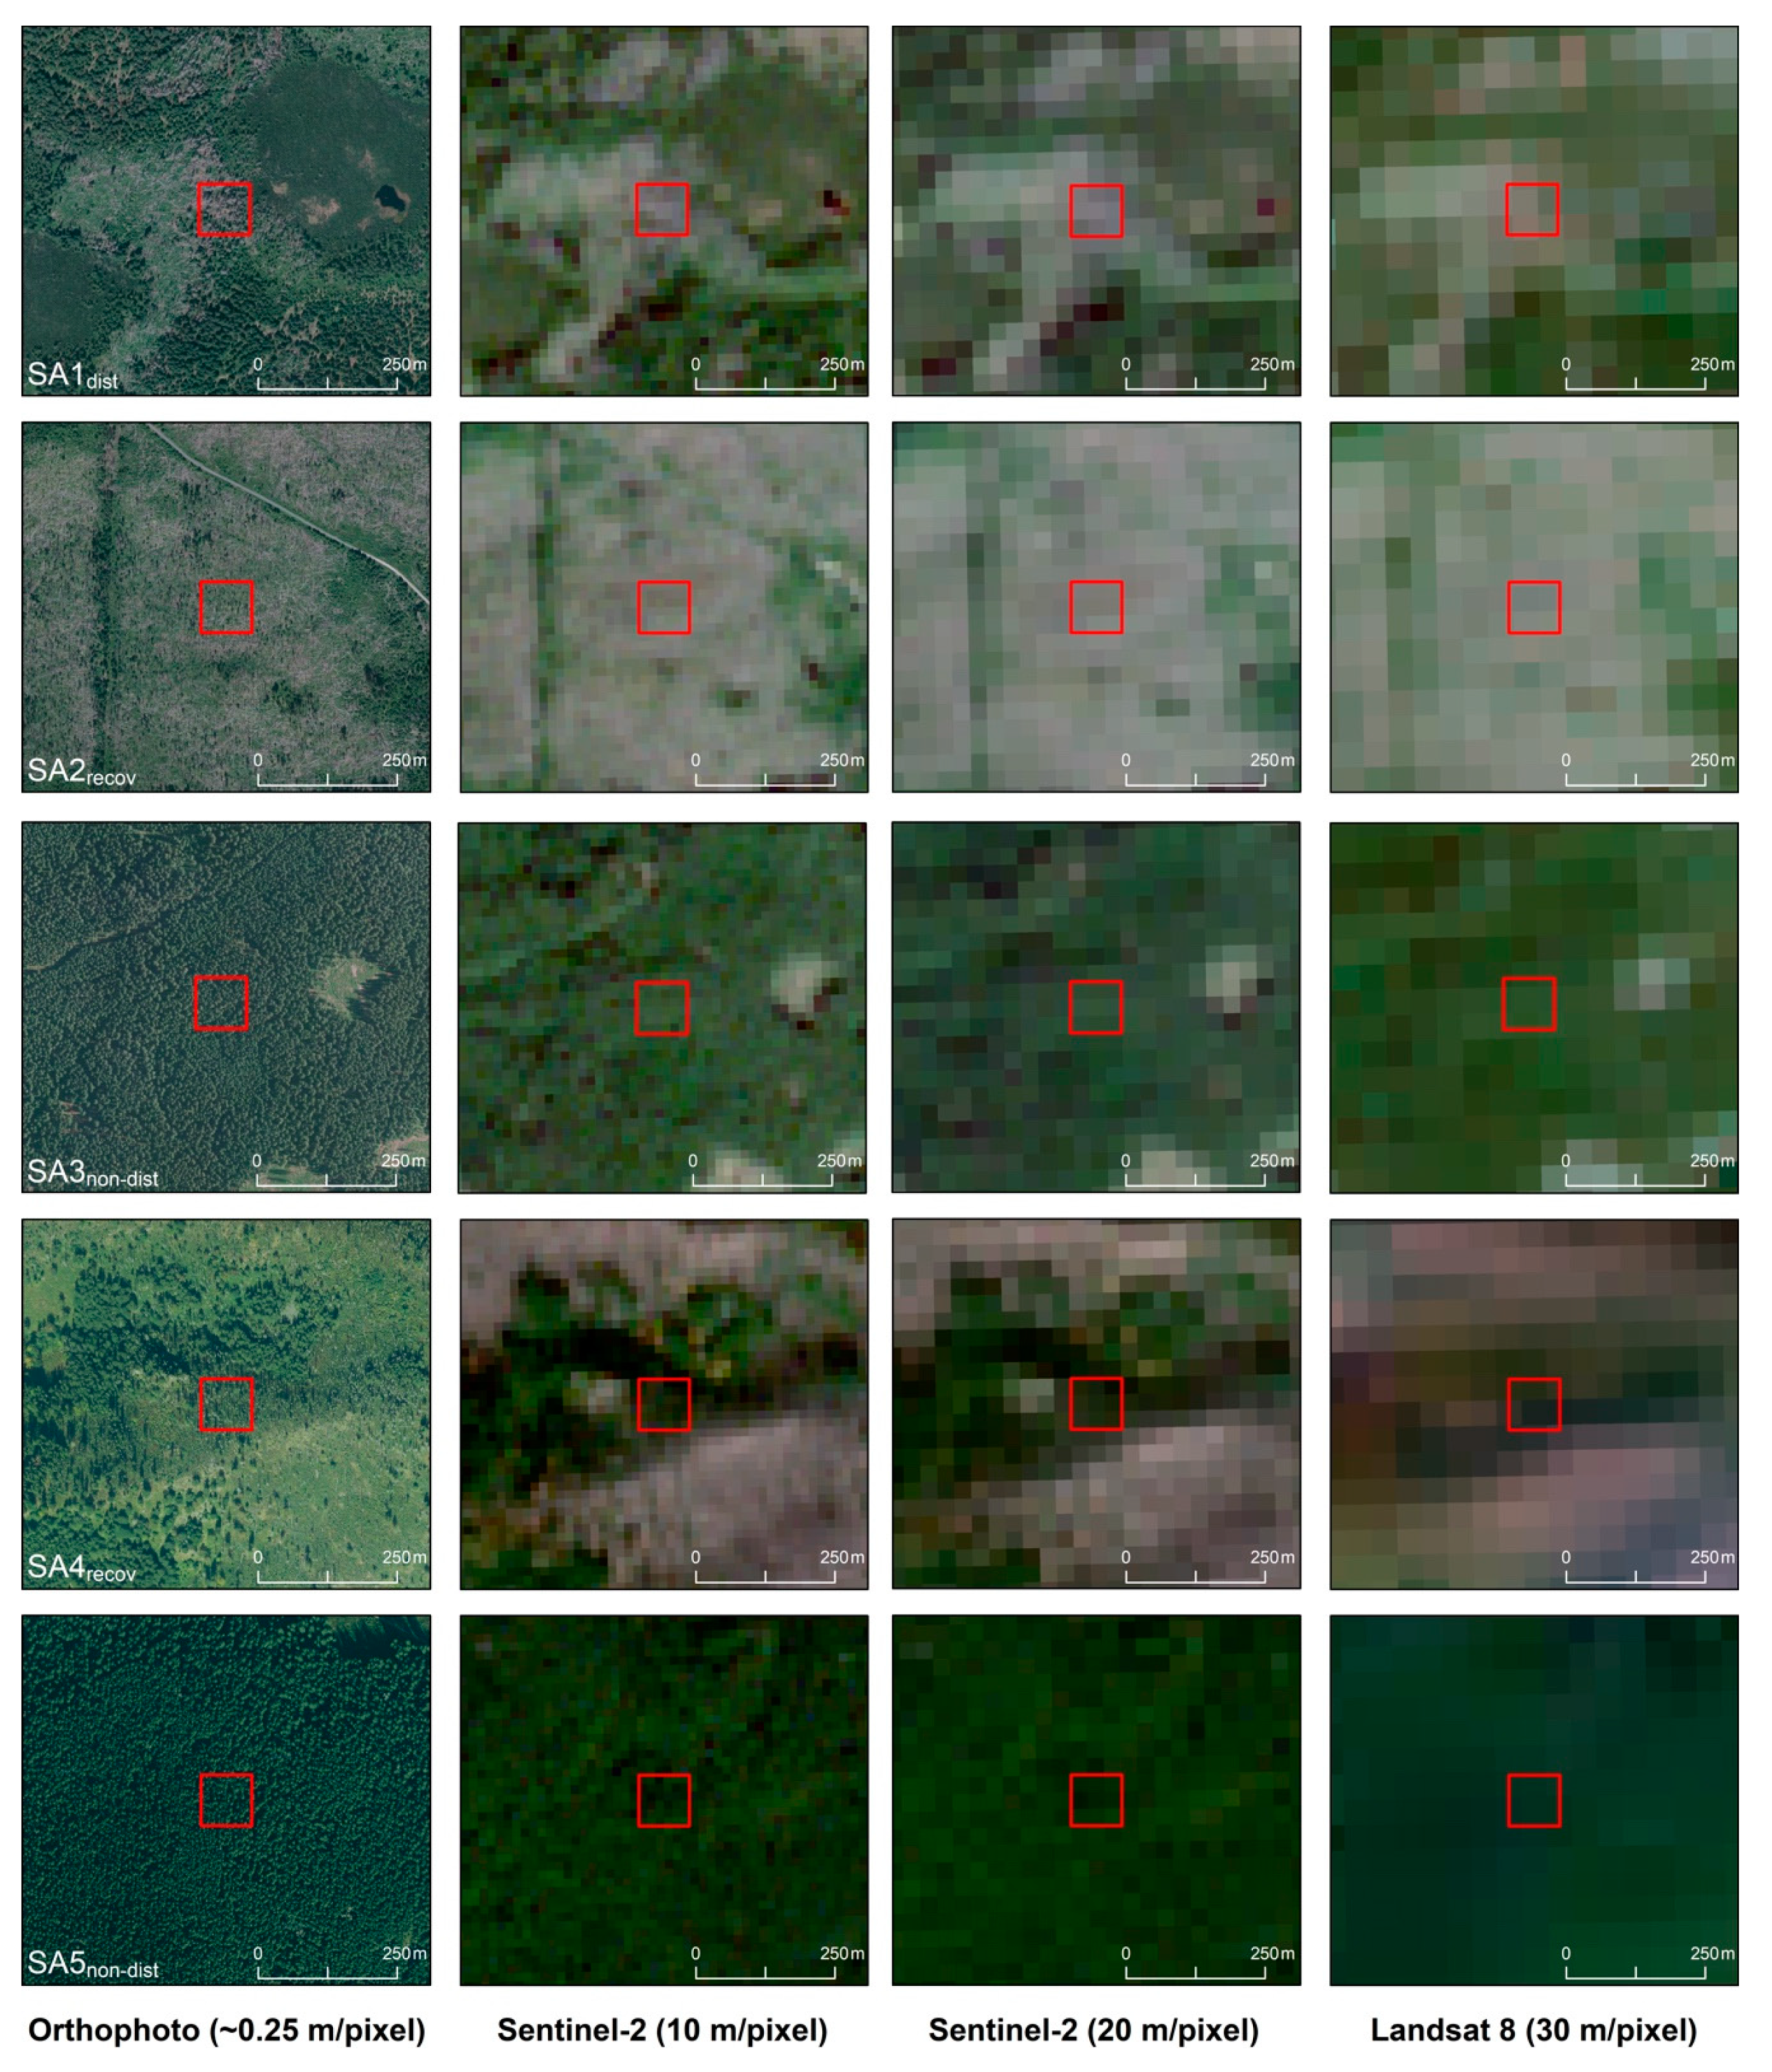
The comparison and evaluation of the spatial resolution of the Sentinel-2 and Landsat 8 was performed in all study areas. Based on images that were received at a similar time, the abilities of both data sets for the interpretation of the landscape/forest structure were visually evaluated and compared. The goal was to show a significant progress of Sentinel-2 data in the detection of the forest structure (different types of forest) and shadows in the local scale.
Second, the abilities of both data sets (Sentinel-2 and Landsat 8) regarding to the time–availability (temporal resolution) in all five study areas were evaluated based on the time–availability charts. These charts presented and compared the number of cloud- and snow-free images of the Sentinel-2 and Landsat 8 available within the months of 2017–2019. The Sentinel Hub data archive was used to compare both missions. The data collection of this archive was verified/checked using the Copernicus Open Access Hub (for the Sentinel mission) and the USGS Earth Explorer (for the Landsat mission).

2.3.2. TS Analysis

Subsequently, the TS analysis using the Sentinel-2 data was performed. The data were processed in the Configuration Utility of the Sentinel Hub using scripts in the JavaScript Language. The Sentinel-2 data of both satellites 2A/2B were used and the indices were calculated for the period of 2017–2019 from the cloud- and snow-cover-free data. In total, 33 cloud-free images for SA1dist; 31 images for SA2recov; 27 images for SA3non-dist; 37 images for SA4recov; and 52 images for SA5non-dist were used (see Figure 7).
To ensure pure pixels (unmixed) of the individual forest type and a compatibility with the Sentinel Hub configuration (the bounding box), the extent of the study area was delimited with 6 × 6 pixels (with a 10-m spatial resolution) or 3 × 3 pixels (with a 20-m spatial resolution, respectively). The selection of the extent was inspired by similarly oriented studies [29,50,51]. The extent (minimal mapping unit (MMU)) was defined as the area of 60 × 60 m (3600 m2). This MMU ensured a sufficient areal representation of the evaluated type of forest and compatibility with the 10-m and 20-m bands of the Sentinel-2. Each area of interest was localized using GPS during the field research. The in situ and auxiliary data were used to be determined the observed type of forest. The value of the index was calculated as the mean value of 3 × 3 pixels (with a 20-m resolution) for the normalized difference moisture index (NDMI) or as the mean value of 6 × 6 pixels (with a 10-m resolution) for the normalized difference vegetation index (NDVI), tasseled cap greenness (TCG) and tasseled cap wetness (TCW). The selected 20-m bands of the Sentinel-2 were resampled and defined as a 10-m pixel for calculation of the TCG and TCW indices.
On the basis of several elaborated studies focused on the TS and an evaluation of the forest vegetation [23,24,25,26,27] we decided to use the following vegetation indices in our study. The normalized difference vegetation index (NDVI) (Equation (1)) [52]:
NDVI = (NIR − RED) / (NIR + RED),
where the Sentinel-2 bands B04 (RED) and B08 were used (NIR) with a 10-m spatial resolution (Table A1). The normalized difference moisture index (NDMI) (Equation (2)) by Xiao et al. (2019) [53] was calculated:
NDMI = (NIR − SWIR) / (NIR + SWIR),
where the Sentinel-2 bands B8A (NIR) and B11 (SWIR) were used with a 20-m spatial resolution (Table A1).
These indices were selected on the basis of the above-mentioned publications as the most recommended remote sensing indices for assessing the health of the vegetation. The NDMI vegetation index was designed to investigate the changes in the physiology of the vegetation and so this should be a suitable indicator to detect the disturbances in the forest [20]. The combination of the NIR with the SWIR removed variations induced by the leaf internal structure and leaf dry matter content, improving the accuracy in retrieving the vegetation water content. The range of NDMI could reach values from −1.00 to 1.00. The advantage of the NDVI index was the precise detection of the scarcely disturbed vegetation structures [12,25]. The range of NDVI could reach values from −1.00 to 1.00. The higher the NDVI value, the higher the amount of the vegetation (biomass) and also the better the health status [52]. This index is often used in agriculture and forestry. The highest values are deciduous forests (0.85–0.95) and coniferous forests (0.75–0.90), while values lower than 0.70 are mostly vegetation, and the bare ground registers even lower values. Values lower than 0.30 represent man-made surfaces. Water surfaces have the lowest values, reaching zero or negative values [25].
In addition, orthogonal indices were also selected for the analysis: tasseled cap greenness (TCG) (Equation (3)) and tasseled cap wetness (TCW) (Equation (4)). To create these indices, the following equations with the exact parameters (IDB: index database from the University of Bonn, www.indexdatabase.de) for the Sentinel-2 data were used. The list of bands (B02–B11) can be seen in Table A1:
TCG = −0.28482 ∗ B02 − 0.24353 ∗ B03 − 0.54364 ∗ B04 + 0.72438 ∗ B08 + 0.084011 ∗ B11 − 0.180012 ∗ B12,
TCW = 0.1509 ∗ B02 + 0.1973 ∗ B03 + 0.3279 ∗ B04 + 0.3406 ∗ B08 − 0.7112 ∗ B11 − 0.4572 ∗ B12.
The spatial resolution was 10 m in both cases of the TCW and TCG. The spectral bands with 20-m resolution were resampled to 10 m with the nearest neighbor method (the resampled pixel grid was identical to the original 10-m bands) [54,55]. The tasseled cap transformation is the conversion of the values in a set of bands; thus, it transforms the image data to a special coordinate system with a set of orthogonal axes. Typically, there are three axes: brightness, greenness, and wetness (and sometimes yellowness). The greenness is associated with the green vegetation and the wetness with the soil moisture [51,56,57,58]. The Sentinel-2 NIR bands differed in their spatial resolution: the NDVI and tasseled cap indices used band B08 (NIR 1) and NDMI used band B8A (NIR 5). Band B8A has the same spatial resolution as band B11 (20 m); the spatial resolution of band B08 is 10 m (Table A1).
The TS of the vegetation indices and the tasseled cap indices were evaluated using statistical methods. The values were exported to a spreadsheet editor, where the TS charts with value curves were created. The polynomial trends (2nd grade) for these curves were used to define the approximate or anticipated cyclic phenomena, focused on their variability across the different types of areas. A detailed statistical evaluation of the achieved values was performed, and aggregate mathematical statistical plots were created. The standard deviation was calculated for all the areas of interest.
The suitability of the individual vegetation indices for monitoring healthy vegetation and the recovery phase was assessed by statistical tests using RStudio software. The Shapiro–Wilk test was used to check the normality of the data. Due to the nonparametric data set, the Wilcoxon test was used to assess the ability to distinguish different phases of the forest vegetation affected by the disturbance. The aim was to prove the differences between the individual groups of forest (not affected, under disturbance in the individual phases of the recovery mode) obtained from the in situ and auxiliary data. The determined level of significance was α = 0.05.

3. Results

3.1. Comparison of the Spatial and Temporal Resolution of Sentinel-2 and Landsat 8

Figure 7 shows the comparison of the spatial resolution of the Landsat 8 (30 m) and Sentinel-2 (20 and 10 m) for all the study areas. The areas of interest sensed by the Sentinel-2 with the 10-m spatial resolution contained nine times more pixels than the same area sensed by the Landsat 8. The Sentinel-2 image allowed us to recognize the more detailed structure of the landscape, e.g., roads, groups of trees, shadows of trees and clear-cuts. This detailed landscape structure was mixed in pixels (mixels) of the Landsat 8 with the lower spatial resolution. With a higher resolution, clouds and shadows can be better detected, especially cirrus clouds that may not at first be visible and may affect the results of TS. The Sentinel-2 data proved to have a better spatial resolution and have progressive abilities in the detection and classification of the forest vegetation.
Figure 8 and Figure 9 and Table 2 document the temporal distribution/resolution of the Sentinel-2 and Landsat 8 images and the number of the selected images without clouds and snow cover in the study areas for 2017–2019. For SA1dist, we found 123 Landsat images; for SA2recov and SA3non-dist, we found 126 Landsat images; and for SA4recov and SA5non-dist, we found 125 Landsat images. According to our investigation, three Landsat images were missing in the Sentinel Hub archive (one for SA1dist, one for SA4recov and one SA5non-dist). These three extra images were found in the USGS Earth Explorer Hub and were included into the total number of available images. Concerning the Sentinel-2 data, 185 images were found for each of the SA1dist, SA2recov, and SA3non-dist (the Sumava National Park). For the SA4recov, we found 362 Sentinel-2 images, and 367 Sentinel-2 images were found for the SA5non-dist (both from the NAPANT). Clearly, many more Sentinel-2 images were found for the study areas in the NAPANT. Concerning the temporal resolution of the Sentinel-2, the NAPANT areas had better data availability and a new image was acquired approximately every two or three days, because, e.g., the SA5non-dist was overlapped by more scenes (34UCV, 34UDV) as detailed in Figure 8. For the Sumava NP, the new image was acquired every five days. The Sentinel-2 data brought a new dimension in the data availability and its improved spatial resolution, achieved by the two satellites (2A and 2B), was much more operational for forest monitoring than the traditional Landsat data (Figure 9).
The collection of the Sentinel-2 data in the archive of Sentinel Hub was validated/checked using the Copernicus Open Access Hub. We found the same number of images of Sentinel-2 in both the Sentinel Hub archive and the Copernicus Open Access Hub for all the study areas. All the available images were visually checked, and images affected by the cloud and snow were excluded from the list of used images. In total, 106 Landsat 8 images were selected from all 625 available images (17%), and a total of 180 Sentinel-2 images were selected from all 1284 available images (14%) as detailed in Table 2.

3.2. Time Series of the Vegetation Indices Using Sentinel-2 Data

The results contain the values of the selected indices in the observed areas. The SA1dist, SA2recov, and SA4recov were impacted by disturbances and, on the contrary, the SA3non-dist and SA5non-dist were without any significant disturbance. For this part of our study, only the Sentinel-2 data were used.

3.2.1. NDVI Time Series

Figure 10a shows the curves of the NDVI vegetation index during the observed years in the study areas. It is possible to see a different trend in the range of values of the disturbed and undisturbed study areas from the graph. The values of the areas without a disturbance range from 0.70 to 1.00, and the values of the study areas with the disturbances do not exceed 0.82. The values of the area affected by disturbances in different phases of recovery differed from each other. The SA1dist, which was in an initial phase of the transition from the disturbance to recovery phase is clearly visible and detectable in Figure 10a. The SA4recov in the NAPANT had a wider range of values and overlapped with the values of the undisturbed areas. It is possible to find a high variation of the values in the SA2recov and SA4recov, which was caused by the various composition of trees and herbs in these areas in the recovery mode.

3.2.2. NDMI Time Series

Figure 10b shows the values of the NDMI index. The values of the index are evidently divided (grouped) by the specific type of study area (with or without the impact of a disturbance). The values of the disturbed and undisturbed almost do not overlap and create obvious groups with a border in the graph within the values threshold from 0.28 to 0.37. The values of the index of the disturbed forest approximately range from −0.12 to 0.28 and the undisturbed areas range from 0.37 to 0.69. We can recognize the low differences in the evolution of the values between SA2recov and SA4recov. Both areas were in the recovery phase at a moderately advanced stage (by the in situ data and the archive records of the national parks). The values of SA1dist were the lowest from all the study areas. This area was in the onset of the recovery phase.

3.2.3. Tasseled Cap Greenness (TCG) Time Series

Figure 10c represents the values of the TCG orthogonal index. The chart shows minimal differences in the values of the study areas with recovery phase or healthy forest, so it is difficult to find any specific characteristic values related to the type of the study area. The differences between the disturbed area with an initial phase of recovery (SA1dist) and undisturbed areas or areas in the more advanced recovery phases are visible. The values of the disturbed forest vegetation with an initial recovery phase represent a range from 0.02 to 0.09 and the undisturbed or in the recovery phase range from 0.02 to 0.20. The SA1dist under a strong impact of disturbance had much lower variability of the values than the areas in the advanced recovery phase (SA2recov and SA4recov).

3.2.4. Tasseled Cap Wetness (TCW) Time Series

The TCW orthogonal index allowed us to define the specific groups of the values (Figure 10d). Differentiating the values of the disturbed and undisturbed study areas was possible. The values of the disturbed forest or recovery forest were concentrated in a range approximately from −0.10 to 0.01 and the undisturbed study areas ranged from 0.00 to 0.03. The values higher than 0.00 could be mostly considered as an undisturbed forest and the lower values as a forest under disturbance or in the recovery phase. Concerning the disturbed and recovery areas (SA1dist, SA2recov, and SA4recov), it is possible to recognize the more apparent recovery phase of the forest in SA4recov (NAPANT) characterized by the higher increasing the values of the TCW index. At the end of 2019, the values of SA4recov were higher than the values of SA1dist and SA2recov.

3.2.5. Statistical Analyses

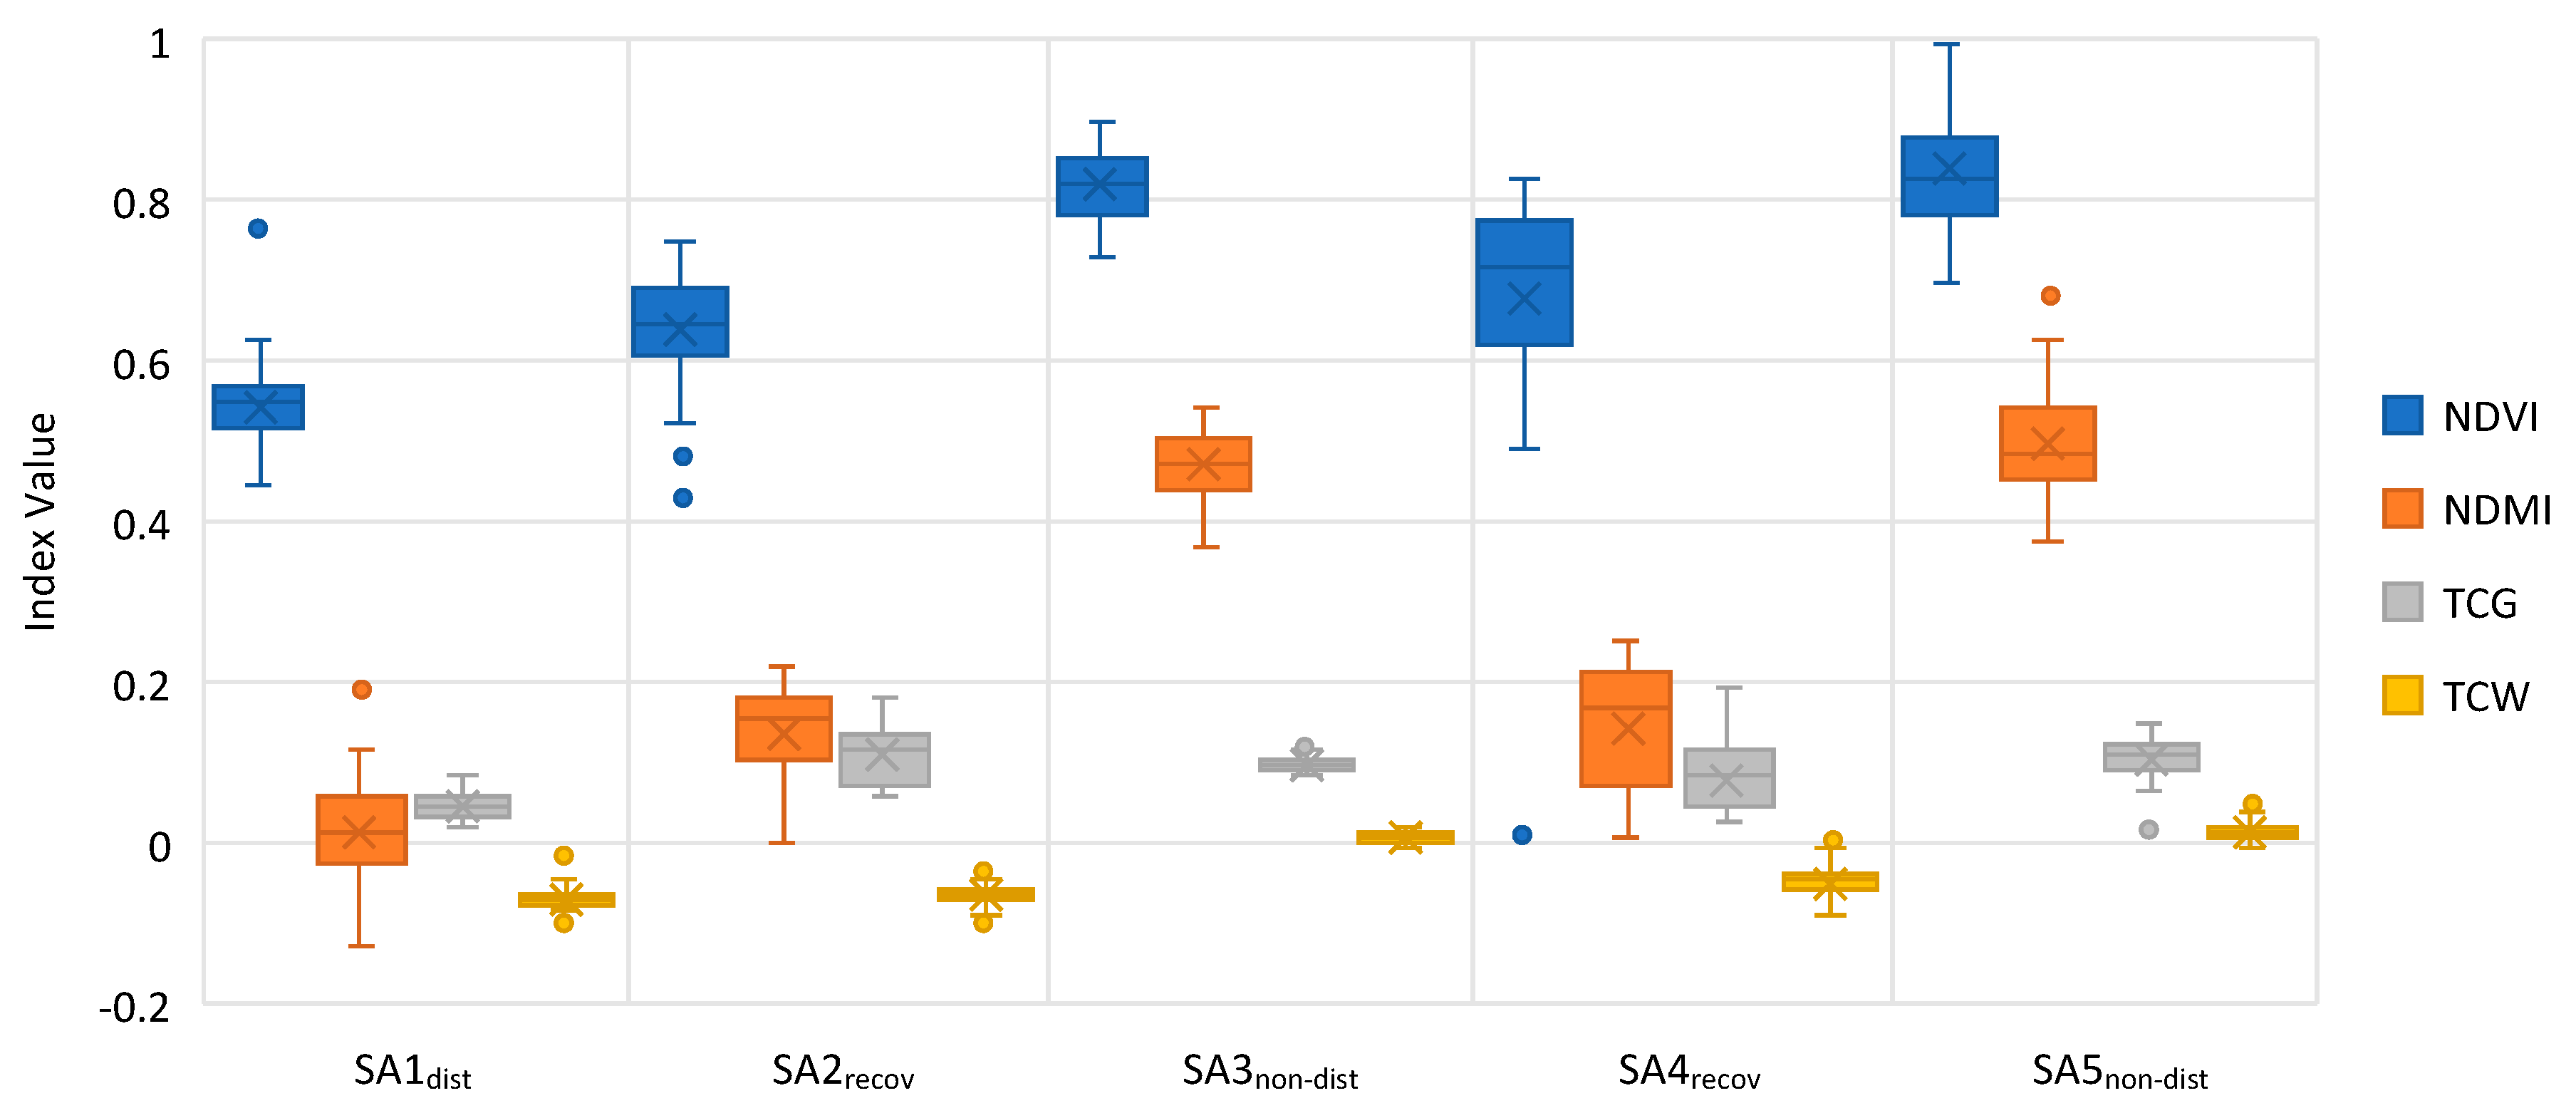
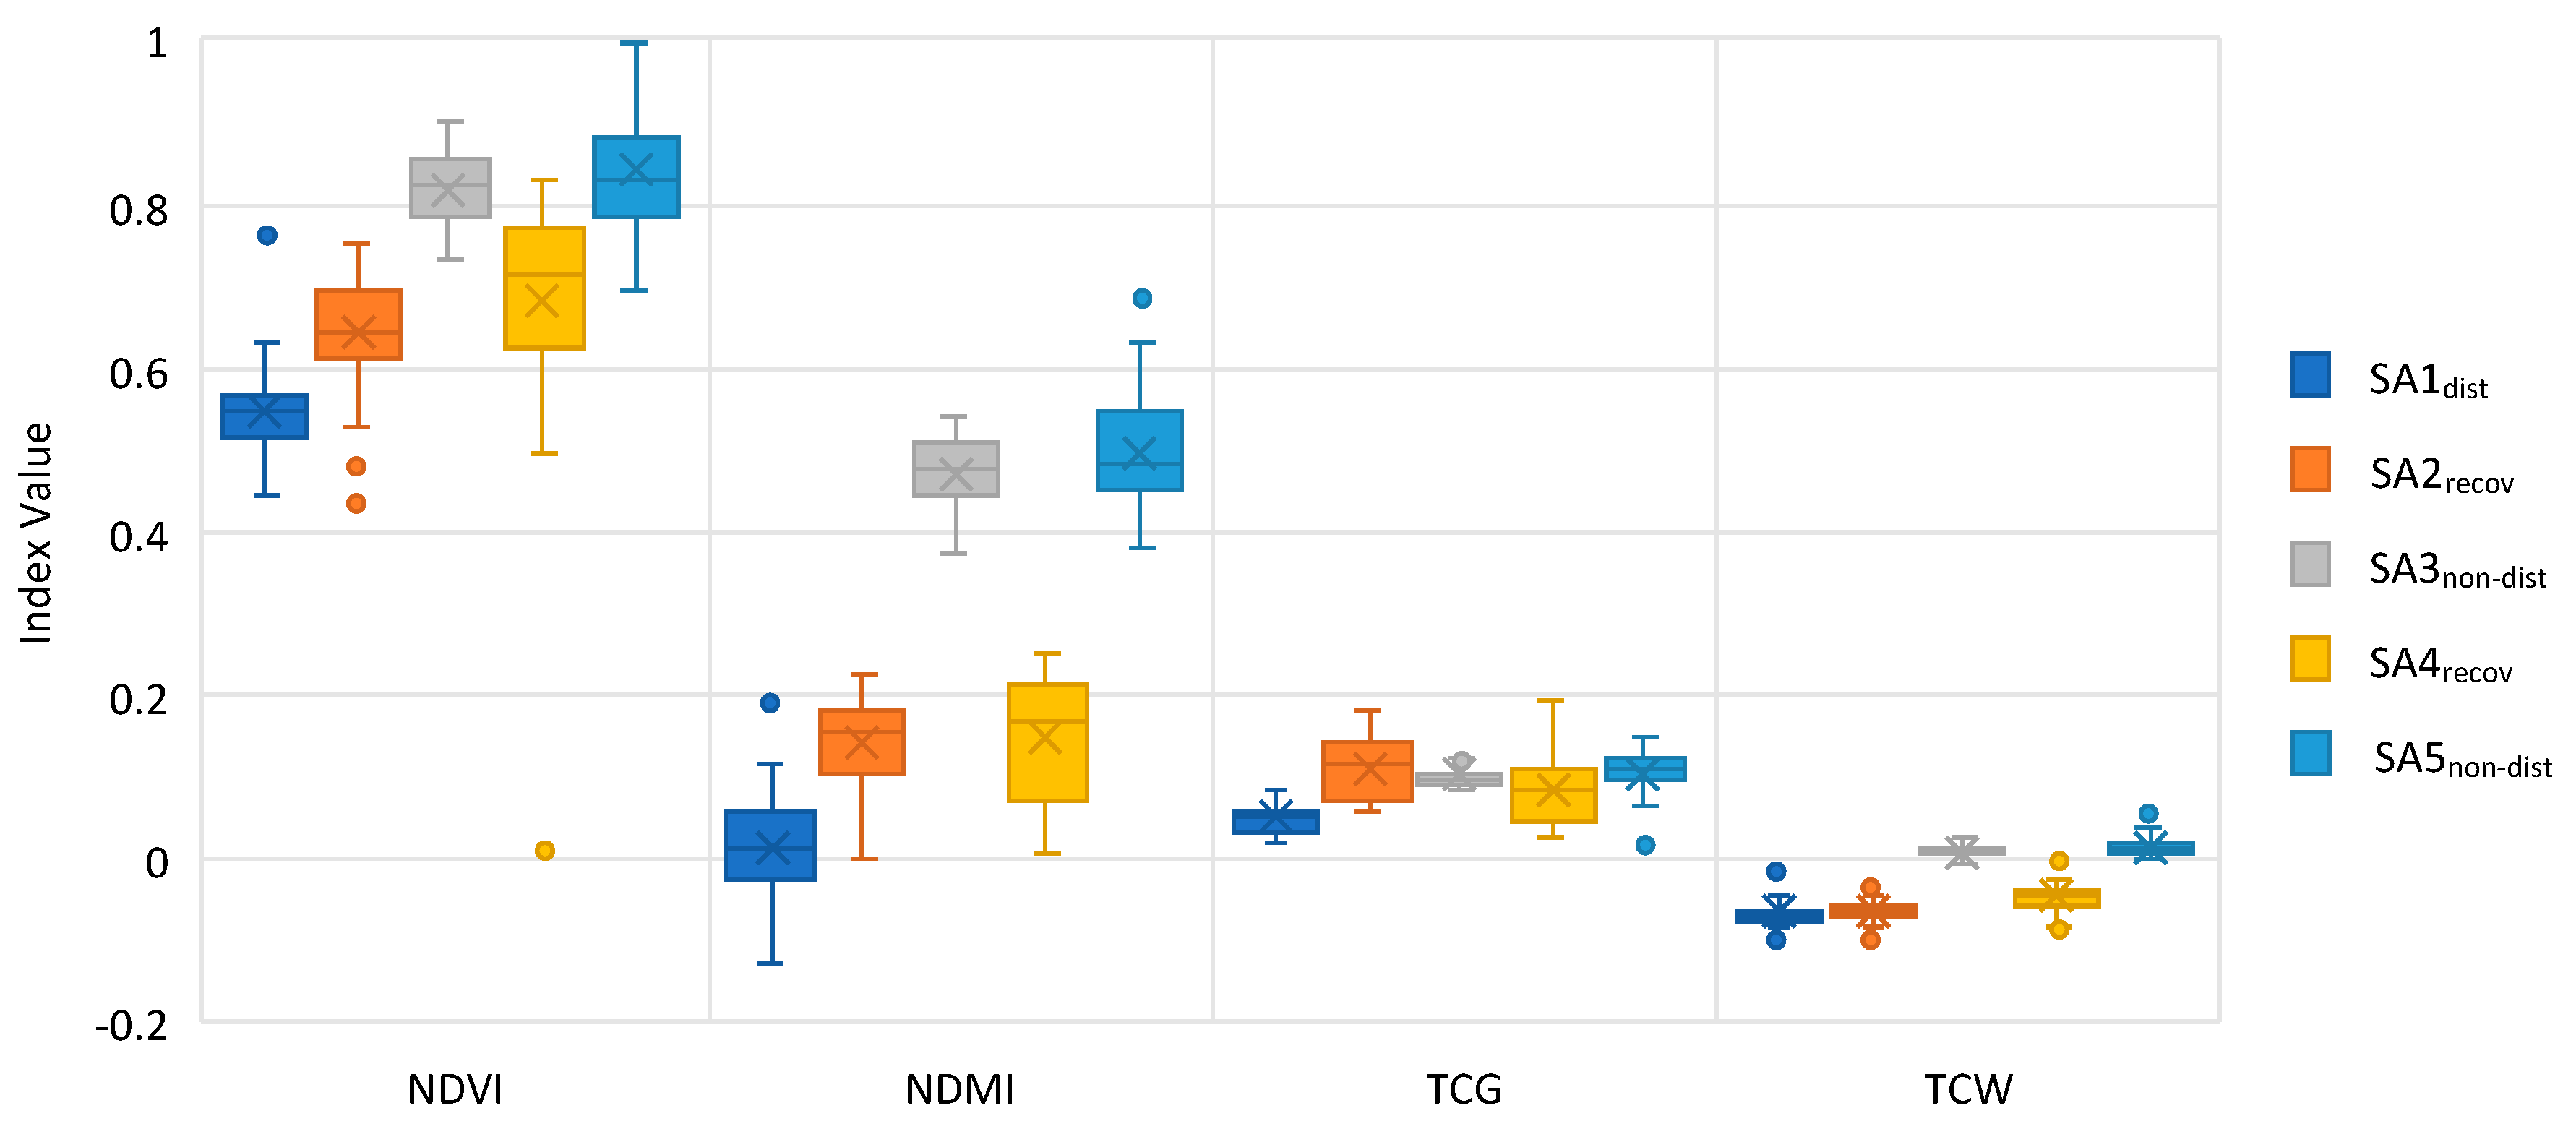
Figure 11 and Figure 12 demonstrate the values of the indices and their differences based on the mathematical statistical boxplots of all the study areas for the whole observed period. The results show that the SA3non-dist healthy forest both in the Sumava NP Czechia) or SA5non-dist in the NAPANT (Slovakia) had very similar values in all the observed indices. The differences in the values between the disturbed (or in the recovery mode) and undisturbed areas were possible to document on the basis of the NDVI, NDMI, and TCW (higher values in SA3non-dist and SA5non-dist and lower values in SA1dist, SA2recov, and SA4recov). On the other hand, very similar values were documented in the TCG index; only the SA1dist had slightly lower values. The disturbed areas documented a lower average value of the NDVI, NDMI, and TCW indices. The variability of the values in the disturbed areas was much higher than in the areas without disturbance. The SA1dist with the initial phase of recovery reflected a lower value of NDVI and NDMI than the SA2recov and SA4recov, which were in the more advanced recovery phase. The abilities of the TCG for the detection of undisturbed and disturbed vegetation in the different phases of recovery were weak and unsuitable for this purpose. Table 3 shows the standard deviation of the selected indices.
Table 4 shows the p values of the Shapiro–Wilk test for the individual indices and for all the study areas. The values, where the null hypothesis holds (at α = 0.05), are in italics and bold. None of the indices had a normal distribution for all the study areas. Based on these results, we decided to apply the Wilcoxon nonparametric test.
Table 5 shows the results of the Wilcoxon test for each study area combination and for each vegetation index. The values of the combinations, for which no statistically significant difference was found, are in italics and bold. The results of the Wilcoxon test show that the NDMI index seems the most appropriate for distinguishing the recovery and healthy vegetation. The Wilcoxon test indicates similarities between the SA1dist and SA2recov combination or SA3non-dist and SA5non-dist combination for the TCW index and thus confirmed the distinction between disturbed (or recovery mode in the initial phase, not the more advanced phase like SA4recov) and undisturbed areas. For the NDVI index, similarity was shown only for SA3non-dist and SA5non-dist combination; other study areas reflected different values. The test also proved the unsuitability of the TCG index for distinguishing individual forest phases. The results may be affected by multiple testing.

4. Discussion

Disturbance phenomena, such bark beetle and wind calamities, are one of the most urgent problems in the forest ecosystems of Central Europe. Their overgrowth is closely related to climate changes and the spread of non-indigenous coniferous trees in Central Europe, e.g., spruce (Picea abies). In both observed national parks (the Sumava National Park in Czechia and the NAPANT in Slovakia), spruce is the dominant tree. The dominance of spruce monocultures was caused by foresters due to market-oriented forest management. Currently, under new environmental politics and under the influence of the climate changes, national parks have implemented more environmentally oriented and sustainable management practices, often without any interventions of the foresters. The primary task of that management is to achieve a natural and environmentally stable forest. Spruce monocultures, higher temperatures and abiotic calamities can cause the appropriate conditions for bark beetle calamities. On the other hand, a sustainable management should create a natural ecosystem suitable for richer communities of species compared to the spruce monoculture.
Different approaches are now visible in forest management in Europe. The forests in the NAPANT national park are mostly forestry managed. In the case of the occurrence of a bark beetle outbreak, the obligation of the owner/administrator to cut down the forest in the intervention zone exists. Typically, more than half of the dead trees are harvested after the calamity. However, about 15% of the national park area is currently in a non-intervention mode (SA4recov). In the case of a bark beetle occurrence, an obligation of the owner/administrator to cut down the forest in intervention zone exists, despite the value of the nonprofit functions in the nature–close management of forests. On the other hand, a forest management practice with very limited intervention was implemented in the Sumana NP. Hence, a natural renewal of the forest ecosystem has been taking place in the Sumava NP on a prevailing area. New small trees and shrubs are visible in the recovery territories (SA2recov).
In this study, we applied and tested the Sentinel-2 data for the evaluation and monitoring of the forest ecosystems in Czechia (the Sumava National Park) and Slovakia (the NAPANT). Due to the dynamic changes in the forests in Czechia and Slovakia that occurred over the last years, there exists a suitable opportunity to apply the Sentinel-2 TS for the detection of disturbance events (bark beetle) and to evaluate the forest health (forest condition before, during, and after the disturbance events). For this reason, the study areas represent a forest under different circumstances and development (the dead trees after a bark beetle outbreak, the recovery mode after a bark beetle outbreak, and the forest vegetation without any significant influence). The selected vegetation indices and their trajectories of the TS were interpreted and validated in relation to the in situ data investigated during the field research or provided by the administration of the national parks and to the aerial photographs.
The Copernicus Program with the Sentinel-2 data has brought new opportunities and perspectives in the landscape/forest monitoring. Thanks to the temporal and spatial resolution, we were able to obtain a short TS for observing the health status and changes in the forest ecosystems [59]. Due to the advanced parameters of the Sentinel mission (e.g., two satellites—Sentinel A and Sentinel B), the Sentinel-2 data allowed us to observe the status and changes of the vegetation repeatedly in a short time period (5 days or less) with multispectral characteristics in the data (13 bands). The Sentinel’s TS with the higher temporal and spatial resolution were undoubtedly one of the greatest benefits of studying regional or even global phenomena [60]. Other authors [61] claimed that the probability of acquired cloud-free pixels by the Landsat 8 during a summer period in the U.S. was 0.78.
This fact often led researchers to study the changes in the forest over several years rather than during the seasons of the year (phenophases). We proved, in this study, that the Sentinel-2 data had a significantly higher density in the TS when compared with the Landsat 8 data. Clearly, many more images of the Sentinel-2 (2A and 2B), compared with the Landsat images, were available for all the areas in 2018 and 2019. Due to the launch of the Sentinel-2B, the temporal resolution rapidly increased. This resolution is a very important factor for the evaluation of the forest with dynamic changes (e.g., under a disturbance aspect) in mountainous areas where cloud cover is a relevant problem. The Sentinel-2 data brings a new dimension in the data availability and its improved temporal resolution using two satellites (2A and 2B) was more suitable for the monitoring of the forest dynamic than the traditionally used Landsat data.
Concerning the processing of the data with a lower temporal resolution (such as Landsat), several preprocessing steps for preparing the datasets are necessary. To obtain comparable results, it is necessary to use normalization [20,62,63], cross-calibration methods, specialized harmonizing algorithms (like LandsatLinkr [29]), or to use other methods (like LandTrendr [64,65]). However, in the case of the Sentinel-2 data, normalization methods were not necessary for processing for the TS when using the entire set of measurements with a high temporal resolution (outliers caused by inhomogeneity of the environment during the year may be filtered out—or the data may be fit).
The Sentinel-2 data brought much sharper images, especially due to the 10-m resolution bands. This spatial resolution allowed us to better recognize individual elements, such as damaged forests, shadows, clouds, and other covers. However, due to the low spatial resolution of Landsat, it was difficult to detect cirrus clouds. For the Landsat 8 data, it was possible to use panchromatic images with a 15-m resolution and to perform pan-sharpening methods to obtain a better spatial resolution. However, this was only possible for visible bands and this approach required complex image preprocessing.
The cloud-based Sentinel Hub application was used for the processing and analysis of the Sentinel-2 data. The cloud-based tools allowed for the effective and end-user friendly processing and analysis of the EO data. An advantage of the Sentinel Hub was the option to prepare and use scripts in the Configuration Utility for the semi-automatic processing of the data and the calculation of the indices from the Sentinel-2 data (NDVI, NDMI, tasseled cap greenness, and tasseled cap wetness). The Sentinel Hub also contained prepared algorithms for the calculation of the most used indices. Performing land use/land cover classifications and other image analyses was also possible. Several programming scripts using JavaScript language were written for the calculation of the vegetation indices in this study.
The impact of the disturbances on the forest vegetation was evaluated using the NDVI, NDMI, TCG, and TCW indices. The trends (similarities and differences) in the values of the studied indices were analyzed using the TS methods. We found that the vegetation indices NDVI, NDMI, and TCW were able to distinguish healthy and disturbed/damaged forests and they gave most relevant results for the research purposes of this study. The reflectivity of the healthy forest vegetation was higher in the NIR band than the SWIR; however, the SWIR reflectivity was higher in the case of disturbances. This aspect played an important role as the SWIR bands responded sensitively in the case of the degradation of the forest. The NDMI index using the SWIR band was evidently able to precisely distinguish the individual types of areas affected by disturbances (without disturbance and under disturbance or after disturbance in the individual phases of recovery). The values of the disturbed and recovery areas did not overlap with the undisturbed areas and create specific groups in the TS chart.
The values of the NDMI for the unaffected areas ranged approximately from 0.37 to 0.69, and the areas affected by the disturbances or in a recovery phase had evidently lower values of the NDMI with a range from −0.12 to 0.28. The orthogonal TCW index had a similar ability; however, it was not able to precisely distinguish the disturbed and recovery phases/areas. The values of the TCW index were documented from −0.10 to 0.00 in the disturbed and recovery areas and from 0.00 to 0.03 for the unaffected areas. The NDVI index, which is based on the visible band and the NIR ratios, was able to reflect an evolution of the plants and shrubs that quickly covered the disturbed area during the recovery phase (see Figure 10). Concerning the TCG index, the abilities of this index did allow us to detect the disturbances in the gray-attack phase. However, it was difficult to distinguish the different recovery phases of the study areas. Our results are in accordance with comparable studies [66,67]. The novelty of this study was to use and test the Sentinel-2 data in the TS of the dynamic forest changes; therefore, we did not find any similar studies with comparable results of the value indices in the TS analysis based on Sentinel-2 data.
An important finding gained in this study was the high relevance of the data of the forest management practices in the national parks. The data contained in the forest management plans appeared to be excellent as a source for the validation of the results of the EO/TS investigation. The forest management plans contained a wide range of useful information, and this information is regularly updated. The data from the in situ research provided highly detailed data on the recovery of the forest ecosystems, especially with regards to the restoration of the herbaceous and woody undergrowth.
The use of the Sentinel-2 data in the evaluation of the forest vegetation and the consequences of the differentiated approaches to conservation and forestry activities provided excellent capacities and opportunities for the monitoring of the forest and the implementation of the EO data and the TS method into the protection and management of the forest. In addition, the new Landsat 9 (with similar OLI and TIRS sensor) will be sent into orbit soon (March 2021). If the Landsat 8 is still working in the following years, the new temporal coverage of the Landsat images will be higher (similar to Sentinel-2A and Sentinel-2B). The harmonization of the Landsat 8 (or Landsat 9) and Sentinel-2 data could also increase the temporal coverage of the TS [68]. The possibilities to increase the temporal and spectral resolution can be seen in the data fusion of optical and SAR data also (e.g., Sentinel-1 and Sentinel-2). From the method point of view, it would be useful to test an application of the cloud-based Google Earth Engine (GEE), which allows for the analogical analyses of the EO data, such as the Sentinel Hub. Another idea is to carry out a comparative study in other national parks in Europe and validate our achieved results in the different forest ecosystems.

5. Conclusions

In our study, we evaluated the changes in forest vegetation affected by the bark beetle in selected national parks in Czechia and Slovakia (the Sumava NP and the NAPANT). The study used the open data of Sentinel-2 from the Copernicus program. The TS analysis using the selected vegetation indices was performed in the areas in both countries. Based on our achieved results, we argue that the Sentinel-2 data were able to accurately distinguish the areas that were not affected by disturbances and the areas under disturbances and to detect the individual phases of the recovery mode of the forest vegetation. The results confirm the abilities of the NDVI, NDMI, and TCW indices to distinguish disturbed and undisturbed areas.
The NDMI vegetation index was useful for the detection of the disturbed forest and forest recovery after bark beetle outbreaks and provided relevant information regarding the health of the forest (the individual stages of the recovery mode). On the contrary, the TCG index demonstrated limited abilities. The TCG could distinguish the gray-attack disturbance phase; however, it was difficult to use this index for the detection of different recovery phases and to distinguish recovery phases from healthy forests. The data were processed in the cloud-based tool of the Sentinel Hub, which allowed for very flexible data processing and analyzing. A combination of a cloud-based easy operated system with the open data of Sentinel-2 with a high spatial, temporal, and spectral resolution provided a powerful tool for forest research. This study should serve as an example for the application of advanced remote sensing methods and as data if the impact of the disturbances on the forest vegetation is analyzed using vegetation indices. These results and methods should be useful and inspirational for forest managers to determine appropriate forest management practices under the circumstances of forest disasters.

Author Contributions

Conceptualization, J.L. and P.S. (Premysl Stych); methodology, J.L. and P.S. (Premysl Stych); software, J.L. and N.K.; validation, D.P., R.H., J.L., P.S. (Premysl Stych) and P.S. (Pavel Svec); formal analysis, J.L.; investigation, J.L. and P.S. (Premysl Stych); resources, J.L.; data curation, N.K., J.S. and R.H.; writing—original draft preparation, J.L.; writing—review and editing, P.S. (Pavel Svec) and P.S. (Premysl Stych); visualization, J.L., D.P., R.H., N.K. and J.S.; supervision, P.S. (Pavel Svec) and P.S. (Premysl Stych); funding acquisition, J.L. and P.S. (Premysl Stych); senior author, P.S. (Premysl Stych). All authors have read and agreed to the published version of the manuscript.

Funding

This study was supported by the Charles University, project GA UK No. 512217 (Charles Univ, Fac Sci, 2017–2019): “Hodnoceni vlivu disturbanci na lesni ekosystemy v Cesku a na Slovensku pomoci metod DPZ”. The UNCE “Charles University Research Center program UNCE/HUM/018”. The European Union’s Caroline Herschel Framework Partnership Agreement on Copernicus User Uptake under grant agreement No. FPA 275/G/GRO/COPE/17/10042, project FPCUP (Framework Partnership Agreement on Copernicus User Uptake), Action 2019-2-49 “Developing supports for monitoring and reporting of GHG emissions and removals from land use, land use change and forestry” (219/SI2.818795/07 (CLIMA)). The study was invited (Feature Paper) to be part of the Special Issue of Monitoring Forest Change with Remote Sensing.

Acknowledgments

We would like to thank the Grant Agency of the Charles University (GA UK), project GA UK No. 512217 for their support as well as to thank the UNCE “Charles University Research Center program UNCE/HUM/018” for their support. We would like to thank the European Union’s Caroline Herschel Framework Partnership Agreement on Copernicus User Uptake under grant agreement No. FPA 275/G/GRO/COPE/17/10042, project FPCUP (Framework Partnership Agreement on Copernicus User Uptake), Action 2019-2-49 “Developing supports for monitoring and reporting of GHG emissions and removals from land use, land use change and forestry” (219/SI2.818795/07 (CLIMA)) for their support. We thank the Sentinel Hub team for using the Sentinel Hub services and for helping with this article, especially Grega Milcinski. We thank Zdenek Hlavka from the Faculty of Mathematics and Physics, Charles University for consultations on the statistical methods and interpretations of the results. We also thank the anonymous reviewers for their critical review and constructive comments.

Conflicts of Interest

The authors declare no conflict of interest.

Appendix A

Table A1. Sentinel-2 and Landsat 4–8 spectral bands and their differences.
MissionRadiometric ResolutionTemporal ResolutionSpectral BandCoastal/Aerosol (B01)Blue (B02)Green (B03)Red (B04)NIR 2 (B05)NIR 3 (B06)NIR 4 (B07)NIR 1 (B08)NIR 5 (B8A)Atmospheric/Water Vapour (B09)Cirrus (B10)SWIR 1 (B11)SWIR 2 (B12)PanchromaticThermal Infrared 1Thermal Infrared 2Date
Landsat 4 and 58bit (16bit rescaled) 16 daysCentral Wavelength (nm)-485560660---830---16502215-11450-16 July 1982 (deactivated: 15 June 2001)/1 March 1984 (deactivated: 5 June 2013)
Bandwidth (nm)-708060---140---200270-2100-
Spatial Resolution (m)-303030---30---3030-120-
Landsat 7Central Wavelength (nm)-485560660---835---1650221571011450-15 April 1999 (active, data failure: 31 May 2003)
Bandwidth (nm)-708060---130---2002703802100-
Spatial Resolution (m)-303030---30---30301560-
Landsat 812bit (16bit rescaled) Central Wavelength (nm)440480560655---865--137016102200590108951200511 February 2013 (active)
Bandwidth (nm)20606030---30--20801801805901010
Spatial Resolution (m)30303030---30--30303015100100
Sentinel-2A12-bit 10-day (5-day with both satellites)Central Wavelength (nm)443.9496.6560664.5703.9740.2782.5835.1864.89451373.51613.72202.4---23 June 2015 (active)
Bandwidth (nm)27984538191828145332675143242---
Spatial Resolution (m)60101010202020102060602020---
Sentinel-2BCentral Wavelength (nm)442.3492.1559665703.8739.1779.7833864943.21376.91610.42185.7---7 March 2017 (active)
Bandwidth (nm)45984639201828133322776141238---
Spatial Resolution (m)60101010202020102060602020---
Source: author’s own work (2020)/ESA (2015): Resolution and swath. Downloaded from: https://sentinel.esa.int/web/sentinel/missions/sentinel-2/instrument-payload/Resolution-and-swath/USGS (2020): Spectral Response of the Operational Land Imager In-Band, Band-Average Relative Spectral Response. Downloaded from: https://landsat.gsfc.nasa.gov/preliminary-spectral-response-of-the-operational-land-imager-in-band-band-average-relative-spectral-response. The NIR 2-4 are the Vegetation Red Edge bands.

References

  1. Wulder, M.A.; Masek, J.G.; Cohen, W.B.; Loveland, T.R.; Woodcock, C.E. Opening the archive: How free data has enabled the science and monitoring promise of Landsat. Remote Sens. Environ. 2012, 122, 2–10. [Google Scholar] [CrossRef]
  2. Abdullah, H.; Skidmore, A.K.; Darvishzadeh, R.; Heurich, M. Sentinel-2 accurately maps green-attack stage of European spruce bark beetle (Ips typographus, L.) compared with Landsat-8. Remote Sens. Ecol. Conserv. 2019, 5, 87–106. [Google Scholar] [CrossRef] [Green Version]
  3. Hansen, M.C.; Stehman, S.V.; Potapov, P.V. Quantification of global gross forest cover loss. Proc. Natl. Acad. Sci. USA 2010, 107, 8650–8655. [Google Scholar] [CrossRef] [PubMed] [Green Version]
  4. Potapov, P.V.; Turubanova, S.A.; Tyukavina, A.; Krylov, A.M.; McCarty, J.L.; Radeloff, V.C.; Hansen, M.C. Eastern Europe’s forest cover dynamics from 1985 to 2012 quantified from the full Landsat archive. Remote Sens. Environ. 2015, 159, 28–43. [Google Scholar] [CrossRef]
  5. Pflugmacher, D.; Cohen, W.B.; Kennedy, R.E. Using Landsat-derived disturbance history (1972–2010) to predict current forest structure. Remote Sens. Environ. 2012, 122, 146–165. [Google Scholar] [CrossRef]
  6. Zhu, Z.; Woodcock, C.E. Object-based cloud and cloud shadow detection in Landsat imagery. Remote Sens. Environ. 2012, 118, 83–94. [Google Scholar] [CrossRef]
  7. Zhu, Z.; Woodcock, C.E. Continuous change detection and classification of land cover using all available Landsat data. Remote Sens. Environ. 2014, 144, 152–171. [Google Scholar] [CrossRef] [Green Version]
  8. Zhu, Z.; Woodcock, C.E.; Holden, C.; Yang, Z. Generating synthetic Landsat images based on all available Landsat data: Predicting Landsat surface reflectance at any given time. Remote Sens. Environ. 2015, 162, 67–83. [Google Scholar] [CrossRef]
  9. Neigh, C.S.R.; Bolton, D.K.; Diabate, M.; Williams, J.J.; Carvalhais, N. An Automated Approach to Map the History of Forest Disturbance from Insect Mortality and Harvest with Landsat Time-Series Data. Remote Sens. 2014, 6, 2782–2808. [Google Scholar] [CrossRef] [Green Version]
  10. DeRose, R.J.; Long, J.N.; Ramsey, R.D. Combining dendrochronological data and the disturbance index to assess Engelmann spruce mortality caused by a spruce beetle outbreak in southern Utah, USA. Remote Sens. Environ. 2011, 115, 2342–2349. [Google Scholar] [CrossRef]
  11. Hicke, J.A.; Logan, J. Mapping whitebark pine mortality caused by a mountain pine beetle outbreak with high spatial resolution satellite imagery. Int. J. Remote Sens. 2009, 30, 4427–4441. [Google Scholar] [CrossRef]
  12. Jin, S.; Sader, S.A. Comparison of time series tasseled cap wetness and the normalized difference moisture index in detecting forest disturbances. Remote Sens. Environ. 2005, 94, 364–372. [Google Scholar] [CrossRef]
  13. Griffiths, P.; Kuemmerle, T.; Baumann, M.; Radeloff, V.C.; Abrudan, I.V.; Lieskovsky, J.; Munteanu, C.; Ostapowicz, K.; Hostert, P. Forest disturbances, forest recovery, and changes in forest types across the Carpathian ecoregion from 1985 to 2010 based on Landsat image composites. Remote Sens. Environ. 2014, 151, 72–88. [Google Scholar] [CrossRef]
  14. Kozak, J.; Estreguil, C.; Troll, M. Forest cover changes in the northern Carpathians in the 20th century: A slow transition. J. Land. Use Sci. 2007, 2, 127–146. [Google Scholar] [CrossRef]
  15. Kuemmerle, T.; Hostert, P.; Radeloff, V.C.; Perzanowski, K.; Kruhlov, I. Post-Socialist Forest Disturbance in the Carpathian Border Region of Poland, Slovakia, and Ukraine. Ecol. Appl. 2007, 17, 1279–1295. [Google Scholar] [CrossRef] [PubMed]
  16. Butsic, V.; Munteanu, C.; Griffiths, P.; Knorn, J.; Radeloff, V.C.; Lieskovský, J.; Mueller, D.; Kuemmerle, T. The effect of protected areas on forest disturbance in the Carpathian Mountains 1985–2010. Conserv. Biol. 2017, 31, 570–580. [Google Scholar] [CrossRef] [PubMed]
  17. Kupkova, L.; Potuckova, M.; Lhotakova, Z.; Albrechtova, J. Forest cover and disturbance changes, and their driving forces: A case study in the Ore Mountains, Czechia, heavily affected by anthropogenic acidic pollution in the second half of the 20th century. Environ. Res. Lett. 2018, 13. [Google Scholar] [CrossRef]
  18. Hais, M.; Wild, J.; Berec, L.; Bruna, J.; Kennedy, R.; Braaten, J.; Broz, Z. Landsat imagery spectral trajectories-important variables for spatially predicting the risks of bark beetle disturbance. Remote Sens. 2016, 8, 687. [Google Scholar] [CrossRef] [Green Version]
  19. Hais, M.; Jonasová, M.; Langhammer, J.; Kucera, T. Comparison of two types of forest disturbance using multitemporal Landsat TM/ETM+ imagery and field vegetation data. Remote Sens. Environ. 2009, 113, 835–845. [Google Scholar] [CrossRef]
  20. Stych, P.; Lastovicka, J.; Hladky, R.; Paluba, D. Evaluation of the Influence of Disturbances on Forest Vegetation Using the Time Series of Landsat Data: A Comparison Study of the Low Tatras and Sumava National Parks. ISPRS Int. J. Geo-Inf. 2019, 8, 71. [Google Scholar] [CrossRef] [Green Version]
  21. Stych, P.; Jerabkova, B.; Lastovicka, J.; Riedl, M.; Paluba, D. A Comparison of Worldview-2 and Landsat 8 Images for the Classification of Forests Affected by Bark Beetle Outbreaks Using a Support Vector Machine and a Neural Network: A Case Study in the Sumava Mountains. Geosciences 2019, 9, 396. [Google Scholar] [CrossRef] [Green Version]
  22. Jensen, J.R. Remote Sensing of the Environment: An Earth Resource Perspective, 2nd ed.; Pearson Prentice Hall: Upper Saddle River, NJ, USA, 2007. [Google Scholar]
  23. Rouse, J.W.; Haas, R.H.; Schell, J.A.; Deering, D.W. Monitoring vegetation systems in the Great Plains with ERTS. In Proceedings of the 3rd ERTS Symposium, Washington, DC, USA, 10–14 December 1973; NASA SP-351 I. pp. 309–317. [Google Scholar]
  24. Wang, J.; Sammis, T.W.; Gutschick, V.P.; Gebremichael, M.; Dennis, S.O.; Harrison, R.E. Review of Satellite Remote Sensing Use in Forest Health Studies. Open Geogr. J. 2010, 3, 28–42. [Google Scholar] [CrossRef]
  25. Gao, B. NDWI—A normalized difference water index for R. Elsevier 1996, 266, 257–266. [Google Scholar] [CrossRef]
  26. Vogelmann, J.E.; Xian, G.; Homer, C.; Tolk, B. Monitoring gradual ecosystem change using Landsat time series analyses: Case studies in selected forest and rangeland ecosystems. Remote Sens. Environ. 2012, 122, 92–105. [Google Scholar] [CrossRef] [Green Version]
  27. Deering, D.; Rouse, J. Measuring ‘Forage Production’ of Grazing Units from Landsat MSS Data. In Proceedings of the 10th International Symposium on Remote Sensing of Environment, ERIM, Ann Arbor, MI, USA, 6–10 October 1975; pp. 1169–1178. [Google Scholar]
  28. Hladky, R.; Lastovicka, J.; Holman, L.; Stych, P. Evaluation of the influence of disturbances on forest vegetation using Landsat time series; a case study of the Low Tatras National Park. Eur. J. Remote Sens. 2020, 53, 40–66. [Google Scholar] [CrossRef] [Green Version]
  29. Vogeler, J.C.; Braaten, J.D.; Slesak, R.A.; Falkowski, M.J. Extracting the full value of the Landsat archive: Inter-sensor harmonization for the mapping of Minnesota forest canopy cover (1973–2015). Remote Sens. Environ. 2018, 209, 363–374. [Google Scholar] [CrossRef]
  30. Wulder, M.A.; White, J.C.; Loveland, T.R.; Woodcock, C.E.; Belward, A.S.; Cohen, W.B.; Fosnight, E.A.; Shaw, J.; Masek, J.G.; Roy, D.P. The global Landsat archive: Status, consolidation, and direction. Remote Sens. Environ. 2016, 185, 271–283. [Google Scholar] [CrossRef] [Green Version]
  31. Franklin, S.E.; Wulder, M.A.; Skakun, R.S.; Carroll, A.L. Mountain pine beetle red-attack forest damage classification using stratified Landsat TM data in British Columbia, Canada. Photogramm. Eng. Remote Sens. 2003, 69, 283–288. [Google Scholar]
  32. Li, F.; Jupp, D.L.B.; Paget, M.; Briggs, P.R.; Thankappan, M.; Lewis, A.; Held, A. Improving BRDF normalisation for Landsat data using statistical relationships between MODIS BRDF shape and vegetation structure in the Australian continent. Remote Sens. Environ. 2017, 195, 275–296. [Google Scholar] [CrossRef]
  33. Roy, D.P.; Kovalskyy, V.; Zhang, H.K.; Vermote, E.F.; Yan, L.; Kumar, S.S.; Egorov, A. Characterization of Landsat-7 to Landsat-8 reflective wavelength and normalized difference vegetation index continuity. Remote Sens. Environ. 2016, 185, 57–70. [Google Scholar] [CrossRef] [Green Version]
  34. Immitzer, M.; Vuolo, F.; Atzberger, C. First Experience with Sentinel-2 Data for Crop and Tree Species Classifications in Central Europe. Remote Sens. 2016, 8, 166. [Google Scholar] [CrossRef]
  35. Rapinel, S.; Mony, C.; Lecoq, L.; Clément, B.; Thomas, A.; Hubert-Moy, L. Evaluation of Sentinel-2 time-series for mapping floodplain grassland plant communities. Remote Sens. Environ. 2019, 223, 115–129. [Google Scholar] [CrossRef]
  36. Lambert, M.J.; Traoré, P.C.S.; Blaes, X.; Baret, P.; Defourny, P. Estimating smallholder crops production at village level from Sentinel-2 time series in Mali’s cotton belt. Remote Sens. Environ. 2018, 216, 647–657. [Google Scholar] [CrossRef]
  37. Piedelobo, L.; Hernández-López, D.; Ballesteros, R.; Chakhar, A.; Del Pozo, S.; González-Aguilera, D.; Moreno, M.A. Scalable pixel-based crop classification combining Sentinel-2 and Landsat-8 data time series: Case study of the Duero river basin. Agric. Syst. 2019, 171, 36–50. [Google Scholar] [CrossRef]
  38. Ottosen, T.B.; Lommen, S.T.E.; Skjøth, C.A. Remote sensing of cropping practice in Northern Italy using time-series from Sentinel-2. Comput. Electron. Agric. 2019, 157, 232–238. [Google Scholar] [CrossRef] [Green Version]
  39. Rozenstein, O.; Haymann, N.; Kaplan, G.; Tanny, J. Estimating cotton water consumption using a time series of Sentinel-2 imagery. Agric. Water Manag. 2018, 207, 44–52. [Google Scholar] [CrossRef]
  40. Shang, R.; Zhu, Z. Harmonizing Landsat 8 and Sentinel-2: A time-series-based reflectance adjustment approach. Remote Sens. Environ. 2019, 235, 111439. [Google Scholar] [CrossRef]
  41. Masek, J.; Claverie, M.; Dungan, J.; Ju, J. Harmonized Landsat-8 and Sentinel-2. In User Guide; 2017. Available online: https://hls.gsfc.nasa.gov/wp-content/uploads/2017/08/HLS.v1.3.UserGuide_v2.pdf (accessed on 8 June 2020).
  42. Shao, Z.; Cai, J.; Fu, P.; Hu, L.; Liu, T. Deep learning-based fusion of Landsat-8 and Sentinel-2 images for a harmonized surface reflectance product. Remote Sens. Environ. 2019, 235, 111425. [Google Scholar] [CrossRef]
  43. Navarro, A.; Catalao, J.; Calvao, J. Assessing the Use of Sentinel-2 Time Series Data for Monitoring Cork Oak Decline in Portugal. Remote Sens. 2019, 11, 2515. [Google Scholar] [CrossRef] [Green Version]
  44. Li, L.; Li, N.; Lu, D.; Chen, Y. Mapping Moso bamboo forest and its on-year and off-year distribution in a subtropical region using time-series Sentinel-2 and Landsat 8 data. Remote Sens. Environ. 2019, 231, 111265. [Google Scholar] [CrossRef]
  45. Grabska, E.; Hostert, P.; Pflugmacher, D.; Ostapowicz, K. Forest Stand Species Mapping Using the Sentinel-2 Time Series. Remote Sens. 2019, 11, 1197. [Google Scholar] [CrossRef] [Green Version]
  46. Gomes, V.C.F.; Queiroz, G.R.; Ferreira, K.R. An Overview of Platforms for Big Earth Observation Data Management and Analysis. Remote Sens. 2020, 12, 1253. [Google Scholar] [CrossRef] [Green Version]
  47. Sovdat, B.; Kadunc, M.; Batic, M.; Milcinski, G.; Functions, P.L. Natural color representation of Sentinel-2 data. Remote Sens. Environ. 2017, 225, 392–402. [Google Scholar] [CrossRef]
  48. Albrechtova, J.; Kupkova, L.; Campbell, P.K.E. Hodnoceni Stavu Smrkovych Porostu.-Pripadove Studie Sledovani Vyvoje Fyziologickeho Stavu Smrkovych Porostu v Krusnych Horach v Letech 1998–2013; Geographica-Česká Geografická Společnost: Nové Město, Czechia, 2017; ISBN ISBN 978-80-905642-9-9. [Google Scholar]
  49. Hais, M.; Kucera, T. The influence of topography on the forest surface temperature retrieved from Landsat TM, ETM + and ASTER thermal channels. ISPRS J. Photogramm. Remote Sens. 2009, 64, 585–591. [Google Scholar] [CrossRef]
  50. Tang, D.; Fan, H.; Yang, K.; Zhang, Y. Mapping forest disturbance across the China–Laos border using annual Landsat time series. Int. J. Remote Sens. 2019, 40, 2895–2915. [Google Scholar] [CrossRef]
  51. Schultz, M.; Clevers, J.G.P.W.; Carter, S.; Verbesselt, J.; Avitabile, V.; Quang, H.V.; Herold, M. Performance of vegetation indices from Landsat time series in deforestation monitoring. Int. J. Appl. Earth Obs. Geoinf. 2016, 52, 318–327. [Google Scholar] [CrossRef]
  52. Rouse, J.W.; Haas, R.H.; Schell, J.A.; Deering, D.W. Monitoring the Vernal Advancement and Retrogradation (Green Wave Effect) of Natural Vegetation; Remote Sens. Centre, TEXAS A&M Univ.: College Station, TX, USA, 1973. [Google Scholar]
  53. Xiao, C.; Li, P.; Feng, Z. Monitoring annual dynamics of mature rubber plantations in Xishuangbanna during 1987-2018 using Landsat time series data: A multiple normalization approach. Int. J. Appl. Earth Obs. Geoinf. 2019, 77, 30–41. [Google Scholar] [CrossRef]
  54. Purwadi, I.; Van Der Werff, H.M.A.; Lievens, C. Targeting rare earth element bearing mine tailings on Bangka Island, Indonesia, with Sentinel-2 MSI. Int. J. Appl. Earth Obs. Geoinf. 2020, 88, 1–8. [Google Scholar] [CrossRef]
  55. Rujoiu-Mare, M.R.; Olariu, B.; Mihai, B.A.; Nistor, C.; Savulescu, I. Land cover classification in Romanian Carpathians and Subcarpathians using multi-date Sentinel-2 remote sensing imagery. Eur. J. Remote Sens. 2017, 50, 496–508. [Google Scholar] [CrossRef] [Green Version]
  56. Kauth, R.J.; Thomas, G.S. The Tasselled Cap -- A Graphic Description of the Spectral-temporal Development of Agricultural Crops as Seen by LANDSAT. LARS Symp 1976, 4B–41–4B–51. [Google Scholar] [CrossRef] [Green Version]
  57. Crist, E.P.; Cicone, R.C. A Physically-Based Transformation of Thematic Mapper Data-The TM Tasseled Cap. IEEE Trans. Geosci. Remote Sens. 1984, 22, 256–263. [Google Scholar] [CrossRef]
  58. Bartsch, A.; Widhalm, B.; Leibman, M.; Ermokhina, K.; Kumpula, T.; Skarin, A.; Wilcox, E.J.; Jones, B.M.; Frost, G.V.; Höfler, A.; et al. Feasibility of tundra vegetation height retrieval from Sentinel-1 and Sentinel-2 data. Remote Sens. Environ. 2020, 237, 111515. [Google Scholar] [CrossRef]
  59. Zhang, W.; Brandt, M.; Wang, Q.; Prishchepov, A.V.; Tucker, C.J.; Li, Y.; Lyu, H.; Fensholt, R. From woody cover to woody canopies: How Sentinel-1 and Sentinel-2 data advance the mapping of woody plants in savannas. Remote Sens. Environ. 2019, 234, 111465. [Google Scholar] [CrossRef]
  60. Vrieling, A.; Meroni, M.; Darvishzadeh, R.; Skidmore, A.K.; Wang, T.; Zurita-Milla, R.; Oosterbeek, K.; O’Connor, B.; Paganini, M. Vegetation phenology from Sentinel-2 and field cameras for a Dutch barrier island. Remote Sens. Environ. 2018, 215, 517–529. [Google Scholar] [CrossRef]
  61. Banskota, A.; Kayastha, N.; Falkowski, M.J.; Wulder, M.A.; Froese, R.E.; White, J.C. Forest Monitoring Using Landsat Time Series Data: A Review. Can. J. Remote Sens. 2014, 40, 362–384. [Google Scholar] [CrossRef]
  62. Song, C.; Woodcock, C.E.; Seto, K.C.; Lenney, M.P.; Macomber, S.A. Classification and change detection using Landsat TM data: When and how to correct atmospheric effects? Remote Sens. Environ. 2001, 75, 230–244. [Google Scholar] [CrossRef]
  63. Chen, X.; Vierling, L.; Deering, D. A simple and effective radiometric correction method to improve landscape change detection across sensors and across time. Remote Sens. Environ. 2005, 98, 63–79. [Google Scholar] [CrossRef]
  64. Kennedy, R.E.; Yang, Z.; Cohen, W.B. Detecting trends in forest disturbance and recovery using yearly Landsat time series: 1. LandTrendr - Temporal segmentation algorithms. Remote Sens. Environ. 2010, 114, 2897–2910. [Google Scholar] [CrossRef]
  65. Kennedy, R.E.; Yang, Z.; Cohen, W.B. Detecting trends in forest disturbance and recovery using yearly Landsat time series: 2. TimeSync — Tools for calibration and validation. Remote Sens. Environ. 2010, 114, 2911–2924. [Google Scholar] [CrossRef]
  66. Zhang, H.K.; Roy, D.P. Landsat 5 Thematic Mapper reflectance and NDVI 27-year time series inconsistencies due to satellite orbit change. Remote Sens. Environ. 2016, 186, 217–233. [Google Scholar] [CrossRef] [Green Version]
  67. Storey, E.A.; Stow, D.A.; O’Leary, J.F. Assessing postfire recovery of chamise chaparral using multi-temporal spectral vegetation index trajectories derived from Landsat imagery. Remote Sens. Environ. 2016, 183, 53–64. [Google Scholar] [CrossRef] [Green Version]
  68. Claverie, M.; Ju, J.; Masek, J.G.; Dungan, J.L.; Vermote, E.F.; Roger, J.C.; Skakun, S.V.; Justice, C. The Harmonized Landsat and Sentinel-2 surface reflectance data set. Remote Sens. Environ. 2018, 219, 145–161. [Google Scholar] [CrossRef]
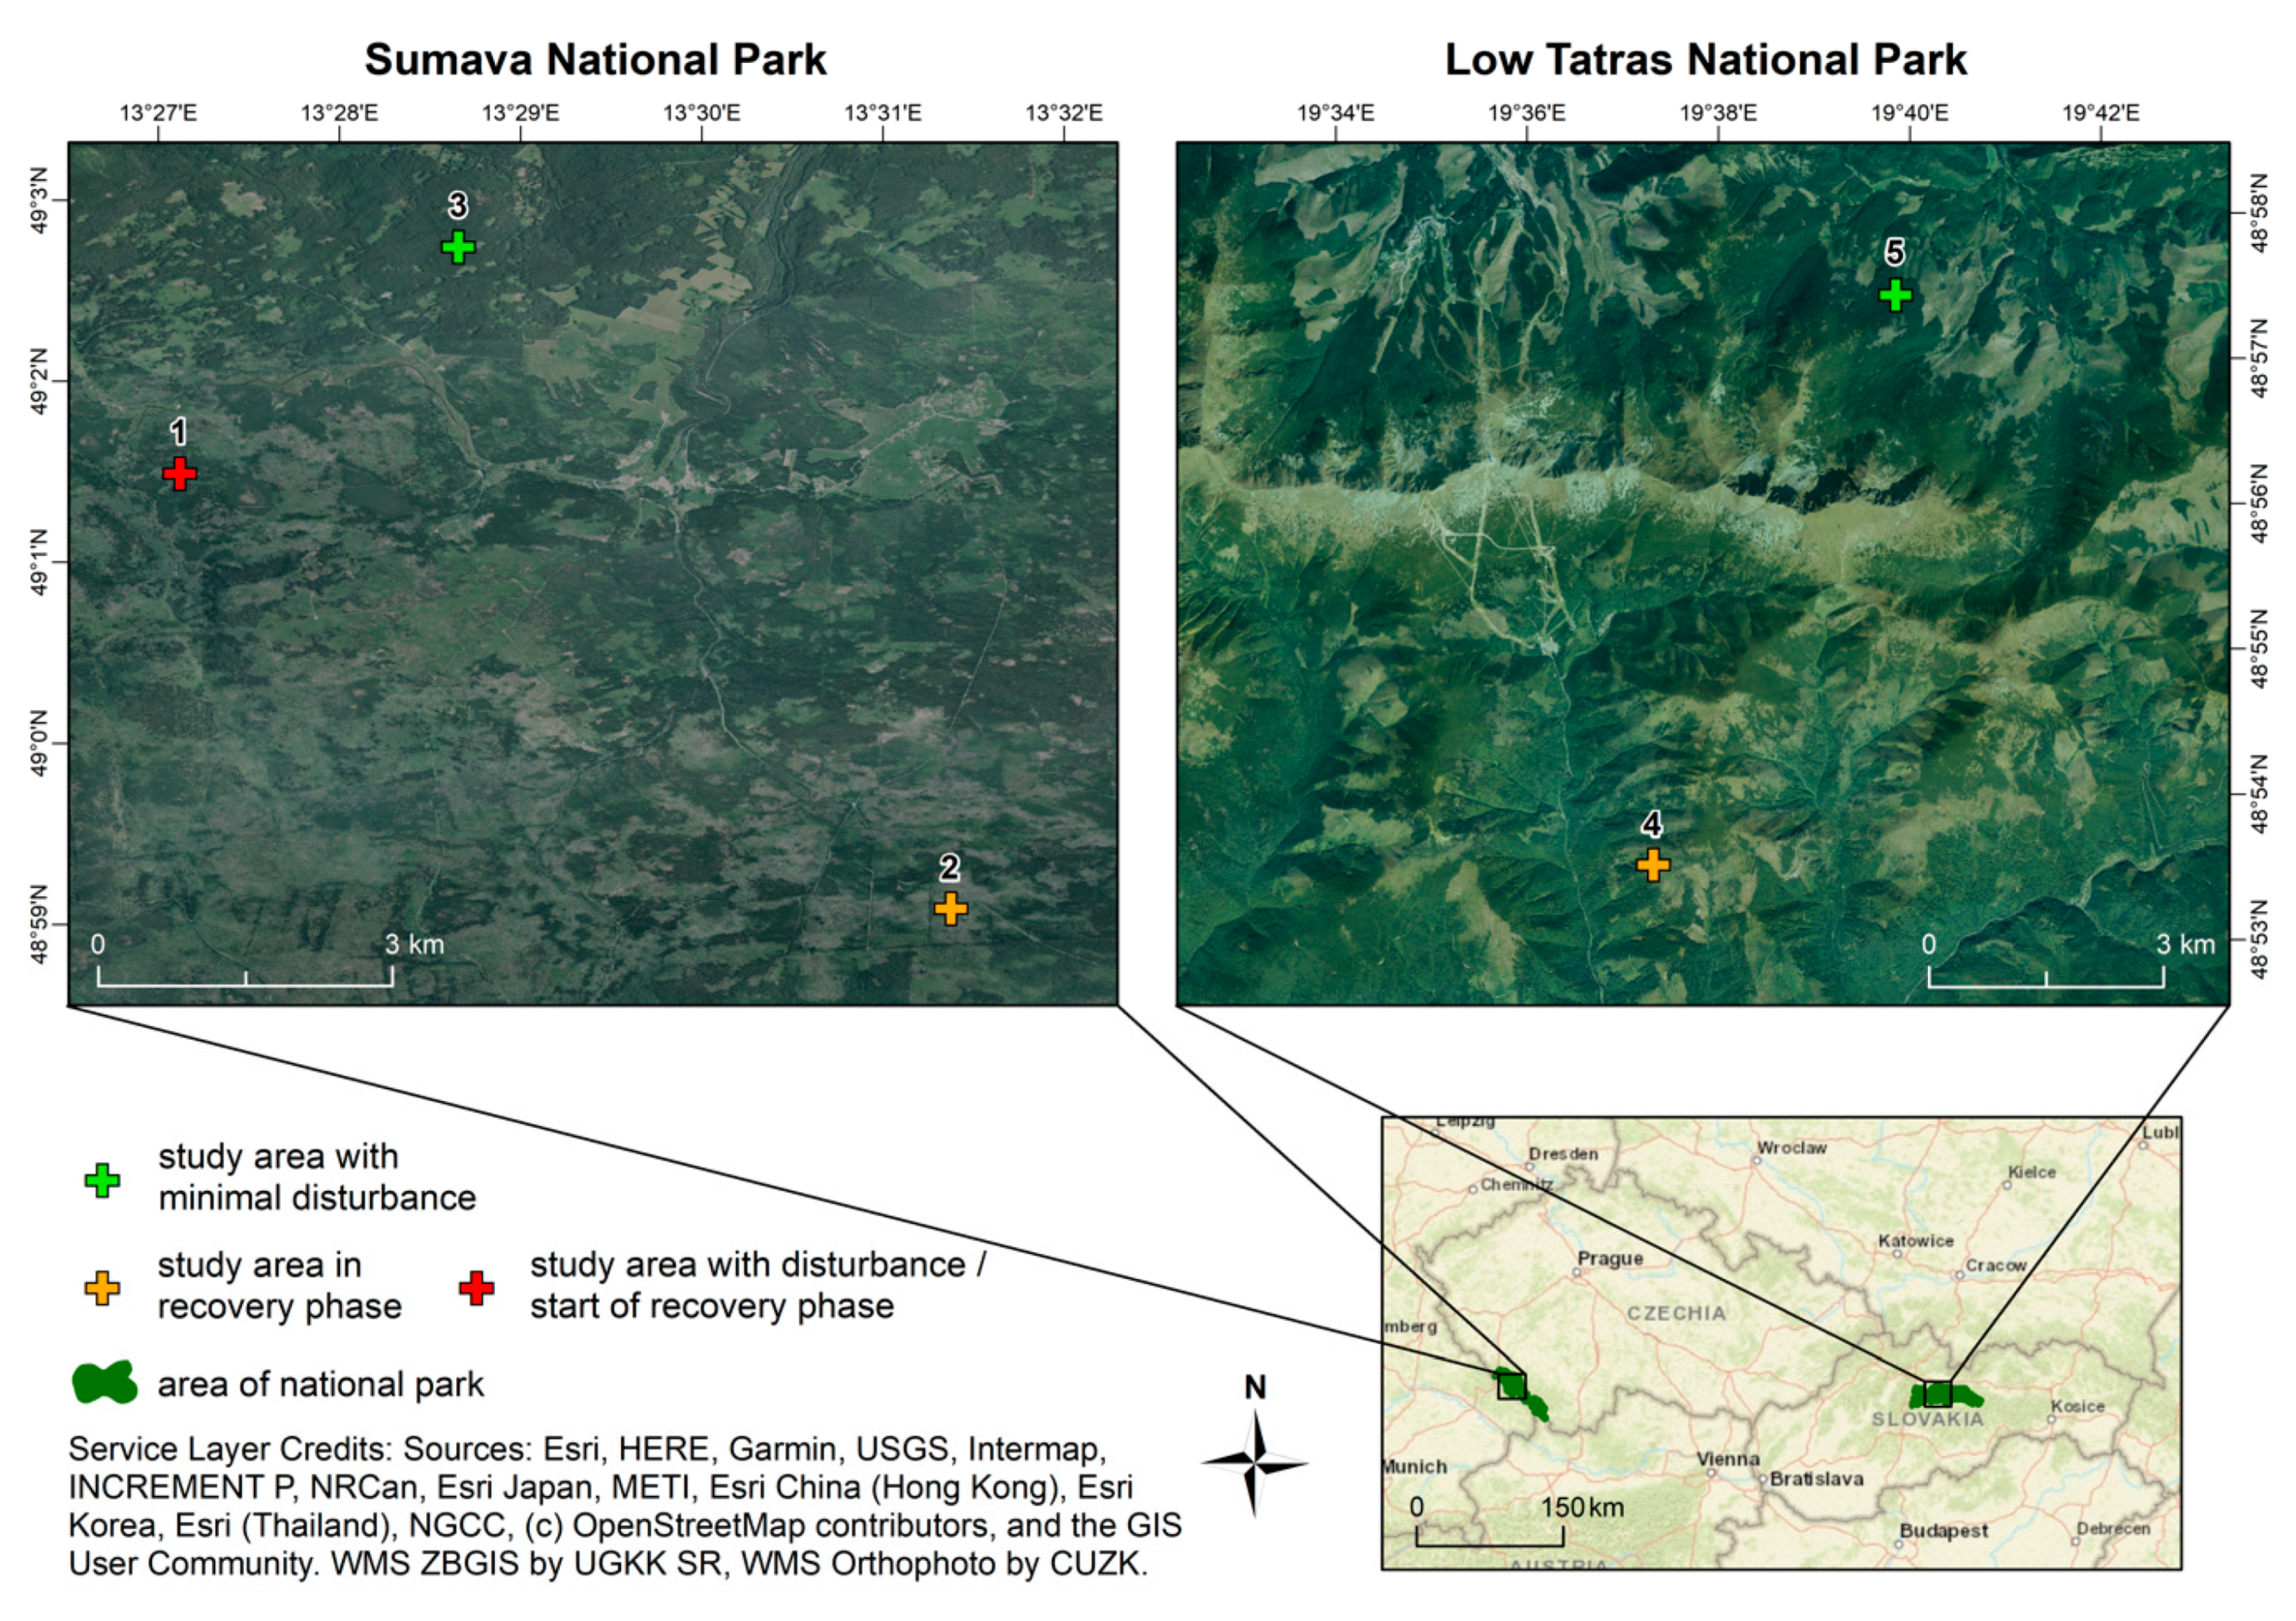
Figure 1. Study areas of the Sumava National Park (Czechia) and the Low Tatras National Park (Slovakia). Source: author’s own work (2020)/Web Map Service (WMS) Orthophoto by Czech Office for Surveying, Mapping and Cadastre (CUZK) (2019)/WMS ZBGIS (Digital map app) by Geodesy, Cartography and Cadastre Authority of the Slovak Republic (UGKK SR) (2018).
Remotesensing 12 01914 g001
Figure 2. Study area 1 (SA1dist, Sumava NP, Czechia) in detail: with a bark beetle outbreak (aerial photo created by CUZK in 2019). Source: author’s own work (2020)/WMS Orthophoto by CZUK (2019). The area of interest is in the red polygon.
Remotesensing 12 01914 g002
Figure 3. Study area 2 (SA2recov, Sumava NP, Czechia) in detail: with a recovery phase after the bark beetle outbreak (aerial photo created by CUZK in 2019). Source: author’s own work (2020)/WMS Orthophoto by CUZK (2019). The area of interest is in the red polygon.
Remotesensing 12 01914 g003
Figure 4. Study area 3 (SA3non-dist, Sumava NP, Czechia) in detail: with minimal disturbances (aerial photo created by CUZK in 2019). Source: author’s own work (2020)/WMS Orthophoto by CUZK (2019). The area of interest is in the red polygon.
Remotesensing 12 01914 g004
Figure 5. Study area 4 (SA4recov, the Low Tatras, Slovakia) in detail: with a recovery phase after the bark beetle outbreak (aerial photo created by UGKK SR in 2018). Source: author’s own work (2020)/WMS ZBGIS by UGKK SR (2018). The area of interest is in the red polygon.
Remotesensing 12 01914 g005
Figure 6. Study area 5 (SA5non-dist, the Low Tatras, Slovakia) in detail: with minimal disturbances (aerial photo created by UGKK SR in 2018). Source: author’s own work (2020)/WMS ZGBIS by UGKK SR (2018). The area of interest is in the red polygon.
Remotesensing 12 01914 g006
Figure 7. Spatial resolution comparison by the different types of sensors (from left—aerial photo used for validation, Sentinel-2, Landsat 8). Source: author’s own work (2020)/European Space Agency Sentinel-2 data product (2019)/United States Geological Survey Earth Explorer Landsat 8 data product (2019)/WMS Orthophoto by CUZK (2019)/WMS ZBGIS by UGKK SR (2018). The area of interest is in the red polygon. SA—study area; dist—disturbance, recov—recovery, non-dist—no disturbance; area number (1–3 from Czechia and 4–5 from Slovakia). Time of acquisition of Landsat 8 data: 21 September 2019 for Czechia and 25 October 2019 for Slovakia. Time of acquisition of Sentinel-2 data: 21 September 2019 for Czechia and 27 October 2019 for Slovakia. Data with atmospheric corrections were used.
Remotesensing 12 01914 g007
Figure 8. The total number of the Landsat 8 and Sentinel-2 images available and used for the study areas. Source: author’s own work (2020)/Sentinel Hub and ESA Sentinel-2 data product/USGS Earth Explorer Landsat 8 data product (2020). SA—study area; dist—disturbance, recov—recovery, non-dist—no disturbance; area number (1–3 from Czechia, 4–5 from Slovakia).
Remotesensing 12 01914 g008
Figure 9. Timeline of the available cloudless and snowless Landsat and Sentinel-2 images for the selected study areas. Source: author’s own work (2020)/Sentinel Hub and ESA Sentinel-2 data product/USGS Earth Explorer Landsat 8 data product (2020). SA—study area; dist—disturbance, recov—recovery, non-dist—no disturbance; area number (1–3 from Czechia, 4–5 from Slovakia).
Remotesensing 12 01914 g009
Figure 10. Comparison of the index values by the different type of vegetation indices. Source: author’s own work (2020)/Sentinel Hub and ESA Sentinel-2 data product (2020). (a) values of the NDVI vegetation index; (b) values of the NDMI index; (c) values of the TCG orthogonal index; (d) values of the TCW orthogonal index. NDVI—normalized difference vegetation index; NDMI—normalized difference moisture index; SA—study area; dist—disturbance, recov—recovery, non-dist—no disturbance; area number (1–3 from Czechia, 4–5 from Slovakia).
Remotesensing 12 01914 g010
Figure 11. Study areas statistics. Source: author’s own work (2020)/Sentinel Hub and ESA Sentinel-2 data product (2020). Boxplots are divided into two parts by median. The cross indicates the arithmetic mean. Dots indicate outliers. TCG—tasseled cap greenness; TCW—tasseled cap wetness; SA—study area; dist—disturbance, recov—recovery, non-dist—no disturbance; area number (1–3 from Czechia, 4–5 from Slovakia).
Remotesensing 12 01914 g011
Figure 12. NDVI, NDMI, TCG, and TCW statistics. Source: author’s own work (2020)/Sentinel Hub and ESA Sentinel-2 data product (2020). Boxplots are divided into two parts by the median. The cross indicates the arithmetic mean. Dots indicate outliers. SA—study area; dist—disturbance, recov—recovery, non-dist—no disturbance; area number (1–3 from Czechia, 4–5 from Slovakia).
Remotesensing 12 01914 g012
Table 1. Characteristics of the study areas. Source: author’s own work (2020).
Study AreaCountry (National Park)Latitude (WGS84)Longitude (WGS84)Altitude (m)DisturbanceDescription
SA1distCzechia (Sumava National park)13.4519649.024821040YESBark beetle calamity (red-attack 2015, gray-attack prevailed 2016–2017). From 2018 in the recovery phase.
SA2recovCzechia (Sumava National park)13.5229048.984731160YESRecovery phase after bark beetle calamity. Small spruces and shrubs as undergrowth.
SA3non-distCzechia (Sumava National park)13.4775849.045681035NOStable ecosystem with spruce trees, grass and moss as undergrowth. Visible impact of drought in last years.
SA4recovSlovakia (Low Tatras National Park)19.6142148.895901300YESRecovery phase after bark beetle calamity. Small trees and shrubs as undergrowth.
SA5non-distSlovakia (Low Tatras National Park)19.6624548.959631335NOStable ecosystem with spruce trees.
SA—study area; dist—disturbance, recov—recovery, non-dist—no disturbance; area number (1–3 from Czechia, 4–5 from Slovakia).
Table 2. The number and percent of the Landsat 8 and Sentinel-2 images available and used for the study areas in the years 2017, 2018, and 2019. Source: author’s own work (2020)/Sentinel Hub and ESA Sentinel-2 data product/USGS Earth Explorer Landsat 8 data product (2020).
SA1distSA2recovSA3non-distSA4recovSA5non-distTotal
Landsat images available in 20173435353333170
Landsat images used in 20179984636
% of the used images (L8 in 2017)26.4725.7122.8612.1218.1821.18
Sentinel images available in 20174141417881282
Sentinel images used in 2017788121449
% of the used images (S-2 in 2017)17.0719.5119.5115.3817.2817.38
Landsat images available in 20184345454444221
Landsat images used in 201899125641
% of the used images (L8 in 2018)20.9320.0026.6711.3613.6418.55
Sentinel images available in 2018737373140141500
Sentinel images used in 201816139142274
% of the used images (S-2 in 2018)21.9217.8112.3310.0015.6014.80
Landsat images available in 20194646464848234
Landsat images used in 20195566729
% of the used images (L8 in 2019)10.8710.8713.0412.5014.5812.39
Sentinel images available in 2019717171144145502
Sentinel images used in 2019101010111657
% of the used images (S-2 in 2019)14.0814.0814.087.6411.0311.35
SA—study area; dist—disturbance, recov—recovery, non-dist—no disturbance; area number (1–3 from Czechia, 4–5 from Slovakia).
Table 3. Comparison of the standard deviation for all the vegetation indices/study areas. Source: author’s own work (2020)/Sentinel Hub and ESA Sentinel-2 data product (2020).
SA1distSA2recovSA3non-distSA4recovSA5non-dist
NDVI0.0570.0700.0440.1400.076
NDMI0.0660.0620.0410.0750.064
TCG0.0170.0380.0120.0780.027
TCW0.0150.0120.0060.0190.010
SA—study area; dist—disturbance, recov—recovery, non-dist—no disturbance; area number (1–3 from Czechia, 4–5 from Slovakia).
Table 4. The Shapiro–Wilk test for all study areas and vegetation indices. Source: author’s own work (2020)/Sentinel Hub and ESA Sentinel-2 data product (2020).
SA1distSA2recovSA3non-distSA4recovSA5non-dist
NDVI0.0013830.0234800.7199000.0000010.003258
NDMI0.7893000.0447000.8232000.0021790.378700
TCG0.7733000.0469100.0047010.0000010.000703
TCW0.0100300.1287000.6521000.1314000.013750
Values in italics and bold have a normal distribution, the non-italic and non-bold (regular) values do not. SA—study area; dist—disturbance, recov—recovery, non-dist—no disturbance; area number (1–3 from Czechia, 4–5 from Slovakia).
Table 5. The Wilcoxon test for selected vegetation indices with all combinations of study areas. Source: author’s own work (2020)/Sentinel Hub and ESA Sentinel-2 data product (2020).
NDVI NDMI
SA1distSA2recovSA3non-distSA4recov SA1distSA2recovSA3non-distSA4recov
SA2recov2.80 × 10−7 SA2recov2.00 × 10−9
SA3non-dist1.60 × 10−154.80 × 10⁻¹⁵ SA3non-dist<2 × 10−166.10 × 10⁻¹⁶
SA4recov1.60 × 10−90.0233.40 × 10−8 SA4recov1.10 × 10−90.510<2 × 10⁻¹⁶
SA5non-dist1.30 × 10−133.90 × 10−130.3778.50 × 10−10 SA5non-dist6.30 × 10−141.70 × 10−130.1908.40 × 10−15
TCG TCW
SA1distSA2recovSA3non-distSA4recov SA1distSA2recovSA3non-distSA4recov
SA2recov2.20 × 10−11 SA2recov0.371
SA3non-dist2.30 × 10−160.972 SA3non-dist2.30 × 10−166.90 × 10⁻¹⁶
SA4recov0.0020.1820.346 SA4recov3.20 × 10−51.20 × 10−41.30 × 10−15
SA5non-dist5.30 × 10−110.9720.1330.098 SA5non-dist6.30 × 10−141.70 × 10−130.0751.90 × 10−14
Values in italics and bold show significant dependence between the area combination, otherwise the non-italic and non-bold (regular) values show independence. SA—study area; dist—disturbance, recov—recovery, non-dist—no disturbance; area number (1–3 from Czechia, 4–5 from Slovakia).