Abstract
This study presents a risk prediction of coastal hazards induced by typhoons, which are a severe natural hazard that often occur in coastal regions. Taking the coastal hazards happened in Shenzhen as a case study, where is a southeast coastal city of China, we described a methodology to predict the typhoon wind-surge-wave hazard. A typhoon empirical tracking model was adopted to construct full-track typhoon events for 1000 years, based on the statistical characteristics of observed typhoons from satellite imageries. For each individual typhoon, a wind-field model is applied to compute the wind speeds, while the Simulating Waves Nearshore and Advanced Circulation (SWAN+ADCIRC) coupled model is applied to simulate the significant wave heights (SWHs) and storm surge heights. By frequency distribution histogram, it is noted that there exhibits a heavy tail in the probability distribution of maximum surge heights and a thin tail of the peak wind speeds and SWHs in the coastal area of Shenzhen, China. Using the Generalized Pareto Distribution (GPD) model, the extreme values of typhoon wind-surge-wave associated with various return periods can be predicted. Taking account into the combined effects of the wind, surge and wave, the joint hazard maps of typhoon wind-surge-wave can be produced for the study area. The methodology of this case study can provide a new reference for risk prediction of coastal hazards induced by typhoon in similar coastal regions like Shenzhen, China.
1. Introduction
The southeast coast region of China suffers from typhoons every year. In 1996, typhoon Sally caused direct economic losses of Chinese Yuan (CNY) 17 billion in Guangdong province [1]. In 2006, severe tropical storm Bilis brought heavy rain in southern China, which affected 28.33 million people in many provinces, and caused more than CNY 26.6 billion in losses [2]. Hagupit, the strongest typhoon in 2008, landed in Guangdong province with speed of 15 m/s, causing economic losses of more than CNY 13.4 billion [3]. Typhoons can cause natural disasters such as strong winds, heavy rain, giant waves, storm surges, etc. China has a long coastline, and coastal areas are economically developed. China is also one of the countries with the most land-falling typhoons [4]. There are many serious losses of life and economic property in the coastal region every year. Much of the loss is caused by the typhoon storm surge in particular. It is crucial to predict the risks of typhoon wind, storm surge, and sea wave for the disaster prevention and mitigation in typhoon-prone region.
Traditional empirical statistical methods for risk analysis of storm surge are limited by the lack of observation data of typhoon storm surge and wave height for a specific site. Additionally, there are large uncertainties when considering extreme storm surge events in the upper tail. In order to overcome the shortcomings in quantity and quality of historical observation samples, a stochastic simulation method to expand the tropical cyclone samples has been developed internationally. One of the ideas is to produce many virtual typhoons based on the skills of Vickery et al. [5,6] or Emanuel et al. [7], and then combine with the numerical model to simulate the storm surge of virtual typhoons and further analyze the hazard risk of the storm surge. The second idea is the Joint Probability Method (JPM) (Toro et al. [8], Resio et al. [9]). The precondition of the JPM methods is that the typhoon key parameters are independent variables. In fact, they are not independent of each other, such as the central pressure difference and the radius to maximum wind speed. The third idea is the Empirical Simulation Technique (EST) proposed by Scheffner et al. [10]. This method can analyze the frequency of storm surges and the Probable Maximum Storm Surge (PMSS). The EST method is based on the statistical characteristics of historical typhoons, and not considering the relationship between the typhoon key parameters. However, the estimated PMSS may be too extreme, which will bring huge costs for engineering design. Thus, this method is only suitable for some national key large-scale engineering design (Scheffner et al. [11]). Lin et al. [12] coupled a hurricane model developed by Emanuel et al. [7], based on statistical dynamics method with the Sea, Lake, and Overland Surges from Hurricanes (SLOSH) model proposed by Jelesnianski et al. [13] to predict the hazard risk of hurricane storm surge for New York. Their methodology does not depend on historical typhoon data and is appropriate for New York City with scarce typhoon events. Pei et al. [14] constructed the tropical cyclone events in Atlantic Ocean by applying the empirical tracking model (Vickery et al. [5]) and adopting the SLOSH model to simulate the storm surge in Charleston, South Carolina. Finally, they predicted the storm surge for different return periods.
Li and Hong [15] used the empirical tracking model to predict the risk of typhoon wind hazard for China coastline, but using this method to further study the risk of storm surge and wave is unavailable in the previous literature. The joint hazard of typhoon wind, surge and wave can be death blow to coastal areas. At present in China, there are few considerations of the joint hazard of typhoon wind, surge and wave at the specific site along the China coast.
In this paper, we study the case of Shenzen, a coastal city located in the southeast, and describe a methodology to predict the typhoon wind-surge-wave hazard by using a typhoon empirical tracking model and the Simulating Waves Nearshore and Advanced Circulation (SWAN+ADCIRC) coupled model (Luettich et al. [16], Westerink et al. [17], Dietrich et al. [18]). Shenzhen City has developed economy and dense population with about 13 million people, and it is also been affected by severe typhoon disasters [19]. We investigate the typhoon storm surge, wind and wave hazard risk for it. First, the typhoon empirical track model is adopted to construct many synthetic typhoons over the entire Northwest Pacific Basin. Second, we extract the records of typhoons that approach within 250 km of the Shenzhen City, and use the SWAN+ADCIRC coupled model to simulate the storm surge events induced by these typhoons around the Shenzhen area. Through parametric investigation, Li and Hong [15,20] and Vickery et al. [21] all set the subregion size to 250 km. The SWAN+ADCIRC coupled model is accurate enough but a little time-consuming. Then, we study the statistical characteristics of typhoons that affect Shenzhen area. Next, we conduct the statistical analysis for the extreme storm surges, winds and significant wave heights (SWHs) at the Shenzhen City. Finally, by using the extreme value distribution, we predict the extreme values of typhoon wind-surge-wave associated with various return periods. The joint hazard maps of typhoon wind-surge-wave for Shenzhen City are also obtained.
2. Methods
2.1. Typhoon Simulation
The traditional typhoon risk analysis is mainly based on the Monte Carlo simulation of virtual typhoons, which is the local track modeling. In addition to the Monte Carlo simulation, many other scholars have developed and expanded the full track modeling for typhoon risk analysis. Vickery et al. [5] took the lead in developing the typhoon empirical tracking model. This method models the entire path of typhoon, which is necessary for the typhoon storm surge risk analysis to simulate the whole track of typhoon from genesis to lysis. The empirical tracking model allows the typhoon to turn and change its translation speed and intensity, so it can reproduce the continuous changes of hurricane central pressure difference and storm heading along the US coast. The advantage of this method is that it does not depend on the assumption of consistent climate within a certain region. It can analyze the risk of typhoon more reasonably in a larger area. This is useful for the risk analysis of large-scale systems, such as the design of transmission line systems, insurance policies, etc. Huang et al. [22] developed the event-based hurricane simulation technology in the long-term risk assessment of the Southeastern United States. James and Mason [23] used an autoregressive model in the typhoon track and intensity model. Emanuel [24] and Emanuel et al. [7] developed the typhoon track model based on statistical dynamics method. The assumption of the Hall and Jewson [25] model is that typhoons in the same location of Atlantic basin have similar movements but with uncertainty. Li and Hong [20] simplified the empirical tracking model based on the geographic weighted regression analysis proposed by Fotheringham et al. [26] and they verified the simplified model. There are other derivative applications for the empirical tracking model. Powell et al. [27] used Markov chain to describe the typhoon track. Lee and Rosowsky [28] established a hurricane database for the coastal regions of the northwestern United States under the climate scenarios of 2005 and the future, respectively. Legg et al. [29] and Apivatanagul et al. [30] mainly focused on the estimation of the long-term regional hurricane hazard. American building code (ASCE 7-05 [31], ASCE 7-10 [32]) also used empirical tracking model to predict wind speed.
In this study, the simplified tracking model (Li and Hong [20]) is used to construct the synthetic typhoons throughout the Northwest Pacific Basin. The simplified model removes some secondary variables, making the model more simplified and reasonable. The empirical tracking model is based on statistical characteristics of the observed typhoon data. The historical typhoons used in this paper comes from the CMA-STI dataset, which is maintained by the China Meteorological Administration and Shanghai Typhoon Institute (tcdata.typhoon.org.cn). The dataset includes all typhoon events that occurred in the Northwest Pacific Basin since 1949. The satellite imagery which can be used to analyze the typhoon position, size, and intensity is an important source for the CMA-STI data. In April 1960, the first typhoon satellite imagery was taken by Teros-1 polar orbit satellite on the ocean surface of 1300 km east of Australia. By the 1970s, almost all typhoons occurred were covered by satellite observations [33].
2.1.1. Simplified Tracking Model
The empirical tracking model describes the regression relationships in the typhoon moving speed, direction, and relative intensity between the next state at i+1 and the current state at i. The simplified model is as follows,
where ai, bi and di are the indefinite coefficients; ci, θi, and Ii are the typhoon moving speed, direction, and relative intensity, respectively; Δlnc = lnci+1 − lnci; Δθ = θi+1 − θi; Tsi is monthly mean of sea surface temperature (SST) in degrees kelvin; εc, εθ, and εI are error terms. In this study, the SST data is from the Moderate-resolution Imaging Spectroradiometer (MODIS) Ocean Products [34]. The MODIS Flight Instruments are integrated on the Terra and Aqua spacecrafts, which provide users worldwide with an unprecedented perspective on the phenomenology of the terrace, atmosphere and oceans. The monthly SST data with 4 km spatial resolution are used in this study.
The concept of relative intensity I was established by Darling [35]. He took the typhoon central pressure as a function of environmental variables (including SST). The introduction of SST into the model reduces some unexplained changes in the central pressure model. Typhoon center pressure p0 can be expressed by relative intensity I, and vice versa. The formula for I is:
where p0 is the typhoon central pressure; pda is partial pressure of ambient dry air; pdc is the minimum sustainable central pressure; es is saturation pressure.
Firstly, we divide the entire Northwest Pacific Basin into 5° × 5° grid. Then the typhoon position, c, θ, and I at the adjacent moment in each grid are extracted from the CMA-STI data. Based on regression analysis, the model coefficients ai, bi, and di of each grid can be obtained. Thirdly, direct sampling method is used to extract the location, date, c, θ, and I at the beginning of the typhoon from CMA-STI database to initialize the simulation process. Given the initial state of the typhoon, the new c, θ, and I of the typhoon can be calculated according to Equation (1). Finally, the typhoon position at the next 6 h intervals can be obtained, and, in this way, we can get a complete typhoon track. We fit the coefficients in Equation (1) for the typhoons moving east and west, respectively. When there is no or few observed typhoons in a grid, which is not enough for regression analysis, the coefficients of adjacent grid can be used instead.
2.1.2. Decay Model
For a landed typhoon, the energy source disappears and the friction at the bottom of the typhoon boundary layer increases. Therefore, its strength gradually weakens, that is, the typhoon wind speed and central pressure difference decreases. The Vickery and Twisdale [36] model, applied in this paper, describes the attenuation of the central pressure difference with time after landing:
where Δp0 and Δp(t) are the typhoon central pressure difference (hPa) from the periphery pressure at the time of landing and after landing, respectively; a is the decay coefficient; ε is the random error term.
2.1.3. Typhoon Wind Filed Model
In the typhoon risk analysis, typhoon wind filed model plays an important role, and its accuracy increases the reliability of typhoon numerical simulation. The Yan Meng (YM) model is a semi-empirical wind field model, which is simple and accurate enough, and is very suitable for typhoon risk analysis. The YM model was established by Meng et al. [37] on the basis of a pressure gradient equilibrium equation. In order to consider the topographical effect, they established the concept of "equivalent roughness length". Matsui et al. [38], Zhao et al. [39], and Okazaki et al. [40] all used this model for typhoon simulation.
The pressure model used in YM wind filed model is from Holland [41]:
where p(r) is the pressure (hPa) at distance r from the typhoon center, Rmax denotes the radius to maximum winds, B denotes the pressure profile parameter. In this study, the Rmax and B are calculated by Vickery and Wadhera [42] models, which has also been adopted by Li and Hong [15,20,43] and Hong et al. [44].
The motion equation of YM model is as follows,
where V denotes the typhoon wind speed, ρ is the air density, f denotes the Coriolis term, k indicates vertical direction, F is frictional force in the boundary layer. Meng et al. [37] derived a complete analytical solution for the gradient wind equation through a series of decompositions and simplifications, making the model relatively simple and easy to solve. For more details about the YM model, please refer to Meng et al. [37].
2.1.4. Model Validation
To validate the empirical track model, we compare the mean and standard values of typhoon key parameters between the simulated and historical tracks along the China coastline, including typhoon annual occurrence rate, λ: translation speed, VT: central pressure difference, Δp: minimum approach distance, Dmin: storm heading, θ. λ is the frequency of typhoons within a subregion of one interest site. Δp is central pressure difference from periphery pressure. When the interest site is on the right of the typhoon track, Dmin is positive, and vice versa. θ is the angle of typhoon moving direction from the true north. First, we use the simplified empirical tracking model to construct 1000-year synthetic typhoons in the Northwest Pacific Basin, based on the statistical characteristics of observed typhoons from CMA-STI data. Then, we select 46 coastal stations of China (shown in Figure 1), and extract the key parameters of typhoons that pass within 250 km of each coastal station from the simulated and CMA-STI typhoon data, respectively. Finally, typhoon central pressure difference is estimated by the maximum value of each typhoon within 250 km from the coastal station. Other typhoon key parameters are estimated when a typhoon is closest to each station.
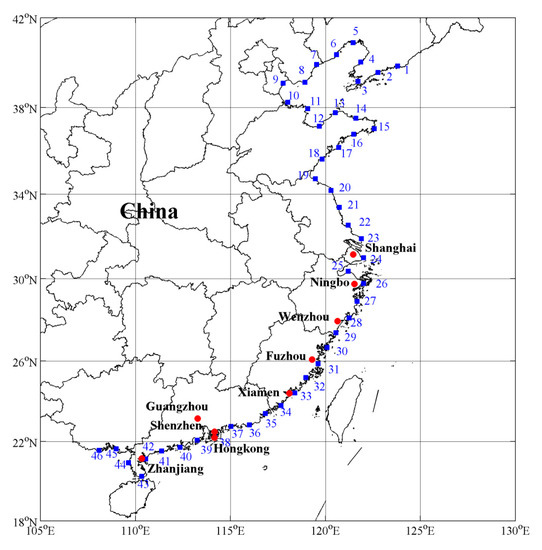
Figure 1.
Locations of coastal stations (blue box) and 9 coastal cities (red dots) along China coastline.
Figure 2 shows comparison results of the simulated and observed values of typhoon key parameters along the China coastlines. It can be seen that the simulated and observed typhoon key parameters agree well with each other, which verifies that the empirical tracking model is effective for China’s southeast coast.
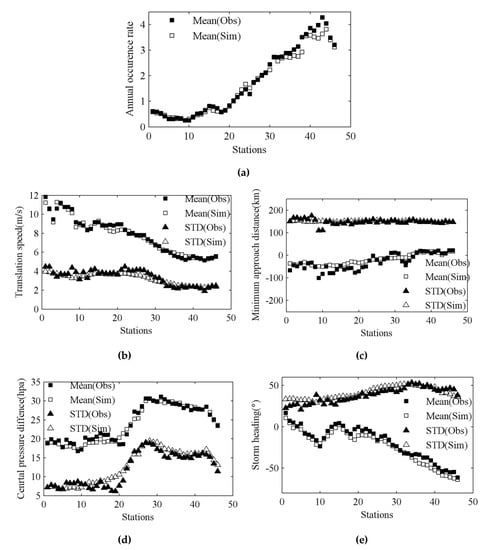
Figure 2.
Comparison of the mean and standard values of typhoon key parameters between the simulated and observed tracks at 46 coastal sites of China: (a) λ; (b) VT; (c) Dmin; (d) Δp; (e) θ. (Sim-simulated, Obs-observed).
To further validate the empirical tracking model used in this study, Figure 3 compares the simulated wind speeds for return periods of 50-years and 100-years, based on the YM model, and empirical tracking model with those from the load code (GB 50009-2012 [45]) and the Li and Hong [15] at 9 cities along the China coastline. The locations of the 9 cities are shown in Figure 1. Referring to Li and Hong [15], the roughness length of 9 cities is set to 0.05 m. From Figure 3, we can see that the simulated wind speeds match well with the code values and the results from Li and Hong [15], who also use the empirical tracking model method.
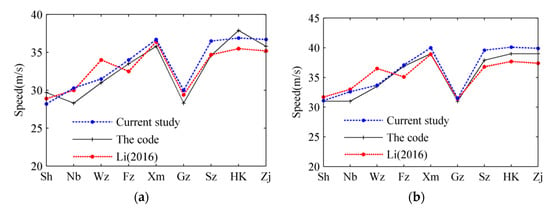
Figure 3.
Comparisons of wind speeds for the (a) 50-year and (b) 100-year return period at 9 cities between the current study, the design code [45], and Li and Hong [15].
2.2. SWAN+ADCIRC Model and Simulations
2.2.1. SWAN+ADCIRC Model
We use the SWAN+ADCIRC coupled model to simulate storm surges and wave heights. The ADCIRC model is proposed by Luettich et al. [16] of the University of North Carolina and Westerink et al. [17] of Notre Dame University. It is the hydrodynamic calculation model that can be applied to shelves, coasts, and estuaries. The model can consider the effects of complex boundary conditions and dynamics. It has been widely used in the forecasting of tide, current, and storm surge in various military ports by the US Army Corps of Engineers (ACE) and the US Naval Research Laboratory (NRL). It is also used in storm surge forecasting of the East Coast of the United States and the risk assessment system of storm surge in Louisiana by NOAA. Many studies (Blain et al. [46], Shen et al. [47,48], Westerink et al. [49], Chen et al. [50], and Lin et al. [12]) have used the ADCIRC model to simulate the storm surge and validated the accuracy of the model. The Simulating Waves Nearshore (SWAN) model is the third-generation numerical model of nearshore wave developed and maintained by Delft University of Technology. It is applied to the wave simulation of nearshore shallow water like lakes, estuaries, and coasts.
Dietrich et al. [18] developed the SWAN+ADCIRC coupled model. As indicted by Lin et al. [12], the description of the complex physical process of storm surge, the high-resolution grids, and the relatively large simulation area of the ADCIRC model make the calculation time-consuming. Especially when coupled with SWAN model, the model is computationally expensive. However, the interaction of wave and circulation is important for describing the hydrodynamics in more detail and with more accuracy during a typhoon process in the coastal area. Previous studies (Dietrich et al. [51], Resio and Westerink [52]) have shown that the strong interaction between waves and storm surges can make the water levels increase by as much as 35%, due to the local wave-driven set-up. Using the SWAN+ADCIRC model can take the combined effects of the wave, astronomical tide, and circulation into consideration. Additionally, when we only study one site of interest and adopt relatively coarse grids and a relatively small domain, the computation time of SWAN+ADCIRC is also acceptable. Although SWAN+ADCIRC model is time-consuming, its calculation accuracy is relatively high.
The use of an unstructured grid of the SWAN+ADCIRC model can make the model have higher resolution in areas where the water depth changes dramatically and the shoreline is complex, and coarser resolution in places where the topography is relatively flat, which can not only meet the requirements of the calculation, but also save the calculation time (Blain et al. [46]). The grid resolution in this study ranges from 50 km in the open sea, to as high as 400 m around Shenzhen City (Figure 4). The ETOPO1 database is used for the bathymetric data. The driven wind field is calculated from the YM model.
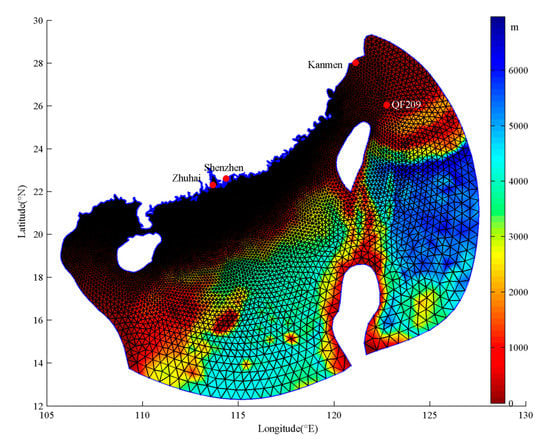
Figure 4.
Unstructured mesh of the Simulating Waves Nearshore and Advanced Circulation (SWAN+ADCIRC) model for the Shenzhen area (the red dots are meteorological stations and the fill color is water depth).
2.2.2. Model Validation
To validate the adequacy of the SWAN+ADCIRC model, we compare the simulated results from SWAN+ADCIRC model with the observed results, including the storm surge, total tidal level (astronomical tide level plus storm surge level), and the significant wave height (SWH) of the historical typhoons Vicente (1208) and Fitow (1312). The tracks of typhoon Vicente and Fitow (Figure 5) are from the China Meteorological Administration Tropical Cyclone Data Center (http://tcdata.typhoon.org.cn/tcsize.html), which is derived from the Multi-functional Transport Satellite-2 (MTSAT-2) of the Japan Meteorological Agency (JMA). The MTSAT-2 satellite is a geostationary-orbit satellite launched by Japan on 18 February 2006, which captures images of the Northern Hemisphere every 30 min, and can better grasp the movement of typhoons and clouds. Figure 6 shows the infra-red satellite imagery of Severe Typhoon Vicente at 3 p.m. on 23 July 2012 (UTC), showing a distinct eye at about 120 km south-southwest of Hong Kong. Vicente was at its peak intensity with estimated maximum sustained winds of 155 km/h near its center.
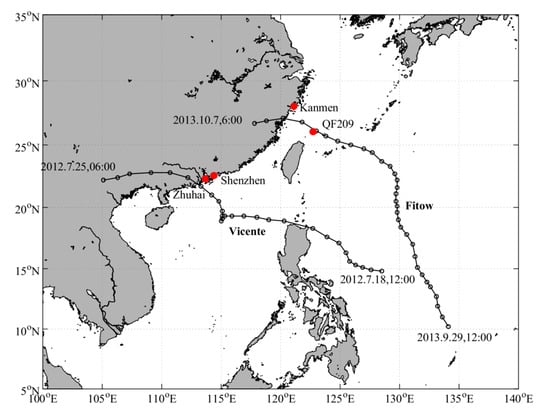
Figure 5.
Tracks of typhoon Vicente (1208) and Fitow (1312) and locations of meteorological stations.
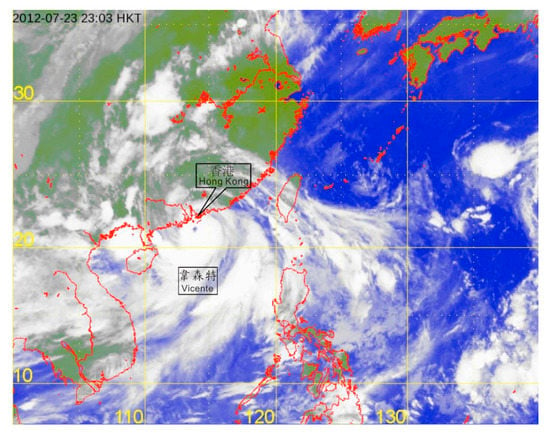
Figure 6.
Infra-red satellite imagery of Severe Typhoon Vicente at 3 p.m. on 23 July 2012 (UTC) from MTSAT-2 satellite.
Figure 7a,b are simulated and measured storm surge of typhoon Vicente at meteorological site of Shenzhen (114.38°E, 22.57°N) and Zhuhai (113.66°E, 22.32°N), respectively. Figure 8a is the simulated and measured total tidal level of typhoon Fitow at meteorological site of Kanmen (121.11°E, 28.03°N). Figure 8b is the simulated and measured SWH of typhoon Fitow at buoy site QF209 (122.73°E, 26.04°N). It can be seen from these figures that the simulated results from the SWAN+ADCIRC model generally match well with the observed results, further indicating the adequacy of the SWAN+ADCIRC model for the China coastline.
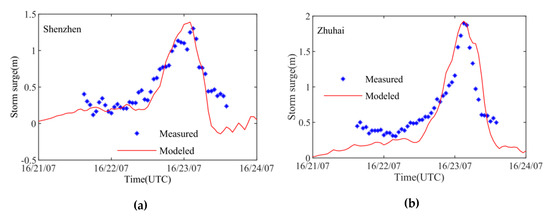
Figure 7.
Comparison of SWAN+ADCIRC modeled and measured storm surge at (a) Shenzhen and (b) Zhuhai for the typhoon Vicente (Time: hour/day/month).
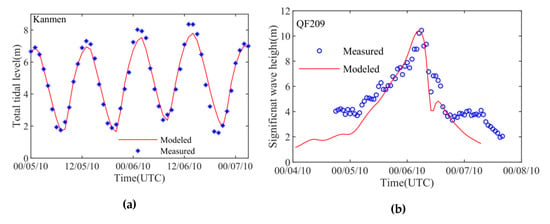
Figure 8.
Comparison of SWAN+ADCIRC modeled and measured (a) total tidal level at Kanmen and (b) significant wave height at QF209 for the typhoon Fitow (Time: hour/day/month).
3. Results
In this paper, first the empirical tracking model is used to simulate synthetic typhoons for 1000 years over the Northwest Pacific Basin. Second, the typhoon tracks that pass within 250 km of the Shenzhen City are extracted. Then, the YM model is adopted to compute the typhoon wind field and the SWAN+ADCIRC coupled model is run, to compute the storm surge levels and wave heights of Shenzhen City. Next, we extract the peak wind speeds, maximum storm surges, and maximum SWHs data for statistical analysis. Finally, using the appropriate extreme value distribution can predict the design values of typhoon wind-surge-wave of different return periods for Shenzhen City.
Using the empirical tracking model, we generate 32,689 virtual typhoons during the 1000-year period in the Northwest Pacific Basin. From those typhoons, we extract 2811 typhoon tracks that approach within 250 km from the Shenzhen City as shown in Figure 9a. Based on the historical typhoon data from 1949 to 2017 obtained by CMA through satellite cloud map and meteorological radar, we extract 180 observed typhoons affecting Shenzhen, as shown in Figure 9b. The annual occurrence rate of virtual typhoons for Shenzhen is 2.811 and that of the observed typhoons is 2.623. The error of the annual occurrence rate between the modeled and the observed is 7%.
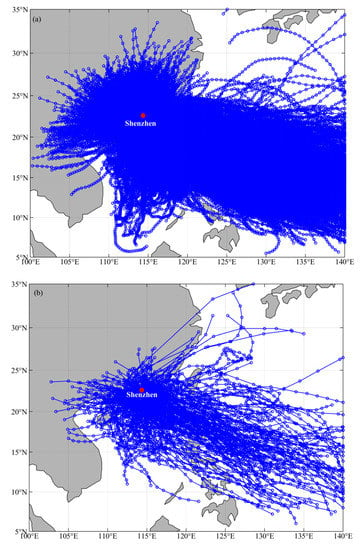
Figure 9.
(a) Simulated and (b) observed tracks of all typhoons affecting Shenzhen City.
In this study, we apply the YM model to compute the maximum wind speeds of typhoons for Shenzhen City. In the YM model, the terrain roughness and topographical effect were expressed by a single bulk parameter of roughness length. The values of the roughness length for different geomorphology based on past studies [53,54] are shown in Table 1.

Table 1.
Roughness length (m) of different geomorphology.
We determine the roughness levels of Shenzhen City (114.34°E, 22.61°N) based on satellite image (Figure 10) from Remote Sensing Data Engine of Geospatial Data Cloud (http://www.gscloud.cn/). Combining the satellite imagery in Figure 10 and the division of the roughness level in Table 1, we define the roughness of Shenzhen City as level II.
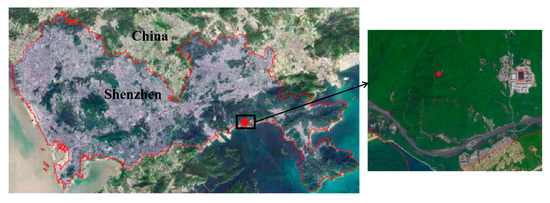
Figure 10.
Topography and landform of Shenzhen City from satellite imagery of Geospatial Data Cloud.
The histogram of the maximum wind speeds is present in Figure 11. We can see the maximum wind speeds peak at about 18m/s, and is evenly distributed on both sides.
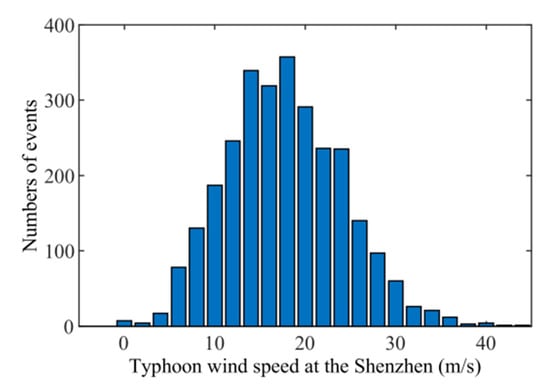
Figure 11.
Histogram of the maximum wind speed at Shenzhen City for 2811 virtual typhoons.
We use the SWAN+ADCIRC coupled model to calculate the wave heights and storm surges of 2811 simulated typhoons for Shenzhen City (114.338°E, 22.597°N). The histograms of the maximum values of storm surges and SWHs are shown in Figure 12a,b. The peak of storm surge in Figure 12a is about 0.2 m and, as the storm surge level increases, the frequency of storms decreases rapidly. The upper tail on the right-hand side is up to 3 m. This distribution is typically heavy tailed. The histogram of SWHs in Figure 12b peaks at about 2 m and, as the SWH increases, the frequency of storms decreases slowly. This distribution has a moderately heavy tail.
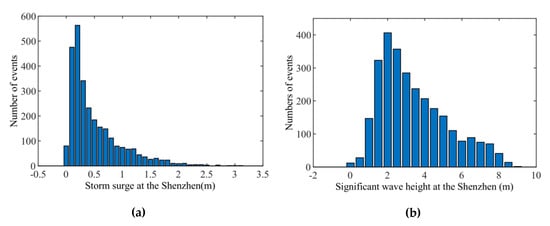
Figure 12.
Histogram of the simulated maximum (a) storm surge and (b) significant wave height at Shenzhen City for 2811 virtual tracks.
4. Discussion
4.1. Discussion of Typhoon Characteristics
The storm surge is caused by a typhoon; thus, it is closely related to the typhoon characteristics, especially when the typhoon is closest to a site. In order to study the impact of typhoon characteristics on the extreme storm surges for Shenzhen City, we compare the key parameters between 100 typhoons with the highest storm surge and the 100 typhoons with the lowest storm surge, referring to Lin et al. [8]. The histograms of the key parameters of 100 typhoons with the highest storm surge are represented by solid bar and that of the 100 typhoons with the lowest storm surge are represented by hollow bar, as shown in Figure 13. All key parameters except the maximum wind speed are the statistical values when the typhoon is closest to the Shenzhen site. In Figure 13, Vmax represents the maximum value of typhoon wind speed; Δp is the central pressure difference; VT is the typhoon translation speed; RMW is the radius to maximum winds; Dmin is the minimum approach distance between the typhoon and the Shenzhen site, and is positive when the Shenzhen site is located to the right of the typhoon track; θ″ is the angle between the storm heading and direction from the site to storm (when a site is on the right side of typhoon track, θ″ greater than 0 and less than 180°, and conversely, θ″ greater than 180° and less than 360°).
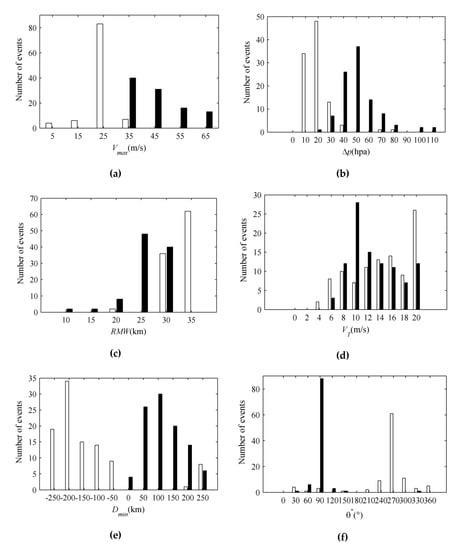
Figure 13.
Comparison between the key parameters of 100 typhoons with the highest storm surge (solid bar) and those of the 100 typhoons with the lowest storm surge (hollow bar), when they are closest to the Shenzhen site: (a) maximum value of typhoon wind speed; (b) central pressure difference; (c) radius to maximum winds; (d) translation speed; (e) minimum approach distance; (f) the angle between the storm heading and direction from the site to storm.
It can be found that, at the Shenzhen site, the typhoons with large maximum wind speeds and central pressure difference can make the storm surge rise more. The typhoons with smaller radius to maximum winds will bring higher storm surges than those with large radius to maximum winds, indicating that the compact typhoons can cause higher storm surges. Slow-moving typhoons tend to cause higher storm surges than fast-moving ones. The typhoons inducing higher (lower) surges all have positive (negative) Dmin, which indicates when the site of Shenzhen is on the right of the storm heading, the typhoon can induce higher surges at the site. When θ″ less than 180, the typhoons induce higher storm surges, which also means that the typhoons with higher storm surges often pass to the left (west) side of Shenzhen site. Weisberg and Zheng [55] have discussed the influence mechanism of typhoon characteristics on storm surge.
4.2. Individual Risk
4.2.1. Extreme Value Distribution
The Peak over Threshold (POT) method can make it possible to estimate the extreme value on the basis of a small sample size. The probability distribution model associated with the POT method is generally the generalized Pareto distribution (GPD) model:
where x is the sample; u is the threshold value; b and c are the scale and shape parameters. The principle of determining threshold value is to retain as many independent sub-sample individuals as possible, on the premise that the number of over threshold value is subject to Poisson distribution. Given a reasonable threshold, the distribution parameters of GPD can be determined.
A quantile-quantile (Q-Q) plot can be used to diagnose the relationship between two distribution functions. When two distributions are similar, the Q-Q plot is close to a straight line. Figure 14a shows the Q-Q plot between the empirical distribution and a standard exponential distribution of the maximum wind speeds. It can be seen that the empirical distribution does not subject to the exponential distribution, and, according to the position relationship between line and scatters in Figure 14a, the distribution of maximum wind speed is thin tail. Then we use the GPD to fit the distribution of the maximum wind speeds as shown in Figure 14b. The threshold is set at 30 m/s, at which level 96.51% of the maximum wind speeds damage occurs in the region. The estimated shape parameter of the GPD of maximum wind speeds is −0.1052 by maximum-likelihood estimation, which belongs to Pareto II–type distribution. From Figure 14b, we can see that the empirical distribution matches well with the GPD, which indicates that the GDP is appropriate for describing the upper tail of maximum wind speeds distribution.
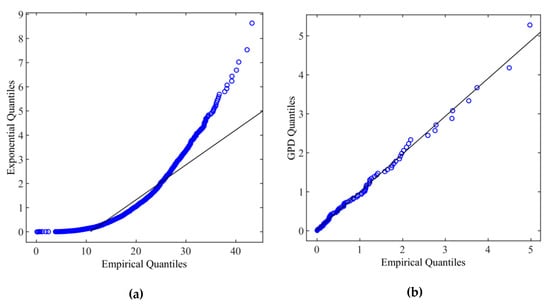
Figure 14.
A quantile-quantile (Q-Q) plot between the empirical distribution of maximum wind speed and (a) a standard exponential distribution, (b) generalized Pareto distribution at a threshold of 30 m/s.
The statistics of the simulated storm surges in Figure 12a show that the distribution of maximum storm surges has a heavy tail. The Q-Q plot of the maximum storm surges against an exponential distribution is present in Figure 15a. We can see that the empirical distribution of maximum storm surges is close to the exponential distribution, except for the up tail. Then we use the GPD to fit the distribution of the maximum storm surges as shown in Figure 15b. The threshold is set at 1.7 m, at which level 96.8% of the maximum surge hazard occurs in this region. The shape parameter we estimated for the GPD of maximum storm surges is −0.0313 by maximum likelihood estimation, and this negative value also indicates that the distribution of maximum storm surges is heavy tail. From Figure 15b, we can see that the empirical distribution matches well with the GPD, which indicates that the GDP is also adequate to describe the upper tail of the maximum storm surges.
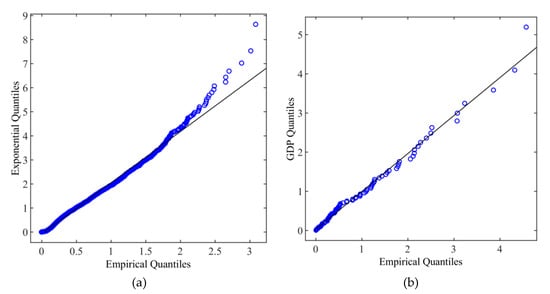
Figure 15.
Q-Q plot between the empirical distribution of simulated storm surge and (a) a standard exponential distribution, (b) generalized Pareto distribution at a threshold of 1.7 m.
We also examine the GDP model for the simulated maximum SWHs. Figure 16a shows the Q-Q plot between the empirical distribution and a standard exponential distribution of the maximum SWHs. As we can see, the empirical distribution does not subject to the exponential distribution. As in Figure 16a, the distribution of maximum SWHs is thin tail. We use the GDP model to fit the upper tail of the maximum SWHs. The threshold is set 7.4 m, and at this level, 96.44% of the maximum SWHs hazard occurs in the region. By maximum likelihood estimation, the shape parameter of GPD for the maximum SWHs is estimated to be −0.4118, which is also a Pareto II–type distribution. The empirical distribution agrees well with the GPD, as shown in Figure 16b, which indicates that the GDP is also appropriate for the maximum SWHs.
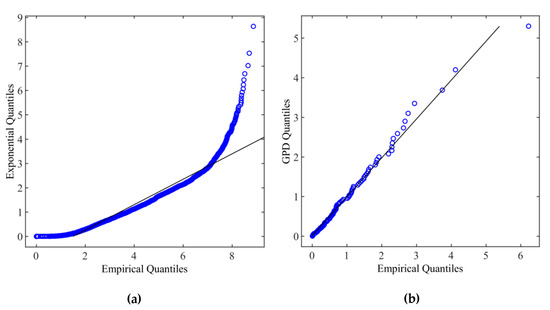
Figure 16.
Q-Q plot between the empirical distribution of significant wave height and (a) a standard exponential distribution, (b) generalized Pareto distribution at a threshold of 7.4 m.
4.2.2. Return Periods
If we want to calculate the maximum value umax in the return period T, we first determine the quantile probability of the extreme value distribution:
where η(u) is the probability of x over the threshold u. Combining the Equations (6) and (7), we can obtain:
Therefore, the expected extreme value for the return period T can be calculated as:
Figure 17a–c show the obtained return periods of the peak wind speeds, maximum storm surges, and maximum SWHs, respectively, for the Shenzhen site and the 95% confidence limits are also shown. From Figure 17, we can easily obtain the design value of wind speed, storm surge, or SWH for different return periods, which can provide reference for disaster prevention and mitigation in Shenzhen City.
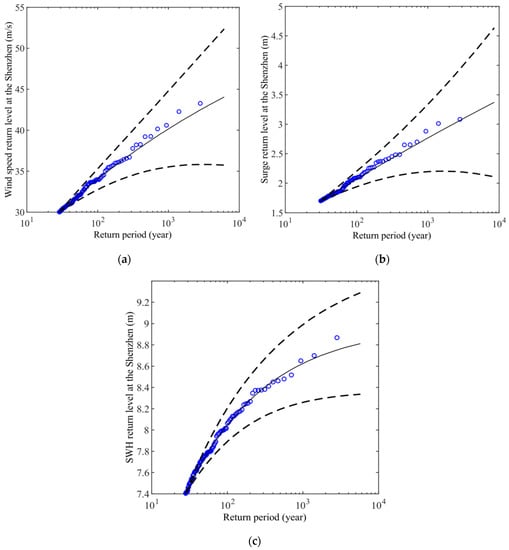
Figure 17.
Return period of maximum (a) wind speeds, (b) storm surges, and (c) significant wave heights for Shenzhen City. (The solid line is the return period from theoretical distribution; the circles are the return period from empirical distribution; the dashed lines are the 95% confidence limits).
4.3. Joint Hazard Maps
We analyze not only the individual risk of wind speed, storm surge, and SWH but also the joint hazard of them.
For a specific site, the maximum wind speed, storm surge and SWH for a particular typhoon i is expressed by vi, si and wi, respectively. The thresholds of them are set V, S, and W, respectively. During a period of time t, the probability that vi > V, si > S, and wi > W can be described as:
where P(vi ≤ V ∪ si ≤ S ∪ wi ≤ W | x) is the probability that vi ≤ V ∪ si ≤ S ∪ wi ≤ W in x typhoon events, and pt(x) is the probability of x typhoons occurring in time t. Referring to Pei et al. [14], the mean return period (MRP) for the joint hazard of the typhoon wind-surge-wave can be obtained by:
where Y is the simulation-year number, n is the typhoon number satisfying vi > V, si > S, and wi > W.
Based on the simulated data for Shenzhen City, we give the scatter distribution of the peak wind speeds, maximum storm surge, and the maximum SWHs as shown in Figure 18a. We also give the three-dimensional joint MRP isosurface plots, as shown in Figure 18b. The different colors in Figure 18b represent different MRP values, and the hole in Figure 18b is meant to see clearly the inside. Based on the hazard plots, we can obtain the joint hazards design values of typhoon wind, surge, and wave for different return period within Shenzhen City.
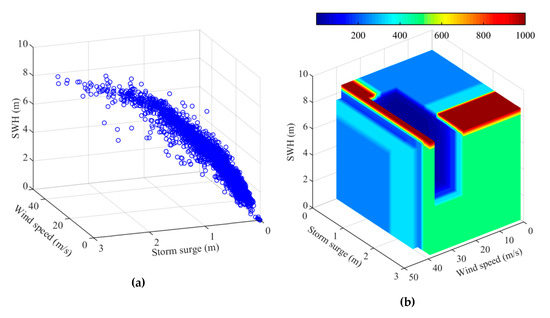
Figure 18.
(a) Scatter plot of the maximum wind speeds, storm surge, and significant wave heights and (b) isosurface plot of joint mean return period (year) at Shenzhen site.
5. Conclusions
In this study, we carried out risk prediction of typhoon wind-surge-wave for Shenzhen City. A typhoon empirical tracking model was adopted to construct full-track typhoon events for 1000 years. We adopted the YM wind field model to compute the corresponding typhoon wind speeds, and the SWAN+ADCIRC coupled model to simulate the storm surges and sea waves for Shenzhen City. Based on the simulated data set, we discussed the characteristics of typhoon wind-surge-wave for Shenzhen City. By frequency distribution histogram, we found a heavy tail is exhibited in the probability distribution of maximum surge heights, and a thin tail of the peak wind speeds and SWHs at the Shenzhen City. Using the GPD model, we predicted the extreme values of typhoon wind-surge-wave associated with various return periods. The joint hazard maps of typhoon wind-surge-wave for Shenzhen City were also obtained, to take into account the combined effects of the typhoon wind, surge, and wave.
The outcomes of this study can provide a new reference for a disaster prevention and mitigation system or multi-hazard design. Although this paper only studies the Shenzhen area, but this method can be applied to other coastal regions.
Author Contributions
Y.G. conceived and designed the study and wrote the paper. Y.H. and Z.L. revised and improved the manuscript. M.D. debug the SWAN+ADCIRC model. The study was supervised by Y.H. All authors have read and agreed to the published version of the manuscript.
Funding
This research was funded by National Key Research and Development Program of China (Nos. 2018YFC1407003 and 2016YFC1402000), National Natural Science Foundation of China (Nos. U1606402 and 41421005), and Strategic Priority Research Program of the Chinese Academy of Sciences (Nos. XDA19060202 and XDA19060502).
Acknowledgments
We would like to acknowledge the ADCIRC Development Group. We also thank the High Performance Computing Center, IOCAS. Online dataset of the CMA-STI Best Track Dataset for Tropical Cyclones over the Western North Pacific (http://tcdata.typhoon.org.cn) are gratefully acknowledged. Furthermore, the critical and constructive comments and suggestions of the reviewers are very helpful and valuable for improving this paper. We would also like to express our gratitude to the MODIS Ocean Products (https://modis.gsfc.nasa.gov/data/dataprod/mod28.php) for the SST data and the Geospatial Data Cloud (http://www.gscloud.cn/) for the satellite images.
Conflicts of Interest
The authors declare no conflict of interest.
References
- Lian, J.F. A preliminary analysis of the characteristics of typhoon Sally. J. Grad. Sun YAT-SEN Univ. (Nat. Sci.) 1997, 18, 25–29. (In Chinese) [Google Scholar]
- Zhang, D.; Cai, A.A.; Lin, X.L. Characteristics and causes of heavy rainstorm caused by severe tropical storm “Bilis”. Guangdong Meteorol. 2007, 29, 22–24. (In Chinese) [Google Scholar]
- Song, F.F.; Ou, J.P. Investigation and analysis of structures damage caused by typhoon “Hagubit”. J. Nat. Disaster 2010, 19, 8–16. (In Chinese) [Google Scholar] [CrossRef]
- Chen, L.S.; Meng, Z.Y. An overview on tropieal cyelone researeh progress in China during the past ten years. Chin. J. Atmos. Sci. 2001, 25, 420–432. (In Chinese) [Google Scholar] [CrossRef]
- Vickery, P.J.; Skerlj, P.F.; Twisdale, L.A. Simulation of hurricane risk in the U.S. using empirical track model. J. Struct. Eng. 2000, 126, 1222–1237. [Google Scholar] [CrossRef]
- Vickery, P.J.; Wadhera, D.; Twisdale, L.A.; Lavelle, F.M.U.S. Hurricane wind speed risk and uncertainty. J. Struct. Eng. 2009, 135, 301–320. [Google Scholar] [CrossRef]
- Emanuel, K.; Ravela, S.; Vivant, E.; Risi, C. A statistical deterministic approach to hurricane risk assessment. Bull. Am. Meteorol. Soc. 2006, 87, 299–314. [Google Scholar] [CrossRef]
- Toro, G.R.; Resio, D.T.; Divoky, D.; Niedoroda, A.W.; Reed, C. Efficient joint-probability methods for hurricane surge frequency analysis. Ocean Eng. 2010, 37, 125–134. [Google Scholar] [CrossRef]
- Resio, D.T.; Irish, J.; Ciaone, M. A surge response function approach to coastal hazard assessment, Part 1. Basic concepts. Nat. Hazards 2009, 51, 163–182. [Google Scholar] [CrossRef]
- Scheffner, N.W.; Borgman, L.E.; Mark, D.J. Empirical simulation technique based storm surge frequency analyses. J. Waterw. Port Coast. Ocean Eng. 1996, 122, 93–101. [Google Scholar] [CrossRef]
- Scheffner, N.W.; Clausner, J.F.; Militello, A. Use and Application of the Empirical Simulation Technique: User’s Guide; US Army Corps of Engineers Engineer Research and Development Center: Washington, DC, USA, 1999. [Google Scholar]
- Lin, N.; Emanuel, K.A.; Smith, J.A.; Vanmarcke, E. Risk assessment of hurricane storm surge for New York City. J. Geophys. Res.-Atmos. 2010, 115, D18121. [Google Scholar] [CrossRef]
- Jelesnianski, C.P.; Chen, J.; Shaffer, W.A. SLOSH: Sea, Lake, and Overland Surges from Hurricanes; NOAA Tech. Rep.; NWS: Miami, FL, USA, 1992.
- Pei, B.; Pang, W.; Testik, F.Y.; Ravichandran, N.; Liu, F. Mapping joint hurricane wind and surge hazards for Charleston, South Carolina. Nat. Hazards 2014, 74, 375–403. [Google Scholar] [CrossRef]
- Li, S.H.; Hong, H.P. Typhoon wind hazard estimation for China using an empirical track model. Nat. Hazards 2016, 82, 1–21. [Google Scholar] [CrossRef]
- Luettich, R.A.; Westerink, J.J.; Scheffner, N.W. ADCIRC: An Advanced Three-Dimensional Circulation Model for Shelves, Coasts, and Estuaries. Report 1: Theory and Methodology of ADCIRC-2DDI and ADCIRC-3DL; Coastal Engineering Research Center: Vicksburg, MS, USA, 1992. [Google Scholar]
- Westerink, J.J.; Luettich, R.A.; Blain, C.A.; Scheffner, N.W. ADCIRC: An Advanced Three-Dimensional Circulation Model for Shelves, Coasts, and Estuaries. Report 2: User’s Manual for ADCIRC-2DDI; Coastal Engineering Research Center: Vicksburg, MS, USA, 1992. [Google Scholar]
- Dietrich, J.C.; Zijlema, M.; Westerink, J.J.; Dietrich, J.C.; Zijlema, M.; Westerink, J.J.; Holthuijsen, L.H.; Dawson, C.; Luettich, R.A., Jr.; Jensen, R.E.; et al. Modeling hurricane waves and storm surge using integrally-coupled, scalable computations. Coast. Eng. 2011, 58, 45–65. [Google Scholar] [CrossRef]
- Wei, W. Typhoon Wind Hazard Analysis of Shenzhen Based on Wind-Field Model Numerical Simulation; Harbin Institute of Technology: Harbin, Heilongjiang, China, 2009. (In Chinese) [Google Scholar]
- Li, S.H.; Hong, H.P. Observations on a hurricane wind hazard model used to map extreme hurricane wind speed. J. Struct. Eng. 2015, 141, 04014238. [Google Scholar] [CrossRef]
- Vickery, P.J.; Wadhera, D.; Powell, M.D.; Chen, Y. A hurricane boundary layer and wind field model for use in engineering applications. J. Appl. Meteor. 2009, 48, 381–405. [Google Scholar] [CrossRef]
- Huang, Z.; Rosowsky, D.V.; Sparks, P.R. Hurricane simulation techniques for the evaluation of wind speeds and expected insurance losses. J. Wind Eng. Ind. Aerodyn. 2001, 89, 605–617. [Google Scholar] [CrossRef]
- James, M.K.; Mason, L.B. Synthetic tropical cyclone database. J Waterw. Port Coast. Ocean Eng. 2005, 131, 181–192. [Google Scholar] [CrossRef]
- Emanuel, K. Climate and tropical cyclone activity: A new model downscaling approach. J. Clim. 2006, 19, 4797–4802. [Google Scholar] [CrossRef]
- Hall, T.; Jewson, S. Statistical modelling of North Atlantic tropical cyclone tracks. Tellus A Dyn. Meteorol. Oceanogr. 2007, 59, 486–498. [Google Scholar] [CrossRef]
- Fotheringham, A.S.; Brunsdon, C.; Charlton, M. Geographically Weighted Regression: The Analysis of Spatially Varying Relationships; Wiley: New York, NY, USA, 2002. [Google Scholar]
- Powell, M.; Soukup, G.; Cocke, S.; Gulati, S.; Morisseau-Leroy, N.; Hamid, S.; Dorst, N.; Axe, L. State of Florida hurricane loss projection model: Atmospheric science component. J. Wind Eng. Ind. Aerodyn. 2005, 93, 651–674. [Google Scholar] [CrossRef]
- Lee, K.; Rosowsky, D. Synthetic hurricane wind speed records: Development of a database for hazard analyses and risk studies. Nat. Hazards Rev. 2007, 8, 23–34. [Google Scholar] [CrossRef]
- Legg, M.R.; Nozick, L.K.; Davidson, R.A. Optimizing the selection of hazard-consistent probabilistic scenarios for long-term regional hurricane loss estimation. Struct. Saf. 2010, 32, 90–100. [Google Scholar] [CrossRef]
- Apivatanagul, P.; Davidson, R.; Blanton, B.; Nozick, L. Long-term regional hurricane hazard analysis for wind and storm surge. Coast. Eng. 2011, 58, 499–509. [Google Scholar] [CrossRef]
- Structural Engineering Institute. Minimum Design Loads for Buildings and Other Structures; American Society of Civil Engineers: Reston, VA, USA, 2005. [Google Scholar]
- Structural Engineering Institute. Minimum Design Loads for Buildings and Other Structures; American Society of Civil Engineers: Reston, VA, USA, 2010. [Google Scholar]
- Zhang, Y.D. The Study of Typhoon Wind Model Based on the Radiiof Wind Circle; Xiamen University: Xiamen, Fujian, China, 2013. (In Chinese) [Google Scholar]
- NASA Goddard Space Flight Center, Ocean Ecology Laboratory, Ocean Biology Processing Group. MODIS-Terra Ocean Color Data. NASA Goddard Space Flight Center, Ocean Ecology Laboratory, Ocean Biology Processing Group. 2014. Available online: https://modis.gsfc.nasa.gov/data/dataprod/mod28.php (accessed on 28 July 2015).
- Darling, R.W.R. Estimating probabilities of hurricane wind speeds using a large-scale empirical model. J. Clim. 1991, 4, 1035–1046. [Google Scholar] [CrossRef]
- Vickery, P.J.; Twisdale, L.A. Prediction of hurricane wind speeds in the United States. J. Struct. Eng. 1995, 121, 1691–1699. [Google Scholar] [CrossRef]
- Meng, Y.; Matsui, M.; Hibi, K. An analytical model for simulation of the wind field in a typhoon boundary layer. J. Wind Eng. Ind. Aerodyn. 1995, 56, 291–310. [Google Scholar] [CrossRef]
- Matsui, M.; Ishihara, T.; Hibi, K. Directional characteristics of probability distribution of extreme wind speeds by typhoon simulation. J. Wind Eng. Ind. Aerodyn. 2002, 90, 1541–1553. [Google Scholar] [CrossRef]
- Zhao, L.; Ge, Y.J.; Xiang, H.F. Stochastic parameter sensitivity analysis of typhoon wind field. J. Tongji Univ. (Nat. Sci.) 2005, 33, 727–731. (In Chinese) [Google Scholar]
- Okazaki, T.; Watabe, H.; Ishihara, T. Development of typhoon simulation model for insurance risk estimation. In Proceedings of the Sixth Asia-Pacific Conference on Wind Engineering, Seoul, Korea, 12–14 September 2005. [Google Scholar]
- Holland, G.J. An analytic model of the wind and pressure profiles in hurricanes. Mon. Weather Rev. 1980, 108, 1212–1218. [Google Scholar] [CrossRef]
- Vickery, P.J.; Wadhera, D. Statistical models of Holland pressure profile parameter and radius to maximum winds of hurricanes from flight-level pressure and H*Wind Data. J. Appl. Meteorol. Clim. 2008, 47, 2497–2517. [Google Scholar] [CrossRef]
- Li, S.H.; Hong, H.P. Use of historical best track data to estimate typhoon wind hazard at selected sites in China. Nat. Hazards 2015, 76, 1395–1414. [Google Scholar] [CrossRef]
- Hong, H.P.; Li, S.H.; Duan, Z.D. Typhoon wind hazard estimation and mapping for coastal region in mainland China. Nat. Hazards Rev. 2016, 17, 4016001. [Google Scholar] [CrossRef]
- Ministry of Housing and Urban-Rural Development of the People’s Republic of China. Load Code for the Design of Building Structures; China Architecture and Building Press: Beijing, China, 2012. (In Chinese) [Google Scholar]
- Blain, C.A.; Westerink, J.J.; Luettich, R.A. Grid convergence studies for the prediction of hurricane storm surge. Int. J. Numer. Methods Fluids 1998, 26, 369–401. [Google Scholar] [CrossRef]
- Shen, J.; Gong, W.; Wang, H. Simulation of Hurricane Isabel Using the Advanced Circulation Model (ADCIRC); College of William and Mary: Gloucester Point, VA, USA, 2005. [Google Scholar]
- Shen, J.; Gong, W.; Wang, H.V. Water level response to 1999 Hurricane Floyd in the Chesapeake Bay. Cont. Shelf Res. 2006, 26, 2484–2502. [Google Scholar] [CrossRef]
- Westerink, J.J.; Feyen, J.C.; Atkinson, J.H.; Roberts, H.J.; Kubatko, E.J.; Luettich, R.A.; Dawson, C.; Powell, M.D.; Dunion, J.P.; Pourtuheri, H. A basin-to channel-scale unstructured grid hurricane storm surge model applied to southern Louisiana. Mon. Weather Rev. 2008, 136, 833–864. [Google Scholar] [CrossRef]
- Chen, Q.; Wang, L.; Tawes, R. Hydrodynamic response of northeastern Gulf of Mexico to hurricanes. Estuar. Coast 2008, 31, 1098–1116. [Google Scholar] [CrossRef]
- Bunya, S.; Dietrich, J.C.; Westerink, J.J.; Ebersole, B.A.; Smith, J.M.; Atkinson, J.H.; Jensen, R.; Resio, D.T.; Luettich, R.A.; Dawson, C.; et al. A high resolution coupled riverine flow, tide, wind, wind wave and storm surge model for Southern Louisiana and Mississippi: Part II—Synoptic description and analyses of Hurricanes Katrina and Rita. Mon. Weather Rev. 2010, 138, 378–404. [Google Scholar] [CrossRef]
- Resio, D.T.; Westerink, J.J. Modeling the physics of storm surges. Phys. Today 2008, 61, 33–38. [Google Scholar] [CrossRef]
- Standards Association of Australia. Structural Design Actions, Part 2: Wind Actions; Standards Australia International Ltd.: Sydney, Australia, 2002. [Google Scholar]
- Choi, H.; Kanda, J. Characteristics of the vertical wind profile for wind load estimation. Wind Eng. JAWE 1990, 45, 23–43. [Google Scholar] [CrossRef]
- Weisberg, R.H.; Zheng, L. Hurricane storm surge simulations for Tampa Bay. Estuar. Coast 2006, 29, 899–913. [Google Scholar] [CrossRef]
© 2020 by the authors. Licensee MDPI, Basel, Switzerland. This article is an open access article distributed under the terms and conditions of the Creative Commons Attribution (CC BY) license (http://creativecommons.org/licenses/by/4.0/).