Abstract
Regardless of political boundaries, river basins are a functional unit of the Earth’s land surface and provide an abundance of resources for the environment and humans. They supply livelihoods supported by the typical characteristics of large river basins, such as the provision of freshwater, irrigation water, and transport opportunities. At the same time, they are impacted i.e., by human-induced environmental changes, boundary conflicts, and upstream–downstream inequalities. In the framework of water resource management, monitoring of river basins is therefore of high importance, in particular for researchers, stake-holders and decision-makers. However, land surface and surface water properties of many major river basins remain largely unmonitored at basin scale. Several inventories exist, yet consistent spatial databases describing the status of major river basins at global scale are lacking. Here, Earth observation (EO) is a potential source of spatial information providing large-scale data on the status of land surface properties. This review provides a comprehensive overview of existing research articles analyzing major river basins primarily using EO. Furthermore, this review proposes to exploit EO data together with relevant open global-scale geodata to establish a database and to enable consistent spatial analyses and evaluate past and current states of major river basins.
1. Introduction
1.1. Relevance of River Basins
Since the origin of ancient civilization, human activity primarily evolved in regions where the Earth’s surface is shaped by rivers [1]. In terms of freshwater supply and food production, rivers are essential to human societies [2]. At the same time, rivers are systematically exploited for extensive irrigation, transportation, or hydropower generation. Mesopotamia, also referred to as cradle of civilization, is formed by the Tigris and Euphrates river system providing fertile soils as well as direct access to freshwater for livelihoods and agricultural productivity. However, the Tigris–Euphrates river basin has faced extreme drought events over recent decades that have contributed to agricultural failures [3]. In comparison, the Mekong river, considered to be the lifeline of Southeast Asia, has undergone vast human-induced changes. The natural river flow has been thoroughly modified through the construction of dams with a tremendous impact mainly on biodiversity and sediment transportation [4]. A decrease in sediment transportation from the Mekong river to the sea already resulted in large-scale erosion at its delta [5].
Growing human societies, increasing demand for freshwater, and global climate change put high pressure on river systems and their entire drainage area [6,7,8]. As freshwater is not evenly distributed on the globe, many regions must deal with water scarcity [9]. In this regard, Mekonnen and Hoekstra [10] reported that around 4 billion people suffer severe water scarcity over a period of at least 1 month a year. With accelerating climate change, the number of people affected by climatic and hydrological extreme events might increase considerably.
In the light of land and water resource management, monitoring of rivers and their entire drainage area is highly important [11]. With more detail, the drainage area of a river, also called river basin, covers all parts of the land surface that contribute to the river discharge at a certain point. In fact, river basins are a functional unit of the Earth’s surface with unique characteristics with respect to their land surface properties, topography, geology, and climate. Here, it is important to note that any changes made in the upstream area might have a considerable impact on downstream regions. Therefore, governance of major river basins, particularly transboundary river basins where collaboration between nations is a prerequisite for avoiding political conflicts [12], is of utmost significance with respect to environmental health and economic development. Figure 1 briefly visualizes selected features and processes of a river basin.
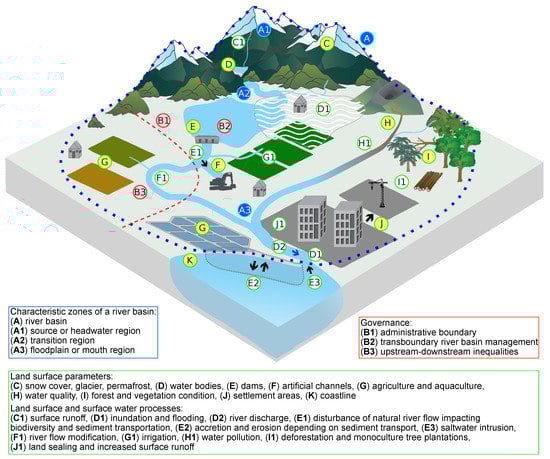
Figure 1.
Schematic overview of a river basin showing selected land surface parameters and related processes (several symbols used are adopted or modified according to courtesy of the Integration and Application Network, University of Maryland Center for Environmental Science).
River basin management requires comprehensive monitoring of its unique characteristics. To date, there are several inventories and interactive data portals providing information on selected major river basins. AQUASTAT, maintained by the Food and Agriculture Organization (FAO), provides tabular inventories on water resources, dams, and irrigation characteristics, but just at the spatial entity of countries. Additionally, a detailed geographical description is available for a selection of transboundary river basins only. Furthermore, HydroSHED provides a suite of geospatial datasets related to hydrographic information on river basins at global scale [13]. The Global Runoff Data Centre (GRDC) offers geospatial datasets on river basin boundaries as well, including tabular inventories on drainage area and mean annual discharge. Additionally, the United Nations Environment Programme (UNEP) coordinates the Transboundary Waters Assessment Programmes (TWAP) river basin component. This platform quantifies baseline information for all transboundary river basins at global scale, including indicators such as water stress, water pollution, governance aspects, and socio-economic variables mainly focusing on risks related to the environment and society. In addition, the World Resources Institute (WRI) provides geospatial information on water related topics, such as water risk on the Aqueduct platform. However, an exploitation of available geospatial thematic data as well as a consistent monitoring of the spatial and temporal distribution of land surface and surface water properties lack for major river basins at global scale [14,15,16]. In Figure 2 general characteristics of major river basins, such as basin area, measured mean annual discharge, population data, and change of selected land cover information are described.
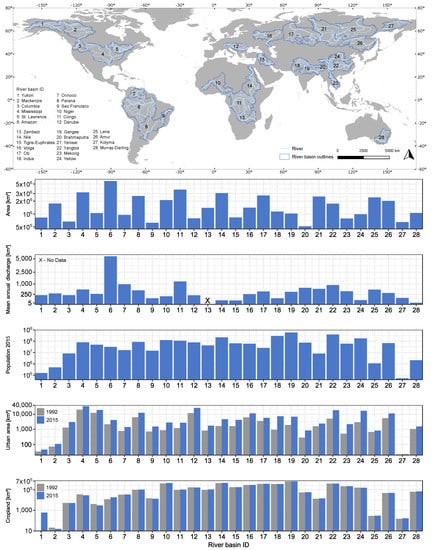
Figure 2.
Characteristics of selected major river basins (selection procedure is described in Section 2). River basin outlines and data on river basin area and discharge are obtained from the Global Runoff Data Centre (GRDC) [17]. Population data is extracted from CIESIN population dataset [18] and spatial information on urban areas as well as rainfed and irrigated croplands from European Space Agency’s (ESA) Climate Change Initiative (CCI) Land Cover [19].
1.2. Earth Observation in Times of Open Archives
Considering the large size and spatial as well as temporal variability of major river basins, Earth observation (EO) has the potential to serve as an efficient tool for river basin characterization. This includes direct and indirect measurements e.g., on land cover and land use, surface water, and river or lake water levels.
The open data policies for many satellite programs offer free access to data archives, e.g., from the European Copernicus Sentinel or the USGS Landsat and MODIS missions, including optical, synthetic aperture radar (SAR), or altimetry instruments. Depending on the requirements and research questions, analyses of land surface and surface water dynamics can be performed at high to low spatial resolution (10 to 1000 m) covering local to global scale. Here, the temporal resolution of change analyses highly depends on the selected data source. Long-term analyses are possible at medium spatial resolution (30 m) e.g., using optical Landsat data (since 1972). Landsat data have the potential to retrieve information on e.g., land cover and land use, vegetation condition, or water clarity at a revisit time of 16 days [15,20,21]. Considering time-series analyses, the low revisit time and data gaps of multispectral Landsat images caused by cloud coverage might drastically reduce the number of valid observations. However, incorporating multi-source Sentinel-2 imagery (since 2015) at 10 to 20 m spatial resolution and a revisit time of up to 5 days, it is possible to densify time-series of optical imagery at high spatial resolution. On the other hand, MODIS (since 2000) and NOAA–AVHRR (since 1978) provide multispectral imagery at low spatial resolution (250 to 1 km) with the advantage of very high temporal resolution up to twice a day. These data offer the opportunity to perform time-series analyses at very high temporal resolution, e.g., to monitor crop growth or inundation dynamics [22,23]. In comparison, SAR missions have the capability to observe land surface dynamics independent of illumination and weather conditions. In detail, open SAR data is provided e.g., by the Sentinel-1 mission at a spatial resolution up to 10 m and a temporal resolution up to 3 days. SAR data have the potential to characterize e.g., inundated areas with or without vegetation cover [24,25].
1.3. Objectives and Scope of this Review
In this review, we analyze all available studies focusing on EO-based characterization of river basins and we assess how EO can contribute to quantifying land surface and surface water parameters with respect to major river basins. To our knowledge, there is no review article mainly focusing on EO-based applications in the context of large river basins. However, we identified related reviews e.g., investigating the use of EO in characterizing surface water [14], EO for monitoring river corridors [26], EO for water resources management [11], EO for monitoring flood extent and water level [27], or application of EO in hydrology [28,29]. The overarching objective of this review is to analyze EO-based datasets and their respective spatial and temporal scale. For this purpose, we review all available literature and provide a general overview of what type of information has been made available to date. In this context, the following research questions will be addressed:
- Which land surface and surface water parameters are studied for major river basins?
- Which remote sensing data sources are used in the reviewed articles?
- What is the availability of basin wide studies, also with respect to the analyses of transboundary river basins?
- What are the limitations of major river basin analyses and what are challenges for future studies?
In Section 2, we start with the description of the methodological review approach. In the following, we present the results of the literature review in Section 3. With more detail, we provide a broad overview of the reviewed studies that investigate river basin characteristics using satellite data. Here, we focus on parameters, such as the spatial distribution of the studies, the identified research foci, employed sensor types, temporal resolution, and spatial scale of the reviewed studies. We also elaborate relevant open geospatial datasets describing land surface and surface parameters at global scale. Afterwards, a detailed review of the investigated land surface and surface water parameters is given. Next, we discuss the findings of our review in Section 4. In Section 5, the review is summarized focusing on the main findings.
2. Methodology
We collocated all available research articles investigating land surface and surface water parameters, specifically those measurable directly at the Earth’s surface, using primarily spaceborne remote sensing data. In the literature, a major river basin is categorized e.g., based on its mean annual discharge, total length of the river, or total size of the drainage area. In this review, the selection of major river basins is solely based on their drainage area. To incorporate at least one major river basin per continent, we selected all river basins with a drainage area greater than 500,000 km2. It must be noted that lake drainage areas are not considered for this review. The resulting sample size amounts to the 28 largest river basins, visualized in Figure 2.
Literature search has been conducted based on the bibliographic database of Web of Science and Scopus (last accessed on 09.04.2019) including research articles of the last two decades, specifically published between 2000 and end of the first quarter of 2019. During literature search we used the names of the selected major river basins together with additional keywords including ’river’, ’delta’, ’basin’, ’catchment’, ’watershed’, or ’floodplain’. This search query resulted in a very large number of research articles. Hence, we reduced the number of journals by pre-selection, since this review focused primarily on EO-based studies of river basins. In particular, this pre-selection limited the literature search to 14 relevant journals and was conducted based on criteria such as compliance of the scope between journal and literature review and relevance of the published research articles. The selected journals as well as the number of identified research articles are listed in Table 1. Accordingly, the research focus of the selected journals is on EO, geoscience, and hydrology. In a final step, we screened all resulting literature based on the following inclusion criteria:

Table 1.
List of included journals and the corresponding count of reviewed articles.
- The literature addressed EO-based land surface and surface water characterization.
- The research article investigated the spatial entity “basin”, “subbasin”, or “regional”. Studies with a small local study area are excluded.
- The research article employed primarily spaceborne EO data.
- The research article did not focus on sea surface water or land–atmosphere interaction applications.
The remaining 287 studies were analyzed to extract relevant information for this review, such as the parameters research focus, employed remote sensing sensor, spatial scale of the study area, and temporal resolution of the study (see Supplement Table S1). Regarding the thematic focus of this review, the research articles were categorized into “biosphere”, “hydrosphere”, and “cryosphere”. Studies analyzing urban areas were assigned to the category “biosphere”. Throughout the literature review, research foci were identified and associated with one of the defined spheres. Corresponding research foci are listed in Table 2.
Table 2.
Summary of categories and corresponding research foci.
3. Results: EO Applications for River Basins
In this section, we first provide a broad overview of the spatial distribution of the reviewed studies and their respective research foci. Afterwards, we evaluate the used sensor types, the temporal resolution as well as the spatial scale of the reviewed research articles. In the following, a more detailed review of the identified research foci is provided presenting key results and findings of the reviewed studies.
3.1. Spatial Distribution of Reviewed Research Articles
The results of this review revealed that analyses of land surface and surface water parameters mainly focused on selected major river basins. The frequency of studies with respect to each individual river basin as well as country are compiled in Figure 3. In detail, we found that the number of published studies is highest for the Amazon river basin, specifically, it was investigated by ∼21% of all reviewed studies. Also, we identified a high research interest for river basins in Southeast Asia, specifically the Yangtze, Mekong, and Yellow river basin. In particular, the percentage of research articles analyzing these river basins amounts to ∼15%, ∼15%, and ∼9%, respectively. Even though the Congo river basin is the second largest in the world, it was investigated in only ∼6% of the reviewed articles. Furthermore, the Mississippi and Mackenzie river basins, located in North America, have a share of ∼5% each. With respect to Arctic river basins, Figure 3a demonstrates that the number of reviewed studies is comparably low, i.e., 2 studies for the Kolyma [30,31] and Volga [32,33] river basins, respectively. To our knowledge, no studies have been conducted for the Amur river basin.
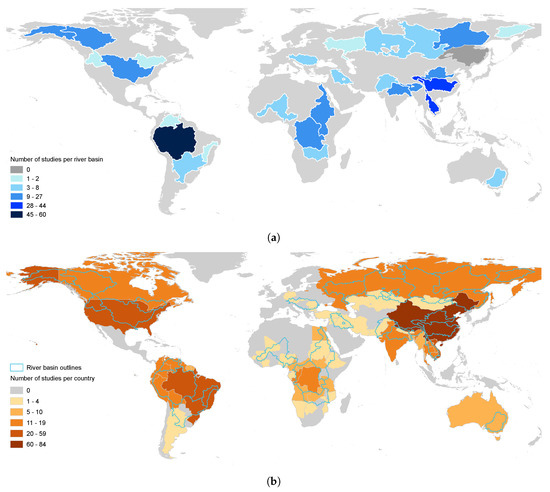
Figure 3.
Overview (a) of the frequency of reviewed research articles per major river basin and (b) the frequency of reviewed research articles per investigated country.
In Figure 3b, the number of reviewed research articles per investigated country is illustrated. Considering the riparian countries of the Amazon river basin, we found that the number of studies is highest for Brazil (e.g., [34,35,36,37]). Although river basins are a functional unit regardless of national boundaries, Figure 3b clearly indicates areas of special interest. With more detail, these include China, Brazil, Vietnam, and the United States of America, where the percentage of studies amounts to ∼29%, ∼21%, ∼11%, ∼8%, respectively. For several major river basins, such as the Niger, Nile, Zambezi, and Danube, it becomes apparent that the territory of some countries included in the functional unit of the river basin remained entirely unstudied.
In this framework, Figure 4 describes the institutional affiliation of the first authors of all reviewed research articles. Here, an alignment of the number of institutional affiliations and the number of reviewed studies per investigated country is noticeable (see Figure 3b and Supplement Table S1). We figured that studies conducted by first authors affiliated to China also dealt with study areas located in China in ∼89% of the investigations. In case of Brazil, the corresponding percentage amounts to ∼75%. First authors associated with Germany mostly investigated study areas located in Asia (∼85%). Moreover, first authors affiliated with the United States of America dealt with study areas located on the American continent in ∼60% of all studies. It must be noted that regarding institutional affiliations of co-authors, ∼42% of all reviewed studies are conducted by cross-border collaborations.
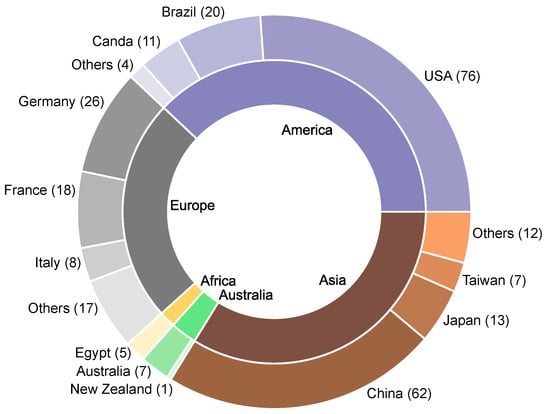
Figure 4.
Institutional affiliation of first authors by continent and nation. The number of reviewed studies is provided in brackets.
3.2. Broad Categorization of Research Foci
During literature review, we categorized all research articles into “biosphere”, “hydrosphere”, and “cryosphere”. According to these spheres, we identified research foci as sub-categories describing EO-based quantification of land surface and surface water parameters (see Table 2 and Figure 5). With a share of ∼53%, the research category biosphere was studied in more than half of the reviewed investigations. Within this category, the main research focus was on vegetation characteristics (∼39%). Following this, multi-class land cover and land use classifications were studied in ∼32% of all investigations (Figure 5). Studies associated with the research foci “urban”, “agriculture”, and “coastline” amount to a share of ∼12%, ∼12%, and ∼5%, respectively. On the other hand, the research category hydrosphere was studied in ∼39% of all reviewed articles. This category includes research foci related to the quantification of surface water and river characteristics. Here, the topic “surface water” had the highest share of articles (∼45%). These studies primarily focused on binary surface water extent classification as well as on the quantification of flooding and inundation dynamics. Finally, investigations related to river properties such as “water quality”, “river water level”, and “river discharge” amount to ∼27%, ∼16%, and ∼12%, respectively. In comparison, the category cryosphere included ∼8% of the reviewed research articles. Here, we identified “snow and ice cover”, “permafrost”, and “river and lake ice” as research foci.
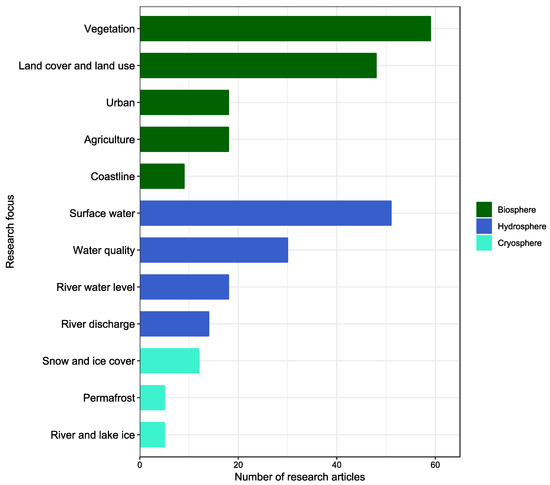
Figure 5.
Number of reviewed research articles per research focus.
Figure 6 presents the number of reviewed research articles with respect to one of the defined research categories per investigated major river basin. This figure indicates that Arctic river basins as well as several river basins with highly mountainous source regions, such as the Indus and Tigris–Euphrates, have a comparably higher share of studies associated with the category cryosphere. In the case of the Brahmaputra, Columbia, Orinoco, Sao Francisco, St. Lawrence, and Volga river basins, all reviewed articles investigated research foci related to the hydrosphere. Yet, the total number of reviewed articles is comparably low for these river basins. Furthermore, for the Amazon, Congo, Mekong, Yangtze, and Yellow river basins, the category biosphere accounted for more than half of all studies in each individual river basin.
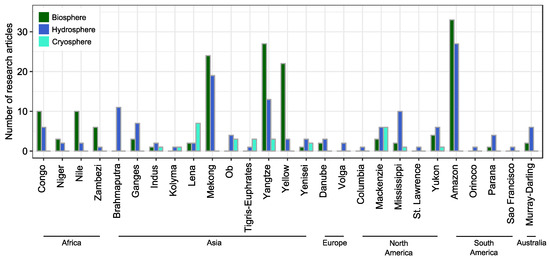
Figure 6.
Number of reviewed research articles categorized by major river basin and research category.
3.3. Employed Sensor Types in Reviewed Research Articles
In terms of used sensor types within the studies, we found that imagery recorded by optical sensors were most frequently used (see Figure 7). Specifically, ∼61% of all studies rely solely on optical remote sensing data. Furthermore, ∼13% of all studies only used SAR and ∼6% altimetry data. Optical and SAR data are most frequently combined (∼5%), while synergistic use of optical and passive microwave data accounted for ∼4% of all investigations. Further sensor combinations are visualized in Figure 7 and amount together to ∼11%.
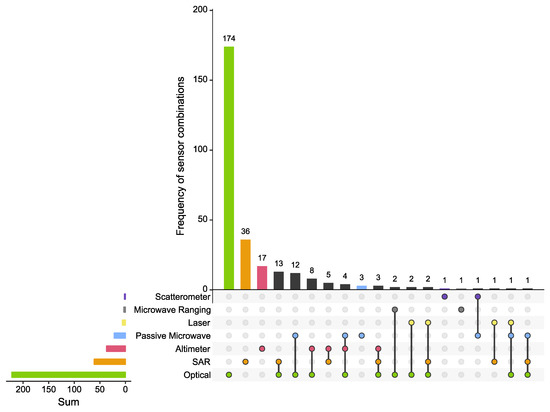
Figure 7.
Employed sensor types and their synergistic use in all reviewed articles.
Figure 8 visualizes the share of used sensor types with respect to the identified research foci. Similar to the results in Figure 7, optical imagery is the most frequently used data source across all research categories. With more detail, ∼14% of the studies investigating research questions related to vegetation characteristics used optical imagery. Similarly, optical data was the primary data source for studies with their research focus on “land cover and land use” (∼13%), “urban” (∼5%), “agriculture” (∼4%), and “coastline” (∼3%). Within the research category biosphere, SAR data was most often used for vegetation mapping (∼5%).
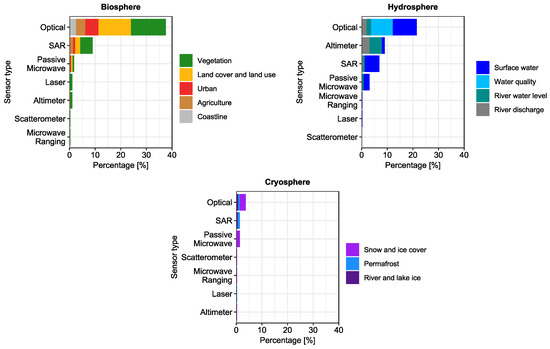
Figure 8.
Percentage of employed sensor types categorized by research foci.
Following this, optical imagery was also primarily used for surface water (∼9%) and water quality (∼9%) mapping. In ∼6% of all studies, SAR images were applied to characterize surface water. Considering river water level and river discharge estimation, altimetry data was used most frequently accounting for ∼5% and ∼3%, respectively.
Regarding the research category cryosphere, optical imagery was most often used (∼13%) for snow and ice (∼2%) as well as river and lake ice monitoring (∼1%). Studies focusing on permafrost employed SAR data in most cases (∼1%).
3.4. Temporal Resolution of Reviewed Research Articles
Figure 9 shows the temporal resolution and total observation length of all reviewed investigations. Considering the temporal resolution of the reviewed investigations, we established the classes “single”, “intra-annual”, and “inter-annual”. The class “single” includes all studies performing no change analysis in their results. If the change analysis was conducted at an interval of less than 12 months, we assigned the respective study to the class “intra-annual”. The class “inter-annual” comprises all studies conducting a change analysis at an interval greater than a year. In total, we found that ∼12% of all studies performed no change analysis. Furthermore, the results indicate that inter-annual change analyses were undertaken in ∼37% of all reviewed articles, while ∼51% investigated intra-annual changes of a respective parameter. In general, we found that intra-annual investigations considered shorter time periods than inter-annual change analyses. The maximum study period for intra-annual analyses amounts to 29 years and to 56 years for inter-annual analyses. Over the two investigated decades, the number of studies performing no change analysis remained constant (Figure 9a). There is a remarkable increase in the number of studies undertaking intra-annual change analyses starting in 2009. Similarly, we also detected an increase with respect to inter-annual change analysis.
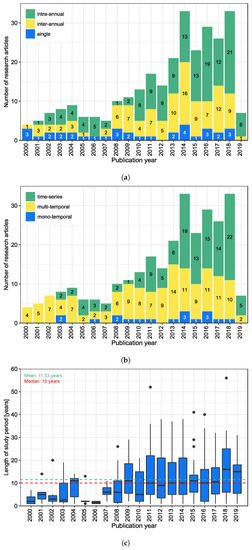
Figure 9.
Number of published studies per year and their temporal resolution with respect to (a) change detection analyses and (b) employed satellite imagery. The boxplots demonstrate the (c) length of the study periods of all reviewed articles per publication year.
In addition, we categorized the studies with respect to the temporal resolution of the employed satellite imagery. Here, we differentiated between “mono-temporal”, “multi-temporal”, and “time-series” analyses. The first class includes studies that only used single acquisitions and the second class includes investigations that used multiple images at several time steps. The third class “time-series” includes studies where a series of images was used at a constant revisit time and/or the research objective was to perform a trend analysis. The results show that only ∼6% of all considered studies applied single acquisitions as input. In comparison, ∼49% of all reviewed articles used multi-temporal imagery and satellite image time-series were employed in ∼45% of all cases. The distribution of the classes over the two investigated decades is depicted in Figure 9b. It is noticeable that the number of time-series applications increased consistently since 2011. This also aligns with the identified increase in intra-annual change analyses (see Figure 9a). Corresponding to the increase of the total number of published articles, there was also a slight increase in the use of multi-temporal satellite images since 2008. The usage of mono-temporal satellite imagery remained constantly low.
Considering the length of the investigated study periods, we identified that ∼54% of all study periods were below or equal to 10 years and ∼18% greater than 20 years. Figure 9c visualizes the length of the study periods per publication year. In general, this figure indicates an overall increase in the length of study periods.
3.5. Spatial Scale of Reviewed Research Articles
Moreover, the reviewed research articles were categorized according to the spatial extent of the investigated study area. In this context, we classified the reviewed articles into “basin”, “subbasin”, and “regional”. Here, investigations at the spatial scale of an entire major river basin are assigned to the class “basin”. The category “subbasin” considers functional subsets of a river basin, including e.g., source or mouth regions. Lastly, “regional” describes study areas with no spatial relation to the functional unit of a river basin i.e., studies analyzing single satellite acquisitions only. However, these studies still have a clear research focus with respect to one of the selected major river basins.
Considering the investigated spatial extent of the reviewed articles in Figure 10, it is evident that the frequency of basin wide studies is comparably low. In total, only ∼14% of the studies focused on the analysis of an entire major river basin and, in comparison, ∼37% of all studies investigated study areas at subbasin scale. Almost half of the reviewed studies, specifically ∼49% investigated a study area at regional scale.
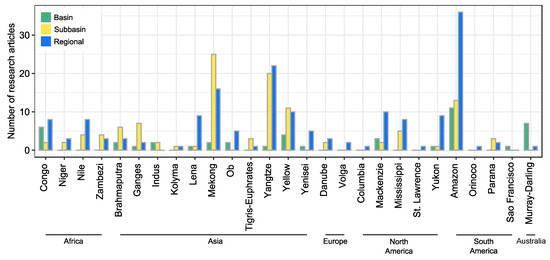
Figure 10.
Number of reviewed research articles categorized by major river basin and their investigated spatial scale.
With more detail, we found that most of the basin wide applications were conducted for the Amazon river basin (∼4%). The river basin with the second highest number of basin wide investigations is the Murray–Darling river basin in Australia (∼2%). Considering the Murray–Darling river basin, almost all available studies are at basin scale. Moreover, the number of studies related to the category “subbasin” is highest for the Mekong, Yangtze, and Yellow river basin. Here, most subbasin analyses had their focus on delta regions. Regional analyses were mostly conducted for the Amazon river basin (∼13%) as well as for the Yangtze (∼8%) and Mekong (∼6%) river basins.
Furthermore, our analysis revealed that most of the reviewed studies focused on the investigation of single river basins only, in particular ∼94% of all articles (e.g., [15,38,39]). In ∼6% of all studies, more than one river basin was analyzed (e.g., [40,41,42]). Additionally, ∼69% of all studies dealt with a transboundary river basin; however, among these studies ∼67% investigated the functional unit of a river basin within one riparian country only.
3.6. Additional EO-Based Data
Despite basin wide applications, global geospatial datasets are already available for many land surface parameters. A list of selected layers is presented in Table 3. To our knowledge, the first global land cover dataset was published at a spatial resolution of 1 degree [43]. Later, Loveland et al. [44] used NOAA-AVHRR data, acquired in 1992 and 1993, to generate global land cover data at a spatial resolution of 1 km. Since then, further datasets at even higher spatial and temporal resolution became available. Recently, a yearly global land cover product was published by the European Space Agency’s (ESA) Climate Change Initiative (CCI) Land Cover project for the period between 1992 and 2015 and at a spatial resolution of 300 m [19]. However, global land cover data at high to medium spatial resolution are still lacking. Further layers are available for the parameter vegetation, surface water, and urban areas at global scale. For these thematic datasets, the spatial resolution reaches up to 10 m. Many studies included subsets of global thematic datasets into their analysis. For example, Wang et al. [45] used the global surface water layer to analyze surface water dynamics over the Yangtze river basin. In another study, OSM data was applied to extract built-up areas [20]. Also, MODIS-based land cover products were used in several studies (e.g., [40,46,47]).
Table 3.
Summary of selected open geospatial data sets characterizing land surface and surface water parameters. The temporal resolution is described as yearly (Y), monthly (M), and daily (D).
3.7. Review of Research Foci
In this section, a detailed review for the research foci is provided. Here, the review of each research focus is structured based on the spatial scale of the corresponding research articles. Studies at basin scale are reviewed first, followed by studies at regional and subbasin scale.
3.7.1. Biosphere: Land Cover and Land Use
Monitoring the state of the Earth’s surface is of high importance for quantification of global environmental change. In the context of river basins, data on regional land cover and land use characteristics of a river basin act as baseline information for decision-makers and support river basin and water management. We found that ∼17% of all reviewed articles focused on multi-class land cover and land use classifications. Among these, only ∼10% quantified and analyzed land cover and land use at the spatial scale of an entire major river basin [16,70,71,72,73]. Here, we found that most of the basin wide land cover and land use studies were conducted for the Yellow river basin. With more detail, Wohlfart et al. [16] quantified land cover change for two time steps, specifically 2003 and 2013, using time-series of MODIS data at a spatial resolution of 250 m. Also, Wang et al. [72] evaluated land cover change for the entire Yellow river basin between the years 1990, 1995, and 2000 by means of Landsat imagery. On the other hand, Matsuoka et al. [71] analyzed land cover for East China, including the whole Yellow river basin. They used MODIS as well as nighttime light imagery for one time step and employed a decision tree classifier. Moreover, land cover of the Mekong river basin was quantified for 2010 by using time-series of MODIS-based vegetation indices for 11 years at a spatial resolution of 500 m [73]. Here, the authors used phenological metrics to classify land use classes. Another basin wide land cover study was performed for the Amazon river basin [70]. In this study, the authors used a mosaic of JERS-1 imagery of 1995 and mainly focused on vegetation type classification.
On the contrary, ∼90% of the studies within this research focus investigated regional and subbasin scale land cover and land use classification. Here, ∼21% of these studies assessed the state of land cover and land use for a single time step. In particular, regional land cover classifications were generated for the delta regions of the Arctic river basins Lena and Mackenzie [74,75,76]. Schneider et al. [74], for instance, used multi-temporal Landsat-ETM images recorded in 2000 and 2001 to generate the first land cover classification of the Lena river delta. The authors used the resulting land cover map to quantify methane emissions over the delta region. Ullmann et al. [76] used polarimetric SAR and Landsat-OLI data to conduct a regional land cover classification over the Mackenzie river delta. Due to the Arctic environment in this study, the classes bare ground, tundra vegetation, and wetland areas were of particular interest. Also, Walker et al. [77] presented a hierarchical classification scheme that used optical and SAR, particularly Landsat-TM and ALOS-PALSAR imagery, in a synergistic way to derive a land cover map for a subset of the Amazon river basin. Further studies dealt with the Yellow river delta [78,79,80]. For example, Liu et al. [78] employed a random forest classifier on a mono-temporal Landsat-OLI acquisition together with derived texture parameters to classify land cover. Next, Guan et al. [79] generated a mono-temporal land cover map combining the classification results based on MODIS and Landsat-OLI imagery. On the other hand, ∼79% of these studies performed regional and subbasin scale land cover and land use change analyses. Here, dam induced land cover change was analyzed particularly often [81,82,83,84,85]. For example, Feng et al. [85] investigated regional land cover change induced by the construction of the Belo Monte dam in the Amazon river basin. In this study, the authors used high and very high spatial resolution multispectral imagery from 4 different sensors, acquired between 2011 to 2016. The results indicated an increase in water body and settlement area, and in contrast, a decrease in bare soil, forest, and agriculture. Furthermore, several studies quantified land cover and land use change for subsets of the Nile river basin using multi-temporal Landsat imagery [86,87,88,89,90]. Abdulaziz et al. [87], for example, found that cropland increased considerably in the East Nile delta region between 1984 and 2003. Similarly, an increase in cropland as well as built-up areas was also detected for the Western Nile Delta [88]. Further studies investigated land cover change on the African continent for the subsets of the Niger [91,92,93] and Congo river basin [94]. Here, Ruelland et al. [92] performed a land cover classification for a period covering 52 years. In this study, aerial as well as satellite imagery were used to quantify land cover changes. The results indicated an increase in croplands and a decrease in tree cover. Apart from that, many studies examined land cover and land use change for study areas in East Asia, including the Mekong, Yangtze, and Yellow river basin (e.g., [95,96,97,98,99]). In particular, Hu et al. [97] and Ren et al. [98] focused on quantification of aeolian desertification for the source regions of the Yangtze and Yellow river basin. In case of the Yellow river basin, the study period included the years between 1975 and 2005. Hu et al. [97] found that increasing temperature, overgrazing, and the drainage of wetlands are the main drivers behind aeolian desertification. In addition, recently published research articles use the Google Earth Engine (GEE) platform for land cover classifications [20]. Here, the authors applied the random forest classifier on 3 yearly Landsat composites for a regional area of the lower Yenisei river basin over the period of 1985 and 2017. The results of this study revealed a significant change of vegetation cover, particularly infilling of vegetation in tundra and open forests.
3.7.2. Biosphere: Vegetation
Considering ecological health, vegetation cover has an important role in river basins. Particularly trees store carbon, regulate surface runoff, and reduce soil erosion in many ways. Overall, ∼21% of all reviewed articles investigated vegetation characteristics. Among these, ∼19% performed basin wide analyses. Here, the Amazon river basin was studied most frequently (e.g., [46,100,101]). For example, de Moura et al. [100] analyzed the response of vegetation to drought events using MODIS time-series as well as further remote sensing-based products, such as precipitation and leaf area index data. Hilker et al. [101] evaluated the usability of MODIS vegetation products to determine changes in vegetation greenness between the years 2000 and 2012. Further studies conducted basin wide analyses for the Congo river basin (e.g., [102,103,104]). Here, Yan et al. [103] evaluated the impact of the number of good quality observations on the derivation of land surface phenology. For this purpose, they used time-series of SEVIRI and MODIS-based vegetation indices for the period between 2006 and 2013. The results indicated that SEVIRI outperformed MODIS in terms of double annual canopy greenness cycle identification. In a subsequent study, Yan et al. [104] analyzed land surface phenology using SEVIRI data, but also incorporated remote sensing-based precipitation and land cover data. The authors characterized the impact of land cover on the relation between the timing of vegetation greenness and precipitation. According to their findings, the onset of the rainy season has a strong impact on the canopy greenness cycle particularly in regions with lower tree cover, such as shrublands and grasslands. Moreover, basin wide investigations exist for the Murray–Darling and Yellow river basin [15,38]. For instance, Broich et al. [15] used all available Landsat data covering a period of 25 years to study vegetation response to hydroclimatic events such as flooding and drought for the Murray–Darling river basin.
Furthermore, ∼81% of these studies investigated study areas at regional and subbasin scale. Among these, ∼27% of the investigations undertook no change analysis and focused on vegetation type classification for a single time step. Here, most studies dealt with the Amazon river basin and particularly forest type (e.g., [105,106,107]) as well as aquatic plant classification [108,109]. Further studies estimated mangrove extent for regional study areas in the Mekong and Zambezi river basin [110,111,112]. Instead, ∼73% of all regional and subbasin scale studies conducted change analyses. A common research objective was monitoring of forest disturbance i.e., caused by deforestation in the Amazon river basin (e.g., [113,114,115,116]). To this aim, most studies employed multispectral Landsat imagery. In addition, Yoshikawa and Sanga-Ngoie [116] used NOAA-AVHRR imagery at low spatial resolution to map deforestation between 1981 and 2001. Incorporating data on transportation infrastructure, the authors showed that most of the land cover transformations occurred in close distance to these infrastructures. In comparison, Leinenkugel et al. [117] analyzed deforestation patterns in the Mekong river basin by means of MODIS and Landsat imagery as well as ancillary data on transportation infrastructure. Similar to the aforementioned study, the authors found that deforestation was higher in locations closest to roads. Apart from that, forest disturbances were also caused by fire as investigated for the Yukon river basin [118,119]. For example, Huang et al. [118] evaluated land surface change induced by fire events using Landsat-based normalized difference vegetation index (NDVI), albedo, and land surface temperature. In addition, several studies quantified vegetation cover changes with specific focus on the source regions of the Mekong, Yangtze, and Yellow river basins (e.g., [39,120,121]). These studies used MODIS as well as SPOT-VGT data at low spatial resolution together with meteorological measurements. Liang et al. [120] used MODIS NDVI together with DEM and meteorological data. They identified an increase in vegetation cover with increasing precipitation in high, unpopulated elevations as well as vegetation degradation close to human settlements in the source region of the Yellow river basin. In comparison, Ge et al. [39] observed an increase in grassland cover between the period 2001 and 2016. Moreover, Liu et al. [121] analyzed spring phenology for the source region of the Mekong, Yangtze, and Yellow river basin using a SPOT NDVI time-series covering 15 years. Their results showed a significant trend in the advancement of the greening date. This trend correlates highly with elevation. Moreover, several research articles studied vegetation changes for study areas in the Zambezi river basin (e.g., [122,123,124]). Shapiro et al. [123], for instance, classified mangrove extent for the Zambezi delta region for the years 1994, 2000, and 2013 using Landsat data. Accordingly, they detected a net increase of mangrove forest extent in inland regions. In addition, Bunting et al. [124] analyzed vegetation change using a time-series of GIMMS3g NDVI at a spatial resolution of 8 km and covering 29 years together with meteorological data. The authors identified changes in soil moisture due to increasing temperatures as well as changes in vegetation greening patterns.
3.7.3. Biosphere: Agriculture
In addition, ∼6% of all reviewed studies focused on agricultural applications. To our knowledge, there is no research article analyzing research objectives in this context at basin wide scale. Yet, we found that ∼77% of all regional and subbasin scale studies dealt with study areas in the Mekong river basin. The majority investigated research objectives related to rice crop mapping, in particular classification of rice cropping systems (e.g., [125,126,127]). Most of these studies used optical imagery, such as MODIS or Landsat. For example, Son et al. [125] derived rice cropping systems using a phenology-based classification approach. To this aim, they employed time-series of MODIS imagery at a spatial resolution of 500 m. In comparison, Kontgis et al. [126] used stacks of multi-temporal Landsat images for 2000 and 2010 together with an object-based decision tree classifier to analyze changes in rice cropping systems. Furthermore, Nguyen et al. [127] mapped rice fields and cropping systems in the Mekong delta using ENVISAT-ASAR time-series over a period of 5 years. Apart from the classification of rice cropping systems, Clauss et al. [128] estimated rice field extent by means of Sentinel-1 time-series and a decision tree classification approach. In a subsequent study, Clauss et al. [129] retrieved rice production estimates based on Sentinel-1 time-series and national census data. Moreover, we found three studies dealing with the Amazon, Nile, and Yangtze river basin [130,131,132]. For instance, Shi and Huang [132] classified rice field extent for the Yangtze river delta using 11 years of MODIS images at a spatial resolution of 500 m. Additionally, Xu et al. [131] mapped cropland change for a regional study area including the Nile river delta over a period of approximately 31 years using Landsat imagery. According to their study, a constant increase in cropland area was observed.
3.7.4. Biosphere: Urban
Urbanization is one of the most prevalent land use conversions and leads to an increase of impervious surfaces and thus decrease of water permeability. Hence, urban areas are particularly vulnerable to hydrological extreme events including floods. The reviewed studies (∼6%) investigating urban extent classification, urban growth analyses, and impervious surface area mapping merely focus on regional and subbasin scale study areas in China, specifically the Yangtze and Mekong river basin. With more detail, ∼65% of these articles conducted their studies over the Yangtze river delta and ∼29% for regional study areas in the Middle or Lower Yangtze river basin. Here, one of the research objectives was the analysis of the urban heat island effect [133,134]. In particular, Zhou et al. [134] quantified surface urban heat island intensity using MODIS imagery between 2010 and 2015. Contrary to previous assumptions, the results demonstrated that the intensity of the urban heat island effect was not highest in highly urbanized cities such as Shanghai. Additionally, the authors stated that urban heat island intensity largely depends on climate, solar radiation, and vegetation activity. Following this, Yao et al. [135] evaluated the impact of urbanization on vegetation condition. For this purpose, they used nighttime light data acquired by the DMSP-OLS sensor and MODIS land cover information covering a period of 16 years. The authors extracted urban areas and performed a trend analysis on the enhanced vegetation index (EVI) as well as the urban heat island layer. The results indicated significant negative trends of EVI for nearly all the study areas within the Yangtze river basin. On the other hand, a significant positive trend of the urban heat island effect was detected for the study areas. Further studies also employed DMSP-OLS data to quantify urban growth [136,137,138,139] and impervious surface area [140,141]. Xiao et al. [136], for example, analyzed urban growth for a period of 30 years based on nighttime lights, NOAA-AVHRR, and SPOT NDVI data at a spatial resolution of 1 km. Moreover, Liu and Chen [142] evaluated urban growth for the middle Yangtze river basin. The authors used MODIS and Landsat data for the years 2000, 2008, and 2016. The results indicated that urban areas experienced a considerable growth in terms of area, specifically small and medium sized cities. In comparison, Shao and Liu [140] retrieved impervious surface area and its temporal dynamics from MODIS and DMSP-OLS nighttime lights data at a spatial resolution of 1 km. With respect to the Mekong river delta, Leinenkugel et al. [143] derived a binary settlement mask using TerraSAR-X data, whereas the impervious surface area was derived with SPOT-5 imagery.
3.7.5. Biosphere: Coastline
Sediment load of rivers is important with respect to the environmental condition of estuarine regions. Human-induced modifications of river flow might tremendously alter sediment transportation and affect the development of delta regions. In this context, the evolution of coastlines was analyzed in ∼3% of all reviewed studies at regional and subbasin scale including the Mississippi [144], Nile [145,146], Yangtze [147,148,149], and Yellow river basin [150,151,152]. Among these, Amer et al. [144] studied the Mississippi river delta which is facing a land loss due to various drivers such as sea level rise or wave erosion. In detail, they used Landsat-based modified normalized difference water index (NDWI) for the years 2000 and 2015. Moreover, Hereher [146] analyzed the evolution of the Nile river delta using Landsat images between 1973 and 2008 to find that coastal area experienced severe erosion affecting approximately 12 km2. In addition, Qiao et al. [149] focused on the Yangtze river delta and quantified coastline dynamics for a period of 55 years. To this aim, they classified the shoreline in 5 year intervals using historical aerial and Landsat imagery. The authors identified that accretion was the dominant process over the delta region. Further on, Kong et al. [152] analyzed the evolution of the Yellow river delta using Landsat data between 1983 and 2011. They quantified the impact of river discharge and sediment load on the delta region and found that the amount of land increased by 248 km2 within the study period.
3.7.6. Hydrosphere: Surface Water
Surface water monitoring is important for quantification of the availability of water resources and mitigating impacts of hydrological as well as climatic extreme events. Estimation of surface water extent is possible using optical (e.g., [34]) and active (e.g., [153]) as well as passive (e.g., [154]) microwave sensors. According to our analysis, surface water dynamics were investigated in ∼18% of all reviewed articles. Among these, ∼22% were at basin wide scale and performed change analysis. Here, the investigated study areas included the Amazon [155], Congo [156], Indus [157,158], Murray–Darling [23,159,160,161,162], and Yangtze river basin [163] as well as several Arctic river basins [40]. For example, Chapman et al. [155] used ALOS-PALSAR ScanSAR data acquired between 2006 and 2010 covering the entire Amazon river basin to classify open water and inundated vegetation extent. Their results indicated that L-band ALOS-PALSAR ScanSAR data was insensitive to inundated herbaceous vegetation. In case of the Indus river basin, Khan et al. [157] simultaneously used MODIS and ENVISAT-ASAR imagery to map inundation extent, specifically for the flooding event in 2010. Additionally, TRMM-based rainfall estimates and AMSR-E brightness temperature was incorporated to quantify precipitation and streamflow patterns. Similarly, Kwak et al. [158] mapped inundated areas during the Indus flood event of 2010 applying a rule-based approach using a modified land surface water index based on MODIS and SRTM data. Moreover, Du et al. [40] derived fractional water for the entire Arctic region, including the Mackenzie, Yukon, Lena, Yenisei, and Ob river basins using multi-source remote sensing data, comprising AMSR-E brightness temperature and land surface parameters as well as MODIS land cover product. Here, surface water dynamics were estimated at a spatial resolution of 5 km and a temporal resolution of 10 days. Apart from that, Huang et al. [23] developed an approach to classify inundation dynamics by integrating gauge measurements and MODIS imagery for the Murray–Darling basin between 2001 and 2010. To this aim, the authors determined river flow peaks to select and analyze corresponding MODIS imagery using the open water likelihood algorithm [164]. The inundation maps were computed at a spatial resolution of 500 m and validated against Landsat images. Furthermore, the authors aggregated single inundation maps to annual maps and quantified yearly inundation frequencies. In comparison, Tulbure et al. [161] mapped inundation dynamics for the Murray–Darling river basin using Landsat data for a period of 26 years. According to their results, climatic extremes such as dry and wet periods have a high impact on the surface water dynamics. In a further study, Heimhuber et al. [162] performed an integrated analysis using water masks derived from 26 years of Landsat data [161] as well as precipitation, evapotranspiration, soil moisture, and in situ discharge measurements to model inundation extent dynamics over the Murray–Darling river basin.
On the other hand, ∼78% of all studies with focus on surface water parameters analyzed regional and subbasin scale study areas. Here, a number of the reviewed studies investigated inundation dynamics in wetlands (e.g., [25,47,165]). For example, Yuan et al. [47] estimated wetland water level and inundation dynamics for a subset of the Congo river basin using ALOS-PALSAR imagery between the years 2002 and 2011. Since the SAR backscattering signal of ALOS-PALSAR imagery was affected by volumetric scattering caused by vegetation cover, the authors also included ENVISAT-RA2 altimeter data and the MODIS vegetation continuous fields product in their investigation. On the contrary, Wilusz et al. [165] mapped monthly wetland inundation in the Sudd wetland region. For this purpose, they analyzed monthly time-series of ENVISAT-ASAR data at 1 km spatial resolution over a period of 5 years. In addition, further studies carried out analyses in the context of wetlands using JERS-1 imagery, which were acquired in the framework of the “Global Rain Forest Mapping” (GRFM) project (e.g., [166,167]). Moreover, several studies observed inundation dynamics in delta regions (e.g., [41,168,169,170]). For example, Sakamoto et al. [168] used MODIS time-series to quantify annual inundation extent over 6 years for the Mekong river delta. Next, Gstaiger et al. [169] developed a threshold-based approach to generate a binary water mask using SAR imagery at different spatial resolutions from the TerraSAR-X, RADARSAT-2, and COSMO-SkyMed sensors. Following this, Kuenzer et al. [170] analyzed patterns of inundation in the Mekong river delta using a time-series of 60 ENVISAT-ASAR scenes at a spatial resolution of 150 m and covering the period between 2007 and 2011. In another study, the effectiveness of daily MODIS time-series for intra-annual monitoring of inundation dynamics was evaluated for the Mekong, Ganges–Brahmaputra, Mackenzie, and Yellow river deltas [41]. Moreover, several studies performed surface water classification using Landsat imagery (e.g., [45,171,172,173]). In this framework, Du et al. [171] used a dynamic thresholding approach to derive binary surface water extent maps for a regional study area within the Yangtze river basin. In detail, they used Landsat data for 15 time steps between 1973 and 2010. Here, the authors identified that changes in surface water extent were mostly induced by constructed dams. Furthermore, Li et al. [172] quantified the performance of 11 different NDWI to classify surface water extent using multi-source multispectral imagery, including Landsat-TM, Landsat-ETM, and EO-1 Advanced Land Imager (ALI). The results indicated that ALI-based NDWI using green and SWIR bands resulted in highest accuracies. Furthermore, Wang et al. [45] developed an approach to evaluate surface water dynamics in the middle Yangtze river basin between 1990 and 2017. To extract yearly minimal and maximal surface water extent, Landsat images were processed using the GEE platform. The results were then compared to the JRC global surface water layer indicating comparable surface water extents. In a further study, multispectral imagery, specifically Planet imagery from the RapidEye and PlanetScope sensors were used to quantify the capability of the sensors to derive surface water extent dynamics [174]. These multispectral sensors provide imagery at high spatial resolution and a high revisit time; however, limiting factors were automatic cloud masking, inconsistent radiometric calibration, and geolocation errors.
3.7.7. Hydrosphere: Water Quality
Human-induced land use conversions put high pressure on water ecosystems. In this context, it is important to monitor the impact of such processes on water quality. In the framework of water quality monitoring, it can be distinguished between estimation of water clarity or turbidity and chlorophyll concentration as well as suspended sediment concentration and organic matter. These features can be measured using optical sensors. Accordingly, all reviewed studies (∼10%) applied multispectral imagery and performed analyses at regional and subbasin scale, expect for one study covering the Amazon river basin [175]. Among these studies, ∼30% dealt with an estimation of water color, more specifically turbidity (e.g., [176,177,178,179]). Here, Massicotte et al. [176] analyzed the spatial and temporal dynamics of water color at the St. Lawrence river using Landsat-TM/-ETM imagery over a period of 25 years. In fact, they found a significant decrease in the reflectance of the river between 1984 and 2009, potentially caused by land use changes. In a further study, the impact of the Three Gorges dam on water clarity of the Yangtze river was evaluated [178]. To this aim, in situ Secchi disk depth, being a water clarity measure, and further spectral measurements were used together with Landsat-OLI imagery. The results of this study indicated that water clarity of the Three Gorges reservoir and Dongting lake was mainly influenced by total suspended matter.
On the contrary, ∼70% of the reviewed studies dealt with an estimation of sediment concentration or organic matter (e.g., [180,181,182,183]). For example, Fassoni-Andrade and de Paiva [183] predicted surface suspended sediment concentration for the Central Amazon river basin, in particular for surface water of rivers and floodplain lakes. They were the first to use a 15 year long time-series of MODIS data to investigate spatial and temporal dynamics of sediment concentration for areas characterized by different water types in the Amazon river basin. Following this, Park and Latrubesse [184] analyzed suspended sediment concentration in the confluence of the Solimões–Amazon and Negro rivers, characterized by white and black water, respectively. For this purpose, the authors used a time-series of MODIS 8-day composites over a period of 14 years. With more detail, suspended sediment concentration and surface water types were modeled for the post-confluence area for three selected years under average, drought, and flood hydrological condition. The authors concluded that surface water mixing patterns along the main channel mainly depend on the hydrological season. Furthermore, several studies investigated water quality impacted by urban areas and mining activities (e.g., [21,185,186]). Lobo et al. [21], for example, analyzed water turbidity in a subbasin of the Amazon river basin for the period between 1973 and 2013 using Landsat-MSS/-TM/-OLI imagery. They estimated suspended sediment concentration and evaluated the results in the context of gold mining activities. The results demonstrated that during high water level, sediment concentration is low. In comparison, during low water level periods, mining activities intensified, and sediment concentration increased. Moreover, Zhu et al. [32] used EO-1 Hyperion imagery to estimate colored dissolved organic matter for 10 major rivers around the globe. For this purpose, the authors used an algorithm, tailored to water conditions in coastal regions. In addition, dissolved organic matter is estimated for 6 Arctic river basins using Landsat imagery over a period of 14 years [31]. Here, a regression-based method is used to derive organic matter using field samples along with Landsat imagery. The correlation coefficient between estimated and measured dissolved organic matter accounted for 0.67 to 0.84 for most of the study areas.
3.7.8. Hydrosphere: River Water Level
Measurements of river water level are important for quantification of water storage and assessment of risks related to droughts and floods [187]. Here, EO-based monitoring of water level provides consistent measurements of remote and large river basins. These measurements are performed by spaceborne altimetry at satellite ground track, also called virtual gauge stations. Since satellite altimeters illuminate footprints at a certain diameter, land and water signals are mixed. Thus, EO-based water level measurements of small water bodies or rivers are challenging [188,189].
In the context studies related to river water level, most investigations are conducted for the Amazon (e.g., [190,191,192]), Brahmaputra (e.g., [193,194]), Congo (e.g., [195,196]), Ganges (e.g., [197,198]), and Mekong river basin (e.g., [199,200]). Among these, ∼33% of the studies retrieved river water level for virtual stations distributed over the entire river basins and the remaining studies for virtual stations at regional and subbasin scale only. For example, da Silva et al. [191] used ERS-RA and ENVISAT-RA2 altimeter data to predict river water level at 45 virtual stations. The authors performed an internal and external validation using crossovers of altimeter tracks and gauge measurements, respectively. The results of the validation indicate high variations for the root mean square difference, in particular between 12 cm and several meters. Moreover, Huang et al. [194] developed a novel waveform retracking algorithm called “threshold and Ice-1 combination” for river water level retrieval. This algorithm was particularly proposed for high mountainous areas and tested for the Upper Brahmaputra river basin. The results demonstrate that the suggested algorithm derives more accurate estimations of water level than other retracking algorithms. In a further study, Villadsen et al. [201] used CryoSat-2 altimeter data for river water level estimation over the Ganges and Brahmaputra and evaluated their results with water levels retrieved from ENVISAT-RA2 measurements. CryoSat-2 altimeter data are characterized by a smaller along track footprint enabling measurements of smaller water bodies. The resulting time-series were compared on annual basis and indicated comparable water levels with a reported mean difference of 10 cm for all virtual stations. Similarly, CryoSat-2 SAR altimeter data are used to retrieve water levels over the Mekong river basin [202]. For validation, ENVISAT-RA2-based water level estimations and gauge measurements were used. Here, the authors obtained a median difference of 0.76 m. Next, Liu et al. [203] performed an integrated analysis using altimeter data from the ENVISAT-RA2 and Poseidon-3 instrument on-board JASON-2 as well as Landsat imagery and TRMM-based precipitation data to quantify downstream water level changes induced by dam constructions at the Mekong river. According to their findings, the water level decreased and increased in wet and dry season, respectively. Furthermore, Pham et al. [200] for the first time used MODIS-based land surface temperature together with JASON-2 altimetry data and in situ water level measurements to estimate daily water level at virtual stations along the Mekong river. In this study, seasonal linear regression models were used to predict water levels. The results indicated that the river water level estimations were best for cold/dry and hot/dry seasons.
3.7.9. Hydrosphere: River Discharge
Considering the forecasting of extreme events such as floods, river discharge is an essential parameter to study. Traditionally it is measured at in situ gauge stations; however, these networks are scarce in many regions. Accordingly, estimation of river discharge is possible using indirect EO-based approaches [204]. Regarding river basins, studies are performed the Amazon [205,206], Brahmaputra [207,208], Congo [209], Mekong (e.g., [210,211]), and Yangtze river (e.g., [212]). Here, common methods to retrieve river discharge are rating curves (e.g., [213]) or the Manning’s equation (e.g., [214]). In this context, Paris et al. [205] formulated rating curves based on river water level derived from altimeter data over the entire Amazon river basin for around 1000 virtual stations. Corresponding discharge simulations are predicted by a rainfall–runoff model. A comparison of the predicted discharge with in situ observations resulted in a Nash–Sutcliffe efficiency of 0.71. Moreover, Dubey et al. [207] retrieved water level based on TOPEX-Poseidon and ENVISAT-RA2 data for 6 virtual stations along the Brahmaputra river between the years 2002 and 2010. The rating curves were developed based on estimated water level and in situ discharge observations. This relationship was then used to predict discharge at virtual stations. The resulting discharge estimations indicated high correlations with observed discharge. In addition, Kouraev et al. [215] applied rating curves as well. Here, the authors retrieved TOPEX-Poseidon-based water level for the Ob river and related it to discharge observations at a gauge station. Observed and estimated river discharge indicated good agreement; however, due to the spatial resolution of TOPEX-Poseidon measurements, the proposed approach is only applicable to rivers with a width of several kilometers. Furthermore, Huang et al. [208] aimed at river discharge estimation in the Upper Brahmaputra river basin, which is characterized by high mountainous landscape. In this study, 3 algorithms were tested and compared. The first depended on water level, the second on river width, and the third on both variables. Water level was derived using satellite altimeter data and river width was estimated with multispectral and SAR imagery. Here, data processing and discharge estimation was performed on the GEE. The derived water surface extent was validated using high spatial resolution optical imagery. Discharge estimations were compared to observations obtained from gauge stations resulting in a Nash–Sutcliffe efficiency between 0.68 and 0.98. In a further study, Manning’s equation was used to estimate river discharge at 2 virtual stations of the Yangtze river [212]. Here, the hydraulic parameters river width, water level and velocity were derived using remote sensing data only. Specifically, ENVISAT-RA2 was used for water level and MODIS for river width estimations. Given that, velocity was retrieved using time lag analysis of temporal river width observations. The Nash–Sutcliffe efficiency value was 0.5 and 0.76 for the two virtual stations.
3.7.10. Cryosphere
The cryosphere, including snow- and ice-covered areas, permafrost, river and lake ice, is mostly an elementary component of river basins, particularly in high-mountain source or Arctic regions. Monitoring dynamics of the cryosphere is important to quantify resulting impacts on downstream or surrounding areas. Due to the limited number of studies in this category, we reviewed all related research foci in one section. With more detail, ∼8% of all studies investigated research questions in the context of the cryosphere, out of which ∼14% at basin wide scale. Among all studies, ∼54% dealt with snow and ice cover (e.g., [216,217,218,219,220]). Chao et al. [216], for instance, employed altimeter data from GLAS-ICESat to analyze glacier elevation change in the source region of the Yangtze river basin. In fact, they identified a shrinking of the glacier between 2000 and 2009. In comparison, Wang et al. [217] quantified glacier retreat in the source region of the Yangtze river using two Landsat images from 1992 and 2009. Additionally, the authors analyzed dynamics of glacial runoff using in situ discharge data from 1957 to 2009. The results indicated an accelerated glacier melting and a loss in glacier area of around 45 km2. In another study, snow cover variability was evaluated for the same study area using MODIS-based snow cover products between 2000 and 2012 [218]. The analysis showed an increase in snow cover extent, whereas long-term analysis of temperature between 1960 and 2012 indicated an earlier start time and a later end of snow melting. Moreover, we identified several studies that dealt with lake and river ice characterization. These studies were conducted for the Arctic river basins Mackenzie, Lena, Yenisei, and Ob [221,222,223,224,225]. In particular, river ice breakup dates for these four Arctic rivers were successfully classified using NOAA-AVHRR and MODIS imagery for a period of 10 years [221]. Furthermore, Sakai et al. [223] quantified the applicability of Landsat-TM/-ETM images to monitor floods induced by river ice breakup. Here, the shortening of the Landsat revisit time to 2.6 days was of particular advantage due to the triple overlap of tiles in high latitudes. Instead, lake ice phenology was studied using TerraSAR-X time-series for a period of three years in the Lena river delta [224]. In addition, we found studies investigating permafrost in the Arctic river basins Lena, Yukon, and Kolyma [30,226,227,228,229]. Soil erosion in permafrost riverbanks was analyzed for a regional study area in the Lena river delta using TerraSAR-X time-series [227]. In particular, the authors classified changing cliff-top line during summer months between 2013 and 2015. In comparison, Whitley et al. [229] evaluated the advantages of LIDAR and IKONOS data to classify permafrost distribution at a subset of the Yukon river delta. Here, best overall accuracies were obtained for estimations based on LIDAR only.
4. Discussion
4.1. Requirement of Higher Spatial Coverage
This review revealed that the analysis of major river basins is mostly limited to regional or subbasin scale study areas (see Section 3.5). In this regard, the spatial coverage of the study areas was mostly defined by national boundaries, instead of the functional unit of a river basin. In fact, this circumstance obviously hampered the analysis of transboundary river basins and is most likely caused by factors, such as research funding or motivation i.e., as indicated by the relation between institutional affiliation of the first authors (Figure 4) and their investigated study areas (Figure 3b and Supplement Table S1). Due to the availability of mostly regional or subbasin scale studies, it is difficult to compare or assess land surface changes within or between major river basins. In this context, we found that basin wide studies are overall lacking for all regarded research foci. Indeed, there are no basin wide studies for 12 of the regarded major river basins (see Figure 10). Furthermore, our review also demonstrates that comparisons between major river basins are mostly avoided. Specifically, we only identified a small number of studies investigating multiple river basin at once (e.g., [40,179]). However, more studies and remote sensing products at higher spatial coverage, most preferably at basin wide scale, are needed for consistent and homogenous spatial analyses. Considering the identified research foci, we particularly found that elements of the cryosphere remain understudied as demonstrated in Figure 5. Here, higher spatial coverage analyses are necessary for Arctic river basins, which are particularly vulnerable to accelerating climate change.
4.2. Requirement of Comparability between Major River Basins
During the last decade, many global remote sensing products outlining land surface and surface water parameters became available (Table 3). These data are essential for a variety of applications including hydrological, climate, and environmental change modeling. In this context, several data portals, such as the UNEP-TWAP or WRI platform, are available. However, these are mostly not up to date and focus on selected indicators only. Hence, databases gathering relevant state-of-the-art geospatial data with respect to river basin characterization are still lacking. To enable a consistent and detailed analysis of major river basins, a database on global open geodata, including available and relevant EO products is needed. However, we must note that already existing global land cover products are probably not applicable for change analyses at regional scale, since their spatial resolution is too coarse [230]. Thus, basin wide monitoring of land surface dynamics at medium to high spatial resolution is necessary to provide valuable baseline information, e.g., on land cover and land use to support researchers, stake-holders, and decision-makers with respect to river basin and water resource management.
4.3. Potential of EO for Major River Basins
Monitoring large-scale river basins, where land surface and surface water are highly variable in space and time, is possible using EO data. Here, the increasing amount of free and open remote sensing imagery as well as improving processing and technological capacities support EO applications for large river basins. In this context, it is noteworthy that characterization of land surface and surface water dynamics using open satellite image time-series at medium to high spatial resolution is only possible since the last decade. Notable missions in this context are the USGS Landsat, European Copernicus Sentinel-1/-2, and several altimetry instruments. According to the increasing abundance of satellite missions and open archives, we detected a considerable increase in intra-/inter-annual change analyses and time-series applications since 2008 (see Figure 9a,b). Additionally, as visualized in Figure 9c, we identified an increase in the length of study periods since 2008. At the same time, our review revealed that these open long-term archives are exploited insufficiently when it comes to basin wide analyses of land surface and surface water parameters. This might be due to mass amounts of EO data that need to be processed for basin wide analyses. In fact, it needs to be considered that the technological infrastructure, such as data storage and computing capabilities, might still pose a major challenge for these amounts of data. However, in times of cloud computing, it is possible to partially leave these limitations behind. In the context of large river basins, applications exploiting the potential of EO data and products (Table 3) are lacking and need to be studied by processing and analyzing long-term archives for environmental change monitoring.
5. Conclusions
This review provides an extensive overview of EO related research articles with respect to selected major river basins. In particular, we reviewed studies on land surface and surface water parameters with specific emphasis on their (1) spatial distribution, (2) employed sensor types, (3) temporal resolution, (4) spatial scale and (5) presented relevant global remote sensing products. Corresponding to the results of this review, the main findings of this study are summarized considering the research questions defined in Section 1.3:
- During literature review, we identified 287 research articles and defined three main research categories, in particular biosphere, hydrosphere, and cryosphere as well as more detailed sub-categories. In summary, ∼53% of all studies focused on research foci related to the biosphere, ∼39% on the hydrosphere, and ∼8% on the cryosphere. With more detail, the reviewed studies most frequently investigated research foci related to vegetation (∼21%), surface water (∼18%), and land cover and land use (∼17%).
- Throughout all research categories, optical EO data were most frequently used. Here, ∼61% of all studies solely used optical imagery and ∼17% combined optical with other sensor types. In detail, Landsat sensors were mostly employed, specifically in ∼43% of all studies. Following optical sensors, SAR (∼13%) and satellite altimeters (∼6%) were the second and third most used sensor type, respectively.
- Considering the spatial scale of the reviewed research articles, we found that studies at basin scale were performed in ∼14% of all studies only. Most of these studies were available for the Amazon river basin. Following this, studies at subbasin and regional scale accounted for ∼37% and ∼49%, respectively. In addition, our review revealed that transboundary river basins remain understudied. In particular, ∼67% of studies analyzing transboundary river basins focused on one of the riparian countries only. We also identified a strong relation between investigated study area and the institutional affiliation of the first authors. Moreover, the number of studies incorporating multiple major river basins into their analyses was low (∼6%).
- Regarding the large scales of major river basins, the availability of accurate and consistent reference data is a major limitation. These are crucial in terms of model training and validation. Furthermore, sensor specific limitations exist with respect to e.g., water level estimation for small water bodies or cloud obstruction for optical sensors. However, we expect an increasing number of studies exploiting data of the current Sentinel-1/-2 and Landsat missions and providing EO products at even higher spatial coverage and resolution in the coming years. In addition, upcoming missions, such as SWOT and P-band Biomass, will enable monitoring e.g., of smaller water bodies and certainly boost applications related to river water level and river discharge modeling as well as improve quantification of wetland areas and inundated forest areas, respectively.
In conclusion, our review for the first time provides a detailed overview of available EO related studies and products analyzing land surface and surface water variables over large river basins. Furthermore, we emphasize the importance and need for a database enabling the joint exploitation of EO data and products to improve environmental change monitoring in the context of river basins. Overall, this review greatly contributes to a better understanding of the potentials and limitations of EO-based major river basin analyses.
Supplementary Materials
The following are available online at https://zenodo.org/record/3531949, Table S1: References used for systematic review.
Author Contributions
Conceptualization, S.U. and C.K.; writing—original draft preparation, S.U.; writing—review and editing, S.U. and C.K.; visualization, S.U.; supervision, C.K.
Funding
This research received no external funding.
Conflicts of Interest
The authors declare no conflict of interest.
References
- Kummu, M.; de Moel, H.; Ward, P.J.; Varis, O. How close do we live to water? A global analysis of population distance to freshwater bodies. PLoS ONE 2011, 6, e20578. [Google Scholar] [CrossRef] [PubMed]
- Best, J. Anthropogenic stresses on the world’s big rivers. Nat. Geosci. 2018, 12, 7–21. [Google Scholar] [CrossRef]
- Gleick, P.H. Water, Drought, Climate Change, and Conflict in Syria. Weather. Clim. Soc. 2014, 6, 331–340. [Google Scholar] [CrossRef]
- Hecht, J.S.; Lacombe, G.; Arias, M.E.; Dang, T.D.; Piman, T. Hydropower dams of the Mekong River basin: A review of their hydrological impacts. J. Hydrol. 2019, 568, 285–300. [Google Scholar] [CrossRef]
- Anthony, E.J.; Brunier, G.; Besset, M.; Goichot, M.; Dussouillez, P.; Nguyen, V.L. Linking rapid erosion of the Mekong River delta to human activities. Sci. Rep. 2015, 5, 14745. [Google Scholar] [CrossRef]
- Grill, G.; Lehner, B.; Thieme, M.; Geenen, B.; Tickner, D.; Antonelli, F.; Babu, S.; Borrelli, P.; Cheng, L.; Crochetiere, H.; et al. Mapping the world’s free-flowing rivers. Nature 2019, 569, 215–221. [Google Scholar] [CrossRef]
- Vörösmarty, C.J.; McIntyre, P.B.; Gessner, M.O.; Dudgeon, D.; Prusevich, A.; Green, P.; Glidden, S.; Bunn, S.E.; Sullivan, C.A.; Liermann, C.R.; et al. Global threats to human water security and river biodiversity. Nature 2010, 467, 555. [Google Scholar] [CrossRef]
- Haddeland, I.; Heinke, J.; Biemans, H.; Eisner, S.; Flörke, M.; Hanasaki, N.; Konzmann, M.; Ludwig, F.; Masaki, Y.; Schewe, J.; et al. Global water resources affected by human interventions and climate change. Proc. Natl. Acad. Sci. USA 2014, 111, 3251. [Google Scholar] [CrossRef]
- Vanham, D.; Hoekstra, A.Y.; Wada, Y.; Bouraoui, F.; de Roo, A.; Mekonnen, M.M.; van de Bund, W.J.; Batelaan, O.; Pavelic, P.; Bastiaanssen, W.G.M.; et al. Physical water scarcity metrics for monitoring progress towards SDG target 6.4: An evaluation of indicator 6.4.2 “Level of water stress”. Sci. Total Environ. 2018, 613–614, 218–232. [Google Scholar] [CrossRef]
- Mekonnen, M.M.; Hoekstra, A.Y. Four billion people facing severe water scarcity. Sci. Adv. 2016, 2, e1500323. [Google Scholar] [CrossRef]
- Sheffield, J.; Wood, E.F.; Pan, M.; Beck, H.; Coccia, G.; Serrat-Capdevila, A.; Verbist, K. Satellite Remote Sensing for Water Resources Management: Potential for Supporting Sustainable Development in Data-Poor Regions. Water Resour. Res. 2018, 54, 9724–9758. [Google Scholar] [CrossRef]
- De Stefano, L.; Petersen-Perlman, J.D.; Sproles, E.A.; Eynard, J.; Wolf, A.T. Assessment of transboundary river basins for potential hydro-political tensions. Glob. Environ. Chang. 2017, 45, 35–46. [Google Scholar] [CrossRef]
- Lehner, B.; Verdin, K.; Jarvis, A. New global hydrography derived from spaceborne elevation data. Eos Trans. Am. Geophys. Union 2008, 89, 93–94. [Google Scholar] [CrossRef]
- Alsdorf, D.E.; Rodríguez, E.; Lettenmaier, D.P. Measuring surface water from space. Rev. Geophys. 2007, 45. [Google Scholar] [CrossRef]
- Broich, M.; Tulbure, M.G.; Verbesselt, J.; Xin, Q.C.; Wearne, J. Quantifying Australia’s dryland vegetation response to flooding and drought at sub-continental scale. Remote Sens. Environ. 2018, 212, 60–78. [Google Scholar] [CrossRef]
- Wohlfart, C.; Liu, G.H.; Huang, C.; Kuenzer, C. A River Basin over the Course of Time: Multi-Temporal Analyses of Land Surface Dynamics in the Yellow River Basin (China) Based on Medium Resolution Remote Sensing Data. Remote Sens. 2016, 8, 186. [Google Scholar] [CrossRef]
- GRDC. Major River Basins of the World; The Global Runoff Data Centre: Koblenz, Germany, 2019. [Google Scholar]
- Center for International Earth Science Information Network, CIESIN, Columbia University. 2018. Gridded Population of the World, Version 4 (GPWv4): Population Count, Revision 11. Available online: https://sedac.ciesin.columbia.edu/data/collection/gpw-v4 (accessed on 1 October 2019).
- Plummer, S.; Lecomte, P.; Doherty, M. The ESA Climate Change Initiative (CCI): A European contribution to the generation of the Global Climate Observing System. Remote Sens. Environ. 2017, 203, 2–8. [Google Scholar] [CrossRef]
- Nyland, K.E.; Gunn, G.E.; Shiklomanov, N.I.; Engstrom, R.N.; Streletskiy, D.A. Land Cover Change in the Lower Yenisei River Using Dense Stacking of Landsat Imagery in Google Earth Engine. Remote Sens. 2018, 10, 1226. [Google Scholar] [CrossRef]
- Lobo, F.L.; Costa, M.P.F.; Novo, E. Time-series analysis of Landsat-MSS/TM/OLI images over Amazonian waters impacted by gold mining activities. Remote Sens. Environ. 2015, 157, 170–184. [Google Scholar] [CrossRef]
- Sakamoto, T.; Van Nguyen, N.; Ohno, H.; Ishitsuka, N.; Yokozawa, M. Spatio-temporal distribution of rice phenology and cropping systems in the Mekong Delta with special reference to the seasonal water flow of the Mekong and Bassac rivers. Remote Sens. Environ. 2006, 100, 1–16. [Google Scholar] [CrossRef]
- Huang, C.; Chen, Y.; Wu, J.P. Mapping spatio-temporal flood inundation dynamics at large river basin scale using time-series flow data and MODIS imagery. Int. J. Appl. Earth Obs. Geoinf. 2014, 26, 350–362. [Google Scholar] [CrossRef]
- De Grandi, G.F.; Mayaux, P.; Malingreau, J.P.; Rosenqvist, A.; Saatchi, S.; Simard, M. New perspectives on global ecosystems from wide-area radar mosaics: flooded forest mapping in the tropics. Int. J. Remote Sens. 2000, 21, 1235–1249. [Google Scholar] [CrossRef]
- Cao, N.; Lee, H.; Jung, H.C.; Yu, H.W. Estimation of Water Level Changes of Large-Scale Amazon Wetlands Using ALOS2 ScanSAR Differential Interferometry. Remote Sens. 2018, 10, 966. [Google Scholar] [CrossRef]
- Tomsett, C.; Leyland, J. Remote sensing of river corridors: A review of current trends and future directions. River Res. Appl. 2019, 35, 779–803. [Google Scholar] [CrossRef]
- Grimaldi, S.; Li, Y.; Pauwels, V.R.N.; Walker, J.P. Remote Sensing-Derived Water Extent and Level to Constrain Hydraulic Flood Forecasting Models: Opportunities and Challenges. Surv. Geophys. 2016, 37, 977–1034. [Google Scholar] [CrossRef]
- Xu, X.; Li, J.; Tolson, B.A. Progress in integrating remote sensing data and hydrologic modeling. Prog. Phys. Geogr. Earth Environ. 2014, 38, 464–498. [Google Scholar] [CrossRef]
- Tang, Q.; Gao, H.; Lu, H.; Lettenmaier, D.P. Remote sensing: Hydrology. Prog. Phys. Geogr. Earth Environ. 2009, 33, 490–509. [Google Scholar] [CrossRef]
- Nitze, I.; Grosse, G.; Jones, B.M.; Arp, C.D.; Ulrich, M.; Fedorov, A.; Veremeeva, A. Landsat-Based Trend Analysis of Lake Dynamics across Northern Permafrost Regions. Remote Sens. 2017, 9, 640. [Google Scholar] [CrossRef]
- Griffin, C.G.; McClelland, J.W.; Frey, K.E.; Fiske, G.; Holmes, R.M. Quantifying CDOM and DOC in major Arctic rivers during ice-free conditions using Landsat TM and ETM+ data. Remote Sens. Environ. 2018, 209, 395–409. [Google Scholar] [CrossRef]
- Zhu, W.N.; Tian, Y.Q.; Yu, Q.; Becker, B.L. Using Hyperion imagery to monitor the spatial and temporal distribution of colored dissolved organic matter in estuarine and coastal regions. Remote Sens. Environ. 2013, 134, 342–354. [Google Scholar] [CrossRef]
- Troitskaya, Y.; Rybushkina, G.; Soustova, I.; Lebedev, S. Adaptive Retracking of Jason-1, 2 Satellite Altimetry Data for the Volga River Reservoirs. IEEE J. Sel. Top. Appl. Earth Obs. Remote Sens. 2014, 7, 1603–1608. [Google Scholar] [CrossRef]
- Arvor, D.; Daher, F.R.G.; Briand, D.; Dufour, S.; Rollet, A.J.; Simoes, M.; Ferraz, R.P.D. Monitoring thirty years of small water reservoirs proliferation in the southern Brazilian Amazon with Landsat time series. ISPRS J. Photogramm. Remote Sens. 2018, 145, 225–237. [Google Scholar] [CrossRef]
- Costa, M.P.F.; Niemann, O.; Novo, E.; Ahern, F. Biophysical properties and mapping of aquatic vegetation during the hydrological cycle of the Amazon floodplain using JERS-1 and Radarsat. Int. J. Remote Sens. 2002, 23, 1401–1426. [Google Scholar] [CrossRef]
- Pereira, V.F.G.; Congalton, R.G.; Zarin, D.J. Spatial and temporal analysis of a tidal floodplain landscape—Arnapi, Brazil—Using geographic information systems and remote sensing. Photogramm. Eng. Remote Sens. 2002, 68, 463–472. [Google Scholar]
- Furtado, L.F.D.; Silva, T.S.F.; Novo, E. Dual-season and full-polarimetric C band SAR assessment for vegetation mapping in the Amazon varzea wetlands. Remote Sens. Environ. 2016, 174, 212–222. [Google Scholar] [CrossRef]
- Wang, F.; Wang, Z.M.; Yang, H.B.; Zhao, Y.; Li, Z.H.; Wu, J.P. Capability of Remotely Sensed Drought Indices for Representing the Spatio-Temporal Variations of the Meteorological Droughts in the Yellow River Basin. Remote Sens. 2018, 10, 1834. [Google Scholar] [CrossRef]
- Ge, J.; Meng, B.P.; Liang, T.G.; Feng, Q.S.; Gao, J.L.; Yang, S.X.; Huang, X.D.; Xie, H.J. Modeling alpine grassland cover based on MODIS data and support vector machine regression in the headwater region of the Huanghe River, China. Remote Sens. Environ. 2018, 218, 162–173. [Google Scholar] [CrossRef]
- Du, J.Y.; Kimball, J.S.; Jones, L.A.; Watts, J.D. Implementation of satellite based fractional water cover indices in the pan-Arctic region using AMSR-E and MODIS. Remote Sens. Environ. 2016, 184, 469–481. [Google Scholar] [CrossRef]
- Kuenzer, C.; Klein, I.; Ullmann, T.; Georgiou, E.F.; Baumhauer, R.; Dech, S. Remote Sensing of River Delta Inundation: Exploiting the Potential of Coarse Spatial Resolution, Temporally-Dense MODIS Time Series. Remote Sens. 2015, 7, 8516–8542. [Google Scholar] [CrossRef]
- Thenkabail, P.S.; Schull, M.; Turral, H. Ganges and Indus river basin land use/land cover (LULC) and irrigated area mapping using continuous streams of MODIS data. Remote Sens. Environ. 2005, 95, 317–341. [Google Scholar] [CrossRef]
- Matthews, E. Global vegetation and land use: New high-resolution data bases for climate studies. J. Clim. Appl. Meteorol. 1983, 22, 474–487. [Google Scholar] [CrossRef]
- Loveland, T.R.; Reed, B.C.; Brown, J.F.; Ohlen, D.O.; Zhu, Z.; Yang, L.; Merchant, J.W. Development of a global land cover characteristics database and IGBP DISCover from 1 km AVHRR data. Int. J. Remote Sens. 2000, 21, 1303–1330. [Google Scholar] [CrossRef]
- Wang, C.; Jia, M.M.; Chen, N.C.; Wang, W. Long-Term Surface Water Dynamics Analysis Based on Landsat Imagery and the Google Earth Engine Platform: A Case Study in the Middle Yangtze River Basin. Remote Sens. 2018, 10, 1635. [Google Scholar] [CrossRef]
- Frolking, S.; Milliman, T.; Palace, M.; Wisser, D.; Lammers, R.; Fahnestock, M. Tropical forest backscatter anomaly evident in Sea Winds scatterometer morning overpass data during 2005 drought in Amazonia. Remote Sens. Environ. 2011, 115, 897–907. [Google Scholar] [CrossRef]
- Yuan, T.; Lee, H.; Jung, H.C. Toward Estimating Wetland Water Level Changes Based on Hydrological Sensitivity Analysis of PALSAR Backscattering Coefficients over Different Vegetation Fields. Remote Sens. 2015, 7, 3153–3183. [Google Scholar] [CrossRef]
- Bartholomé, E.; Belward, A.S. GLC2000: A new approach to global land cover mapping from Earth observation data. Int. J. Remote Sens. 2005, 26, 1959–1977. [Google Scholar] [CrossRef]
- Friedl, M.A.; McIver, D.K.; Hodges, J.C.; Zhang, X.Y.; Muchoney, D.; Strahler, A.H.; Woodcock, C.E.; Gopal, S.; Schneider, A.; Cooper, A. Global land cover mapping from MODIS: Algorithms and early results. Remote Sens. Environ. 2002, 83, 287–302. [Google Scholar] [CrossRef]
- Arino, O.; Gross, D.; Ranera, F.; Leroy, M.; Bicheron, P.; Brockman, C.; Defourny, P.; Vancutsem, C.; Achard, F.; Durieux, L.; et al. GlobCover: ESA service for global land cover from MERIS. In Proceedings of the 2007 IEEE International Geoscience and Remote Sensing Symposium, Barcelona, Spain, 23–28 July 2007; pp. 2412–2415. [Google Scholar] [CrossRef]
- Jun, C.; Ban, Y.; Li, S. Open access to Earth land-cover map. Nature 2014, 514, 434. [Google Scholar] [CrossRef]
- Pittman, K.; Hansen, M.C.; Becker-Reshef, I.; Potapov, P.V.; Justice, C.O. Estimating global cropland extent with multi-year MODIS data. Remote Sens. 2010, 2, 1844–1863. [Google Scholar] [CrossRef]
- Döll, P.; Siebert, S. A digital global map of irrigated areas. ICID J. 2000, 49, 55–66. [Google Scholar]
- Hansen, M.C.; Potapov, P.V.; Moore, R.; Hancher, M.; Turubanova, S.A.; Tyukavina, A.; Thau, D.; Stehman, S.V.; Goetz, S.J.; Loveland, T.R.; et al. High-Resolution Global Maps of 21st-Century Forest Cover Change. Science 2013, 342, 850. [Google Scholar] [CrossRef] [PubMed]
- Justice, C.O.; Townshend, J.R.G.; Vermote, E.F.; Masuoka, E.; Wolfe, R.E.; Saleous, N.; Roy, D.P.; Morisette, J.T. An overview of MODIS Land data processing and product status. Remote Sens. Environ. 2002, 83, 3–15. [Google Scholar] [CrossRef]
- Verger, A.; Baret, F.; Weiss, M. Near Real-Time Vegetation Monitoring at Global Scale. IEEE J. Sel. Top. Appl. Earth Obs. Remote Sens. 2014, 7, 3473–3481. [Google Scholar] [CrossRef]
- Tansey, K.; Grégoire, J.M.; Defourny, P.; Leigh, R.; Pekel, J.F.; van Bogaert, E.; Bartholomé, E. A new, global, multi-annual (2000–2007) burnt area product at 1 km resolution. Geophys. Res. Lett. 2008, 35. [Google Scholar] [CrossRef]
- Pesaresi, M.; Huadong, G.; Blaes, X.; Ehrlich, D.; Ferri, S.; Gueguen, L.; Halkia, M.; Kauffmann, M.; Kemper, T.; Lu, L. A global human settlement layer from optical HR/VHR RS data: Concept and first results. IEEE J. Sel. Top. Appl. Earth Obs. Remote Sens. 2013, 6, 2102–2131. [Google Scholar] [CrossRef]
- Esch, T.; Marconcini, M.; Felbier, A.; Roth, A.; Heldens, W.; Huber, M.; Schwinger, M.; Taubenböck, H.; Müller, A.; Dech, S. Urban footprint processor—Fully automated processing chain generating settlement masks from global data of the TanDEM-X mission. IEEE Geosci. Remote Sens. Lett. 2013, 10, 1617–1621. [Google Scholar] [CrossRef]
- Marconcini, M.; Metz-Marconcini, A.; Üreyen, S.; Palacios-Lopez, D.; Hanke, W.; Bachofer, F.; Zeidler, J.; Esch, T.; Gorelick, N.; Kakarla, A. Outlining where humans live–The World Settlement Footprint 2015. arXiv 2019, arXiv:1910.12707. [Google Scholar]
- Giachetta, E.; Willett, S.D. A global dataset of river network geometry. Sci. Data 2018, 5, 180127. [Google Scholar] [CrossRef]
- Calmant, S.; da Silva, J.S.; Moreira, D.M.; Seyler, F.; Shum, C.K.; Crétaux, J.F.; Gabalda, G. Detection of Envisat RA2/ICE-1 retracked radar altimetry bias over the Amazon basin rivers using GPS. Adv. Space Res. 2013, 51, 1551–1564. [Google Scholar] [CrossRef]
- Crétaux, J.F.; Jelinski, W.; Calmant, S.; Kouraev, A.; Vuglinski, V.; Bergé-Nguyen, M.; Gennero, M.C.; Nino, F.; Abarca Del Rio, R.; Cazenave, A.; et al. SOLS: A lake database to monitor in the Near Real Time water level and storage variations from remote sensing data. Adv. Space Res. 2011, 47, 1497–1507. [Google Scholar] [CrossRef]
- Pekel, J.F.; Cottam, A.; Gorelick, N.; Belward, A.S. High-resolution mapping of global surface water and its long-term changes. Nature 2016, 540, 418. [Google Scholar] [CrossRef] [PubMed]
- Klein, I.; Gessner, U.; Dietz, A.J.; Kuenzer, C. Global WaterPack—A 250 m resolution dataset revealing the daily dynamics of global inland water bodies. Remote Sens. Environ. 2017, 198, 345–362. [Google Scholar] [CrossRef]
- Dietz, A.J.; Kuenzer, C.; Dech, S. Global SnowPack: A new set of snow cover parameters for studying status and dynamics of the planetary snow cover extent. Remote Sens. Lett. 2015, 6, 844–853. [Google Scholar] [CrossRef]
- Esch, T.; Üreyen, S.; Zeidler, J.; Metz–Marconcini, A.; Hirner, A.; Asamer, H.; Tum, M.; Böttcher, M.; Kuchar, S.; Svaton, V.; et al. Exploiting big earth data from space—First experiences with the timescan processing chain. Big Earth Data 2018, 2, 36–55. [Google Scholar] [CrossRef]
- Lehner, B.; Liermann, C.R.; Revenga, C.; Vörösmarty, C.; Fekete, B.; Crouzet, P.; Döll, P.; Endejan, M.; Frenken, K.; Magome, J.; et al. High-resolution mapping of the world’s reservoirs and dams for sustainable river-flow management. Front. Ecol. Environ. 2011, 9, 494–502. [Google Scholar] [CrossRef]
- OpenStreetMap Contributors. 2019. Available online: https://www.openstreetmap.org (accessed on 12 April 2019).
- Saatchi, S.S.; Nelson, B.; Podest, E.; Holt, J. Mapping land cover types in the Amazon Basin using 1 km JERS-1 mosaic. Int. J. Remote Sens. 2000, 21, 1201–1234. [Google Scholar] [CrossRef]
- Matsuoka, M.; Hayasaka, T.; Fukushima, Y.; Honda, Y. Land cover in East Asia classified using Terra MODIS and DMSP OLS products. Int. J. Remote Sens. 2007, 28, 221–248. [Google Scholar] [CrossRef]
- Wang, S.Y.; Ding, C.B.; Liu, J.S. Landscape evolution in the Yellow River Basin using satellite remote sensing and GIS during the past decade. Int. J. Remote Sens. 2009, 30, 5573–5591. [Google Scholar] [CrossRef]
- Leinenkugel, P.; Kuenzer, C.; Oppelt, N.; Dech, S. Characterisation of land surface phenology and land cover based on moderate resolution satellite data in cloud prone areas—A novel product for the Mekong Basin. Remote Sens. Environ. 2013, 136, 180–198. [Google Scholar] [CrossRef]
- Schneider, J.; Grosse, G.; Wagner, D. Land cover classification of tundra environments in the Arctic Lena Delta based on Landsat 7 ETM+ data and its application for upscaling of methane emissions. Remote Sens. Environ. 2009, 113, 380–391. [Google Scholar] [CrossRef]
- Ulrich, M.; Grosse, G.; Chabrillat, S.; Schirrmeister, L. Spectral characterization of periglacial surfaces and geomorphological units in the Arctic Lena Delta using field spectrometry and remote sensing. Remote Sens. Environ. 2009, 113, 1220–1235. [Google Scholar] [CrossRef]
- Ullmann, T.; Schmitt, A.; Roth, A.; Duffe, J.; Dech, S.; Hubberten, H.W.; Baumhauer, R. Land Cover Characterization and Classification of Arctic Tundra Environments by Means of Polarized Synthetic Aperture X- and C-Band Radar (PolSAR) and Landsat 8 Multispectral Imagery—Richards Island, Canada. Remote Sens. 2014, 6, 8565–8593. [Google Scholar] [CrossRef]
- Walker, W.S.; Stickler, C.M.; Kellndorfer, J.M.; Kirsch, K.M.; Nepstad, D.C. Large-Area Classification and Mapping of Forest and Land Cover in the Brazilian Amazon: A Comparative Analysis of ALOS/PALSAR and Landsat Data Sources. IEEE J. Sel. Top. Appl. Earth Obs. Remote Sens. 2010, 3, 594–604. [Google Scholar] [CrossRef]
- Liu, J.T.; Feng, Q.L.; Gong, J.H.; Zhou, J.P.; Li, Y. Land-cover classification of the Yellow River Delta wetland based on multiple end-member spectral mixture analysis and a Random Forest classifier. Int. J. Remote Sens. 2016, 37, 1845–1867. [Google Scholar] [CrossRef]
- Guan, X.D.; Liu, G.H.; Huang, C.; Liu, Q.S.; Wu, C.S.; Jin, Y.; Li, Y.F. An Object-Based Linear Weight Assignment Fusion Scheme to Improve Classification Accuracy Using Landsat and MODIS Data at the Decision Level. IEEE Trans. Geosci. Remote Sens. 2017, 55, 6989–7002. [Google Scholar] [CrossRef]
- Buono, A.; Nunziata, F.; Migliaccio, M.; Yang, X.; Li, X. Classification of the Yellow River delta area using fully polarimetric SAR measurements. Int. J. Remote Sens. 2017, 38, 6714–6734. [Google Scholar] [CrossRef]
- Zhang, J.X.; Liu, Z.J.; Sun, X.X. Changing landscape in the Three Gorges Reservoir Area of Yangtze River from 1977 to 2005: Land use/land cover, vegetation cover changes estimated using multi-source satellite data. Int. J. Appl. Earth Obs. Geoinf. 2009, 11, 403–412. [Google Scholar] [CrossRef]
- Chen, Z.H.; Wang, J.F. Land use and land cover change detection using satellite remote sensing techniques in the mountainous Three Gorges Area, China. Int. J. Remote Sens. 2010, 31, 1519–1542. [Google Scholar] [CrossRef]
- Zhao, Q.H.; Liu, S.L.; Deng, L.; Dong, S.K.; Wang, C.; Yang,, Z.F.; Yang, J.J. Landscape change and hydrologic alteration associated with dam construction. Int. J. Appl. Earth Obs. Geoinf. 2012, 16, 17–26. [Google Scholar] [CrossRef]
- Wang, L.J.; Wu, L.; Hou, X.Y.; Zheng, B.H.; Li, H.; Norra, S. Role of reservoir construction in regional land use change in Pengxi River basin upstream of the Three Gorges Reservoir in China. Environ. Earth Sci. 2016, 75, 15. [Google Scholar] [CrossRef]
- Feng, Y.Y.; Lu, D.S.; Moran, E.F.; Dutra, L.V.; Calvi, M.F.; de Oliveira, M.A.F. Examining Spatial Distribution and Dynamic Change of Urban Land Covers in the Brazilian Amazon Using Multitemporal Multisensor High Spatial Resolution Satellite Imagery. Remote Sens. 2017, 9, 381. [Google Scholar] [CrossRef]
- Dewidar, K.M. Detection of land use land cover changes for the northern part of the Nile delta (Burullus region), Egypt. Int. J. Remote Sens. 2004, 25, 4079–4089. [Google Scholar] [CrossRef]
- Abdulaziz, A.M.; Hurtado, J.M.; Al-Douri, R. Application of multitemporal Landsat data to monitor land cover changes in the Eastern Nile Delta region, Egypt. Int. J. Remote Sens. 2009, 30, 2977–2996. [Google Scholar] [CrossRef]
- Bakr, N.; Weindorf, D.C.; Bahnassy, M.H.; Marei, S.M.; El-Badawi, M.M. Monitoring land cover changes in a newly reclaimed area of Egypt using multi-temporal Landsat data. Appl. Geogr. 2010, 30, 592–605. [Google Scholar] [CrossRef]
- Abd El-Kawy, O.R.; Rød, J.K.; Ismail, H.A.; Suliman, A.S. Land use and land cover change detection in the western Nile delta of Egypt using remote sensing data. Appl. Geogr. 2011, 31, 483–494. [Google Scholar] [CrossRef]
- Faid, A.M.; Abdulaziz, A.M. Monitoring land-use change-associated land development using multitemporal Landsat data and geoinformatics in Kom Ombo area, South Egypt. Int. J. Remote Sens. 2012, 33, 7024–7046. [Google Scholar] [CrossRef]
- Ruelland, D.; Dezetter, A.; Puech, C.; Ardoin-Bardin, S. Long-term monitoring of land cover changes based on Landsat imagery to improve hydrological modelling in West Africa. Int. J. Remote Sens. 2008, 29, 3533–3551. [Google Scholar] [CrossRef]
- Ruelland, D.; Tribotte, A.; Puech, C.; Dieulin, C. Comparison of methods for LUCC monitoring over 50 years from aerial photographs and satellite images in a Sahelian catchment. Int. J. Remote Sens. 2011, 32, 1747–1777. [Google Scholar] [CrossRef]
- Kuenzer, C.; van Beijma, S.; Gessner, U.; Dech, S. Land surface dynamics and environmental challenges of the Niger Delta, Africa: Remote sensing-based analyses spanning three decades (1986-2013). Appl. Geogr. 2014, 53, 354–368. [Google Scholar] [CrossRef]
- Verhegghen, A.; Eva, H.; Ceccherini, G.; Achard, F.; Gond, V.; Gourlet-Fleury, S.; Cerutti, P.O. The Potential of Sentinel Satellites for Burnt Area Mapping and Monitoring in the Congo Basin Forests. Remote Sens. 2016, 8, 986. [Google Scholar] [CrossRef]
- Gaughan, A.E.; Binford, M.W.; Southworth, J. Tourism, forest conversion, and land transformations in the Angkor basin, Cambodia. Appl. Geogr. 2009, 29, 212–223. [Google Scholar] [CrossRef]
- Haas, J.; Ban, Y.F. Urban growth and environmental impacts in Jing-Jin-Ji, the Yangtze, River Delta and the Pearl River Delta. Int. J. Appl. Earth Obs. Geoinf. 2014, 30, 42–55. [Google Scholar] [CrossRef]
- Hu, G.Y.; Jin, H.J.; Dong, Z.B.; Lu, J.F.; Yan, C.Z. Driving forces of aeolian desertification in the source region of the Yellow River: 1975-2005. Environ. Earth Sci. 2013, 70, 3245–3254. [Google Scholar] [CrossRef]
- Ren, X.B.; Dong, Z.B.; Hu, G.Y.; Zhang, D.H.; Li, Q. A GIS-Based Assessment of Vulnerability to Aeolian Desertification in the Source Areas of the Yangtze and Yellow Rivers. Remote Sens. 2016, 8, 626. [Google Scholar] [CrossRef]
- Wohlfart, C.; Mack, B.; Liu, G.; Kuenzer, C. Multi-faceted land cover and land use change analyses in the Yellow River Basin based on dense Landsat time series: Exemplary analysis in mining, agriculture, forest, and urban areas. Appl. Geogr. 2017, 85, 73–88. [Google Scholar] [CrossRef]
- De Moura, Y.M.; Hilker, T.; Lyapustin, A.I.; Galva, L.S.; dos Santos, J.R.; Anderson, L.O.; de Sousa, C.H.R.; Arai, E. Seasonality and drought effects of Amazonian forests observed from multi-angle satellite data. Remote Sens. Environ. 2015, 171, 278–290. [Google Scholar] [CrossRef]
- Hilker, T.; Lyapustin, A.I.; Hall, F.G.; Myneni, R.; Knyazikhin, Y.; Wang, Y.J.; Tucker, C.J.; Sellers, P.J. On the measurability of change in Amazon vegetation from MODIS. Remote Sens. Environ. 2015, 166, 233–242. [Google Scholar] [CrossRef]
- Duveiller, G.; Defourny, P.; Desclee, B.; Mayaux, P. Deforestation in Central Africa: Estimates at regional, national and landscape levels by advanced processing of systematically-distributed Landsat extracts. Remote Sens. Environ. 2008, 112, 1969–1981. [Google Scholar] [CrossRef]
- Yan, D.; Zhang, X.Y.; Yu, Y.Y.; Guo, W. A Comparison of Tropical Rainforest Phenology Retrieved From Geostationary (SEVIRI) and Polar-Orbiting (MODIS) Sensors Across the Congo Basin. IEEE Trans. Geosci. Remote Sens. 2016, 54, 4867–4881. [Google Scholar] [CrossRef]
- Yan, D.; Zhang, X.Y.; Yu, Y.Y.; Guo, W. Characterizing Land Cover Impacts on the Responses of Land Surface Phenology to the Rainy Season in the Congo Basin. Remote Sens. 2017, 9, 461. [Google Scholar] [CrossRef]
- Podest, E.; Saatchi, S. Application of multiscale texture in classifying JERS-1 radar data over tropical vegetation. Int. J. Remote Sens. 2002, 23, 1487–1506. [Google Scholar] [CrossRef]
- Lu, D.S.; Moran, E.; Batistella, M. Linear mixture model applied to Amazonian vegetation classification. Remote Sens. Environ. 2003, 87, 456–469. [Google Scholar] [CrossRef]
- McCleary, A.L.; Crews-Meyer, K.A.; Young, K.R. Refining forest classifications in the western Amazon using an intra-annual multitemporal approach. Int. J. Remote Sens. 2008, 29, 991–1006. [Google Scholar] [CrossRef]
- Silva, T.S.F.; Costa, M.P.F.; Melack, J.M. Spatial and temporal variability of macrophyte cover and productivity in the eastern Amazon floodplain: A remote sensing approach. Remote Sens. Environ. 2010, 114, 1998–2010. [Google Scholar] [CrossRef]
- Sartori, L.R.; Imai, N.N.; Mura, J.C.; Novo, E.; Silva, T.S.F. Mapping Macrophyte Species in the Amazon Floodplain Wetlands Using Fully Polarimetric ALOS/PALSAR Data. IEEE Trans. Geosci. Remote Sens. 2011, 49, 4717–4728. [Google Scholar] [CrossRef]
- Tong, P.H.S.; Auda, Y.; Populus, J.; Aizpuru, M.; Al Habshi, A.; Blasco, F. Assessment from space of mangroves evolution in the Mekong Delta, in relation to extensive shrimp farming. Int. J. Remote Sens. 2004, 25, 4795–4812. [Google Scholar] [CrossRef]
- Vo, Q.T.; Oppelt, N.; Leinenkugel, P.; Kuenzer, C. Remote Sensing in Mapping Mangrove Ecosystems—An Object-Based Approach. Remote Sens. 2013, 5, 183–201. [Google Scholar] [CrossRef]
- Lagomasino, D.; Fatoyinbo, T.; Lee, S.; Feliciano, E.; Trettin, C.; Simard, M. A Comparison of Mangrove Canopy Height Using Multiple Independent Measurements from Land, Air, and Space. Remote Sens. 2016, 8, 327. [Google Scholar] [CrossRef]
- Reno, V.F.; Novo, E.; Suemitsu, C.; Renno, C.D.; Silva, T.S.F. Assessment of deforestation in the Lower Amazon floodplain using historical Landsat MSS/TM imagery. Remote Sens. Environ. 2011, 115, 3446–3456. [Google Scholar] [CrossRef]
- Souza, C.M.; Siqueira, J.V.; Sales, M.H.; Fonseca, A.V.; Ribeiro, J.G.; Numata, I.; Cochrane, M.A.; Barber, C.P.; Roberts, D.A.; Barlow, J. Ten-Year Landsat Classification of Deforestation and Forest Degradation in the Brazilian Amazon. Remote Sens. 2013, 5, 5493–5513. [Google Scholar] [CrossRef]
- Chen, G.; Powers, R.P.; de Carvalho, L.M.T.; Mora, B. Spatiotemporal patterns of tropical deforestation and forest degradation in response to the operation of the Tucuruí hydroelectricdam in the Amazon basin. Appl. Geogr. 2015, 63, 1–8. [Google Scholar] [CrossRef]
- Yoshikawa, S.; Sanga-Ngoie, K. Deforestation dynamics in Mato Grosso in the southern Brazilian Amazon using GIS and NOAA/AVHRR data. Int. J. Remote Sens. 2011, 32, 523–544. [Google Scholar] [CrossRef]
- Leinenkugel, P.; Wolters, M.L.; Oppelt, N.; Kuenzer, C. Tree cover and forest cover dynamics in the Mekong Basin from 2001 to 2011. Remote Sens. Environ. 2015, 158, 376–392. [Google Scholar] [CrossRef]
- Huang, S.L.; Jin, S.M.; Dahal, D.; Chen, X.X.; Young, C.; Liu, H.P.; Liu, S.G. Reconstructing satellite images to quantify spatially explicit land surface change caused by fires and succession: A demonstration in the Yukon River Basin of interior Alaska. ISPRS J. Photogramm. Remote Sens. 2013, 79, 94–105. [Google Scholar] [CrossRef]
- Tan, Z.X.; Liu, S.G.; Wylie, B.K.; Jenkerson, C.B.; Oeding, J.; Rover, J.; Young, C. MODIS-informed greenness responses to daytime land surface temperature fluctuations and wildfire disturbances in the Alaskan Yukon River Basin. Int. J. Remote Sens. 2013, 34, 2187–2199. [Google Scholar] [CrossRef]
- Liang, S.H.; Ge, S.M.; Wan, L.; Xu, D.W. Characteristics and causes of vegetation variation in the source regions of the Yellow River, China. Int. J. Remote Sens. 2012, 33, 1529–1542. [Google Scholar] [CrossRef]
- Liu, X.F.; Zhu, X.F.; Zhu, W.Q.; Pan, Y.Z.; Zhang, C.; Zhang, D.H. Changes in Spring Phenology in the Three-Rivers Headwater Region from 1999 to 2013. Remote Sens. 2014, 6, 9130–9144. [Google Scholar] [CrossRef]
- Campo-Bescos, M.A.; Munoz-Carpena, R.; Southworth, J.; Zhu, L.K.; Waylen, P.R.; Bunting, E. Combined Spatial and Temporal Effects of Environmental Controls on Long-Term Monthly NDVI in the Southern Africa Savanna. Remote Sens. 2013, 5, 6513–6538. [Google Scholar] [CrossRef]
- Shapiro, A.C.; Trettin, C.C.; Kuchly, H.; Alavinapanah, S.; Bandeira, S. The Mangroves of the Zambezi Delta: Increase in Extent Observed via Satellite from 1994 to 2013. Remote Sens. 2015, 7, 16504–16518. [Google Scholar] [CrossRef]
- Bunting, E.L.; Southworth, J.; Herrero, H.; Ryan, S.J.; Waylen, P. Understanding Long-Term Savanna Vegetation Persistence across Three Drainage Basins in Southern Africa. Remote Sens. 2018, 10, 1013. [Google Scholar] [CrossRef]
- Son, N.T.; Chen, C.F.; Chen, C.R.; Duc, H.N.; Chang, L.Y. A Phenology-Based Classification of Time-Series MODIS Data for Rice Crop Monitoring in Mekong Delta, Vietnam. Remote Sens. 2014, 6, 135–156. [Google Scholar] [CrossRef]
- Kontgis, C.; Schneider, A.; Ozdogan, M. Mapping rice paddy extent and intensification in the Vietnamese Mekong River Delta with dense time stacks of Landsat data. Remote Sens. Environ. 2015, 169, 255–269. [Google Scholar] [CrossRef]
- Nguyen, D.B.; Clauss, K.; Cao, S.M.; Naeimi, V.; Kuenzer, C.; Wagner, W. Mapping Rice Seasonality in the Mekong Delta with Multi-Year Envisat ASAR WSM Data. Remote Sens. 2015, 7, 15868–15893. [Google Scholar] [CrossRef]
- Clauss, K.; Ottinger, M.; Kuenzer, C. Mapping rice areas with Sentinel-1 time series and superpixel segmentation. Int. J. Remote Sens. 2018, 39, 1399–1420. [Google Scholar] [CrossRef]
- Clauss, K.; Ottinger, M.; Leinenkugel, P.; Kuenzer, C. Estimating rice production in the Mekong Delta, Vietnam, utilizing time series of Sentinel-1 SAR data. Int. J. Appl. Earth Obs. Geoinf. 2018, 73, 574–585. [Google Scholar] [CrossRef]
- Cardille, J.A.; Foley, J.A. Agricultural land-use change in Brazilian Amazonia between 1980 and 1995: Evidence from integrated satellite and census data. Remote Sens. Environ. 2003, 87, 551–562. [Google Scholar] [CrossRef]
- Xu, Y.D.; Yu, L.; Zhao, Y.Y.; Feng, D.L.; Cheng, Y.Q.; Cai, X.L.; Gong, P. Monitoring cropland changes along the Nile River in Egypt over past three decades (1984–2015) using remote sensing. Int. J. Remote Sens. 2017, 38, 4459–4480. [Google Scholar] [CrossRef]
- Shi, J.J.; Huang, J.F. Monitoring Spatio-Temporal Distribution of Rice Planting Area in the Yangtze River Delta Region Using MODIS Images. Remote Sens. 2015, 7, 8883–8905. [Google Scholar] [CrossRef]
- Du, H.Y.; Wang, D.D.; Wang, Y.Y.; Zhao, X.L.; Qin, F.; Jiang, H.; Cai, Y.L. Influences of land cover types, meteorological conditions, anthropogenic heat and urban area on surface urban heat island in the Yangtze River Delta Urban Agglomeration. Sci. Total Environ. 2016, 571, 461–470. [Google Scholar] [CrossRef]
- Zhou, D.C.; Bonafoni, S.; Zhang, L.X.; Wang, R.H. Remote sensing of the urban heat island effect in a highly populated urban agglomeration area in East China. Sci. Total Environ. 2018, 628–629, 415–429. [Google Scholar] [CrossRef]
- Yao, R.; Wang, L.C.; Gui, X.; Zheng, Y.K.; Zhang, H.M.; Huang, X. Urbanization Effects on Vegetation and Surface Urban Heat Islands in China’s Yangtze River Basin. Remote Sens. 2017, 9, 540. [Google Scholar] [CrossRef]
- Xiao, P.F.; Wang, X.H.; Feng, X.Z.; Zhang, X.L.; Yang, Y.K. Detecting China’s Urban Expansion Over the Past Three Decades Using Nighttime Light Data. IEEE J. Sel. Top. Appl. Earth Obs. Remote Sens. 2014, 7, 4095–4106. [Google Scholar] [CrossRef]
- Wang, Z.; Yang, S.; Wang, S.G.; Shen, Y. Monitoring evolving urban cluster systems using DMSP/OLS nighttime light data: A case study of the Yangtze River Delta region, China. J. Appl. Remote Sens. 2017, 11, 17. [Google Scholar] [CrossRef]
- Zou, Y.H.; Peng, H.Q.; Liu, G.; Yang, K.D.; Xie, Y.H.; Weng, Q.H. Monitoring Urban Clusters Expansion in the Middle Reaches of the Yangtze River, China, Using Time-Series Nighttime Light Images. Remote Sens. 2017, 9, 1007. [Google Scholar] [CrossRef]
- Liu, Y.; Zhang, X.; Kong, X.; Wang, R.; Chen, L. Identifying the relationship between urban land expansion and human activities in the Yangtze River Economic Belt, China. Appl. Geogr. 2018, 94, 163–177. [Google Scholar] [CrossRef]
- Shao, Z.F.; Liu, C. The Integrated Use of DMSP-OLS Nighttime Light and MODIS Data for Monitoring Large-Scale Impervious Surface Dynamics: A Case Study in the Yangtze River Delta. Remote Sens. 2014, 6, 9359–9378. [Google Scholar] [CrossRef]
- Zhuo, L.; Shi, Q.L.; Tao, H.Y.; Zheng, J.; Li, Q.P. An improved temporal mixture analysis unmixing method for estimating impervious surface area based on MODIS and DMSP-OLS data. ISPRS J. Photogramm. Remote Sens. 2018, 142, 64–77. [Google Scholar] [CrossRef]
- Liu, D.D.; Chen, N.C. Satellite Monitoring of Urban Land Change in the Middle Yangtze River Basin Urban Agglomeration, China between 2000 and 2016. Remote Sens. 2017, 9, 1086. [Google Scholar] [CrossRef]
- Leinenkugel, P.; Esch, T.; Kuenzer, C. Settlement detection and impervious surface estimation in the Mekong Delta using optical and SAR remote sensing data. Remote Sens. Environ. 2011, 115, 3007–3019. [Google Scholar] [CrossRef]
- Amer, R.; Kolker, A.S.; Muscietta, A. Propensity for erosion and deposition in a deltaic wetland complex: Implications for river management and coastal restoration. Remote Sens. Environ. 2017, 199, 39–50. [Google Scholar] [CrossRef]
- El-Asmar, H.M.; Hereher, M.E. Change detection of the coastal zone east of the Nile Delta using remote sensing. Environ. Earth Sci. 2011, 62, 769–777. [Google Scholar] [CrossRef]
- Hereher, M.E. Mapping coastal erosion at the Nile Delta western promontory using Landsat imagery. Environ. Earth Sci. 2011, 64, 1117–1125. [Google Scholar] [CrossRef]
- Li, X.; Zhou, Y.X.; Zhang, L.P.; Kuang, R.Y. Shoreline change of Chongming Dongtan and response to river sediment load: A remote sensing assessment. J. Hydrol. 2014, 511, 432–442. [Google Scholar] [CrossRef]
- Zhang, L.; Wu, B.F.; Yin, K.; Li, X.S.; Kia, K.; Zhu, L. Impacts of human activities on the evolution of estuarine wetland in the Yangtze Delta from 2000 to 2010. Environ. Earth Sci. 2015, 73, 435–447. [Google Scholar] [CrossRef]
- Qiao, G.; Mi, H.; Wang, W.A.; Tong, X.H.; Li, Z.B.; Li, T.; Liu, S.J.; Hong, Y. 55-year (1960–2015) spatiotemporal shoreline change analysis using historical DISP and Landsat time series data in Shanghai. Int. J. Appl. Earth Obs. Geoinf. 2018, 68, 238–251. [Google Scholar] [CrossRef]
- Liu, Y.X.; Huang, H.J.; Qiu, Z.F.; Fan, J.Y. Detecting coastline change from satellite images based on beach slope estimation in a tidal flat. Int. J. Appl. Earth Obs. Geoinf. 2013, 23, 165–176. [Google Scholar] [CrossRef]
- Kuenzer, C.; Ottinger, M.; Liu, G.; Sun, B.; Baumhauer, R.; Dech, S. Earth observation-based coastal zone monitoring of the Yellow River Delta: Dynamics in China’s second largest oil producing region over four decades. Appl. Geogr. 2014, 55, 92–107. [Google Scholar] [CrossRef]
- Kong, D.X.; Miao, C.Y.; Borthwick, A.G.L.; Duan, Q.Y.; Liu, H.; Sun, Q.H.; Ye, A.Z.; Di, Z.H.; Gong, W. Evolution of the Yellow River Delta and its relationship with runoff and sediment load from 1983 to 2011. J. Hydrol. 2015, 520, 157–167. [Google Scholar] [CrossRef]
- Arnesen, A.S.; Silva, T.S.F.; Hess, L.L.; Novo, E.; Rudorff, C.M.; Chapman, B.D.; McDonald, K.C. Monitoring flood extent in the lower Amazon River floodplain using ALOS/PALSAR ScanSAR images. Remote Sens. Environ. 2013, 130, 51–61. [Google Scholar] [CrossRef]
- Hamilton, S.K.; Sippel, S.J.; Melack, J.M. Seasonal inundation patterns in two large savanna floodplains of South America: The Llanos de Moxos (Bolivia) and the Llanos del Orinoco (Venezuela and Colombia). Hydrol. Process. 2004, 18, 2103–2116. [Google Scholar] [CrossRef]
- Chapman, B.; McDonald, K.; Shimada, M.; Rosenqvist, A.; Schroeder, R.; Hess, L. Mapping Regional Inundation with Spaceborne L-Band SAR. Remote Sens. 2015, 7, 5440–5470. [Google Scholar] [CrossRef]
- Rosenqvist, A.; Birkett, C.M. Evaluation of JERS-1 SAR mosaics for hydrological applications in the Congo river basin. Int. J. Remote Sens. 2002, 23, 1283–1302. [Google Scholar] [CrossRef]
- Khan, S.I.; Hong, Y.; Gourley, J.J.; Khattak, M.U.; De Groeve, T. Multi-Sensor Imaging and Space-Ground Cross-Validation for 2010 Flood along Indus River, Pakistan. Remote Sens. 2014, 6, 2393–2407. [Google Scholar] [CrossRef]
- Kwak, Y.; Park, J.; Fukami, K. Near Real-Time Flood Volume Estimation From MODIS Time-Series Imagery in the Indus River Basin. IEEE J. Sel. Top. Appl. Earth Obs. Remote Sens. 2014, 7, 578–586. [Google Scholar] [CrossRef]
- Donchyts, G.; Schellekens, J.; Winsemius, H.; Eisemann, E.; van de Giesen, N. A 30 m Resolution Surface Water Mask Including Estimation of Positional and Thematic Differences Using Landsat 8, SRTM and OpenStreetMap: A Case Study in the Murray-Darling Basin, Australia. Remote Sens. 2016, 8, 386. [Google Scholar] [CrossRef]
- Heimhuber, V.; Tulbure, M.G.; Broich, M. Modeling 25 years of spatio-temporal surface water and inundation dynamics on large river basin scale using time series of Earth observation data. Hydrol. Earth Syst. Sci. 2016, 20, 2227–2250. [Google Scholar] [CrossRef]
- Tulbure, M.G.; Broich, M.; Stehman, S.V.; Kommareddy, A. Surface water extent dynamics from three decades of seasonally continuous Landsat time series at subcontinental scale in a semi-arid region. Remote Sens. Environ. 2016, 178, 142–157. [Google Scholar] [CrossRef]
- Heimhuber, V.; Tulbure, M.G.; Broich, M. Modeling multidecadal surface water inundation dynamics and key drivers on large river basin scale using multiple time series of Earth-observation and river flow data. Water Resour. Res. 2017, 53, 1251–1269. [Google Scholar] [CrossRef]
- Rao, P.Z.; Jiang, W.G.; Hou, Y.K.; Chen, Z.; Jia, K. Dynamic Change Analysis of Surface Water in the Yangtze River Basin Based on MODIS Products. Remote Sens. 2018, 10, 1025. [Google Scholar] [CrossRef]
- Guerschman, J.P.; Warren, G.; Byrne, G.; Lymburner, L.; Mueller, N.; Van-Dijk, A. MODIS-Based Standing Water Detection for Flood and Large Reservoir Mapping: Algorithm Development and Applications for the Australian Continent; CSIRO: Canberra, Australia, 2011. [Google Scholar]
- Wilusz, D.C.; Zaitchik, B.F.; Anderson, M.C.; Hain, C.R.; Yilmaz, M.T.; Mladenova, I.E. Monthly flooded area classification using low resolution SAR imagery in the Sudd wetland from 2007 to 2011. Remote Sens. Environ. 2017, 194, 205–218. [Google Scholar] [CrossRef]
- Rosenqvist, A.; Forsberg, B.R.; Pimentel, T.; Rauste, Y.A.; Richey, J.E. The use of spaceborne radar data to model inundation patterns and trace gas emissions in the central Amazon floodplain. Int. J. Remote Sens. 2002, 23, 1303–1328. [Google Scholar] [CrossRef]
- Hess, L.L.; Melack, J.M.; Novo, E.; Barbosa, C.C.F.; Gastil, M. Dual-season mapping of wetland inundation and vegetation for the central Amazon basin. Remote Sens. Environ. 2003, 87, 404–428. [Google Scholar] [CrossRef]
- Sakamoto, T.; Van Nguyen, N.; Kotera, A.; Ohno, H.; Ishitsuka, N.; Yokozawa, M. Detecting temporal changes in the extent of annual flooding within the Cambodia and the Vietnamese Mekong Delta from MODIS time-series imagery. Remote Sens. Environ. 2007, 109, 295–313. [Google Scholar] [CrossRef]
- Gstaiger, V.; Huth, J.; Gebhardt, S.; Wehrmann, T.; Kuenzer, C. Multi-sensoral and automated derivation of inundated areas using TerraSAR-X and ENVISAT ASAR data. Int. J. Remote Sens. 2012, 33, 7291–7304. [Google Scholar] [CrossRef]
- Kuenzer, C.; Guo, H.D.; Huth, J.; Leinenkugel, P.; Li, X.W.; Dech, S. Flood Mapping and Flood Dynamics of the Mekong Delta: ENVISAT-ASAR-WSM Based Time Series Analyses. Remote Sens. 2013, 5, 687–715. [Google Scholar] [CrossRef]
- Du, Z.Q.; Bin, L.H.; Ling, F.; Li, W.B.; Tian, W.D.; Wang, H.L.; Gui, Y.M.; Sun, B.Y.; Zhang, X.M. Estimating surface water area changes using time-series Landsat data in the Qingjiang River Basin, China. J. Appl. Remote Sens. 2012, 6, 16. [Google Scholar] [CrossRef]
- Li, W.B.; Du, Z.Q.; Ling, F.; Zhou, D.B.; Wang, H.L.; Gui, Y.M.; Sun, B.Y.; Zhang, X.M. A Comparison of Land Surface Water Mapping Using the Normalized Difference Water Index from TM, ETM plus and ALI. Remote Sens. 2013, 5, 5530–5549. [Google Scholar] [CrossRef]
- Bourrel, L.; Phillips, L.; Moreau, S. The dynamics of floods in the Bolivian Amazon Basin. Hydrol. Process. 2009, 23, 3161–3167. [Google Scholar] [CrossRef]
- Cooley, S.W.; Smith, L.C.; Stepan, L.; Mascaro, J. Tracking Dynamic Northern Surface Water Changes with High-Frequency Planet CubeSat Imagery. Remote Sens. 2017, 9, 1306. [Google Scholar] [CrossRef]
- Montanher, O.C.; Novo, E.; Barbosa, C.C.F.; Renno, C.D.; Silva, T.S.F. Empirical models for estimating the suspended sediment concentration in Amazonian white water rivers using Landsat 5/TM. Int. J. Appl. Earth Obs. Geoinf. 2014, 29, 67–77. [Google Scholar] [CrossRef]
- Massicotte, P.; Gratton, D.; Frenette, J.J.; Assani, A.A. Spatial and temporal evolution of the St. Lawrence River spectral profile: A 25-year case study using Landsat 5 and 7 imagery. Remote Sens. Environ. 2013, 136, 433–441. [Google Scholar] [CrossRef]
- Heege, T.; Kiselev, V.; Wettle, M.; Hung, N.N. Operational multi-sensor monitoring of turbidity for the entire Mekong Delta. Int. J. Remote Sens. 2014, 35, 2910–2926. [Google Scholar] [CrossRef]
- Ren, J.L.; Zheng, Z.B.; Li, Y.M.; Lv, G.N.; Wang, Q.; Lyu, H.; Huang, C.C.; Liu, G.; Du, C.G.; Mu, M.; et al. Remote observation of water clarity patterns in Three Gorges Reservoir and Dongting Lake of China and their probable linkage to the Three Gorges Dam based on Landsat 8 imagery. Sci. Total Environ. 2018, 625, 1554–1566. [Google Scholar] [CrossRef] [PubMed]
- Kuhn, C.; Valerio, A.D.; Ward, N.; Loken, L.; Sawakuchi, H.O.; Karnpel, M.; Richey, J.; Stadler, P.; Crawford, J.; Striegl, R.; et al. Performance of Landsat-8 and Sentinel-2 surface reflectance products for river remote sensing retrievals of chlorophyll-a and turbidity. Remote Sens. Environ. 2019, 224, 104–118. [Google Scholar] [CrossRef]
- Peterson, K.T.; Sagan, V.; Sidike, P.; Cox, A.L.; Martinez, M. Suspended Sediment Concentration Estimation from Landsat Imagery along the Lower Missouri and Middle Mississippi Rivers Using an Extreme Learning Machine. Remote Sens. 2018, 10, 1503. [Google Scholar] [CrossRef]
- Markert, K.N.; Schmidt, C.M.; Griffin, R.E.; Flores, A.I.; Poortinga, A.; Saah, D.S.; Muench, R.E.; Clinton, N.E.; Chishtie, F.; Kityuttachai, K.; et al. Historical and Operational Monitoring of Surface Sediments in the Lower Mekong Basin Using Landsat and Google Earth Engine Cloud Computing. Remote Sens. 2018, 10, 909. [Google Scholar] [CrossRef]
- Umar, M.; Rhoads, B.L.; Greenberg, J.A. Use of multispectral satellite remote sensing to assess mixing of suspended sediment downstream of large river confluences. J. Hydrol. 2018, 556, 325–338. [Google Scholar] [CrossRef]
- Fassoni-Andrade, A.C.; de Paiva, R.C.D. Mapping spatial-temporal sediment dynamics of river-floodplains in the Amazon. Remote Sens. Environ. 2019, 221, 94–107. [Google Scholar] [CrossRef]
- Park, E.; Latrubesse, E.M. Surface water types and sediment distribution patterns at the confluence of mega rivers: The Solimoes-Amazon and Negro Rivers junction. Water Resour. Res. 2015, 51, 6197–6213. [Google Scholar] [CrossRef]
- Lobo, F.D.; Costa, M.; Novo, E.; Telmer, K. Distribution of Artisanal and Small-Scale Gold Mining in the Tapajos River Basin (Brazilian Amazon) over the Past 40 Years and Relationship with Water Siltation. Remote Sens. 2016, 8, 579. [Google Scholar] [CrossRef]
- Carstens, D.; Amer, R. Spatio-temporal analysis of urban changes and surface water quality. J. Hydrol. 2019, 569, 720–734. [Google Scholar] [CrossRef]
- Schwatke, C.; Dettmering, D.; Bosch, W.; Seitz, F. DAHITI—An innovative approach for estimating water level time series over inland waters using multi-mission satellite altimetry. Hydrol. Earth Syst. Sci. 2015, 19, 4345–4364. [Google Scholar] [CrossRef]
- Birkett, C.M.; Mertes, L.A.K.; Dunne, T.; Costa, M.H.; Jasinski, M.J. Surface water dynamics in the Amazon Basin: Application of satellite radar altimetry. J. Geophys. Res. Atmos. 2002, 107, LBA 26-1–LBA 26-21. [Google Scholar] [CrossRef]
- Berry, P.A.M.; Garlick, J.D.; Freeman, J.A.; Mathers, E.L. Global inland water monitoring from multi-mission altimetry. Geophys. Res. Lett. 2005, 32. [Google Scholar] [CrossRef]
- Frappart, F.; Calmant, S.; Cauhope, M.; Seyler, F.; Cazenave, A. Preliminary results of ENVISAT RA-2-derived water levels validation over the Amazon basin. Remote Sens. Environ. 2006, 100, 252–264. [Google Scholar] [CrossRef]
- Da Silva, J.S.; Calmant, S.; Seyler, F.; Rotunno, O.C.; Cochonneau, G.; Mansur, W.J. Water levels in the Amazon basin derived from the ERS 2 and ENVISAT radar altimetry missions. Remote Sens. Environ. 2010, 114, 2160–2181. [Google Scholar] [CrossRef]
- Da Silva, J.S.; Seyler, F.; Calmant, S.; Rotunno, O.C.; Roux, E.; Araujo, A.A.M.; Guyot, J.L. Water level dynamics of Amazon wetlands at the watershed scale by satellite altimetry. Int. J. Remote Sens. 2012, 33, 3323–3353. [Google Scholar] [CrossRef]
- Schneider, R.; Godiksen, P.N.; Villadsen, H.; Madsen, H.; Bauer-Gottwein, P. Application of CryoSat-2 altimetry data for river analysis and modelling. Hydrol. Earth Syst. Sci. 2017, 21, 651–664. [Google Scholar] [CrossRef]
- Huang, Q.; Long, D.; Du, M.D.; Zeng, C.; Li, X.D.; Hou, A.Z.; Hong, Y. An improved approach to monitoring Brahmaputra River water levels using retracked altimetry data. Remote Sens. Environ. 2018, 211, 112–128. [Google Scholar] [CrossRef]
- Becker, M.; da Silva, J.S.; Calmant, S.; Robinet, V.; Linguet, L.; Seyler, F. Water Level Fluctuations in the Congo Basin Derived from ENVISAT Satellite Altimetry. Remote Sens. 2014, 6, 9340–9358. [Google Scholar] [CrossRef]
- Kim, D.; Lee, H.; Laraque, A.; Tshimanga, R.M.; Yuan, T.; Jung, H.C.; Beighleyg, E.; Chang, C.H. Mapping spatio-temporal water level variations over the central Congo River using PALSAR ScanSAR and Envisat altimetry data. Int. J. Remote Sens. 2017, 38, 7021–7040. [Google Scholar] [CrossRef]
- Siddique-E-Akbor, A.H.M.; Hossain, F.; Lee, H.; Shum, C.K. Inter-comparison study of water level estimates derived from hydrodynamic-hydrologic model and satellite altimetry for a complex deltaic environment. Remote Sens. Environ. 2011, 115, 1522–1531. [Google Scholar] [CrossRef]
- Pandey, R.K.; Cretaux, J.F.; Berge-Nguyen, M.; Tiwari, V.M.; Drolon, V.; Papa, F.; Calmant, S. Water level estimation by remote sensing for the 2008 flooding of the Kosi River. Int. J. Remote Sens. 2014, 35, 424–440. [Google Scholar] [CrossRef]
- Boergens, E.; Dettmering, D.; Schwatke, C.; Seitz, F. Treating the Hooking Effect in Satellite Altimetry Data: A Case Study along the Mekong River and Its Tributaries. Remote Sens. 2016, 8, 91. [Google Scholar] [CrossRef]
- Pham, H.T.; Marshall, L.; Johnson, F.; Sharma, A. Deriving daily water levels from satellite altimetry and land surface temperature for sparsely gauged catchments: A case study for the Mekong River. Remote Sens. Environ. 2018, 212, 31–46. [Google Scholar] [CrossRef]
- Villadsen, H.; Andersen, O.B.; Stenseng, L.; Nielsen, K.; Knudsen, P. CryoSat-2 altimetry for river level monitoring - Evaluation in the Ganges-Brahmaputra River basin. Remote Sens. Environ. 2015, 168, 80–89. [Google Scholar] [CrossRef]
- Boergens, E.; Nielsen, K.; Andersen, O.B.; Dettmering, D.; Seitz, F. River Levels Derived with CryoSat-2 SAR Data ClassificationA Case Study in the Mekong River Basin. Remote Sens. 2017, 9, 1238. [Google Scholar] [CrossRef]
- Liu, K.T.; Tseng, K.H.; Shum, C.K.; Liu, C.Y.; Kuo, C.Y.; Liu, G.M.; Jia, Y.Y.; Shang, K. Assessment of the Impact of Reservoirs in the Upper Mekong River Using Satellite Radar Altimetry and Remote Sensing Imageries. Remote Sens. 2016, 8, 19. [Google Scholar] [CrossRef]
- Tarpanelli, A.; Camici, S.; Nielsen, K.; Brocca, L.; Moramarco, T.; Benveniste, J. Potentials and limitations of Sentinel-3 for river discharge assessment. Adv. Sp. Res. 2019. [Google Scholar] [CrossRef]
- Paris, A.; de Paiva, R.D.; da Silva, J.S.; Moreira, D.M.; Calmant, S.; Garambois, P.A.; Collischonn, W.; Bonnet, M.P.; Seyler, F. Stage-discharge rating curves based on satellite altimetry and modeled discharge in the Amazon basin. Water Resour. Res. 2016, 52, 3787–3814. [Google Scholar] [CrossRef]
- Hou, J.W.; van Dijk, A.; Renzullo, L.J.; Vertessy, R.A. Using modelled discharge to develop satellite-based river gauging: A case study for the Amazon Basin. Hydrol. Earth Syst. Sci. 2018, 22, 6435–6448. [Google Scholar] [CrossRef]
- Dubey, A.K.; Gupta, P.; Dutta, S.; Kumar, B. Evaluation of satellite-altimetry-derived river stage variation for the braided Brahmaputra River. Int. J. Remote Sens. 2014, 35, 7815–7827. [Google Scholar] [CrossRef]
- Huang, Q.; Long, D.; Du, M.D.; Zeng, C.; Qiao, G.; Li, X.D.; Hou, A.Z.; Hong, Y. Discharge estimation in high-mountain regions with improved methods using multisource remote sensing: A case study of the Upper Brahmaputra River. Remote Sens. Environ. 2018, 219, 115–134. [Google Scholar] [CrossRef]
- Kim, D.; Yu, H.W.; Lee, H.; Beighley, E.; Durand, M.; Alsdorf, D.E.; Hwang, E. Ensemble learning regression for estimating river discharges using satellite altimetry data: Central Congo River as a Test-bed. Remote Sens. Environ. 2019, 221, 741–755. [Google Scholar] [CrossRef]
- Birkinshaw, S.J.; O’Donnell, G.M.; Moore, P.; Kilsby, C.G.; Fowler, H.J.; Berry, P.A.M. Using satellite altimetry data to augment flow estimation techniques on the Mekong River. Hydrol. Process. 2010, 24, 3811–3825. [Google Scholar] [CrossRef]
- Sun, W.C.; Ishidaira, H.; Bastola, S. Towards improving river discharge estimation in ungauged basins: calibration of rainfall-runoff models based on satellite observations of river flow width at basin outlet. Hydrol. Earth Syst. Sci. 2010, 14, 2011–2022. [Google Scholar] [CrossRef]
- Sichangi, A.W.; Wang, L.; Hu, Z.D. Estimation of River Discharge Solely from Remote-Sensing Derived Data: An Initial Study Over the Yangtze River. Remote Sens. 2018, 10, 1385. [Google Scholar] [CrossRef]
- Ling, F.; Cai, X.B.; Li, W.B.; Xiao, F.; Li, X.D.; Du, Y. Monitoring river discharge with remotely sensed imagery using river island area as an indicator. J. Appl. Remote Sens. 2012, 6, 14. [Google Scholar] [CrossRef]
- Bjerklie, D.M.; Birkett, C.M.; Jones, J.W.; Carabajal, C.; Rover, J.A.; Fulton, J.W.; Garambois, P.A. Satellite remote sensing estimation of river discharge: Application to the Yukon River Alaska. J. Hydrol. 2018, 561, 1000–1018. [Google Scholar] [CrossRef]
- Kouraev, A.V.; Zakharova, E.A.; Samain, O.; Mognard, N.M.; Cazenave, A. Ob’ river discharge from TOPEX/Poseidon satellite altimetry (1992–2002). Remote Sens. Environ. 2004, 93, 238–245. [Google Scholar] [CrossRef]
- Chao, N.F.; Wang, Z.T.; Hwang, C.; Jin, T.Y.; Cheng, Y.S. Decline of Geladandong Glacier Elevation in Yangtze River’s Source Region: Detection by ICESat and Assessment by Hydroclimatic Data. Remote Sens. 2017, 9, 75. [Google Scholar] [CrossRef]
- Wang, R.; Yao, Z.J.; Wu, S.S.; Liu, Z.F. Glacier retreat and its impact on summertime run-off in a high-altitude ungauged catchment. Hydrol. Process. 2017, 31, 3672–3681. [Google Scholar] [CrossRef]
- Wang, R.; Yao, Z.J.; Liu, Z.F.; Wu, S.S.; Jiang, L.G.; Wang, L. Snow cover variability and snowmelt in a high-altitude ungauged catchment. Hydrol. Process. 2015, 29, 3665–3676. [Google Scholar] [CrossRef]
- Tekeli, A.E.; Akyurek, Z.; Sorman, A.A.; Sensoy, A.; Sorman, A.U. Using MODIS snow cover maps in modeling snowmelt runoff process in the eastern part of Turkey. Remote Sens. Environ. 2005, 97, 216–230. [Google Scholar] [CrossRef]
- Akyurek, Z.; Surer, S.; Beser, O. Investigation of the snow-cover dynamics in the Upper Euphrates Basin of Turkey using remotely sensed snow-cover products and hydrometeorological data. Hydrol. Process. 2011, 25, 3637–3648. [Google Scholar] [CrossRef]
- Pavelsky, T.M.; Smith, L.C. Spatial and temporal patterns in Arctic river ice breakup observed with MODIS and AVHRR time series. Remote Sens. Environ. 2004, 93, 328–338. [Google Scholar] [CrossRef]
- Mermoz, S.; Allain-Bailhache, S.; Bernier, M.; Pottier, E.; Van der Sanden, J.J.; Chokmani, K. Retrieval of River Ice Thickness From C-Band PolSAR Data. IEEE Trans. Geosci. Remote Sens. 2014, 52, 3052–3062. [Google Scholar] [CrossRef]
- Sakai, T.; Hatta, S.; Okumura, M.; Hiyama, T.; Yamaguchi, Y.; Inoue, G. Use of Landsat TM/ETM plus to monitor the spatial and temporal extent of spring breakup floods in the Lena River, Siberia. Int. J. Remote Sens. 2015, 36, 719–733. [Google Scholar] [CrossRef]
- Antonova, S.; Duguay, C.R.; Kaab, A.; Heim, B.; Langer, M.; Westermann, S.; Boike, J. Monitoring Bedfast Ice and Ice Phenology in Lakes of the Lena River Delta Using TerraSAR-X Backscatter and Coherence Time Series. Remote Sens. 2016, 8, 903. [Google Scholar] [CrossRef]
- Cooley, S.W.; Pavelsky, T.M. Spatial and temporal patterns in Arctic river ice breakup revealed by automated ice detection from MODIS imagery. Remote Sens. Environ. 2016, 175, 310–322. [Google Scholar] [CrossRef]
- Antonova, S.; Kaab, A.; Heim, B.; Langer, M.; Boike, J. Spatio-temporal variability of X-band radar backscatter and coherence over the Lena River Delta, Siberia. Remote Sens. Environ. 2016, 182, 169–191. [Google Scholar] [CrossRef]
- Stettner, S.; Beamish, A.L.; Bartsch, A.; Heim, B.; Grosse, G.; Roth, A.; Lantuit, H. Monitoring Inter- and Intra-Seasonal Dynamics of Rapidly Degrading Ice-Rich Permafrost Riverbanks in the Lena Delta with TerraSAR-X Time Series. Remote Sens. 2018, 10, 51. [Google Scholar] [CrossRef]
- Strozzi, T.; Antonova, S.; Gunther, F.; Matzler, E.; Vieira, G.; Wegmuller, U.; Westermann, S.; Bartsch, A. Sentinel-1 SAR Interferometry for Surface Deformation Monitoring in Low-Land Permafrost Areas. Remote Sens. 2018, 10, 1360. [Google Scholar] [CrossRef]
- Whitley, M.A.; Frost, G.V.; Jorgenson, M.T.; Macander, M.J.; Maio, C.V.; Winder, S.G. Assessment of LiDAR and Spectral Techniques for High-Resolution Mapping of Sporadic Permafrost on the Yukon-Kuskokwim Delta, Alaska. Remote Sens. 2018, 10, 258. [Google Scholar] [CrossRef]
- Kuenzer, C.; Leinenkugel, P.; Vollmuth, M.; Dech, S. Comparing global land-cover products—Implications for geoscience applications: An investigation for the trans-boundary Mekong Basin. Int. J. Remote Sens. 2014, 35, 2752–2779. [Google Scholar] [CrossRef]
© 2019 by the authors. Licensee MDPI, Basel, Switzerland. This article is an open access article distributed under the terms and conditions of the Creative Commons Attribution (CC BY) license (http://creativecommons.org/licenses/by/4.0/).