Abstract
The paper aims to detect the main changes that occurred in the area surrounding the Mario Zucchelli Station (MZS) through analysis of multi-temporal remote sensing integrated by geophysical measurements. Specific attention was directed at realizing an integrated geomorphological study of the Boulder Clay Glacier, a partially debris-covered glacier belonging to the Northern Foothills (Victoria Land, Antarctica). This area was recently chosen as the location for the construction of a new semi-permanent gravel runway for MZS logistical airfreight operations. Photogrammetric analysis was performed by comparing three historical aerial photogrammetric surveys (carried out in 1956, 1985, and 1993) and Very High Resolution (VHR) GeoEye-1 satellite stereo-image coverage acquired in 2012. The comparison of geo-referenced orthophoto-mosaics allowed the main changes occurring in some particular areas along the coast nearby MZS to be established. Concerning the study of the Boulder Clay Glacier, it has to be considered that glaciers and moraines are not steady-state systems by definition. Several remote sensing and geophysical investigations were carried out with the main aim of determining the general assessment of this glacier: Ground Penetrating Radar (GPR); Geodetic Global Positioning System (GPS) network; multi-temporal satellite Synthetic Aperture Radar (SAR) interferometry. The analysis of Boulder Clay Glacier moraine pointed out a deformation of less than 74 mm y−1 in a time span of 56 years, value that agrees with velocity and deformation data observed by GPS and InSAR methods. The presence of unexpected brine ponds at the ice/bedrock interface and the deformation pattern observed in the central part of the moraine has to be monitored and studied, especially under the long-term maintenance of the future runway.
1. Introduction
Mario Zucchelli Station (MZS) is an Italian scientific station in Antarctica that has been operational since 1985. Starting from 1990, the Italian National Antarctic Research Program (PNRA) has operated on an ice runway prepared on the Gerlache Inlet fast ice, in front of MZS (Terra Nova Bay, Victoria Land, Antarctica) for intercontinental and continental airfreight operations. The ice-runway operational period (around from 20 October to 20 November) strongly depends on the sea-ice condition and, in a global-warming era, it has been significantly reduced in the last decades.
The Cold Regions Research and Engineering Laboratory (CRREL) reported the possibility of making an operational airstrip by placing rock fill or gravel over almost-stagnant glacier. With sufficient thickness of fill, the underlying ice is protected against ablation and a stable pavement can be produced. The report also indicated as a drawback that the adjacent ice could suffer an accelerated ablation rate, making the runway elevated above its surroundings and, as a consequence, the shoulders could become unstable and the runway could be eroded along its edges [1].
For this reason, the Boulder Clay Glacier (BCG) moraine was chosen as a possible location for building a new semi-permanent gravel runway for airfreight operations, in order to provide a more reliable logistical service to international Antarctic bases placed in the surrounding area.
The planned project consists of a gravel embankment 2200 m long and 60 m wide, realized using the available material in the nearby area. When operational, this infrastructure would provide logistical services for MZS (6 km away), Gondwana Station (Germany, 13 km away), Jang Bogo Station (South Korea, 16 km away), and the future Chinese Station at Inexpressible Island (20 km away, see insert in Figure 1).
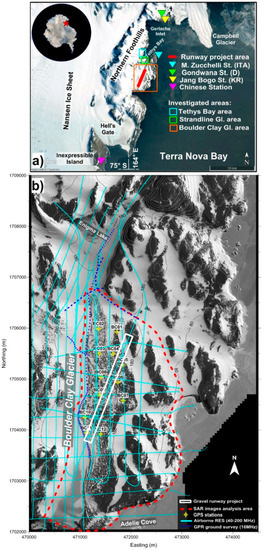
Figure 1.
Geographical localization of the study area (a) and geophysical investigations carried out on Boulder Clay Glacier (BCG) area (b).
A glacier is a dynamical system by definition, and, since the expected work-life for the airstrip is about 20 years, stability over time is one of the key points in order to evaluate damage to embankment functionality. On this task, an integrated geomorphological study of the BCG and surrounding area was performed through analysis of multi-temporal remote sensing integrated by geophysical measurements.
In last decades, remote sensing and geophysical investigations have been widely used, often separately, in glacier investigations allowing to achieve a large variety of information concerning the monitoring of ice front fluctuation, iceberg calving, mass balance calculation, ice flow speed, bedrock mapping and ice/bedrock interface properties [1,2,3,4,5,6,7,8].
The monitoring approach proposed, according to the workflow reported in Figure 2, allowed to achieve an updated and more integrated image of morphological changes over time, and of the deformation patterns occurring in the runway project area. The time span covered by photogrammetry/satellite is 56 years (1956–2012), about two times the work-life time of the airstrip, while geophysical investigations (Figure 1) were carried out for a time span of five years (mainly for Global Positioning System (GPS) network measurement repetitions); each single technique pursued and provided the following aims:
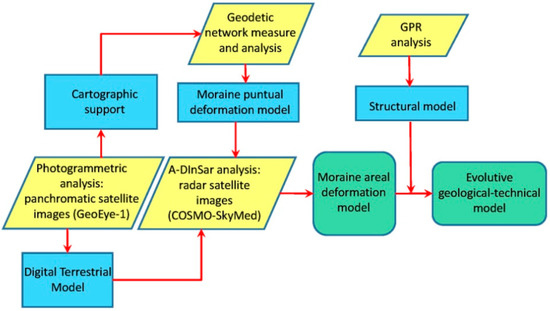
Figure 2.
Conceptual sketch of connections between geophysical surveys results and geomorphological characterization of the BCG.
- (i)
- Photogrammetry: to generate multi-temporal digital ortho-mosaics based both on available historical aerial images (1956, 1985, and 1993), and Very High Resolution (VHR) satellite stereo images acquired in 2012. Photogrammetry was applied even for the production of the reference map (high-resolution digital orthophoto), obtained through a photogrammetric process of stereopairs of satellite images using a set of Ground Control Points (GCPs) measured through a geodetic rapid-static GPS surveying technique. Data were integrated by a detailed Digital Terrain Model (DTM) of the BCG, obtained through a Terrestrial Laser Scanning (TLS) survey [9];
- (ii)
- Ground Penetrating Radar (GPR): to reveal the main bedrock morphology along the BCG area and to investigate the main supraglacial and subglacial features (water-collection areas, supraglacial and subglacial lakes, shear planes, crevasses), and the relationship between ice, moraine, and ice-cored debris in the Northern Foothills area;
- (iii)
- geodetic GPS network: to measure the horizontal and vertical rates of 12 station points specifically deployed in the runway embankment area. The network was measured five times, revealing different movement patterns of the moraine surface;
- (iv)
- Advanced Differential Interferometric Synthetic Aperture Radar (A-DInSAR) data analysis [10,11]: to estimate the deformation trends and surface-displacement evolution of the glacier and the moraine for a time interval of two years (2013–2014).
2. Boulder Clay Glacier Area Overview
The BCG (74°45′S; 164°17′E) is a polar glacier belonging to the Northern Foothills area (Terra Nova Bay, Victoria Land, Antarctica), and it is partially covered by a heterogeneous debris-sized ice-cored moraine that occupies more than half of its surface. This glacier is oriented alongside the coast, elongated for about 6 km from South to North (about 2 km wide), and ranges between Adelie Cove and Enigma Lake, a small perennially frozen lake (Figure 1). It is subjected to an annual mean temperature of −14 °C (max +9.6 °C; min −40.7 °C), and mean annual precipitation of about 250 kg m2 y−1 (www.climantartide.it), [12,13]. This area was described in the past by several authors, from 1914 (by Sir T.W.E David and Sir Priestley R.) to nowadays [14,15,16,17,18] especially under geological, glaciological, and geomorphological aspects. According to the literature, it is a typical example of a cold-based glacier [19] with a slow movement due to ice deformation, and virtually incapable of eroding the bedrock [20].
The BCG moraine is featured by largely inhomogeneous debris and referred to as “drift” or “glacial drift” by several authors. At least three main glacial drifts exist along the Northern Foothills coast [21].
Among them, the youngest corresponds to the “Young Drift” [22], also known as the “Terra Nova I (TN I) glacial drift” [23,24].
This complex consists of a large variety of rocks: granites, diorites, micaschists, gneiss, amphibolites, basalts, and other volcanic rocks [16], characterized by grain sizes ranging from silt to block.
The TN I may be related to the Last Glaciation Maximum (LGM) that occurred in the Ross Sea region between 37 and 17 ky ago [24]. According to Denton et al. [22], during the LGM, Terra Nova Bay was involved in the expansion of the Ross’s platform (grounded ice shelf). The widespread presence of marine fauna in the TN I matrix suggests that the edge of Ross’s platform in the Northern Foothills area had incorporated marine sediments, subsequently deposited on the coast [16]. During the retreat phases, large portions of debris were left along the coastal slopes.
In the course of the Holocene, the glacier grew fed by the lee-side snowfields, burying many of them and embedding the debris. The ice pushes onto the glacial drift, locally deforming it, which is confined toward the coast by the altered granite-bedrock outcrop [14]. The BGC moraine ablation till overlaid a body of dead glacier [14]. The induced pressure causes the debris to lift up in the upstream part of the BCG moraine, forming a series of long moraine ridges (shear moraines), [14,25].
The marine origin of the moraine ice-cored deposits is clearly evidenced by marine remains dated between 25 and 37 ka by C14 [24], and rock-salt extrusions on the moraine surface (see Figure 3).
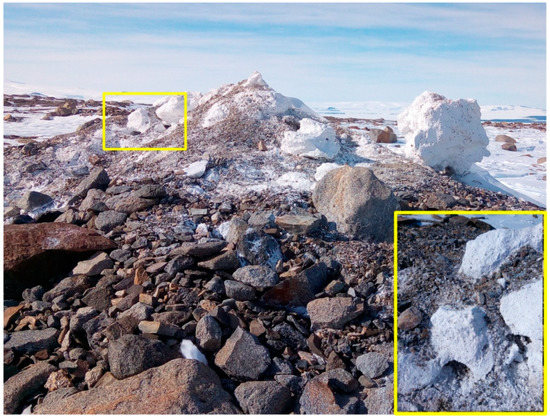
Figure 3.
Rock-salt extrusions on the Boulder Clay Moraine surface.
Several kinds of ice features related to melt waters are present on the moraine, such as frost mounds, icing blisters, and Lake-Ice Blisters (LIB), [15,26,27,28]. Water circulation onto/into the salt-rich deposits generates brines that can remain unfrozen under ice coverage [28].
3. Methods and Instrumentation
3.1. Photogrammetry
The area investigated by photogrammetry is located between Tethys Bay and Adélie Cove (Northern Foothills, Terra Nova Bay). The dataset consisted of images recorded by:
- U.S. Navy: Trimetrogon system TMA 325, in 1956 and TMA 2852-V in 1985 (Table 1).
 Table 1. Characteristics of the historical aerial flights.
 - N.Z. Aerial Mapping Limited (Hastings, New Zealand) in collaboration with U. S. Geological Survey (USGS) and PNRA: TMA 3044 in 1993 (Table 1).
- Geo-Eye1 VHR satellite images (2012).
A reference digital orthophoto and a detailed DTM of the area (including BCG) were built through the analysis of a block of four panchromatic GeoEye-1 satellite stereo images (December 2012; nadir resolution = 0.41 m; dynamic range = 11 bits/pixel) in order to perform the comparison with the current morphology.
The exterior orientation of the GeoEye-1 images was performed by the bundle-adjustment analytical model, using 25 tie points and 16 Ground Control Points (GCPs), measured through a rapid-static GPS survey. Each point position was calculated using TNB1 (Terra Nova Bay) and TNB2 permanent GPS stations, located very close (within a 10 km radius) to the investigated area, as references. A multi-sensory digital photogrammetric workstation was used for satellite-image processing. The orientation process achieved very satisfying results in terms of statistical validation parameters for each photogrammetric step, pointing out residuals with respect to GCP’s coordinates in the order of 10 cm. The processing of the GeoEye-1 images was performed by an algorithm that combines Image Correlation and Edge Matching, implemented in a commercial Digital Photogrammetric Stereoscopic Workstation, the Next-Generation Automatic Terrain Extraction (NGATE) module of Socet Set v5.4.1 (Bae Systems Inc.). The reference DTM of the area was made of about 400,000 points, with an average post-spacing of 10 m. The orthophoto-mosaic of the interested area was generated with a Ground Sample Distance (GSD) of 0.5 m using UTM projection, Zone 58 S, WGS84. Considering the good geographical distribution of GCPs, the vertical accuracy of elevations generated from the GeoEye-1 stereo-pairs could be considered, for each correlated point, as better than GSD (GeoEye-1 DTM and ortophoto are available in Supplementary Material). Within the BCG moraine, a laser-scanning survey allowed to improve the accuracy of terrain-elevation contour lines of about 50 cm [9].
Historical aerial datasets were processed using the automatic photogrammetric image-correlation approach “Structure from Motion” [29,30]. The exterior alignment was solved using rock blocks as Ground Control Points, whose 3D coordinates were derived by the GeoEye-1 final products. The chosen points were supposed to occupy stable positions and were recognizable in both satellite and historical aerial images, similarly to the approach described in Zanutta et al. [31] and D’Agata and Zanutta [32].
Considering the differences in image resolution and in flights footprint, it was not possible to use exactly the same set of GCPs in the three projects. In some cases, manual collimation was very difficult, also due to poor radiometric photo resolution (especially for the 1985 dataset).
The obtained accuracy in terms of GCP residuals was 4.0 m for the 1956, 6.3 m for the 1985, and 3.5 m for the 1933 flight. The obtained Digital Elevation Model (DEM) accuracies could be acceptable for orthophoto production and to highlight movements larger than 6–7 m (Figures S1 and S2).
3.2. GPR Surveys
A glacial environment usually represents a very suitable context for GPR applications due to the good dielectric properties of ice and snow, characterized by a low attenuation of the transmitted pulse.
GPR measures were collected by both airborne and on-ground surveys through a GSSI Sir3000 instrument equipped with different central-frequency antennas (bistatic, 16, 40, and 100 MHz; monostatic, 200 MHz).
Airborne measures, performed by means of 40 and 200 MHz antennas, were planned in particular over the moraine area due to the difficulty in moving on it with the antenna on ground. The same flight path was collected with different recording-time windows (250–3500 ns) attempting to achieve detailed information at different depths.
On-ground measures were conducted mainly towing the antenna, mounted on a wooden sledge, by a snowmobile and, in some cases (i.e., frozen lakes), directly by the GPR operator. All measures were georeferred by the link to synchronized GPS acquisition.
Reflection arrival times were converted in depth using an averaged ElectroMagnetic wave speed of 0.168 m/ns [33,34], where direct analyses as common midpoint acquisition or hyperbola diffractions were not possible to achieve. Data postprocessing included the application of vertical and horizontal bandpass filters, deconvolution, gain equalization, and migration.
The collected ice thicknesses data were spatially interpolated using the kriging method (linear variogram model) and overlaid on the reference map.
3.3. Geodetic GPS Network
During the 2013 and 2014 summer Antarctic season (XXIX campaign), a high-precision geodetic network was established on the BCG moraine area aimed to detect and monitor the movements of its surface. The network was a set of 12 points installed on large erratic blocks embedded in the surface and equipped with a forced-centering device to fix GPS antennas. Six Trimble 5700 GPS (dual-frequency) receivers equipped with Leica AT504 geodetic Choke-Ring antennas were used as stations. Acquisitions were processed with respect to permanent stations TNB1 and TNB2 in order to frame the network within the International Terrestrial Reference Frame ITRF2008.
The control network points were chosen to optimize distribution in the study area, and each station acquired data for no less than 24 h. Network measurement covered a time span of 5 years and processed by double-difference carrier-phase analysis. The data processing allowed to reach the confidence intervals (95%) of the points coordinates within ±2 mm on the horizontal positions, and ±3 mm on the vertical ones, respectively. The estimated point velocity and errors, ±3 mm y−1 for horizontal velocities and ±4–5 mm y−1 for the vertical ones, were estimated using a Matlab package described in Herring [35], that allows interactive viewing and the estimation of GPS velocities starting from the time series of the point positions.
3.4. InSAR Data Analysis
InSAR data analysis aimed to estimate both deformation trends and surface-displacement evolution of the BCG area in the short and long term. Analyses were performed by processing two different datasets (named A and B) of SAR images collected by the satellites of the COSMO-SkyMed constellation, managed by the Italian Space Agency (ASI).
Due to the complex atmospheric environment, we selected an image stack characterized by: i) a low temporal baseline (i.e., the time interval between the acquisition of consecutive images) and ii) a high number of images to optimize the advantages offered by A-DInSAR (Advanced Differential Interferometric Synthetic Aperture Radar) methods.
In more detail, 102 archive images (in “StripMap Himage” mode), acquired along the descending orbital pass, were selected. The scenes have a nominal resolution of 3 × 3 m and were characterized by a Line of Sight (LOS) direction of about 325° N, and an incidence angle with respect to the flat ground of about 45°.
Considering the large available dataset and the complex environmental and atmospheric conditions of the investigated area, the A and B datasets were selected and processed by means of both DInSAR and A-DInSAR multi-image-processing methodologies to minimize temporal decorrelation and maximize spatial-information density.
The A dataset gathered 53 images collected from 25 February to 10 December 2013, while the B dataset was made up of 49 images covering the period from 11 January to 1 December 2014 (Table 2). The investigated area included the BCG moraine, the glacier outlet at Adelie Cove, and some surrounding outcrops that were used as stable reference points. The processing has been performed using a non-conventional Persistent Scatterers Interferometry (PSI) approach by using the SARPROZ software tool [36,37], as it allows for a high flexibility in the processing chain. Considering the complex environmental condition, but, on the other hand, the very low revisit time of the data-stacks available in the area, a mixed processing approached was applied.
Table 2.
Temporal distribution of the two datasets (dataset A and dataset B) of Synthetic Aperture Radar (SAR) images used for the A-DInSAR analyses. For each image the following information are reported: the satellite belonging to the COSMO-SkyMed constellation used for the acquisition, the date of acquisition, the orbit number as reported by ASI and the normal baseline (Bn) in meters with respect to the master image used for the dataset coregistration step.
Specifically, redundant connections between the images of the stack to generate the interferograms were used, thus trying to maximize the spatial coherence also in areas with a strong seasonal variability in the earth surface conditions. Thanks to the high interferometric coherence observed, a very dense network of Persistent Scatterers Candidates (PSC) has been created, thus connecting coherent pixels of the images for the estimation of the displacement information.
Finally, two separated analyses by using both unwrapped and wrapped phase signals were performed to derive the deformation information of the investigated area. Thanks to the very dense spatial connections, useful to avoid phase jumps effects, both wrapped and unwrapped phase inversion, provided similar results thus confirming the overall quality of the analyses performed.
4. Results
4.1. Comparison of Historical Photogrammetric Datasets
Each analysis of the three historical photogrammetric flights allowed to obtain a coeval digital-orthophoto mosaic for each photogrammetric block. The adoption of a GCP dataset defined within the same map projection UTM-WGS84 58S allowed the comparison between the orthophotos and the high-resolution satellite images.
Below, we reported three examples of multi-temporal comparisons of digital orthophotos that refer in the first two cases to the variation of the front of two glaciers, the first placed along the western side of the Tethys Bay, and the second is the Strandline Glacier (green and cyan rectangles in Figure 1a). The third case reports the fluctuation of the perimeter of the Enigma Lake, located northward of BCG (Figure 1b).
Figure 4 shows the ice-front change in the order of 90 m due to ice calving and subsequent iceberg detachments from the coast that occurred in the Tethys Bay area between 1956 and 1985.
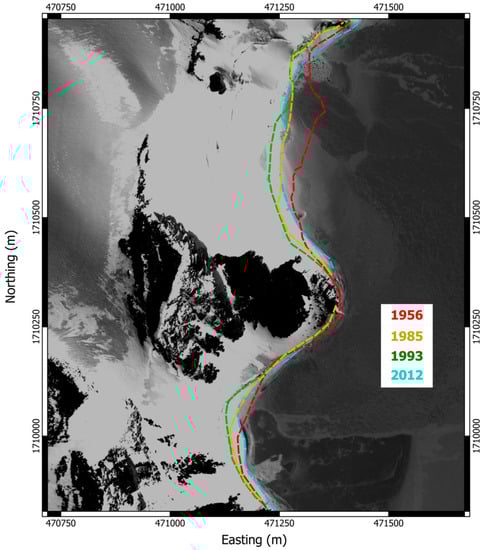
Figure 4.
Ice front outline changes in Tethys Bay area from 1956 to 2012.
The temporal variation of the Strandline Glacier (Figure 5) clearly shows the advancement of the glacier front (dashed lines) and surface stratification (dotted lines), which describes the flow rate of the glacier (arrows).
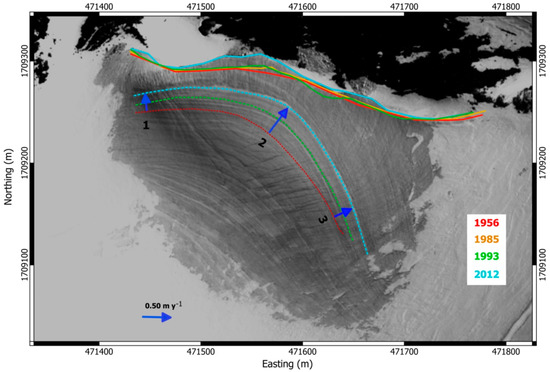
Figure 5.
Multi-temporal signature of ice body advancement (dashed lines) and of surface stratification (dotted lines) on Strandline Glacier.
The maximum advance of the ice cliff occurred in 2012, where [21] proposed a retreating of the glacier. The observation of surface stratigraphy allows to estimate velocity changes in the time span from 1956 to 2012 (Table 3). In 2012, ice-flow rates were higher in the central part of the glacier (0.59 ± 0.07 m y−1), and lower in the lateral area (0.32–0.36 ± 0.07 m y−1). An increase in glacier-flow speed was observable when comparing 1956–1993 and 1993–2012 measurements, in agreement with the topographic slope and glacier dynamics. Glacier-surface velocity measurements by field survey yielded a mean value of 0.7–2.3 m y−1 for the whole glacier over the 1988–1993 period. Measurement of the ice cliff through fixed points from 1987 to 2003 shows no significant variations, and any major changes appear to be related to local ice falls [38,39,40].
Table 3.
Surface velocities between 1956 and 2012 (Figure 6).
Figure 6 instead shows the variation of the Enigma Lake area extension that reached a maximum in 1985 and a minimum in 2012. The comparison of images reveals a difference of about 141,000 m2, with a 58% reduction compared to 1985 area. Orombelli [41] reported a fluctuation of +5% of the Enigma Lake surface from 1985 to 1956.
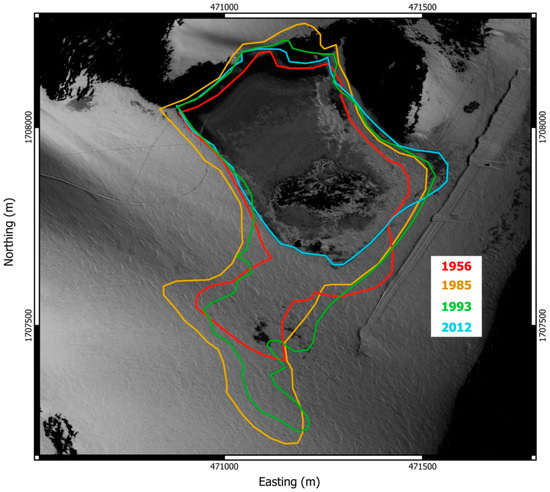
Figure 6.
Enigma Lake’s variations from 1956 to 2012.
4.2. Boulder Clay Glacier Bedrock Structures
The GPR survey aimed to reveal general bedrock morphology, providing details about the presence of glacial features like subglacial lakes, ice-blister lakes, shear zones, and crevasses. The BCG is generally characterized by the interaction, from west to east, of different elements:
- (i)
- the glacier, fed by snow accumulation of lee-side snowfields;
- (ii)
- the ice-cored moraine, which is pushed eastward by the glacier toward a rising bedrock and under the influence of strong sublimation process induced by strong katabatic wind (up to 135 kn s−1, www.climantartide.it)
The last element is hardly penetrable by electromagnetic (EM) waves and masks bedrock reflections complicating the picking of echoes from the bottom of a large part of the area (Figure 9a).
Figure 7 reports the bedrock elevations and the ice-thickness maps obtained by careful identification of bottom reflections recorded on the entire GPR surveys.
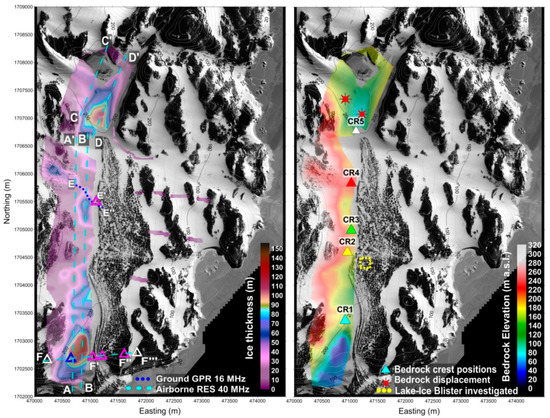
Figure 7.
Map of ice thickness values interpolated along the Ground Penetrating Radar (GPR) profiles in the Boulder Clay Glacier area and derived bedrock elevation map.
Observing the bedrock elevation map, it is possible to identify a sequence of five crests oriented to the West–East direction along the BCG snowfields: CR1, CR2, CR3, CR4, and CR5. These features operate as a modification in the glacier stream and its deformations. The southern part of the glacier seems to be deeper, but the moraine presence could mask deeper points as well. The maximum ice-thickness values were recorded along the A–A’ and B–B’ (Figure 7a) sections: about 120 m in the northern part of the BCG, and about 160 m in the southern. The eastern part of the BCG showed ice thickness generally lower than 30 m, with a clear decrease of thickness in all GPR profiles from West to East.
Sections AA’ and BB’ (Figure 8a,b) remark the rapid change in bedrock morphology on a distance of less than 200 m, while CC’ and DD’ show some bedrock abrupt discontinuities. The latter are probably linked to the tectonic setting between the Abbott Granite and Abbot Gabbro-Diorite Units [42], delimiting the BCG in the northern part. Observing the bedrock morphology, the deepening of the bedrock in the southern part of the BCG could be linked to a wet-based glacial erosion.
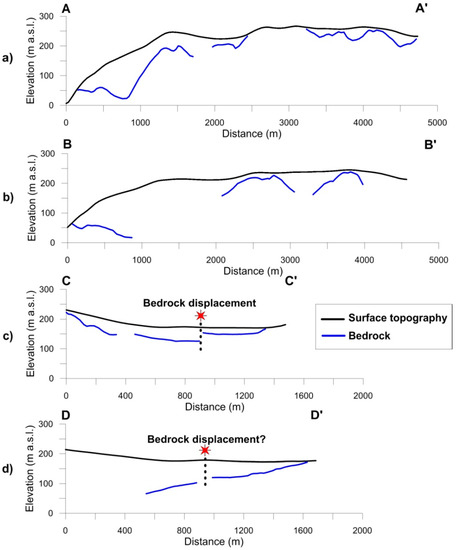
Figure 8.
Bedrock elevation picked along radargrams (airborne 40 MHz): (a) section AA’ (vertical exaggeration: 4); (b) section BB’ (vertical exaggeration: 4); (c) section CC’ (vertical exaggeration: 2); (d) section DD’ (vertical exaggeration: 2).
The radargrams reported in Figure 9a (grounded, 16 MHz) and Figure 9b (airborne, 40 MHz) show the relationship between the main BCG elements: the snowfields (western part E–E’ and F–F’) and the ice-cored moraine (eastern part, E’–E” and F’–F”). Along the radargrams, the bedrock (white dotted line) and its outcrops (white triangles), the extension of the lee-side snowfield (blue triangle), and the emersion of the moraine material through the shear planes (magenta triangle) are recognizable, as proposed and described by Chinn [14].
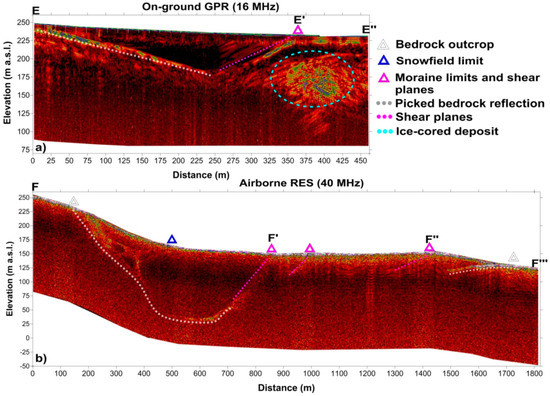
Figure 9.
Cross-sections radargrams as showed in Figure 7: (a) radargram EE’; (b) radargram FF’ (vertical exaggeration: 2).
It is noteworthy that the presence of ice-cored debris is only recognizable in the 16 MHz dataset (Profile E–E”) while, at higher frequencies, heavy electromagnetic-wave scattering impedes signal penetration into the moraine debris.
4.3. Glacier Features and Water/Brine Presence
The presence of water in the BCG is typically connected to the melting occurring on the warmer days of December at the margin of snowfields and at the front of the glaciers [15,26,43]. Onto the moraine, these melting waters are often gathered in small superficial lakes or percolate inside through typical glacial features like open crevasses, cracks, and shear planes.
Part of the GPR survey was specifically designed to investigate these glacial features, obtaining at the same time information about the presence of liquid water between the debris and ice-cored moraine, and at the ice/bedrock interface.
Radar-wave reflectivity passing from the ice/rock to ice/water interface is considerably different, allowing to discriminate the presence of liquid phases as lake, pond, or thin film over the bedrock.
Figure 10 shows two examples of GPR profiles (200 MHz antenna) carried out on a typical lake-ice blister. Both radargrams AA’ and BB’ show a flat and powerful reflection (“mirror reflection”) that reveals strong variation in reflectivity other than that observed along the lake flanks and over debris accumulation. The large amount of returned energy also generates a multiple reflection effect.
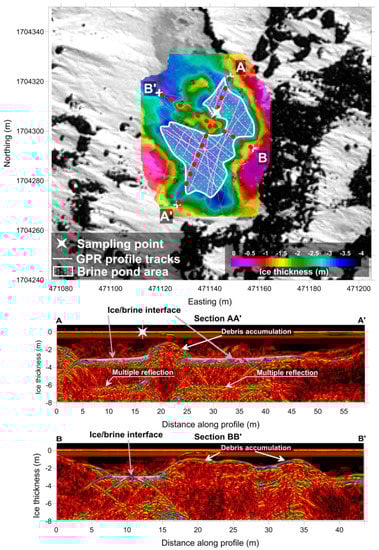
Figure 10.
Lake-Ice Blister thickness map with representative cross-section radargrams.
This survey was conducted in the early days of November 2013, and average recorded temperature in 1–10 November was –14 °C, with a maximum of –8.1 °C and a minimum of –20.5 °C (www.climantartide.it).
Considering the shallow burial depth, the presence of an ice–liquid interface can be addressed with the chemical composition of the water and the action of solar radiation. The liquid was sampled in November 2013 by operating a small drill, and its physicochemical parameters were determined by a multi-parametric probe (HI 9828; Table 4).
Table 4.
Physicochemical parameters of lake-ice blister water determined by a multi-parametric probe (HI 9828).
The salinity level (2.13%) and conductivity (4091 µS/cm) were comparable to brackish water, while the temperature inside the blister, due to the solar-radiation effect, was consistent, with the presence of a liquid phase. On BCG, Guglielmin et al. [28] recorded similar conductivity values (2800 µS/cm), drilling an ice layer in the blister at 174–176.5 cm depth. The drill also allowed to sample the brine and slush layer beneath the ice at a temperature of –13.2 and –15.4 °C, with a conductivity between 66,000 and 97,000 µS/cm, which suggests salinities at least four to five times that of seawater.
During the 2015 campaign, another bright “mirror” reflection came out along a radar line carried out in the westward moraine margin (Figure 11a). The data, recorded with a 16 MHz bistatic antenna pair, showed a flat powerful reflection (see scan 643 in Figure 11b) buried under more than 100 m of ice (elevation of about 120 m a.s.l.).
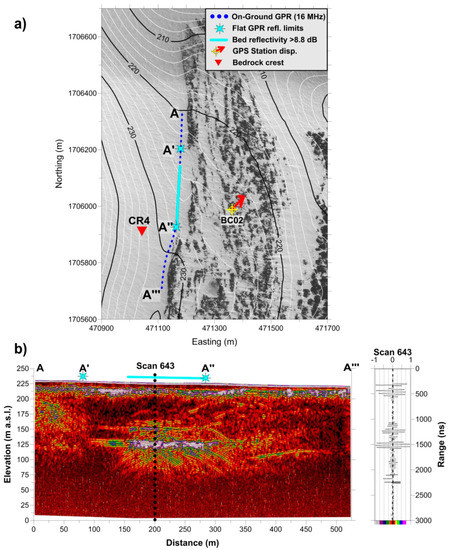
Figure 11.
“Mirror” reflection recorded along the GPR profile (16 MHz) carried out at moraine limit. Map positioning (a) and corresponding radargram (b).
According to the method proposed by Zirizzotti et al. [44], reflectivity transition from an ice/bedrock to an ice/water interface corresponds to an amplitude increment of the reflected signal of at least 7.7 dB. Recalibrating the calculation by entering water salinity and conductivity, we obtained a new threshold of about 8.8 dB. Amplitude data analysis revealed that the “mirror” reflection exceeded 11 dB, confirming the reliability of the method under this particular condition.
A similar reflection was recently recorded at the Taylor Glacier (Dry Valley), 350 km southward of BCG, where the englacial brine at the ice/bedrock interface was also sampled using a “clean entry” probe (ICEMOLE). Geochemistry studies pointed out that the brine has a marine origin, probably linked to the LGM expansion of the Ross Ice Sheet [45,46,47]. This hypothesis is consistent with the one proposed by Orombelli et al. [24], in which the Terra Nova piedmont glacier, which filled Terra Nova Bay and reached a surface elevation of 380 m against the Northern Foothills, was part of a marine-based ice sheet in the inner Ross Embayment during the Last Glacial Maximum.
4.4. Surface Displacements and Deformation Trends
SAR signal stability is strictly connected to the spatial relationship between the main glacial features of the BCG, providing an independent and widespread overview of the surface dynamics occurring on the area. Figure 12 reports examples of A-DInSAR analysis that pointed out the following results in terms of signal stability and phase:
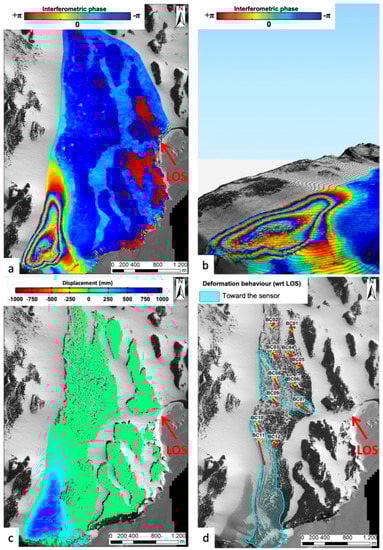
Figure 12.
(a) Example of interferogram generated (during the A-DInSAR processing chain) by coupling the images acquired in May and June 2014 (temporal baseline: 24 days); (b) 3D detail of the same interferogram related to the final section of the glacier. The elevation contour lines are displayed in black; (c) cumulated displacement between January and December 2014 derived from the A-DInSAR results obtained thanks to the approach described in the Section 3.4; (d) boundaries of the areas of the moraine characterized by deformation toward the sensor, along the Line of Sight (LOS) direction, associated with the vectors of the GPS network velocities over the moraine.
- Bedrock outcrops: analysis did not show any detectable movements, so the points were used as reference during data processing (high signal stability);
- Glacier: the surface-displacement rate deducted from the analysis was up to 1 m y−1 in the higher slope area close two Adelie Cove along the low signal stability (LOS; Figure 12a,b);
- Moraine: characterized anomalous signal stability likely due to inhomogeneous surface dynamic (Figure 12c,d).
The surface displacement of the BCG moraine area was monitored by measuring a GPS strain network in a time span of five years (2013–2018). The results showed that differential velocities were in the order of a few millimeters per year (see Table 5 and Figure 13).
Table 5.
Relative rates and errors (±σ) of Global Positioning System (GPS) stations detected after five campaigns from 2012 to 2017.
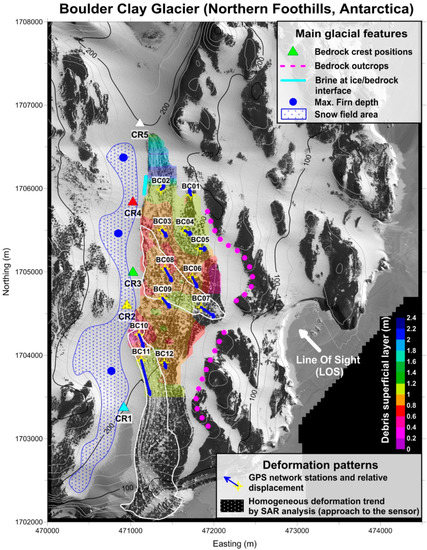
Figure 13.
Summary map of the results obtained in the Boulder Clay area by different surveying techniques.
The comparisons between digital orthophotos from images acquired in 1956 and 2012 confirmed the absence of displacements larger than photogrammetric-analysis uncertainties, which can be estimated in the order of ±74 mm y−1 in a time span of 56 years. Figure 13 reports the distribution of GPS station velocities over the BCG moraine, overlaid to the main bedrock features and deformation area derived by SAR images. Maximum horizontal velocities were measured at points BC11 (39 mm y−1, 147°N) and BC07 (32 mm y−1, 106°N), in agreement with the A-DInSAR analysis, while small displacements (in the order of few mm y−1) were considered negligible in the case of a possible adjustment of the erratic block position on the ice surface.
In particular, the northern part of the moraine shows small or null movement, while the center part (between CR4 and CR3) pointed out an eastward-flow direction toward the narrow valley that reaches the sea along the direction of the BC08–09 to BC07 stations. Crossing the southern bedrock crest (CR2), stations BC10, BC11, and BC12 clearly indicate that the ice flow turns toward Adelie Cove, increasing its speed, as observed in both GPS and A-DInSAR analysis.
The moraine is an ablation till overlying massive ice in which debris represents the solid relict of katabatic wind ablation since the retreat of a marine ice sheet about 8 kyr ago. The amount of the debris is correlated with ice dynamics because higher dynamics cause a greater debris spread per square meters of surface. The GPR survey allowed to map the thickness of the debris cover over the BCG moraine (Figure 13), showing a maximum thickness of around 2 m in the northern part, where ice flow/deformation is minimum. The GPR debris-thickness estimation was confirmed by a trench excavation performed along the BCG moraine.
5. Discussion and Conclusions
The multidisciplinary approach proposed in this study allowed us to define a precise structural constraint and a clearer relationship between the main physical factors interacting on the BCG glacier, such as bedrock, glacier, moraine, glacier features, and water bodies and their variation during the last 50 years.
Analysis of aerial and satellite images indicated a variation of ice bodies (ice cliff, ice small, supraglacial lake) without any significant trend during the last 50 years, despite the increase in the permafrost temperature and active layer thickness observed at the BCG moraine between 1997 and 2009. Guglielmin and Cannone (2012) pointed out that the summer ground-surface temperature showed a strong warming trend (0.31 °C per year), while the active layer exhibited a thickening trend of 1 cm y−1, although air temperature was almost stable. A borehole thermometry record at the Styx Glacier (60 km northward of BCG) indicates that surface temperature was 1.7 ± 0.4°C higher during the 20th century than the long-term average over the 17–19th centuries, but no significant increase was recorded since the mid-20th century [48].
On the basis of the results obtained in this study, glacier-deformation behaviour is not only dependent on bedrock shape and ice thickness, but also upon the relationship between glacier and moraine (that exhibits different deformation patterns), interaction with the ablation due to the strong katabatic winds blowing in the area, and water presence.
The main physical elements that shape the glacier in its actual form are as follows:
- BCG moraine that is “relatively” stable, probably because it is an ice dead body, a relict of LGM marine ice sheet;
- Bedrock morphology and crests CR2 and CR4 that operate as “ice divides”, splitting up the ice flows;
- Ablation due to the strong katabatic winds blowing is the main process that allows the formation of BCG moraine;
- The presence of liquid brine at the ice/bedrock interface (Figure 11).
The BCG also shows three main sectors characterized by different deformation behaviours:
- The northern part: characterized by small or null movement;
- The centre part (between CR4 and CR2): it drains ice eastwardly, hosted and constrained in a funnel-shaped valley that seems to have only one narrow outlet to the right of BC07 station;
- The southern part (southward CR2): it drains ice toward Adelie Cove at a faster speed than the others, as also suggested by the topographic slope.
BCG moraine is placed into a narrow valley elongated perpendicularly to the outflow direction and downwind the katabatic wind, which blows from the Priestley Glacier. The latter and the abrupt change in topographic slope could induce a very strong ice sublimation outcropping the debris contained in the marine ice-cored deposits and reducing the ice outflow.
The presence of shear planes, cracks, and crevasses point out the glacier dynamics BCG, the low deformation/velocity measured on the BCG moraine point out that these features are partially relict and/or with very low movements. Result analysis outlines the differences in the module and direction of displacement vectors, and the different deformation patterns between the glacier parts and between the western glacier bodies and eastern ice core moraine part. However, GPS and A-DInSAR measurements showed velocities from few mm year-1 to a maximum of 39 mm y−1 while ortophoto images comparison indicated the absence of any significant displacement higher than ±74 mm y−1 during the last 56 year.
In the moraine area, shear planes seem to be involved both in the generation of small surface dislocations that could be filled by superficial melting waters (supraglacial lakes), and in brine formation, permitting water circulation through salt-rich ice-cored deposits.
SAR data analysis showed that supraglacial lake surfaces are characterized by low values in radar-signal stability and coherence, probably due to cycles of melting/refreezing.
GPR data revealed the presence of a liquid phase at the ice/bedrock interface buried under an ice column of about 120 m and at a temperature of about –14 °C, suggesting the presence of a high-salinity water body (brine). Finding of liquid brine pooled at the BCG ice/bedrock interface raises new issues concerning the deformation trends of the moraine area and supports the marine origin of the BCG dead glacier deposited during the LGM.
Moreover, the brine presence along the recorded line matches with the breakdown of the westward moraine limit (see cyan dotted line in Figure 13), where even DEM isoclines appear distorted. If it is reasonable to consider the brine presence as more widespread along the BCG moraine, we cannot rule out its contribution to the general deformation pattern of the moraine area.
The building of a semi-permanent gravel runway for airfreight operation has to consider the nature of the ice that is, by definition, a dynamic system. For this reason, the results outlined have to be taken into account, especially under the long-term maintenance of the future runway itself.
In conclusion, the small-scale multidisciplinary approach used in this work has led to noteworthy and well-integrated results permitting to achieve a detailed image of morphological changes in the study area over time. The integration of methods made possible the reconstruction of a low-ambiguity start image (“zero-time condition”) useful for comparisons with the future mandatory monitoring campaigns.
Supplementary Materials
The following are available online at https://www.mdpi.com/2072-4292/11/12/1501/s1, Figure S1: Supplementary material_DEM_GeoEye1_2012, Figure S2: Supplementary material_Ortho_GeoEye1_2012.
Author Contributions
G.B.-F., M.F., S.U., L.V., and A.Z. conceived and designed the paper; G.B.-F., S.U., L.V., and A.Z. joined in Antarctic Scientific Expeditions; P.M. and A.R. analyzed the SAR data; M.S., S.U., and A.Z. analyzed the GPR data; M.F. and S.U. developed the glaciological interpretation of the data results; V.A.G., L.V., and A.Z. analyzed the GNSS data and performed photogrammetric processing; all authors contributed to the writing of the paper.
Funding
Part of this work was supported by the Italian National Program for Antarctic Research (PNRA).
Acknowledgments
Several researchers contributed to the field activities. Mario Zucchelli Station supported the logistics of the surveys, partially within the PNRA project “ENIGMA”.
Conflicts of Interest
The authors declare no conflict of interest.
References
- Mellor, M. Notes on Antarctic Aviation. In CRREL Reports; Cold Regions Research and Engineering Laboratory: Hanover, NH, USA, 1993; pp. 14–93. [Google Scholar]
- Frezzotti, M. Ice front fluctuation, iceberg calving flux and mass balance of Victoria Land glaciers (Antarctica). Antarct. Sci. 1997, 9, 61–73. [Google Scholar] [CrossRef]
- Baroni, C.; Frezzotti, M.; Meneghel, M.; Orombelli, G.; Smiraglia, C.; Vittuari, L. Result of Monitoring of Local Glaciers at Terra Nova Bay (Victoria Land, Antarctica). Terra Antart. 1995, 2, 41–47. [Google Scholar]
- Frezzotti, M.; Capra, A.; Vittuari, L. Comparison between glacier ice velocities inferred from GPS and sequential satellite images. Ann. Glaciol. 1998, 27, 54–60. [Google Scholar] [CrossRef]
- Vittuari, L.; Vincent, C.; Frezzotti, M.; Mancini, F.; Gandolfi, S.; Bitelli, G.; Capra, A. Space geodesy as a tool for measuring ice surface velocity in the Dome C region and along ITASE traverse (East Antarctica). Ann. Glaciol. 2004, 39, 402–408. [Google Scholar] [CrossRef][Green Version]
- Winter, A.; Steinhage, D.; Arnold, E.J.; Blankenship, D.D.; Cavitte, M.G.P.; Corr, H.G.J.; Paden, J.D.; Urbini, S.; Young, D.A.; Eisen, O. Radio-echo sounding measurements and ice-core synchronization at Dome C, Antarctica. Cryosphere 2017, 11, 653–668. [Google Scholar] [CrossRef]
- Young, D.A.; Roberts, J.J.; Ritz, C.; Frezzotti, M.; Quartini, E.; Cavitte, M.G.P.; Tozer, C.R.; Steinhage, D.; Urbini, S.; Corr, H.F.J.; et al. High-resolution boundary conditions of an old ice target near Dome C, Antarctica. Cryosphere 2017, 11, 1897–1911. [Google Scholar] [CrossRef]
- Urbini, S.; Cafarella, L.; Tabacco, I.E.; Baskaradas, J.A.; Serafini, M.; Zirizzotti, A. RES Signatures of Ice Bottom Near to Dome C (Antarctica). IEEE Trans. Geosci. Remote Sens. 2015, 53, 1558–1564. [Google Scholar] [CrossRef]
- Abate, D.; Pierattini, S.; Bianchi-Fasani, G. Lidar in extreme environment: Surveying in Antarctica. In ISPRS Annals of the Photogrammetry, Remote Sensing and Spatial Information Sciences; Copernicus Publications: Göttingen, Germany, 2013; Volume II-5/W2. [Google Scholar]
- Goldstein, R.M.; Engelhardt, H.; Kamb, B.; Frolich, R.M. Satellite radar interferometry for monitoring ice sheet motion: Application to an Antarctic ice stream. Science 1993, 262, 1525–1530. [Google Scholar] [CrossRef]
- Rignot, E.; Mouginot, J.; Scheuchl, B. Ice flow of the Antarctic ice sheet. Science 2011, 333, 1427–1430. [Google Scholar] [CrossRef]
- Frezzotti, M.; Salvatore, M.C.; Vittuari, L.; Grigioni, P.; De Silvestri, L. Satellite Image Map: Northern Foothills and Inexpressible Island Area (Victoria Land, Antarctica); Terra Antartica Reports; Terra Antartica Publication: Siena, Italy, 2001; Volume 6, ISBN 8890022191. [Google Scholar]
- Stenni, B.; Serra, F.; Frezzotti, M.; Maggi, V.; Traversi, R.; Becagli, S.; Udisti, R. Snow accumulation rates in Northern Victoria Land (Antactica) by firn core analysis. J. Glaciol. 2000, 46, 541–552. [Google Scholar] [CrossRef]
- Chinn, T.J.H. Polar glacier margin and debris features. Memorie della Societa Geologica Italiana. In Proceedings of the Meeting on Earth Sciences in Antarctica, Saitama, Japan, 9–13 September 1991; Volume 46, pp. 25–44. [Google Scholar]
- Baroni, C. Geomorphological map of the Northern Foothills near the Italian station (Terra Nova Bay, Antarctica). Mem. Della Soc. Geol. Ital. 1987, XXXIII, 195–212. [Google Scholar]
- Baroni, C.; Orombelli, G. Glacial geology and geomorphology of Terra Nova Bay (Victoria Land, Antarctica). Mem. Della Soc. Geol. Ital. 1987, XXXIII, 171–194. [Google Scholar]
- Guglielmin, M. Ground Surface Temperature (GST), Active Layer and Permafrost monitoring in Continental Antarctica. Permafr. Periglac. Process. 2006, 17, 133–143. [Google Scholar] [CrossRef]
- Raffi, R.; Stenni, B.; Flora, O.; Polesello, S.; Camusso, M. Growth processes of an inland Antarctic ice wedge, Mesa Range, northern Victoria Land. Ann. Glaciol. 2004, 39, 1–8. [Google Scholar] [CrossRef]
- Atkins, C. Geomorphological evidence of cold-based glacier activity in South Victoria Land, Antarctica. Geol. Soc. Lond. Spec. Publ. 2013, 381, 299–318. [Google Scholar] [CrossRef]
- Nye, J.F. The mechanics of glacier flow. J. Glaciol. 1952, 2, 82–93. [Google Scholar] [CrossRef]
- Chinn, T.J.H. Glacial History and Glaciology of Terra Nova Bay Area; Logistic Report for K162; Report n. WS 998; Water and Soil Centre: Christchurch, New Zealand, 1985. [Google Scholar]
- Denton, G.H.; Borns, H.W.J.; Grosswald, M.G.; Stuiver, M.; Nichols, R.L. Glacial history of the Ross Sea. Antarct. J. U.S. 1975, 10, 160–164. [Google Scholar]
- Orombelli, G. La prima Spedizione del Programma Nazionale di Ricerche in Antartide. Osservazioni geomorfologiche. Riv. Geograf. Ital. 1986, 93, 129–169. [Google Scholar]
- Orombelli, G.; Baroni, C.; Denton, G.H. Late Cenozoic glacial history of the Terra Nova Bay region, Northern Victoria Land, Antarctica. Geogr. Fis. Din. Quat. 1990, 13, 139–163. [Google Scholar]
- Chinn, T.J.H. Physical hydrology of the Dry Valley Lakes. In Physical and Biogeochemical Processes in Antarctic Lakes. Antarctic Research Series; Green, W.J., Friedmann, E.I., Eds.; American Geophysical Union: Washington, DC, USA, 1993; Volume 59, pp. 1–51. [Google Scholar]
- French, H.M.; Guglielmin, M. Frozen ground phenomena in the vicinity of Terra Nova Bay, Northern Victoria Land, Antarctica: A preliminary report. Geogr. Ann. 2000, 82, 513–526. [Google Scholar] [CrossRef]
- French, H.M. The Periglacial Environment, 3rd ed.; John Wiley & Sons Limited: Chichester, UK, 2007; Volume 458. [Google Scholar]
- Guglielmin, M.; Lewkovicz, A.G.; French, M.F.; Strini, A. Lake-ice blisters, Terra Nova Bay Area, Northern Victoria Land, Antarctica. Geogr. Ann. 2009, 91, 99–111. [Google Scholar] [CrossRef]
- Ullman, S. The interpretation of structure from motion. Proc. R. Soc. Lond. Ser. B Biol. Sci. 1979, 203, 405–426. [Google Scholar] [CrossRef]
- Seitz, S.; Snavely, N.; Szeliski, R. Photo tourism: Exploring photo collections in 3D. ACM Trans. Graph. 2006, 25, 835–846. [Google Scholar] [CrossRef]
- Zanutta, A.; Baldi, P.; Bitelli, G.; Cardinali, M.; Carrara, A. Qualitative and quantitative photogrammetric techniques for multi-temporal landslide analysis. Ann. Glaciol. 2006, 49, 1067–1079. [Google Scholar] [CrossRef]
- D’Agata, C.; Zanutta, A. Reconstruction of the recent changes of a debris covered glacier (Brenva, Mont Blanc Massif, Italy) using indirect source: Methods, results and validation. Glob. Planet. Chang. 2007, 56, 1–2. [Google Scholar] [CrossRef]
- Glen, J.W.; Paren, J.G. The electrical properties of snow and ice. J. Glaciol. 1975, 15, 15–38. [Google Scholar] [CrossRef]
- Bogorosky, V.V.; Benteley, C.R.; Gudmandsen, P.E. Radioglaciology, Glaciology and Quaternary Geology; Springer: Dordrecht, The Netherlands, 1985; Volume 1, p. 272. [Google Scholar]
- Herring, T. MATLAB Tools for viewing GPS velocities and time series. GPS Solut. 2003, 7, 194–199. [Google Scholar] [CrossRef]
- Perissin, D.; Wang, Z.; Wang, T. SARPROZ InSAR Tool for Urban Subsidence/manmade Structure Stability Monitoring in China. In Proceedings of the ISRSE 2011, Sidney, Australia, 10–15 April 2011. [Google Scholar]
- Perissin, D.; Wang, T. Repeat-Pass SAR Interferometry with Partially Coherent Targets. IEEE Trans. Geosci. Remote Sens. 2012, 50, 271–280. [Google Scholar] [CrossRef]
- Gandolfi, S.; Meneghel, M.; Salvatore, M.C.; Vittuari, L. Kinematic global positioning system to monitor small Antarctic glaciers. Ann. Glaciol. 1997, 24, 326–330. [Google Scholar] [CrossRef][Green Version]
- Bondesan, A.; Meneghel, M.; Salvatore, M.C. Local glacier snout monitoring in Northern Victoria Land, Antarctica; Terra Antartica Reports; Terra Antartica Publication: Siena, Italy, 2003; Volume 8, pp. 1–4. ISBN 88-88395-02-4. [Google Scholar]
- Diolaiuti, G.; Smiraglia, C.; Vassena, G.; Motta, M. Dry calving processes at the ice cliff of Strandline Glacier northern Victoria Land, Antarctica. Ann. Glaciol. 2004, 39, 201–208. [Google Scholar] [CrossRef][Green Version]
- Orombelli, G. Holocene environmental changes at Terra Nova Bay (Victoria Land, Antarctica). Mem. Soc. Geol. Ital. 1990, 34, 159–162. [Google Scholar]
- Rocchi, S.; Di Vincenzo, G.; Ghezzo, C. The Terra Nova Intrusive Complex, Victoria Land, Antarctica (with 1:50,000 geopetrographic map); Terra Antartica Reports; Terra Antartica Publication: Siena, Italy, 2004; Volume 10, pp. 1–51. ISBN 88-88395-07-5. [Google Scholar]
- French, H.M.; Guglielmin, M. Observations on the ice-marginal, periglacial geomorphology of Terra Nova Bay, Northern Victoria Land, Antarctica. Permafr. Periglac. Process. 1999, 10, 331–347. [Google Scholar] [CrossRef]
- Zirizzotti, A.; Cafarella, L.; Urbini, S. Ice and bedrock characteristics underneath Dome C (Antarctica) from RES data analysis. IEEE Trans. Geosci. Remote Sens. 2011, 50, 37–43. [Google Scholar] [CrossRef]
- Badgeley, J.A.; Pettit, E.C.; Carr, C.G.; Tulaczyk, S.; Mikucki, J.A.; Lyons, W.B.; MIDGE Science Team. An englacial hydrologic system of brine within a cold glacier: Blood Falls, McMurdo Dry Valleys, Antarctica. J. Glaciol. 2017, 63, 387–400. [Google Scholar] [CrossRef]
- Rutishauser, A.; Blankenship, D.D.; Sharp, M.; Skidmore, M.L.; Greenbaum, J.S.; Grima, C.; Schroeder, D.M.; Young, D.A. Discovery of a hypersaline subglacial lake complex beneath Devon Ice Cap, Canadian Arctic. Sci. Adv. 2018, 4, eaar4353. [Google Scholar] [CrossRef]
- Lyons, B.W.; Mikucki, J.A.; German, L.A.; Welch, K.A.; Welch, S.A.; Gardner, C.B.; Tulaczyk, S.M.; Pettit, E.C.; Kowalski, J.; Dachwald, B.; et al. The Geochemistry of Englacial Brine from Taylor Glacier, Antarctica. J. Geophys. Res. 2019, 124. [Google Scholar] [CrossRef]
- Yang, J.W.; Han, Y.; Orsi, A.J.; Kim, S.J.; Han, H.; Jang, Y.R.Y.; Moon, J.; Choi, T.; Hur, S.D.; Ahn, J. Surface temperature in twentieth century at the Styx Glacier, northern Victoria Land, Antarctica, from borehole thermometry. Geophys. Res. Lett. 2018, 45, 9834–9842. [Google Scholar] [CrossRef]
© 2019 by the authors. Licensee MDPI, Basel, Switzerland. This article is an open access article distributed under the terms and conditions of the Creative Commons Attribution (CC BY) license (http://creativecommons.org/licenses/by/4.0/).