Article

Impact of Climate Variability on Flowering Phenology and Its Implications for the Schedule of Blossom Festivals

Key Laboratory of Land Surface Pattern and Simulation, Institute of Geographic Sciences and Natural Resources Research, Chinese Academy of Sciences, 11A, Datun Road, Chaoyang District, Beijing 100101, China
*
Authors to whom correspondence should be addressed.
Sustainability 2017, 9(7), 1127; https://doi.org/10.3390/su9071127
Submission received: 24 May 2017 / Revised: 23 June 2017 / Accepted: 25 June 2017 / Published: 27 June 2017

Abstract

:
Many tourism destinations characterized by spring blossom festivals (e.g., cherry blossom festival) became increasingly popular around the world. Usually, spring blossom festivals should be planned within the flowering period of specific ornamental plants. In the context of climate and phenological change, whether the administrators of tourism destinations had perceived and responded to the flowering phenological variability is still unknown. Using the data of climate, blossom festival dates (BFD) of three tourist attractions, and first flowering dates (FFD) of specific species in Beijing, China, we analyzed the flowering phenological response to temperature and the impact of FFDs on BFDs from 1989 to 2016. It was shown that the flowering time of ornamental plants varied significantly among years in response to temperature variability. The administrators of Beijing Botanical Garden and Yuyuantan Park determined peach BFD and cherry BFD based on their experience rather than FFD of corresponding plants. Therefore, the mismatch between BFD and FFD occurred frequently at these two locations. However, the administrator of Jingshan Park scheduled the peony BFD following the variance of FFD of tree peony. These results revealed the various perceptions of climate change impacts for stakeholders of blossom festivals.

1. Introduction

Due to the natural and anthropogenic substances and processes, the global surface temperature increased by 0.85 °C from 1880 to 2012 [1]. Global warming has impacted numerous biophysical systems such as cryosphere, terrestrial biological systems, agriculture and forestry [2]. As a vital component of the global economy, nature-based tourism relying on a high diversity of tourism resources was also affected by climate change in various ways. Warmer temperatures could impact tourism through altering seasonality of destinations, heat stress for tourists, and plant–insect relationship and distribution [3,4,5]. For example, in Rocky Mountain National Park, the United States, the net effect of climate change on visitation was slightly positive based on a visitor survey [6]. Canada’s national parks were anticipating a higher visitation of 6–8% under two climate change scenarios for the 2020s [7].
Many tourism destinations around the world are characterized by spring blossom festivals or events. For example, the national cherry blossom festival in Washington, DC, USA, attracted more than 1.5 million tourists in recent years [8]. More than 1.18 million people visited Beijing Botanical Garden, China to attend the peach blossom festival in 2017 [9]. Since these blossom festivals are culturally and economically important events, they should be timed around specific phenophases, such as flowering date of cherry or peach trees [10]. In temperate regions, these phenophases are very sensitive to small changes in temperature [11,12,13]. The advancement in flowering dates is estimated as 1 to 12 days for each 1 °C increase in spring temperature [14,15,16]. Recent studies demonstrated that the flowering date of main woody plants in temperate regions shifted towards earlier by a rate of 2.0 to 9.6 days decade−1 over the last few decades across Europe [17,18], East Asia [19,20], and North America [21,22].
Rapid climate change may cause a mismatch between the date of flowering and blossom festival. For example, the cherry trees have been blooming earlier in recent years, which caused a mismatch between peak blooms and the parade that highlights the end of the festival [10]. Such conditions would reduce the degree of satisfaction of visitors and success of the events. Therefore, the blossom festivals need to be planned as nearly as the flowering period of corresponding ornamental plants. To date, blossom festivals are mainly administrated by local organizations. For example, the cherry blossom festival in Washington DC is organized by the National Cherry Blossom Festival, Inc. (Washington, DC, USA) [8]. In Japan, cherry blossom festivals are organized by the staffs of local governments from Department of Tourism or board members of the Tourism Association [23]. Whether the organizers of these festivals have perceived the climate-associated phenological variation is still unknown.
As the capital of China, Beijing has a wealth of tourism resources. Among numerous tourist attractions, the destinations with spring blossom festivals become increasingly popular and account for a considerable portion of tourism income [24]. In Beijing, these festivals are organized by the administrative office of the tourist attractions. We wonder whether the organizers could perceive early or late spring flowering time and how they respond to it. In this study, we investigated variances in the first flowering dates of three key ornamental plants in Beijing since 1989 and highlighted the role of temperature in modulating flowering phenology. Subsequently, we analyzed the changes in start dates of blossom festivals at three tourist attractions and their relationship with flowering phenology; whether there was a good match between flowering time and festivals; and why matches or mismatches occurred.

2. Materials and Methods

2.1. Study Locations

All tourist attractions investigated in this study are located in Beijing, China. The mean temperature of the warmest month (July) and coldest month (January) in Beijing are 26.7 °C and 3.1 °C, respectively [25]. The annual mean precipitation was 532 mm, 78.6% of which occurs during summer and early autumn (June–September). Under this temperate monsoon climate, most of the plants began to flower in spring, especially in April [26,27]. Three famous tourist attractions of Beijing, where the blossom festivals of particular ornamental species were held every year, were selected for investigation, including the Beijing Botanical Garden, Jingshan Park, and Yuyuantan Park (Table 1). The main ornamental plants at these locations are peaches (Prunus spp.), peonies (Paeonia spp.), and cherries (Prunus spp.), respectively.

2.2. Phenological and Meteorological Data

The phenological data from 1989 to 2016 were obtained from the China Phenology Observation Network (CPON). As many varieties of peach, peony, and cherry species were grown at the three locations, CPON did not observe the flowering phenology of all varieties. The only available data is the first flowering date (FFD) of three representative species (Table S1) including Chinese wild peach (Prunus davidiana), tree peony (Paeonia suffruticosa), and Yoshino cherry (Prunus yedoensis). All these species are woody plants pollinated by insects. According to the observation criteria of CPON [28], FFD was defined as the date when at least one fresh flower blooms at any cluster for the whole plant. It was worth noting that the FFD data were missing during 1998–2000 due to the observation interruption. Thus, the observation data involved two periods including 1989–1997 and 2001–2016.
Monthly mean temperatures in Beijing from 1989 to 2016 were obtained from China Meteorological Data Service Center (Table S2).
Three blossom festivals were investigated, including peach blossom festival (since 1989) at Beijing Botanical Garden, peony blossom festival at Jingshan Park (since 2001), and cherry blossom festival (since 1989) at Yuyuantan Park. The first day of the blossom festival date (hereafter called BFD) was were obtained from the Yearbook of Beijing’s Parks (Table S3). How the administrators of these attractions establish BFD is unknown. We expect that climate and flowering phenology would impact their decision making for the festival schedule.

2.3. Statistical Analyses

First, we analyzed the mean value, amplitude, and trends of FFD of specific species and BFD at the three locations. The trends in FFD or BFD over time were computed as linear regression coefficients for the time series.
Second, to study the relationship between flowering phenology and temperature, FFDs of three key species were correlated by Pearson’s correlation with mean temperatures of one month, two months, and three months before the average onset dates. The highest Pearson’s correlation coefficient (R) of these three months served as a measure for the temperature responsiveness of the respective phenophase. The temperature sensitivity of FFD was measured as slopes of linear regressions of the annual FFD against the mean temperature of the best-correlated months.
Third, we investigated the factors impacting the BFD. We expect that three factors may affect the determination of BFD for administrators, including FFD of the current year, FFD of the previous year, and BFD of the previous year. Thus, BFD was correlated to these three factors to examine which one impacted the BFD most significantly.
At last, we investigated the matching degree of BFD and FFD for each location. The year-to-year BFD or FFD could be divided into three types by the following equations
x i x ¯ > S
| x i x ¯ | S
x i x ¯ < S
where x i represents FFD or BFD in year i. x ¯ is the multi-year mean of FFD or BFD. S is the standard deviation of FFD or BFD. Equations (1)–(3) represent types of later, normal, and earlier FFD (BFD), respectively. If FFD and BFD belong to the same type in a particular year, this year is marked as a matched year. Otherwise, a mismatch occurs. In such a way, the year-to-year changes in matching degree between FFD and BFD could be calculated.

3. Results

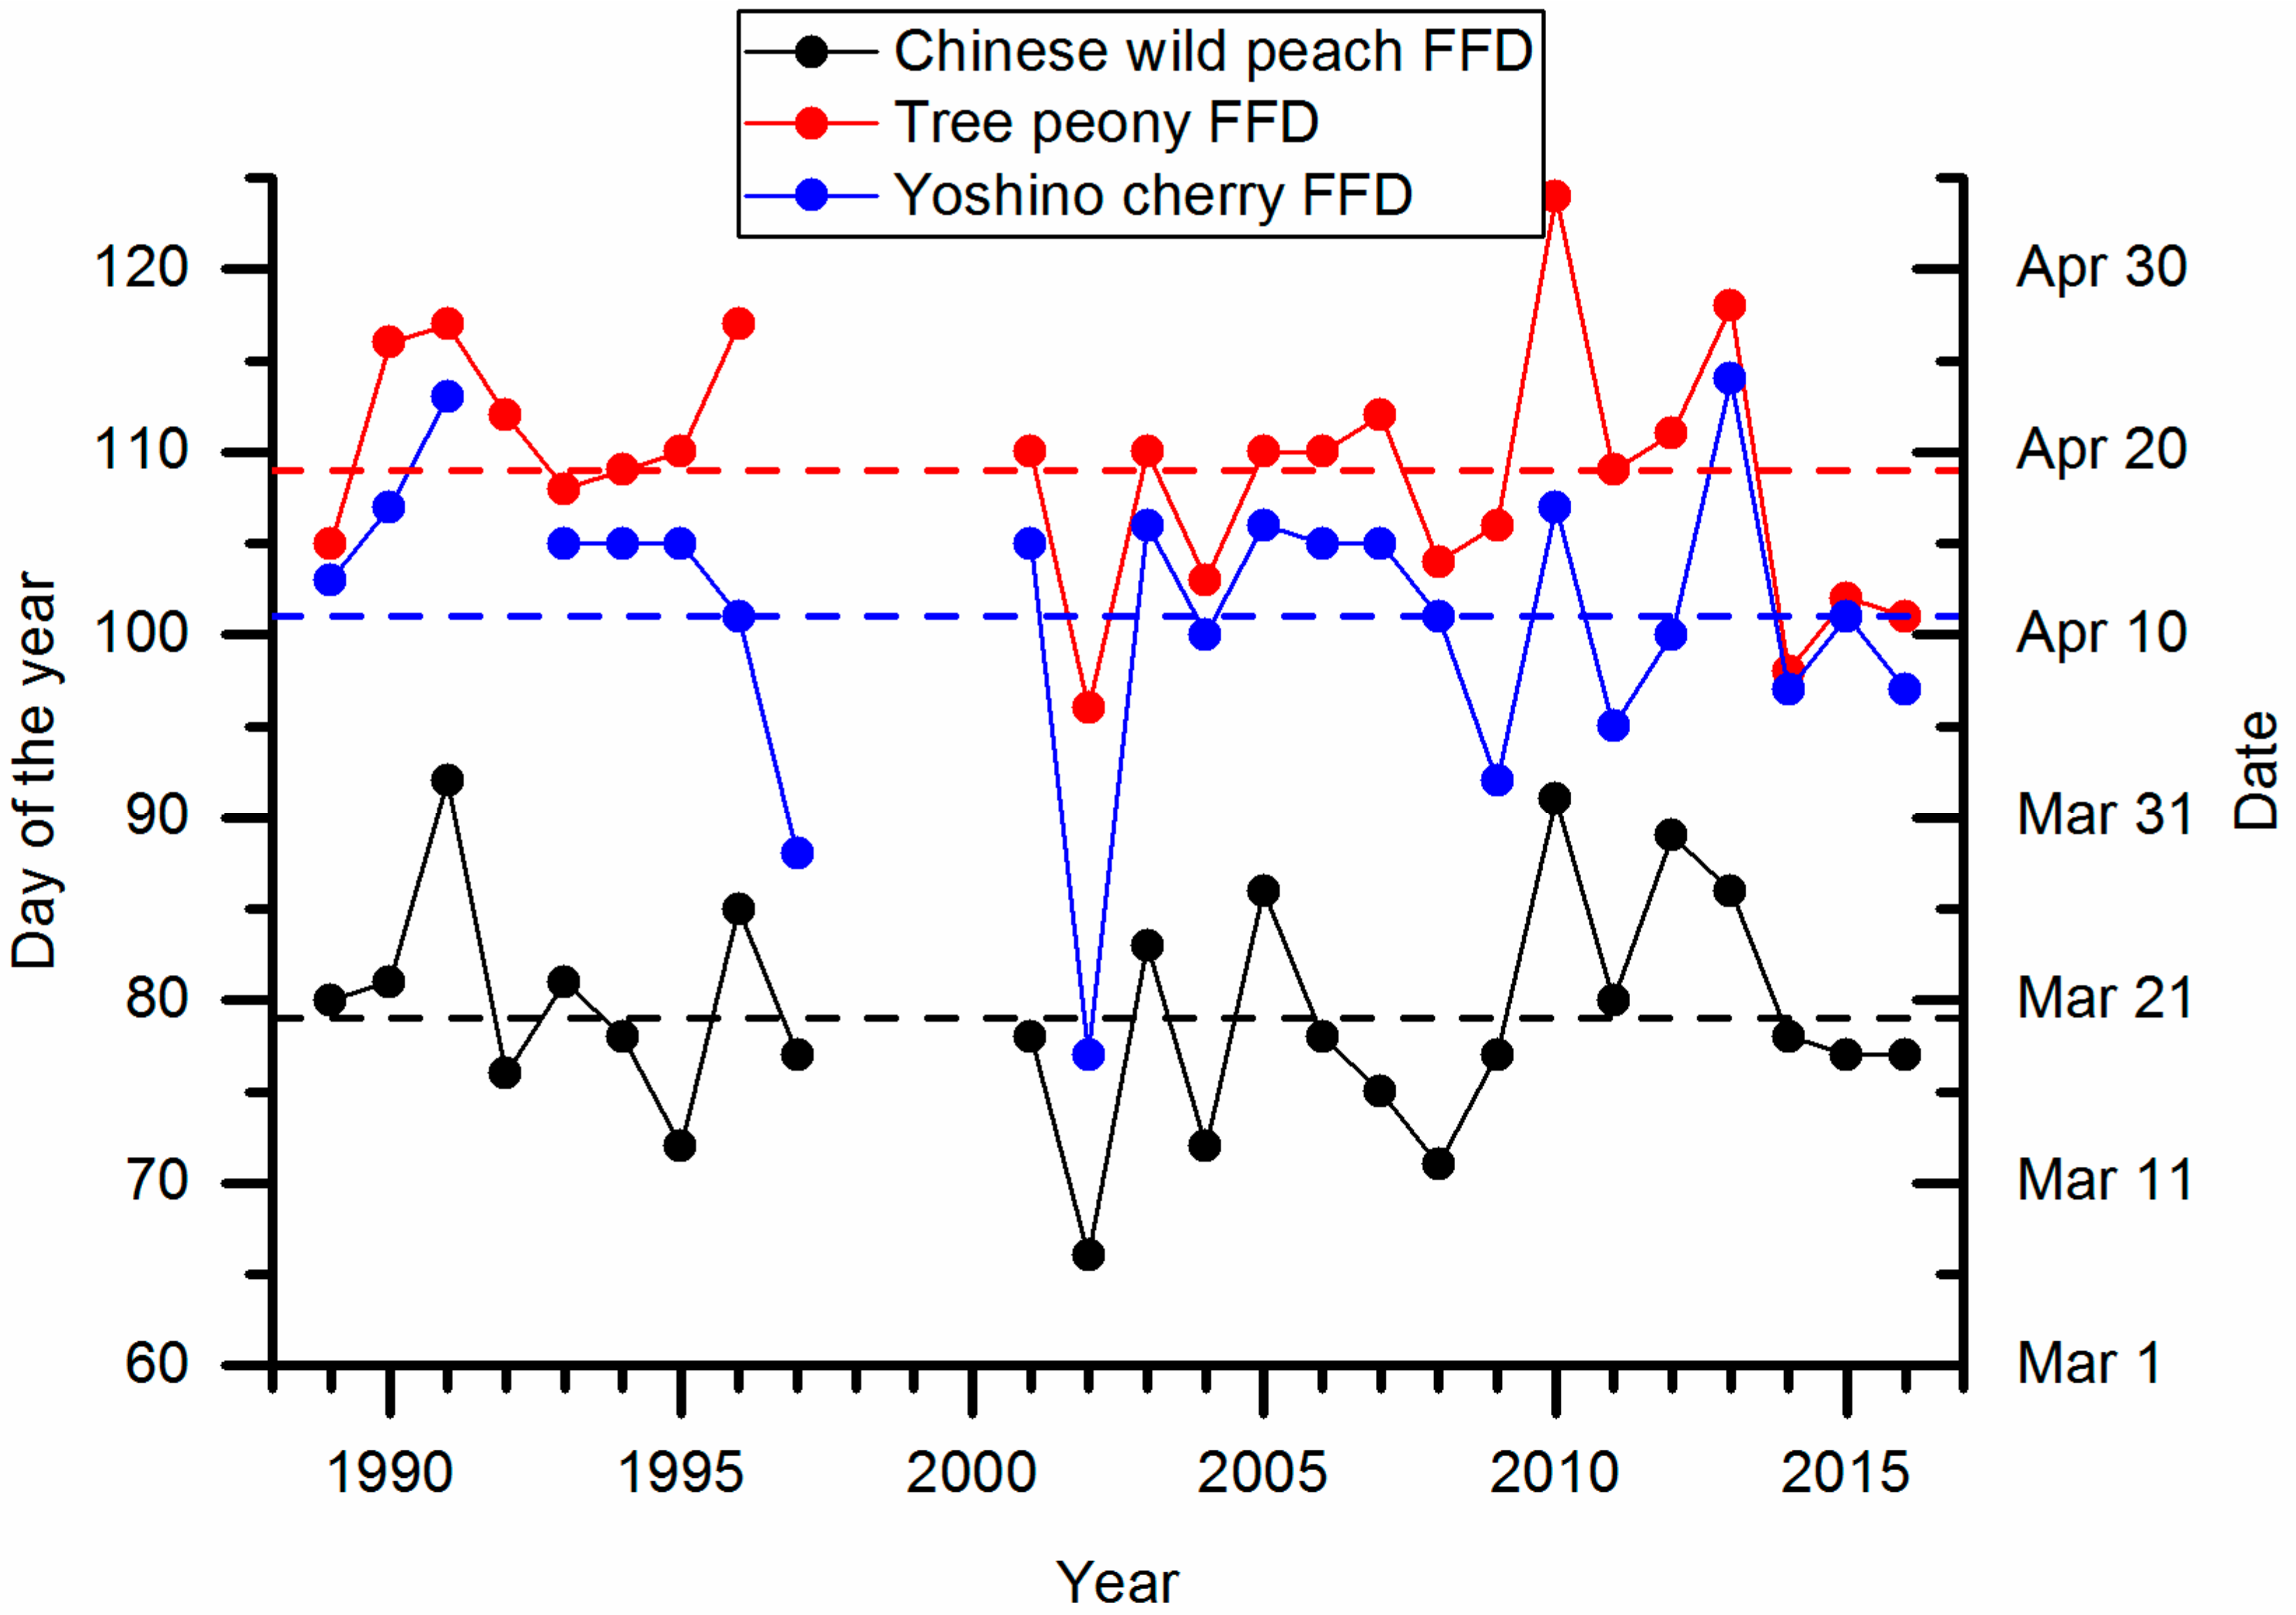
3.1. Changes in First Flowering Date of Ornamental Plants

During 1989–2016, mean FFDs of Chinese wild peach, tree peony, and Yoshino cherry were 20 March, 19 April, and 11 April, respectively (Figure 1). The FFD of three species showed a high interannual variance. The maximum differences in FFD of three species among years reached 26, 28, and 37 days, respectively. No significant linear trends were found in time series of FFD. From 1989 to 1996, most FFD of three species was later than the long-term mean. During 2001–2009, FFD fluctuated around the long-term mean. After 2010, FFD was obviously later than the long-term mean except in the last three years (2014–2016).

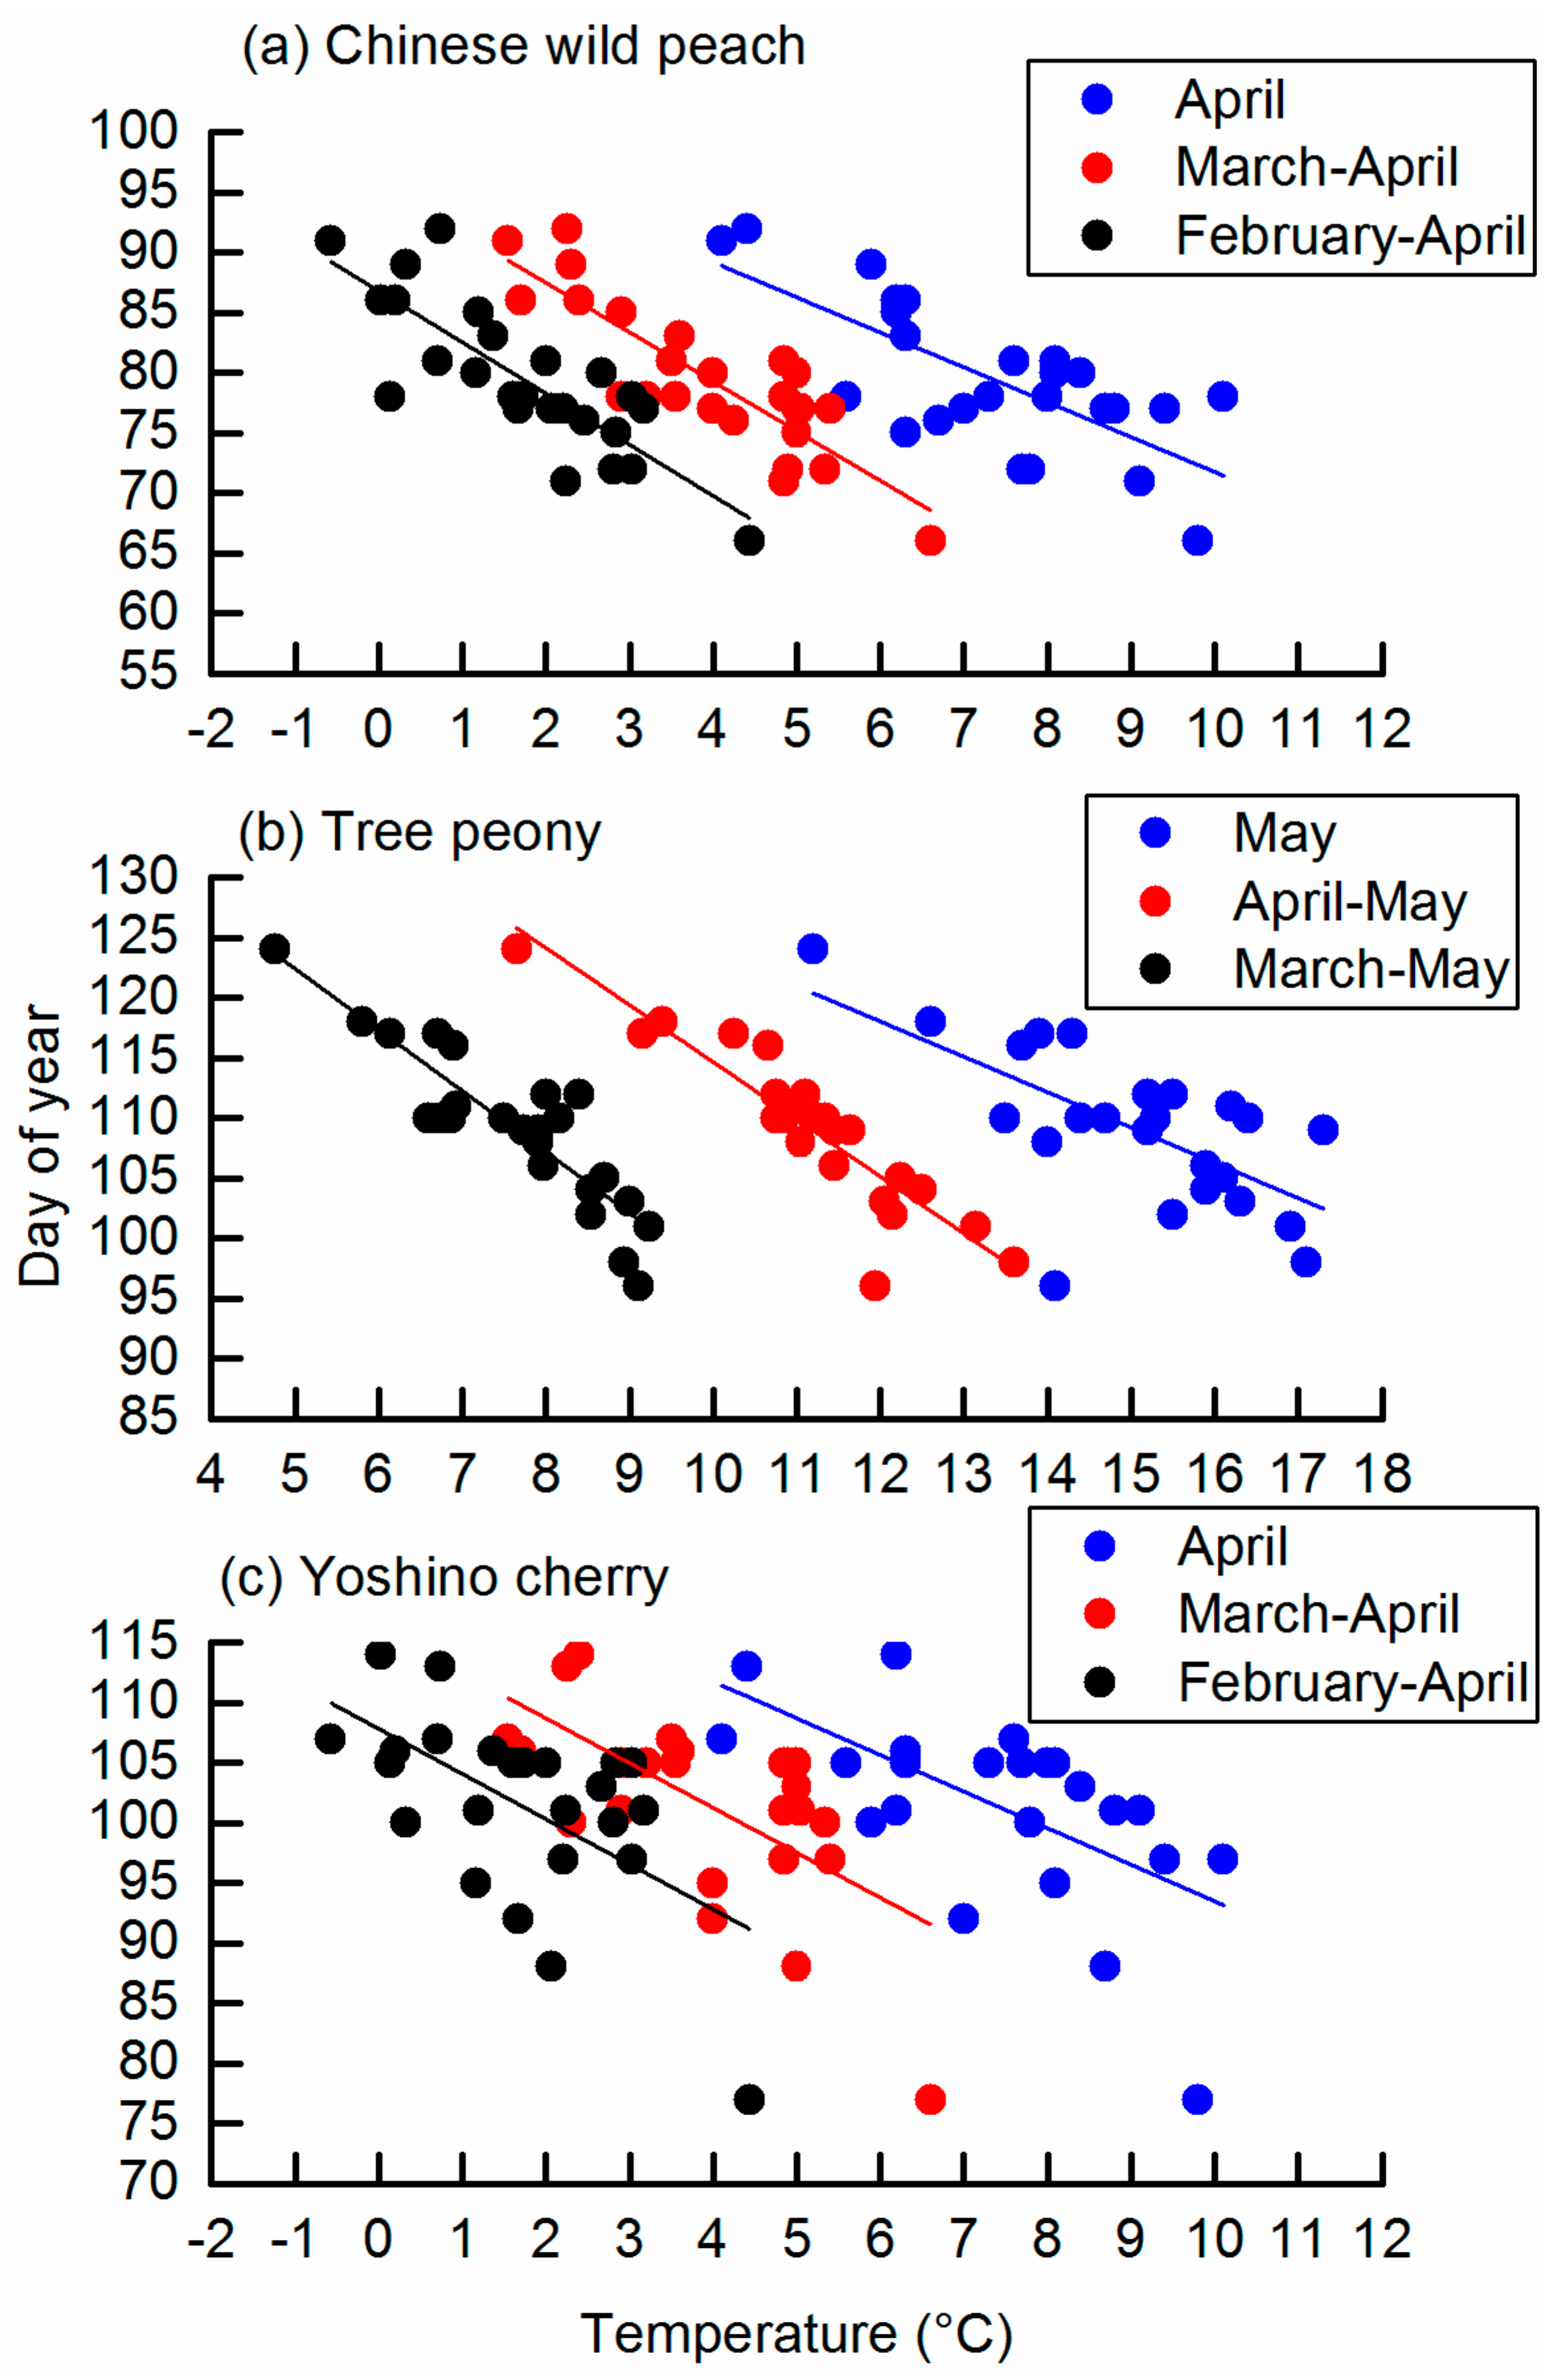
3.2. Flowering Phenology in Response to Temperature Change

The flowering time of three species (Chinese wild peach, tree peony, and Yoshino cherry) correlated negatively and significantly with the temperature of the preceding months (p < 0.01, Figure 2), suggesting that earlier FFD was associated with higher temperatures. For all the three species, mean temperature during two months before mean FFD impacted the flowering time most significantly with the strongest Pearson’s R (Table 2). The temperature of the preceding two months could explain a large part of the interannual variance of FFD with R2 ranging from 0.40 to 0.83. 1 °C increase in preseason temperature could lead to an advance of 3.73 to 4.75 days in the FFDs of these three species (Table 2).

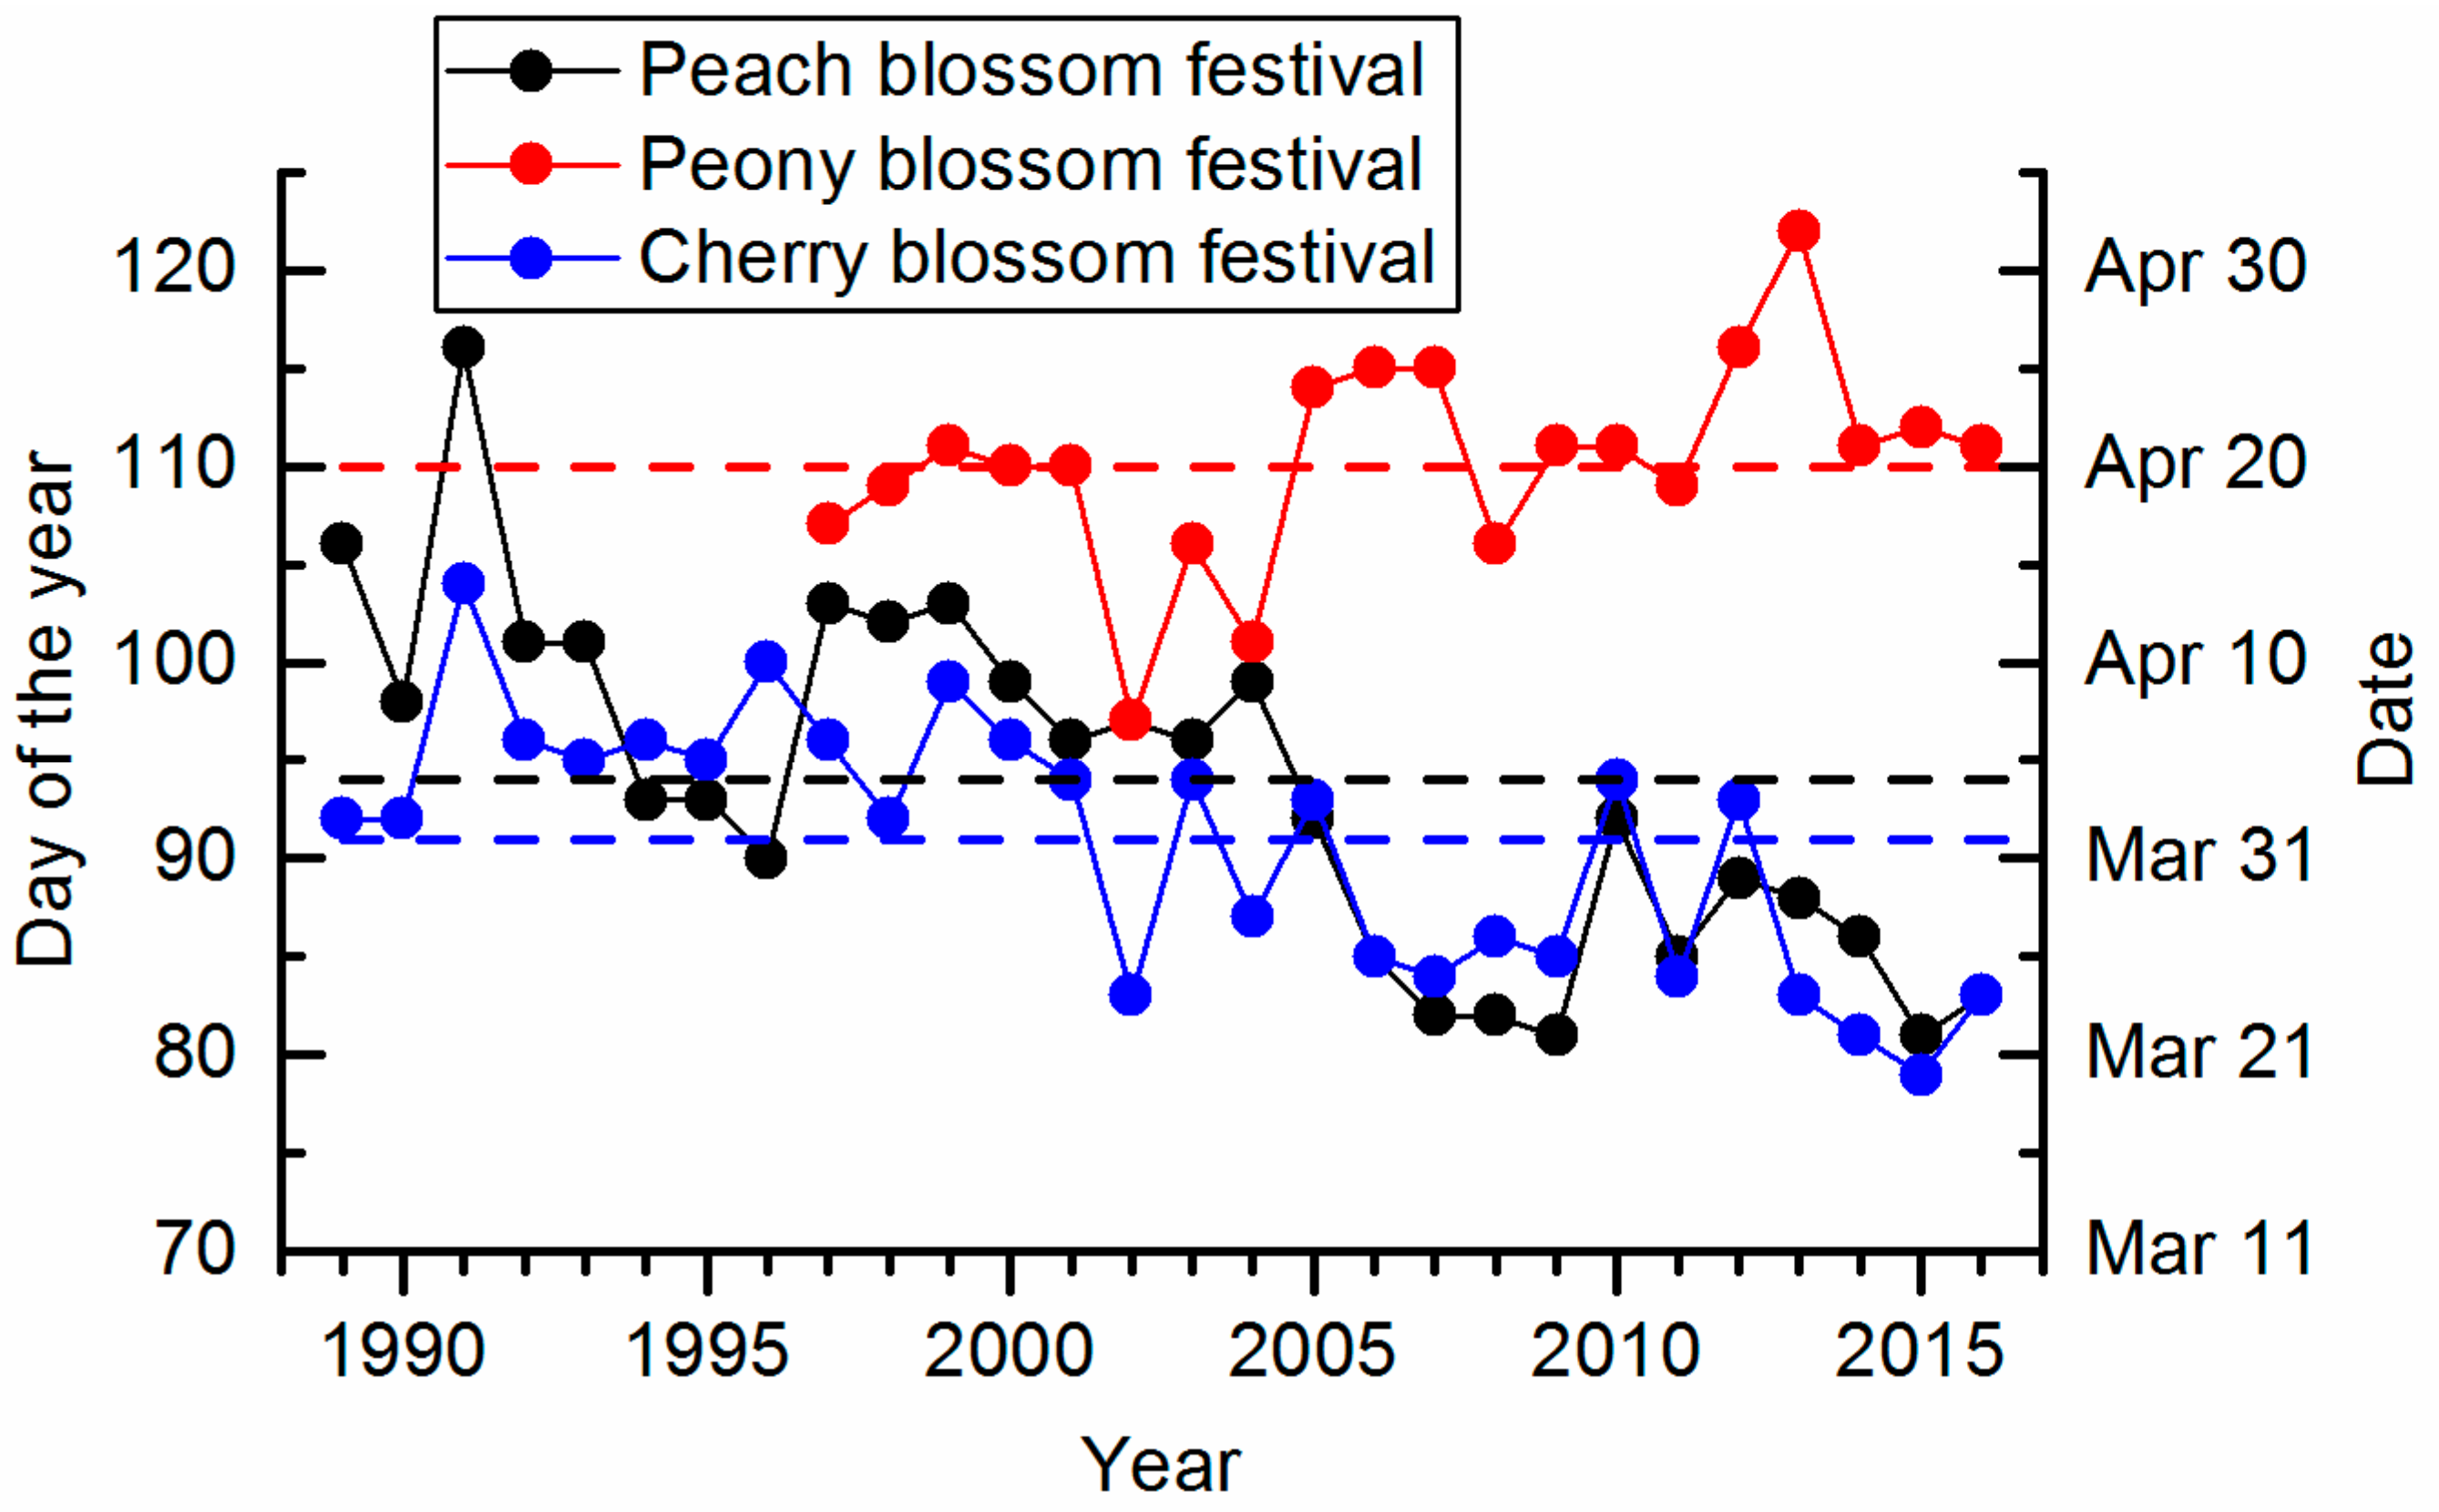
3.3. Changes in Blossom Festival Date

During the study period, mean BFD of peach, peony, and cherry was 4 April, 20 April, and 1 April at Beijing Botanical Garden, Jingshan Park, and Yuyuantan Park, respectively (Figure 3). The amplitude of BFD variations among years reached 35, 25, and 25 days at the three locations, respectively. An apparent shift towards earlier peach and cherry BFD occurred in 2005. Thus, peach and cherry BFDs advanced significantly at a rate of 8.4 (R2 = 0.62, p < 0.01) and 5.8 (R2 = 0.55, p < 0.01) days decade−1, respectively, from 1989 to 2016. Peony BFD was evidently earlier or later than the long-term mean in specific periods, such as an earlier period of 2002–2004 and a later period of 2012–2013, but an overall delayed trend of 3.9 days decade−1 from 2001 to 2016 was found (R2 = 0.18, p = 0.06).

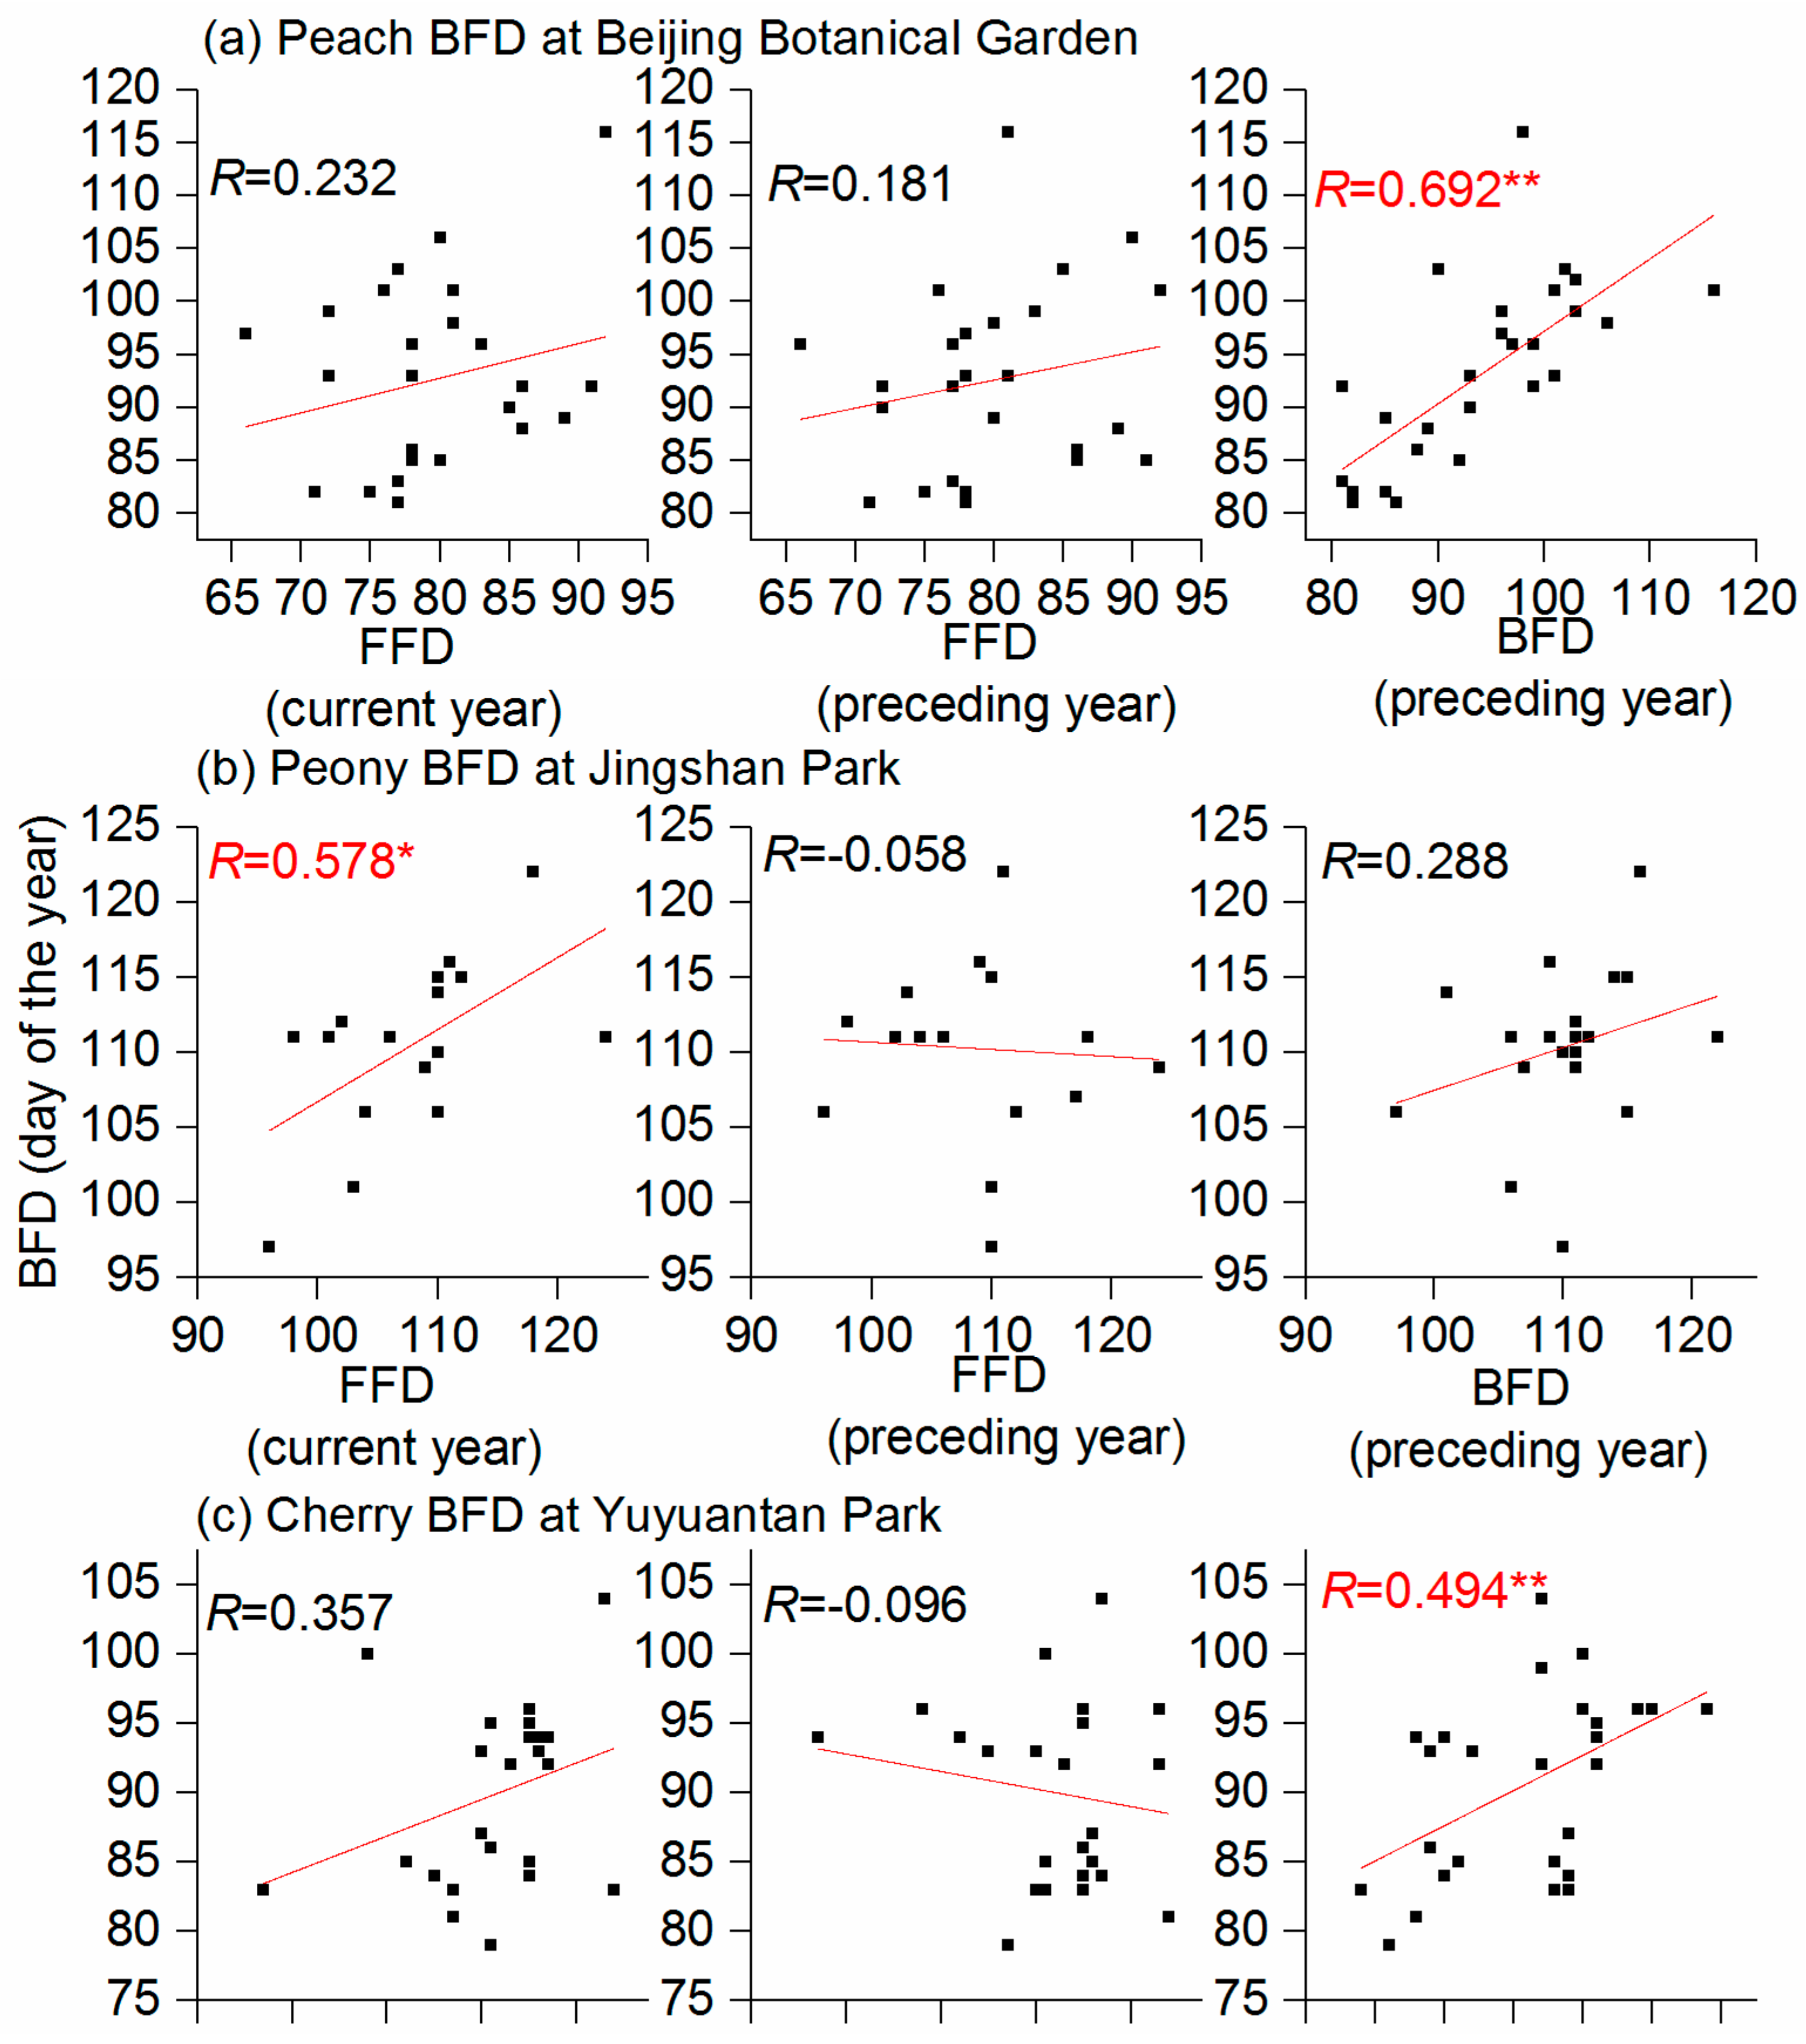
3.4. Impact of Flowering Phenology on Blossom Festival Date

The peach and cherry BFD was significantly correlated with the BFD of the preceding year (p < 0.01, Figure 4). However, there is no significant relationship between BFD and FFD in the current or preceding year for Chinese wild peach and Yoshino cherry. Therefore, the administrators of the Beijing Botanical Garden and Yutuantan Park determined the peach and cherry BFDs based on their experience in the preceding year rather than the actual flowering date. Conversely, the peony BFD was significantly correlated with FFD of tree peony in the current year (R = 0.578, p < 0.05) rather than the FFD or BFD of the preceding year (Figure 4).

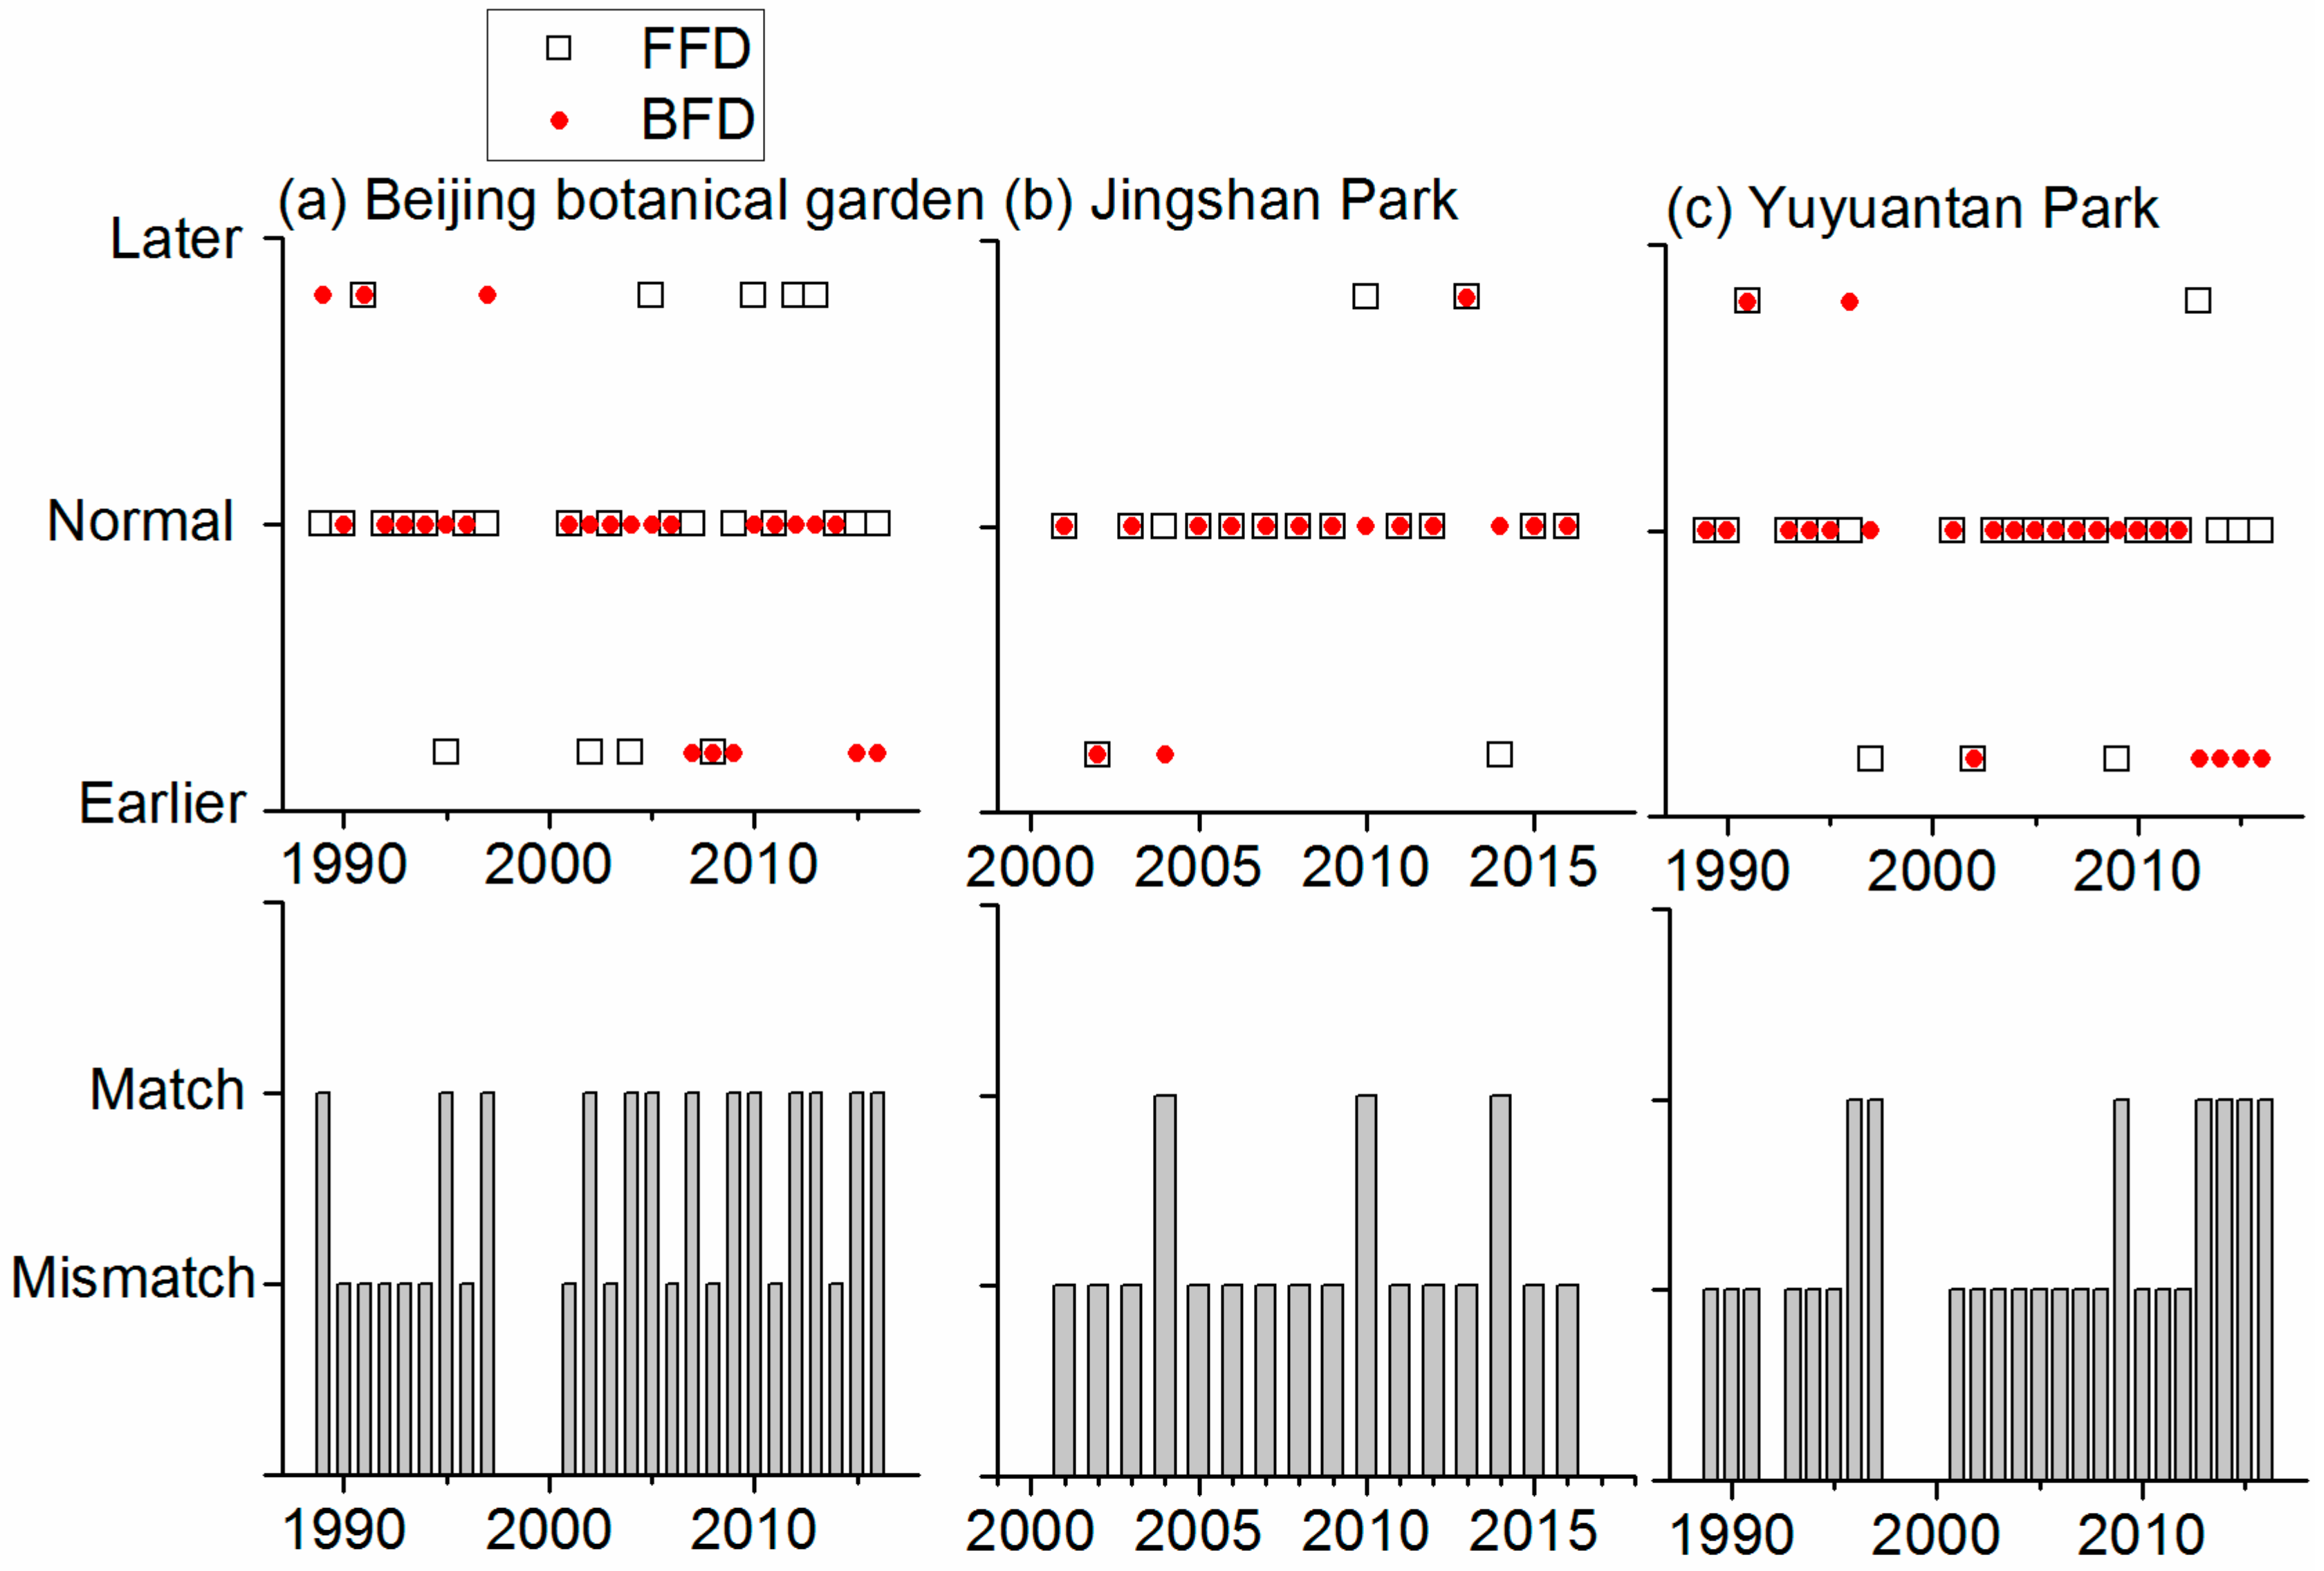
3.5. Matching Degree between BFD and FFD

We compared matching degree between BFD and FFD for two observation periods of FFD (1989–1997 and 2001–2016). From 1989–1997, the mismatch between peach BFD and FFD of Chinese wild peach at Beijing Botanical Garden occurred in three years (1989, 1995, and 1997), which accounted for 33.3% of the total number of years (Figure 5a). During 2001–2016, the mismatch occurred in 10 years, which accounted for 62.5% of the total number of years. Therefore, the matching degree between BFD and FFD decreased in recent years at Beijing Botanical Garden. At Jingshan Park, the matching degree between peony BFD and FFD of tree peony was high (Figure 5b). The mismatch only occurred in three years (2004, 2010, and 2014) over the study period (2001–2016). At Yuyuantan Park, two years (22.2%) belonged to the mismatched condition before 1997, but it increased to five years from 2001 to 2016 (29.4%, Figure 5c). Overall, different locations displayed different matching degree between BFD and FFD. The proportion of mismatched years over the study period reached 46.4, 18.8, and 25.0% at Beijing Botanical Garden, Jingshan Park, and Yuyuantan Park, respectively.

4. Discussion

This study revealed that the FFD of ornamental plants in Beijing exhibited no significant linear trends from 1989 to 2016. However, other studies using the FFD time series since 1963 found clear advancing trends in FFD of woody plants in Beijing [26]. In fact, an abrupt temperature increase occurred in the late 1980s in Beijing [26]. Therefore, although an overall significant earlier FFD was found since 1963, such a trend cannot be detected from 1989 to 2016 due to a relatively short time series. This result indicated that the period influenced the trend estimate of phenophases, which was also suggested by other studies [12,19,29]. Although no significant trends were found, FFD of three ornamental plants still had a strong interannual variance with a standard deviation of 6.3 to 7.9 days, which was in accordance with FFD time series observed in other parts of the world [12,30,31,32]. Such a high variability in the flowering date further hampers the detection of trends in flowering phenology.
The year-to-year variability of FFD is impacted by the preseason temperature, especially two months before FFD onset. Thus, the temperature is an important driving factor of the flowering phenology in Beijing, like other areas of temperate Northern Hemisphere [33,34]. In this context of climate-associated flowering phenological variance, we expect that the administrators from the administrative office of parks or gardens, who organized the blossom festivals, would adjust their schedule of BFD. As expected, the amplitude of BFD among years reached 35, 25, and 25 days at the Beijing Botanical Garden, Jingshan Park, and Yuyuantan Park, respectively. The peach and cherry BFD even exhibited a significant advancing trend of 8.4 and 5.8 days decades−1, respectively, from 1989 to 2016.
Although the BFD exhibited significant changes, whether such changes are impacted by flowering date of ornamental plants was uncertain. This study proved that not all the administrators of the tourist attractions were aware of the climate-associated phenological variance. At Jingshan Park, the peony BFD tracked the FFD of tree peony well. However, the administrators of Beijing Botanical Garden and Yuyuantan Park were conservative. They determined the BFD more likely according to the date of the preceding year. Once the BFD was settled on an earlier date, they tended to not change the date too much in the coming years. This result was similar to the results on cherry blossom festival in Japan. Through personal interviews, it was found that most organizers of the festivals in Kakunodate were concerned about global warming and its impact on cherry blossom times while organizers of festivals in Nakano and Komoro felt it was unimportant if flower timing affected the festival schedule [23].
If the start dates of the festival were earlier or later than the flowering date, the mismatch between BFD and FFD occurred and would make visitors miss flowers. If such mismatches occurred too frequently, it would reduce the number of visitors and thus reduce revenues of shops, booths, and hotels around the tourist attractions. At Beijing Botanical Garden, mismatches had happened very frequently in recent years, which partly contributed to an 11.43% reduction in the number of visitors in 2017 compared to 2016 [9]. At Jingshan Park and Yuyuantan Park, the administrators of blossom festivals could to some extent perceive early or later flowering time. The high matching degree between BFD and FFD is conducive to the sustainable development of spring flower tour at these attractions.
Overall, flowering time of ornamental plants showed a strong interannual variation in response to climate variability. The administrators of one tourist attraction (Jingshan Park) could respond the climate-associated flowering time and plan the blossom festival adequately, while others (Beijing Botanical Garden and Yuyuantan Park) determined BFD according to their experiences and could lead to a mismatch between BFD and flowering time. To avoid future mismatches between festivals and flowering dates, the actions of different institutions are needed. The local meteorological department could provide observed and predicted temperature data. Based on these data, the research institutes which manage the phenological observation network could develop phenological models (e.g., [35,36]) to provide an accurate short-term prediction of flowering dates of ornamental plants, and then the administrative offices of tourist attractions could select the predicted flowering date to hold the blossom festivals.

Supplementary Materials

The following are available online at www.mdpi.com/2071-1050/9/7/1127/s1, Table S1: First flowering date of three ornamental plants in Beijing (1989–2016), Table S2: Monthly temperature from 1989 to 2016 in Beijing, Table S3: Start date of blossom festivals at three tourist attractions in Beijing.

Acknowledgments

This research was supported by National Natural Science Foundation of China (Nos. 41601047, 41401071) and National Major Scientific Instruments Development Project (No. 41427805). These programs funded the costs to publish in open access.

Author Contributions

H.W. and Q.G. conceived and designed the research; L.W. and Z.N. collected and analyzed the data; all authors wrote and reviewed the paper.

Conflicts of Interest

The authors declare no conflict of interest.

References

  1. Intergovernmental Panel on Climate Change. Summary for Policymakers. In Climate Change 2013: The Physical Science Basis; Contribution of Working Group I to the Fifth Assessment Report of the Intergovernmental Panel on Climate Change; Stocker, T.F., Qin, D., Plattner, G.K., Tignor, M.M.B., Allen, S.K., Boschung, J., Nauels, A., Xia, Y., Bex, V., Midgley, P.M., Eds.; Cambridge University Press: Cambridge, UK, 2013; pp. 3–29. [Google Scholar]
  2. Rosenzweig, C.; Casassa, G.; Karoly, D.J.; Imeson, A.; Liu, C.; Menzel, A.; Rawlins, S.; Root, T.L.; Seguin, B.; Tryjanowski, P. Assessment of observed changes and responses in natural and managed systems. In Climate Change 2007: Impacts, Adaptation and Vulnerability; Contribution of Working Group II to the Fourth Assessment Report of the Intergovernmental Panel on Climate Change; Parry, M.L., Canziani, O.F., Palutikof, J.P., van der Linden, P.J., Hanson, C.E., Eds.; Cambridge University Press: Cambridge, UK, 2007; pp. 79–131. [Google Scholar]
  3. World Tourism Organization and the United Nations Environment Programme. Climate Change and Tourism: Responding to Global Challenges; The World Tourism Organization: Madrid, Spain, 2008; p. 61. [Google Scholar]
  4. Ge, Q.; Dai, J.; Liu, J.; Zhong, S.; Liu, H. The effect of climate change on the fall foliage vacation in China. Tour. Manag. 2013, 38, 80–84. [Google Scholar] [CrossRef]
  5. Chen, F.; Liu, J.; Ge, Q. Pulling vs. pushing: Effect of climate factors on periodical fluctuation of Russian and South Korean tourist demand in Hainan Island, China. Chin. Geogr. Sci. 2017, 27, 648–659. [Google Scholar]
  6. Richardson, R.B.; Loomis, J.B. Adaptive recreation planning and climate change: A contingent visitation approach. Ecol. Econ. 2004, 50, 83–99. [Google Scholar] [CrossRef]
  7. Scott, D.; Jones, B. Climate Change, Seasonality and Visitation to Canada’s National Parks. J. Parks Recreat. Adm. 2006, 24, 42–62. [Google Scholar]
  8. National Cherry Blossom Festival. Available online: http://www.nationalcherryblossomfestival.org/about/history/ (accessed on 15 May 2015).
  9. Beijing Municipal Administration of Parks. Available online: http://www.bjmacp.gov.cn/gyzxxx.aspx?newsid=115599 (accessed on 15 May 2017).
  10. Chung, U.; Mack, L.; Yun, J.I.; Kim, S. Predicting the Timing of Cherry Blossoms in Washington, DC and Mid-Atlantic States in Response to Climate Change. PLoS ONE 2011, 6, e27439. [Google Scholar] [CrossRef] [PubMed]
  11. Dai, J.; Wang, H.; Ge, Q. Multiple phenological responses to climate change among 42 plant species in Xi’an, China. Int. J. Biometeorol. 2013, 57, 749–758. [Google Scholar] [CrossRef] [PubMed]
  12. Bolmgren, K.; Vanhoenacker, D.; Miller-Rushing, A.J. One man, 73 years, and 25 species. Evaluating phenological responses using a lifelong study of first flowering dates. Int. J. Biometeorol. 2013, 57, 367–375. [Google Scholar] [CrossRef] [PubMed]
  13. Szabó, B.; Enik, V.; Czúcz, B. Flowering phenological changes in relation to climate change in Hungary. Int. J. Biometeorol. 2016, 60, 1347–1356. [Google Scholar] [CrossRef] [PubMed]
  14. Wang, T.; Ottlé, C.; Peng, S.; Janssens, I.A.; Lin, X.; Poulter, B.; Yue, C.; Ciais, P. The influence of local spring temperature variance on temperature sensitivity of spring phenology. Glob. Chang. Biol. 2014, 20, 1473–1480. [Google Scholar] [CrossRef] [PubMed]
  15. Wang, H.; Rutishauser, T.; Tao, Z.; Zhong, S.; Ge, Q.; Dai, J. Impacts of global warming on phenology of spring leaf unfolding remain stable in the long run. Int. J. Biometeorol. 2017, 61, 287–292. [Google Scholar] [CrossRef] [PubMed]
  16. Wang, H.; Ge, Q.; Rutishauser, T.; Dai, Y.; Dai, J. Parameterization of temperature sensitivity of spring phenology and its application in explaining diverse phenological responses to temperature change. Sci. Rep. 2015, 5, 8833. [Google Scholar] [CrossRef] [PubMed]
  17. Templ, B.; Templ, M.; Filzmoser, P.; Lehoczky, A.; Bakšienè, E.; FleckHilppa, S.; Hodzic, G.; Kalvane, G.; Kubin, E.; Palm, V.; et al. Phenological patterns of flowering across biogeographical regions of Europe. Int. J. Biometeorol. 2017, 61, 1347–1358. [Google Scholar] [CrossRef] [PubMed]
  18. Menzel, A.; Sparks, T.H.; Estrella, N.; Koch, E.; Aasa, A.; Ahas, R.; Alm-kübler, K.; Bissolli, P.; Braslavská, O.; Briede, A.; et al. European phenological response to climate change matches the warming pattern. Glob. Chang. Biol. 2006, 12, 1969–1976. [Google Scholar] [CrossRef]
  19. Ge, Q.; Wang, H.; Rutishauser, T.; Dai, J. Phenological response to climate change in China: A meta-analysis. Glob. Chang. Biol. 2015, 21, 265–274. [Google Scholar] [CrossRef] [PubMed]
  20. Primack, R.B.; Higuchi, H.; Miller-Rushing, A.J. The impact of climate change on cherry trees and other species in Japan. Biol. Conserv. 2009, 142, 1943–1949. [Google Scholar] [CrossRef]
  21. Gonsamo, A.; Chen, J.M.; Wu, C. Citizen Science: Linking the recent rapid advances of plant flowering in Canada with climate variability. Sci. Rep. 2013, 3, 2239. [Google Scholar] [CrossRef] [PubMed]
  22. Wolfe, D.W.; Schwartz, M.D.; Lakso, A.N.; Otsuki, Y.; Pool, R.M.; Shaulis, N.J. Climate change and shifts in spring phenology of three horticultural woody perennials in northeastern USA. Int. J. Biometeorol. 2005, 49, 303–309. [Google Scholar] [CrossRef] [PubMed]
  23. Sakurai, R.; Jacobson, S.K.; Kobori, H.; Primack, R.; Oka, K.; Komatsu, N.; Machida, R. Culture and climate change: Japanese cherry blossom festivals and stakeholders’ knowledge and attitudes about global climate change. Biol. Conserv. 2011, 144, 654–658. [Google Scholar] [CrossRef]
  24. Ma, L.; Fang, X. Effects of global warming on seasonal tourism for the last 20 years in Beijing: A case study on the Peach Flower Stanza of Beijing Botanical Garden. Adv. Earth Sci. 2006, 21, 313–319. [Google Scholar]
  25. Wang, L.; Ge, Q.; Ning, Z.; Cui, H.; Dai, J.; Zhong, S.; Wang, H. Effect of phenological change in ornamental plants on the dates of spring outings to popular locations, Beijing, China. Clim. Res. 2017, 72, 177–182. [Google Scholar] [CrossRef]
  26. Bai, J.; Ge, Q.; Dai, J. The response of first flowering dates to abrupt climate change in Beijing. Adv. Atmos. Sci. 2011, 28, 564–572. [Google Scholar] [CrossRef]
  27. Wang, H.; Zhong, S.; Tao, Z.; Dai, J.; Ge, Q. Changes in flowering phenology of woody plants from 1963 to 2014 in North China. Int. J. Biometeorol. 2017. [Google Scholar] [CrossRef] [PubMed]
  28. Wan, M.W.; Liu, X.Z. China’s National Phenological Observational Criteria; Science Press: Beijing, China, 1979; p. 51. [Google Scholar]
  29. Parmesan, C. Influences of species, latitudes and methodologies on estimates of phenological response to global warming. Glob. Chang. Biol. 2007, 13, 1860–1872. [Google Scholar] [CrossRef]
  30. Menzel, A.; Sparks, T.H.; Estrella, N.; Roy, D.B. Altered geographic and temporal variability in phenology in response to climate change. Glob. Ecol. Biogeogr. 2006, 15, 498–504. [Google Scholar] [CrossRef]
  31. Wang, H.; Ge, Q.; Dai, J.; Tao, Z. Geographical pattern in first bloom variability and its relation to temperature sensitivity in the USA and China. Int. J. Biometeorol. 2015, 59, 961–969. [Google Scholar] [CrossRef] [PubMed]
  32. Miller-Rushing, A.J.; Katsuki, T.; Primack, R.B.; Ishii, Y.; Lee, S.D.; Higuchi, H. Impact of global warming on a group of related species and their hybrids: Cherry tree (Rosaceae) flowering at Mt. Takao, Japan. Am. J. Bot. 2007, 94, 1470–1478. [Google Scholar] [CrossRef] [PubMed]
  33. Schwartz, M.D.; Ahas, R.; Aasa, A. Onset of spring starting earlier across the Northern Hemisphere. Glob. Chang. Biol. 2006, 12, 343–351. [Google Scholar] [CrossRef]
  34. Cleland, E.E.; Chuine, I.; Menzel, A.; Mooney, H.A.; Schwartz, M.D. Shifting plant phenology in response to global change. Trends Ecol. Evol. 2007, 22, 357–365. [Google Scholar] [CrossRef] [PubMed]
  35. Chung, U.; Jung, J.; Seo, H.; Yun, J.I. Using urban effect corrected temperature data and a tree phenology model to project geographical shift of cherry flowering date in South Korea. Clim. Chang. 2009, 93, 447–463. [Google Scholar] [CrossRef]
  36. Hur, J.; Ahn, J. Seasonal prediction of regional surface air temperature and first-flowering date over South Korea. Int. J. Climatol. 2015, 35, 4791–4801. [Google Scholar] [CrossRef]
Figure 1. Changes in first flowering date (FFD) of three ornamental plants in Beijing from 1989 to 2016.
Sustainability 09 01127 g001
Figure 2. The relationship between first flowering dates of three ornamental species and temperature of previous months. The linear regression lines are shown.
Sustainability 09 01127 g002
Figure 3. Annual variations of the start dates of three blossom festivals. The dashed lines show the long-term mean.
Sustainability 09 01127 g003
Figure 4. The relationship between blossom festival date (BFD) and three potential influencing factors (first flowering date of the current year and the preceding year, and BFD of the preceding year) at three tourist attractions. Pearson’s R and regression lines are shown in each subplot. *: p < 0.05; **: p < 0.01.
Sustainability 09 01127 g004
Figure 5. The matching degree between peach blossom festival date (BFD) and first flowering date (FFD) of Chinese wild peach at Beijing Botanical Garden (a), Jingshan Park (b), and Yuyuantan Park (c). The upper panel shows the types (earlier, normal, or later) of FFD and BFD in each year. The lower panel shows whether the types of BFD and FFD were same (match) or different (mismatch).
Sustainability 09 01127 g005
Table 1. Summary of three tourist attractions for seeing spring flowers in Beijing
NameLocationArea (ha)Spring EventsObserved Species
Beijing Botanical Garden39°59′33″N, 116°12′19″E400Peach blossom festival since 1989Chinese wild peach (Prunus davidiana)
Jingshan Park39°55′27″N, 116°23′25″E23Peony blossom festival since 2001Tree peony (Paeonia suffruticosa)
Yuyuantan Park39°54′53″N, 116°18′53″E136Cherry blossom festival since 1989Yoshino cherry (Prunus yedoensis)
Table 2. Correlation and regression analysis between the first flowering date of three ornamental species and temperature during different periods. **: p < 0.01; Slope: slope of linear regression; R2: goodness of fit for the linear regression model.
PeriodsPearson’s RSlope (Days °C−1)R2
Chinese wild peach
February–April−0.82 **−4.260.67
March–April−0.86 **−4.110.74
April−0.72 **−2.900.52
Tree peony
March–May−0.89 **−5.080.79
April–May−0.91 **−4.750.83
May−0.66 **−2.940.43
Yoshino cherry
February–April−0.58 **−3.760.34
March–April−0.63 **−3.730.40
April−0.62 **−3.040.38

