
A Smartness Assessment Framework for Smart Factories Using Analytic Network Process


Abstract
:1. Introduction
2. Previous Research on Factory Assessment
2.1. Assessment and Certification Systems of Factories
2.2. Methodology for Multi-Criteria Decision Making (MCDM)
3. Proposed Methodology
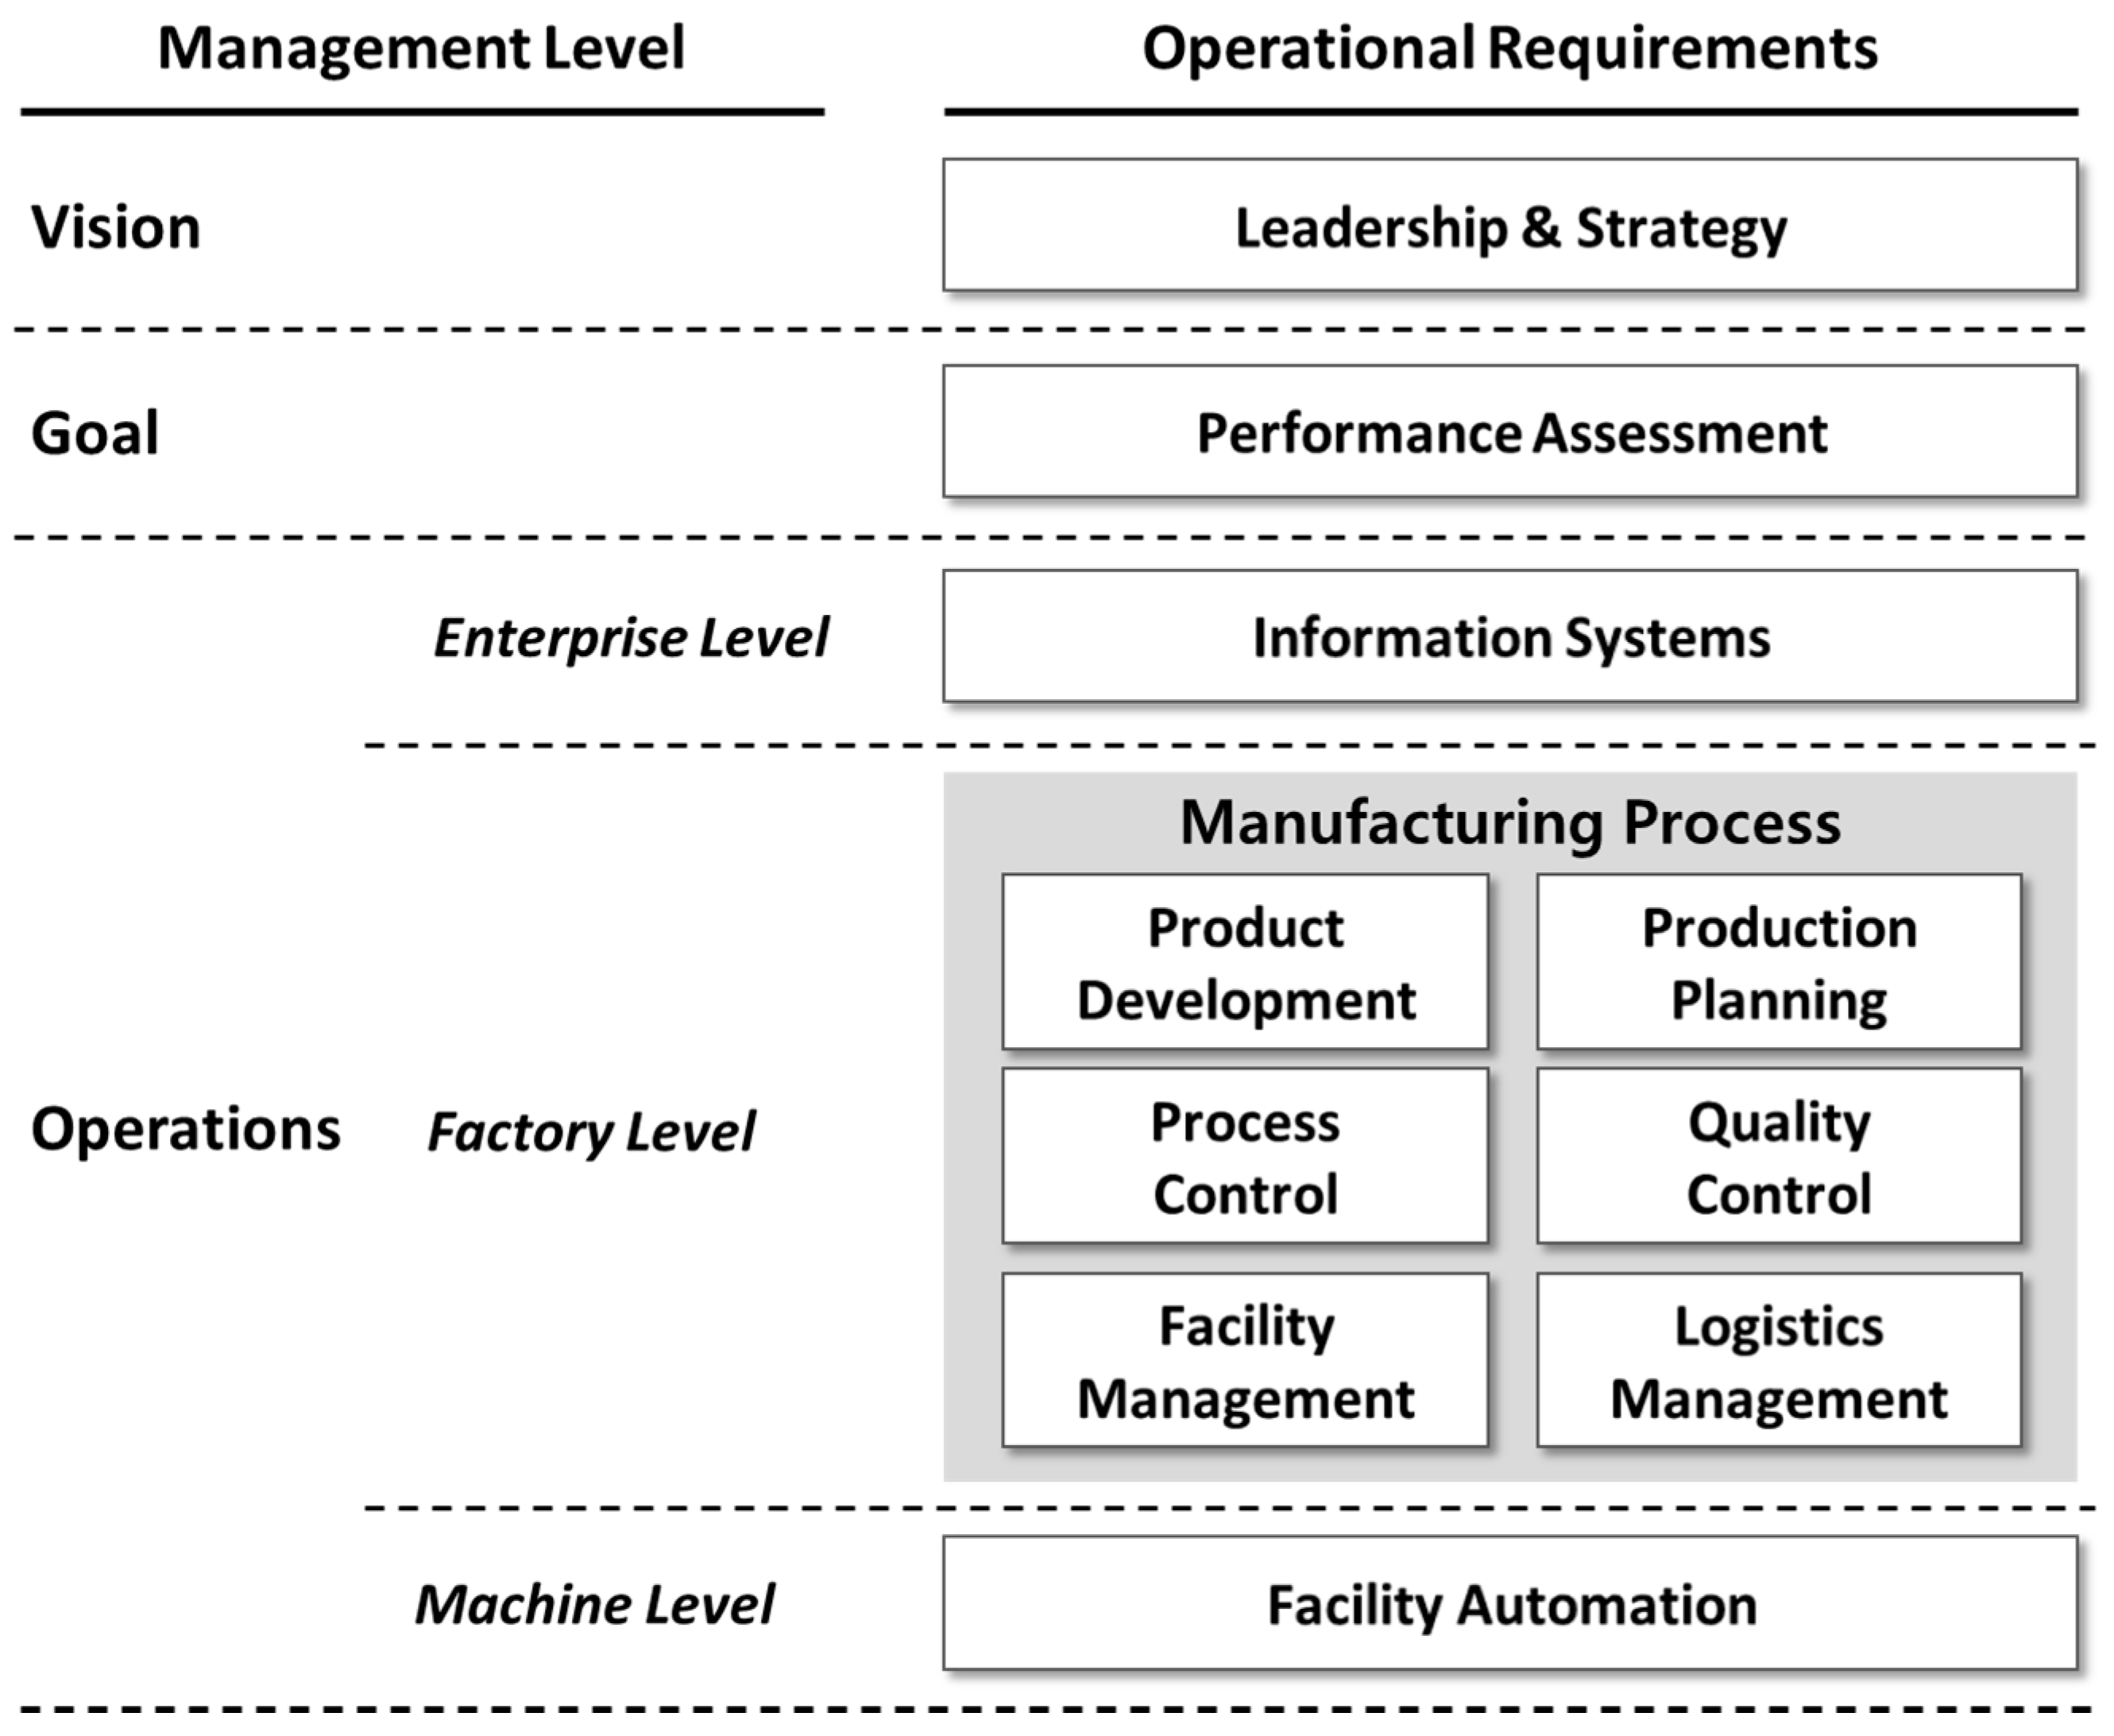
3.1. Identifying the Assessment Criteria Based on Literature Review
- Objective: Optimal management of production process, Zero waste, Maximum efficiency, Product customization, Strengthening manufacturing competitiveness, Asset utilization, Innovation of supply chain and logistics
- Direction to pursue: Intellectualization and optimization, Responding to changes in the external environment, ICT-integration of processes, Organic connection of functions, Control improvement, Context-sensitive
- Necessary technologies: Automation technology, IoT, Big-data, Cyber-physical system (CPS), etc.
- Applicable object: Facilities, Devices, Workers, Material/Part/Product
- Applied processes: (Product lifecycle view) Product design, Production planning, Process control, Quality control, Logistics, Sales (Behavioral view) Sensing, Controlling, Actuating
3.2. Implementing the Model with Consulting Experts
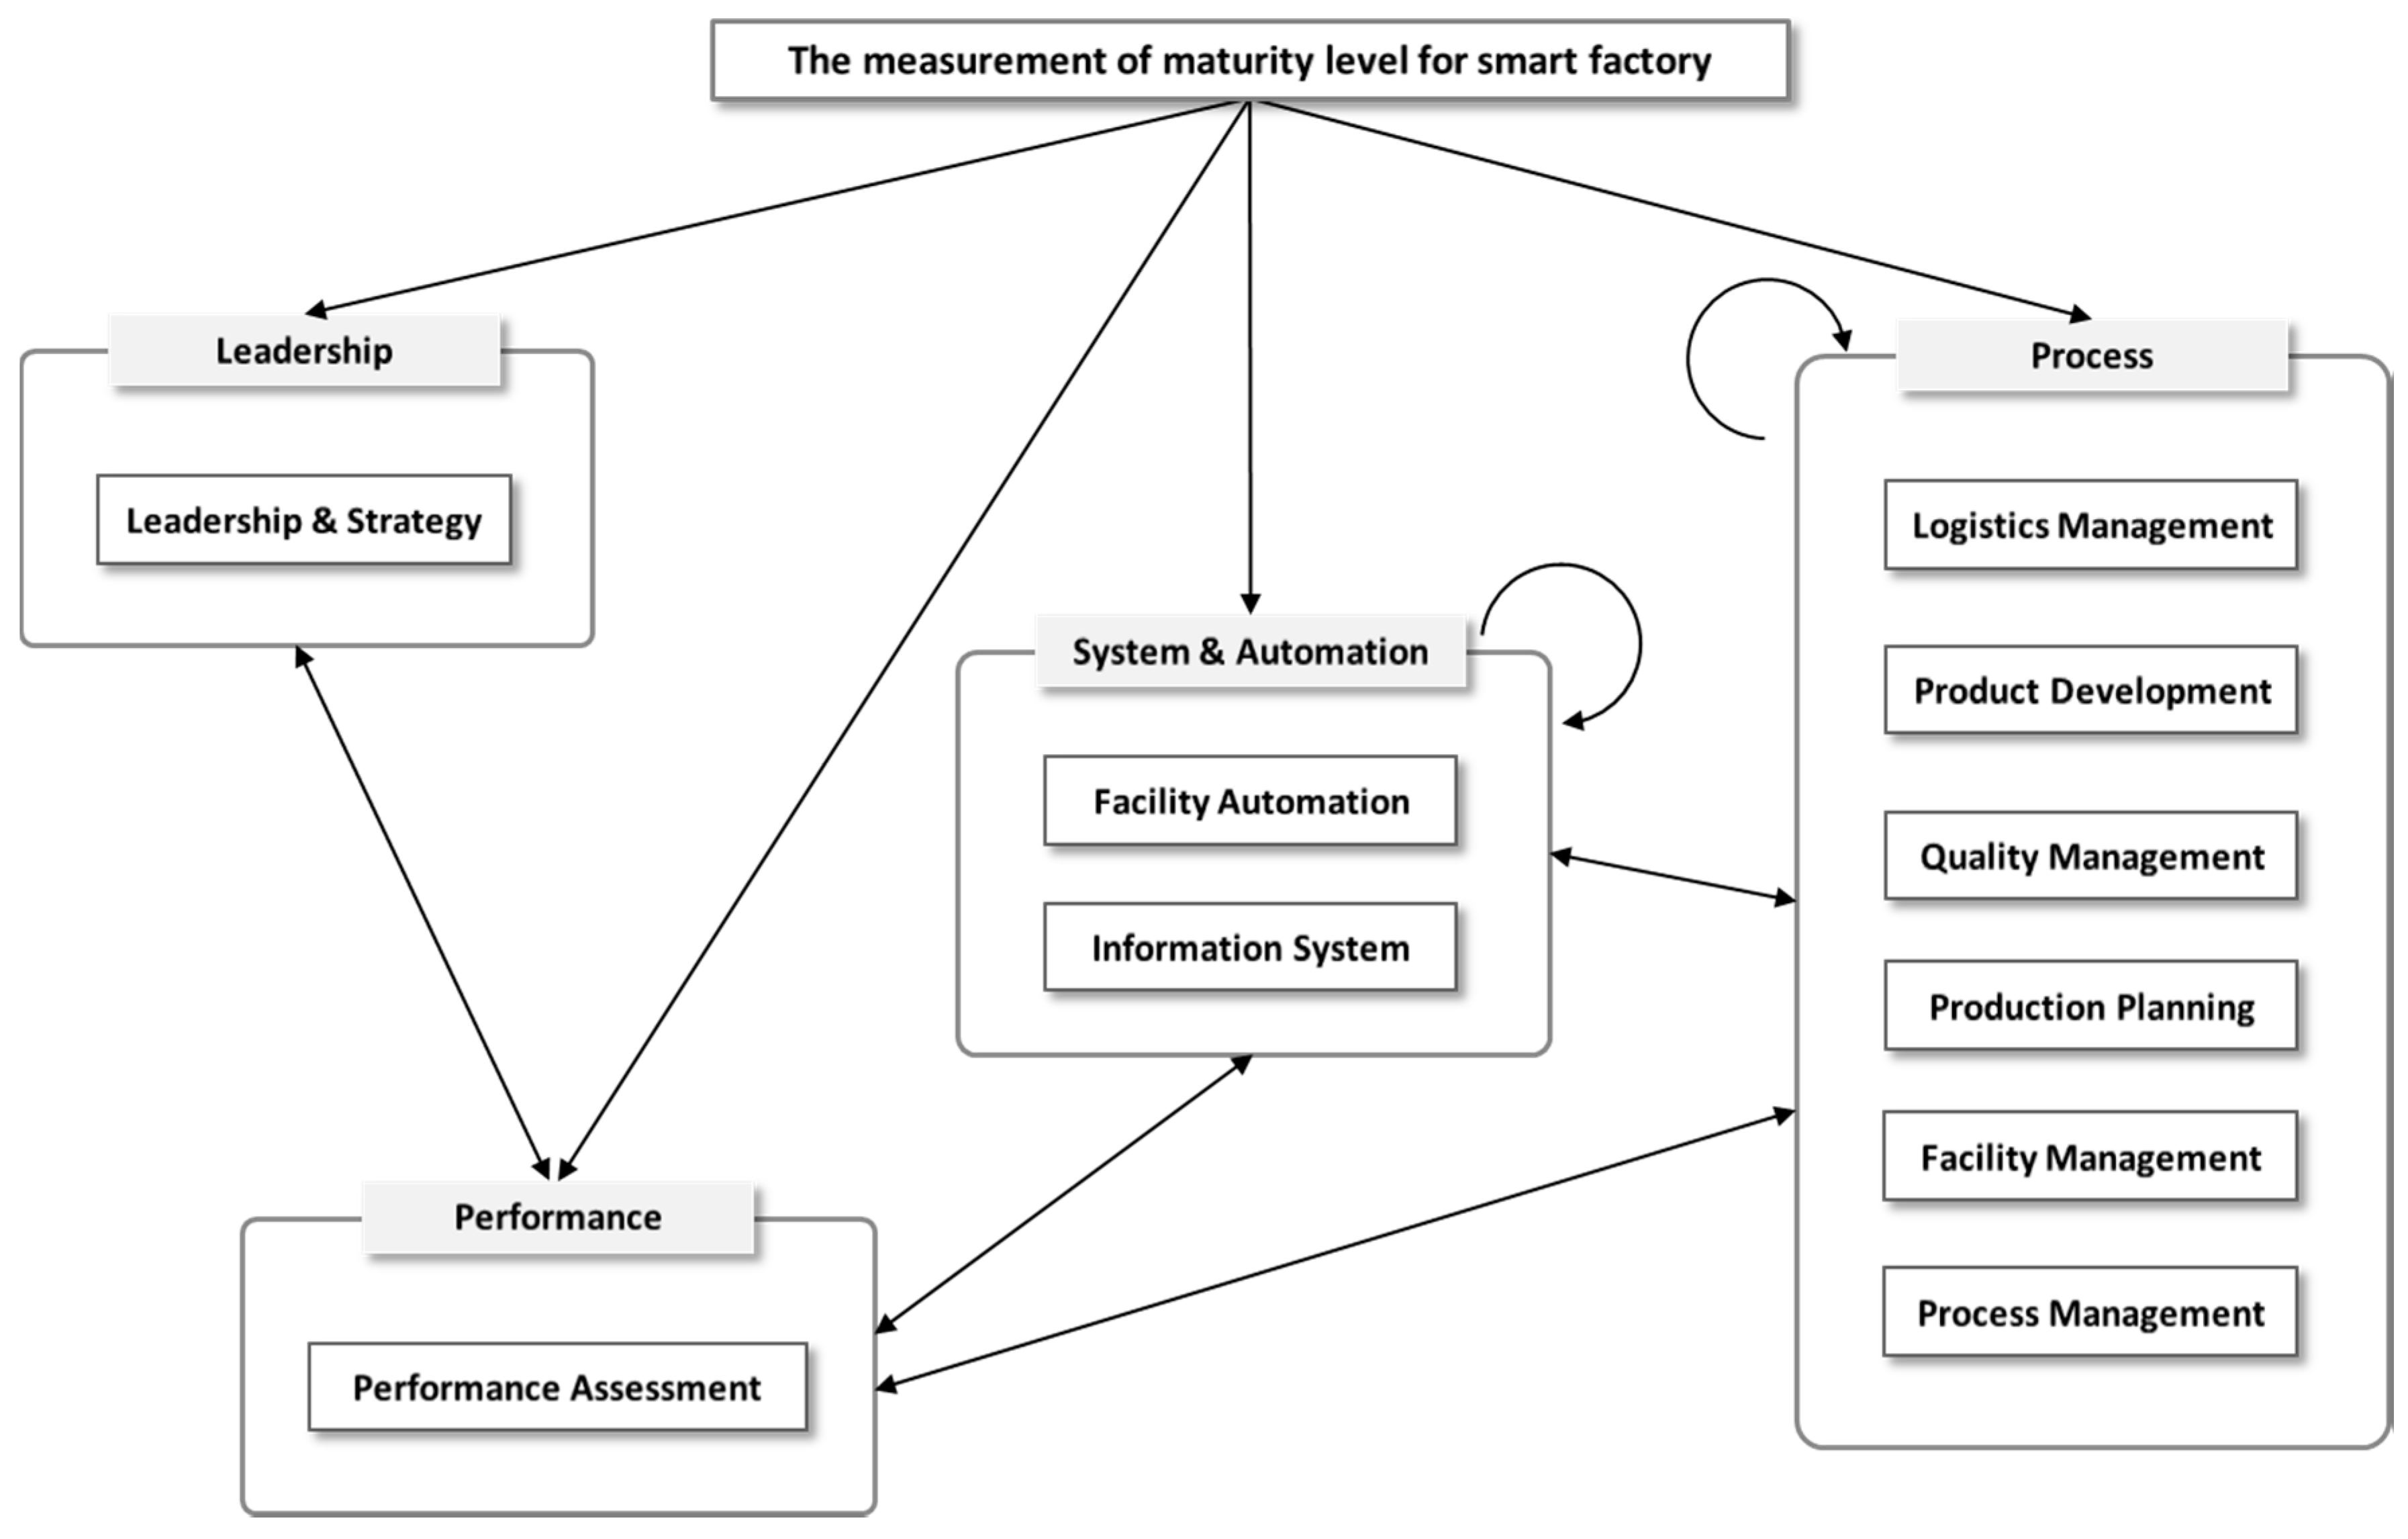
3.3. Formulating an ANP Model
Step 1. Aggregating individual judgments
Step 2. Checking the consistency index
Step 3. Calculating the limit super matrix
3.4. Maturity Level of Smart Factory
- Checking. Factories satisfying this level have performance checklists and can collect the data related to the factory’s environments and conditions and notice changes of shop floor but the system is not linked to an external monitoring system.
- Monitoring. Factories in this level can gather the data linked to the external monitoring system and notice changes based on the information. They manage the data visually.
- Control. Based on the result of monitoring the data from shop floor and external system, a factory with the Control level can analyze abnormalities and recover from them automatically.
- Optimization. A factory with Optimization level can integrate all the data of factory and finally optimize the entire manufacturing system by interfacing with devices, facilities, external and internal systems from a holistic viewpoint.
- Autonomy. A factory that reaches Autonomy maturity level can operate the factory without any intervention and diagnose abnormalities for itself based on artificial intelligence.
4. Case Study
4.1. Description of Companies
4.2. Experimental Results
4.2.1. Hierarchical Cluster Analysis According to the Importance of Value Chain
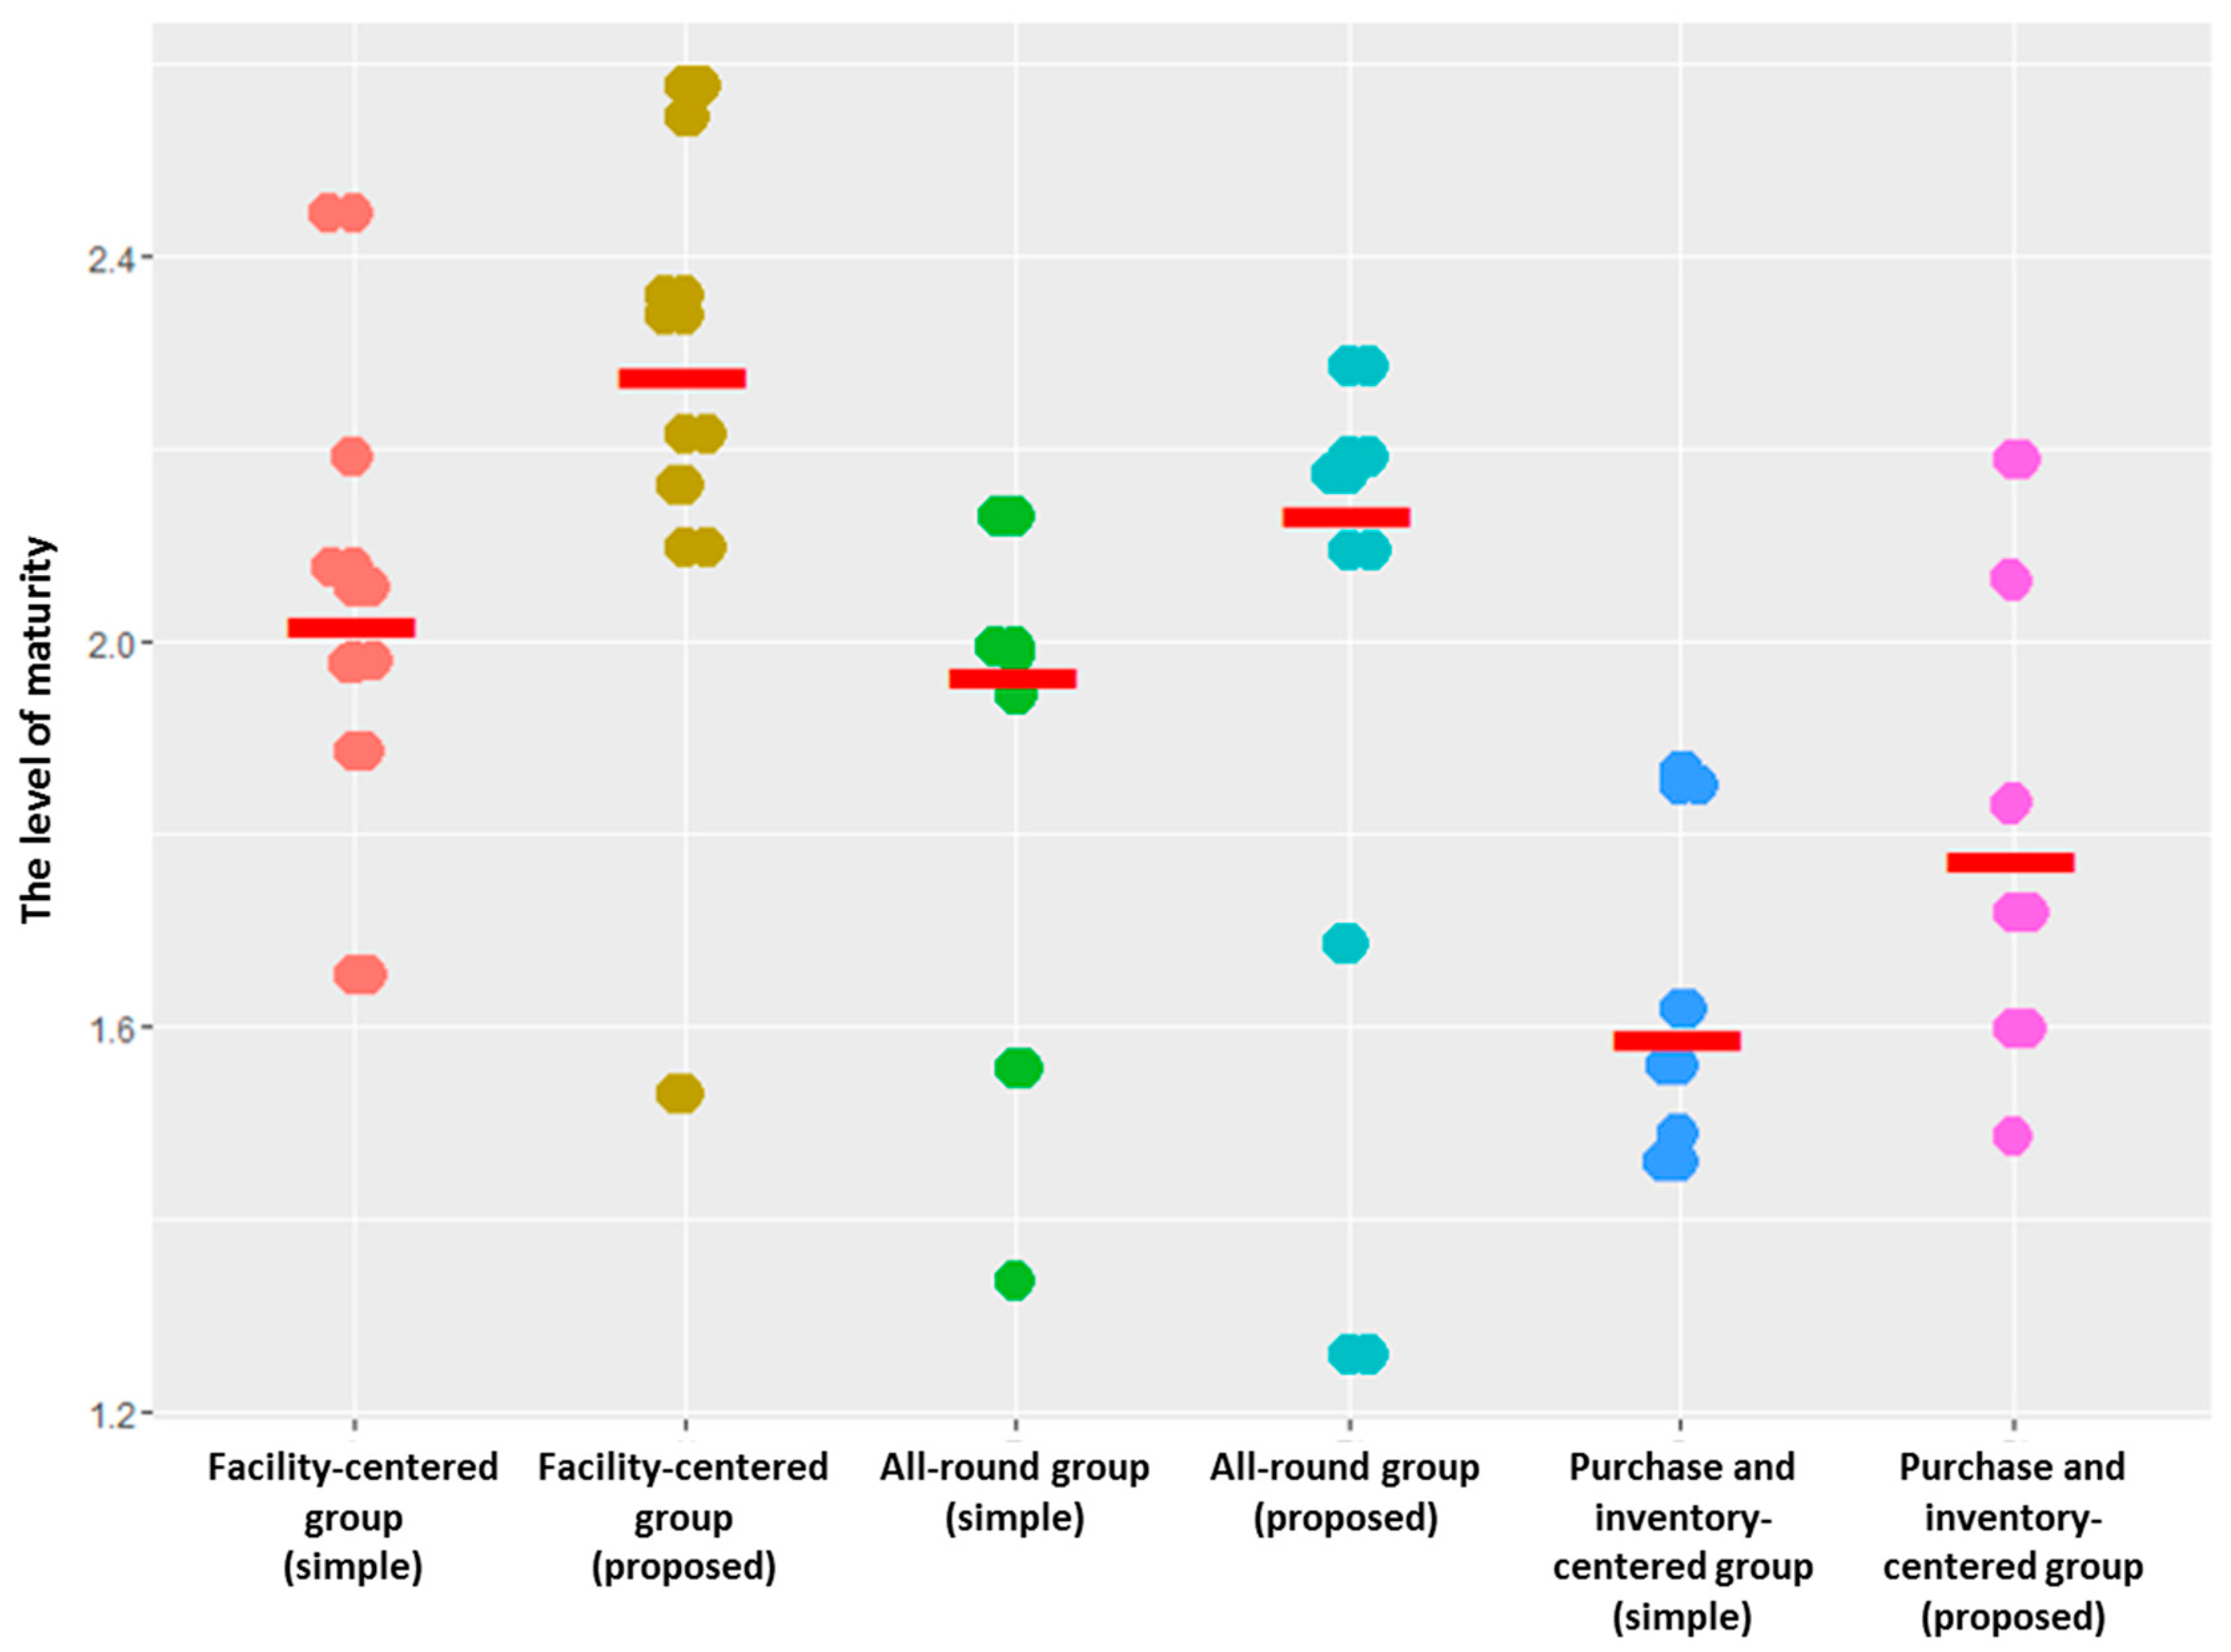
4.2.2. Application of the Proposed Methodology for Each Cluster
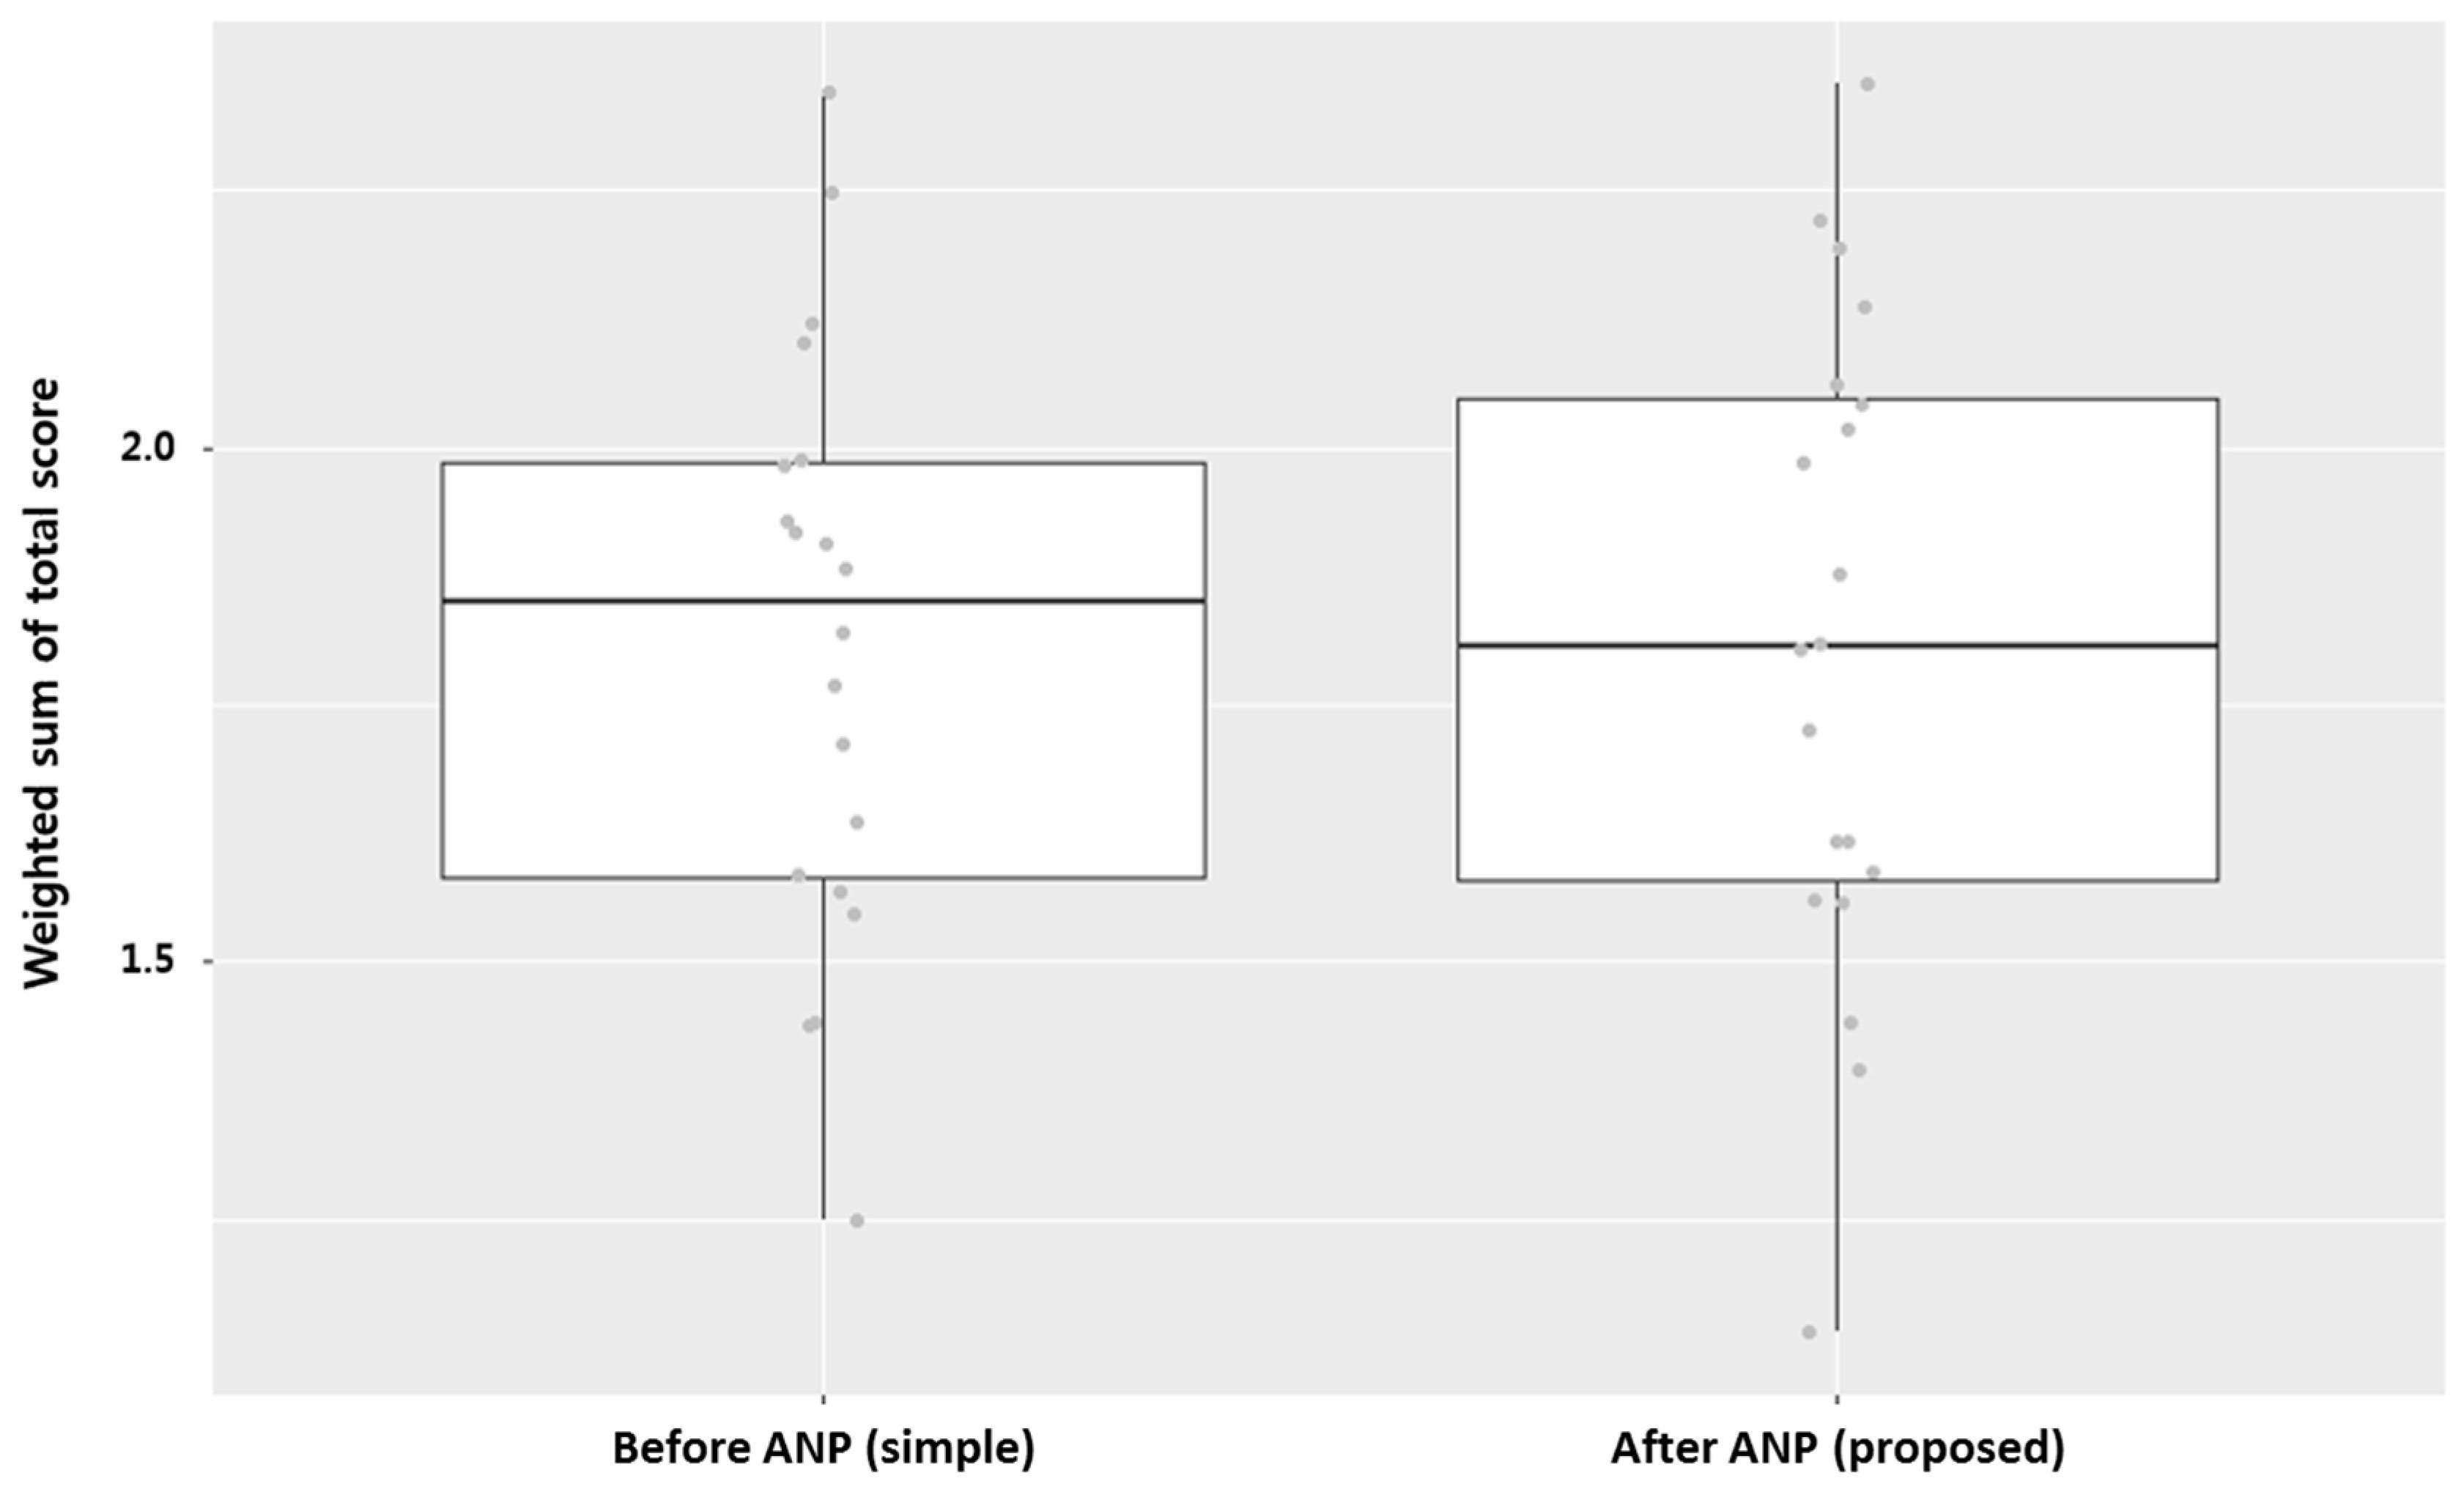
4.3. Result and Implications
5. Conclusions
Author Contributions
Conflicts of Interest
References
- Herrmann, C.; Schmidt, C.; Kurle, D.; Blume, S.; Thiede, S. Sustainability in Manufacturing and Factories of the Future. Int. J. Precis. Eng. Manuf. Green Technol. 2014, 1, 283–292. [Google Scholar] [CrossRef]
- Lucke, D.; Constantinescu, C.; Westkämper, E. Smart Factory—A Step towards the Next Generation of Manufacturing. In Manufacturing Systems and Technologies for the New Frontier, Proceedings of the 41st CIRP Conference on Manufacturing Systems, Tokyo, Japan, 26–28 May 2008; Mitsuishi, M., Ueda, K., Kimura, F., Eds.; Springer: London, UK, 2008; pp. 115–118. [Google Scholar]
- Zuehlke, D. SmartFactory—Towards a factory-of-things. Annu. Rev. Control 2010, 34, 129–138. [Google Scholar] [CrossRef]
- Wang, S.; Wan, J.; Li, D.; Zhang, C. Implementing smart factory of Industrie 4.0: An outlook. Int. J. Distrib. Sens. Netw. 2016. [Google Scholar] [CrossRef]
- Chen, D.; Thiede, S.; Schudeleit, T.; Herrmann, C. A holistic and rapid sustainability assessment tool for manufacturing SMEs. CIRP Ann. Manuf. Technol. 2014, 63, 437–440. [Google Scholar] [CrossRef]
- Lichtblau, K.; Goericke, D.; Stich., V. Industrie 4.0 Readiness, VDMA. Available online: https://www.industrie40-readiness.de/?lang=en (accessed on 26 October 2016).
- Porter, M.E.; Heppelmann, J.E. How smart, connected products are transforming competition. Harv. Bus. Rev. 2014, 92, 64–88. [Google Scholar]
- Jung, K.; Kulvatunyou, B.; Choi, S.; Brundage, M.P. An Overview of a Smart Manufacturing System Readiness Assessment. In Proceedings of the International Conference on Advances in Production Management Systems, Iguassu Falls, Brazil, 3–7 September 2016. [Google Scholar]
- Gunasekaran, A.; Patel, C.; McGaughey, R.E. A framework for supply chain performance measurement. Int. J. Product. Econ. 2004, 87, 333–347. [Google Scholar] [CrossRef]
- Chen, I.J.; Paulraj, A. Towards a theory of supply chain management: The constructs and measurements. J. Oper. Manag. 2004, 22, 119–150. [Google Scholar] [CrossRef]
- Hwang, G.; Lee, J.; Park, J.; Chang, T. Developing performance measurement system for Internet of Things and smart factory environment. Int. J. Product. Res. 2017, 55, 2590–2601. [Google Scholar] [CrossRef]
- Al-Dhaafri, H.S.; Al-Swidi, A.K.; Al-Ansi, A.A. Organizational Excellence as the Driver for Organizational Performance: A Study on Dubai Police. Int. J. Bus. Manag. 2016, 11, 47. [Google Scholar] [CrossRef]
- Kim, C.M.; Lee, J.C.; Choi, S.W. Study for Development Directions and Real Application Cases of Korea Production System (KPS). Appl. Mech. Mater. 2015, 752, 1320–1332. [Google Scholar] [CrossRef]
- Tzeng, G.H.; Huang, J.J. Multiple Attribute Decision Making: Methods and Applications; CRC Press: Boca Raton, FL, USA, 2011. [Google Scholar]
- Saaty, T.L. How to make a decision: The analytic hierarchy process. Eur. J. Oper. Res. 1990, 48, 9–26. [Google Scholar] [CrossRef]
- Saaty, T.L. Decision Making with Dependence and Feedback: The Analytic Network Process; RWS Publications: Pittsburgh, PA, USA, 1996; Volume 4922. [Google Scholar]
- Anthony, R. Planning and Control: A Framework for Analysis; Division of Research, Harvard University Graduate Business School of Business Administration: Boston, MA, USA, 1965. [Google Scholar]
- Arndt, A.; Anderl, R. Employee Data Model for Flexible and Intelligent Assistance Systems in Smart Factories. In Advances in Ergonomics of Manufacturing: Managing the Enterprise of the Future; Springer: Cham, Switzerland, 2016; pp. 503–515. [Google Scholar]


| Criteria | Sub-Criteria | Assessment Items |
|---|---|---|
| Leadership | Leadership & Strategy | CEO leadership Strategy and plan for implementing smart factory Management of organization and capability of smart factory Management of KPIs (key performance indicators) |
| Process | Product Development | Procedure of product development Product design and evaluation Process design and evaluation Management of product information Management of technical information |
| Production Planning | Management of information for production planning Demand and order planning Sales and operation planning Master production scheduling | |
| Process Control | Development of the detailed job schedule and order Management of the production progress Management of abnormalities in the manufacturing process | |
| Quality Control | Management of information for quality control Management of documents of standards for quality control Management of testing data Management of machines and equipment for quality control | |
| Facility Management | Management of the operation of facilities Maintenance of facilities Management of spare parts Management of molds, jigs, and tools | |
| Logistics Management | Management of the demand of materials Management of orders and lead times Management of storing and releasing products in a warehouse Management of racking systems Management of peaking and delivering products Management of information about delivering and tracking | |
| System & Automation | Information System | Utilization of ERP and SCM Utilization of MES Utilization of PLM Utilization of FEMS Management of information security |
| Facility Automation | Automation of manufacturing facilities Automation of logistics facilities Automation of evaluation and testing facilities Automation of information network for facilities Management of energy, safety, and environment | |
| Performance | Performance Assessment | Productivity Quality Cost Lead time Safety Environment |
| n | 1 | 2 | 3 | 4 | 5 | 6 | 7 | 8 | 9 | 10 | 11 |
|---|---|---|---|---|---|---|---|---|---|---|---|
| RI | 0.00 | 0.00 | 0.58 | 0.90 | 1.12 | 1.24 | 1.32 | 1.41 | 1.45 | 1.49 | 1.51 |
| Companies and Their Product Types | Value Chain | ||||||
|---|---|---|---|---|---|---|---|
| Product Development & Design | Production Planning | MES (Process/Quality/Facility) | Purchase & Inventory Management | Delivery | Facility Control | ||
| A | Display inspection facilities | ★ | ○ | ★ | ○ | △ | △ |
| B | Injection molding | △ | ★ | ★ | △ | △ | ★ |
| C | Telecommunication devices | ★ | △ | ★ | ○ | △ | △ |
| D | Plates | △ | ○ | ★ | △ | △ | △ |
| E | Medical devices | △ | ○ | ★ | ○ | △ | ○ |
| F | Automotive parts | △ | ○ | ★ | △ | △ | ★ |
| G | Springs and pins | △ | ★ | ★ | ○ | △ | △ |
| H | Hydraulic valves | △ | ○ | ★ | ★ | △ | ○ |
| I | Sheet metal | △ | ○ | ★ | ○ | △ | △ |
| J | Automotive parts | △ | ★ | ★ | △ | △ | ★ |
| K | Heat treatment | △ | ○ | ★ | ○ | ○ | ★ |
| L | Automotive parts | ★ | ○ | ★ | ○ | ○ | ★ |
| M | Electronic parts | ○ | ○ | ★ | ○ | ○ | ★ |
| N | Gear pump and Hydraulic motor | ★ | ○ | ★ | ○ | ○ | ★ |
| O | Industrial pump | ○ | ○ | ★ | ★ | ○ | ○ |
| P | Telecommunication devices | ○ | ○ | ★ | ○ | △ | △ |
| Q | Fine ceramic, quartz, and glass | △ | ○ | ★ | ○ | △ | ○ |
| R | Safety glasses | ★ | ○ | ★ | ★ | ○ | ○ |
| S | Medical devices | ★ | ○ | ★ | ★ | ○ | ○ |
| T | Antennas | ★ | ○ | ★ | ○ | ○ | ○ |
| Group | Companies | Description |
|---|---|---|
| Facility-centered group | B, F, J, K, L, M, N | The importance of Production Planning and Facility Control process in value chain is greater than other processes. |
| Purchase and inventory-centered group | A, C, D, G, I, P | Purchasing & Inventory Management process is relatively more important than other groups. |
| All-round group | E, H, O, Q, R, S, T | Most of processes in value chain are significant and have balanced importance. |
| Leadership & Strategy | Product Development | Production Planning | Process Management | Quality Management | Facility Management | Logistics Management | Information System | Facility Automation | Performance Assessment | |
|---|---|---|---|---|---|---|---|---|---|---|
| Leadership & Strategy | 0 | 1 | 0 | 0 | 0 | 0 | 0 | 0 | 0 | 0 |
| Product Development | 1 | 0 | 1 | 1 | 1 | 1 | 1 | 1 | 1 | 1 |
| Production Planning | 0 | 0.04168 | 0 | 0 | 0 | 0.66667 | 0 | 0 | 0.05862 | 0.05893 |
| Process Management | 0 | 0.10490 | 0 | 0 | 0.2 | 0 | 0.19469 | 0 | 0.11590 | 0 |
| Quality Management | 0 | 0.27814 | 0 | 0.5 | 0 | 0 | 0.71723 | 0 | 0.29724 | 0.25157 |
| Facility Management | 0 | 0.08447 | 1 | 0 | 0 | 0 | 0.08808 | 0 | 0 | 0.13131 |
| Logistics Management | 0 | 0.31584 | 0 | 0.5 | 0.8 | 0.33333 | 0 | 0 | 0.33675 | 0.36937 |
| Information System | 0 | 0.17497 | 0 | 0 | 0 | 0 | 0 | 0 | 0.19149 | 0.18882 |
| Facility Automation | 0 | 0 | 0.66667 | 1 | 0.66667 | 0 | 0.5 | 0.33333 | 0 | 1 |
| Performance Assessment | 0 | 0 | 0.33333 | 0 | 0.33333 | 1 | 0.5 | 0.66667 | 0 | 0 |
| Leadership & Strategy | Product Development | Production Planning | Process Management | Quality Management | Facility Management | Logistics Management | Information System | Facility Automation | Performance Assessment | |
|---|---|---|---|---|---|---|---|---|---|---|
| Leadership & Strategy | 0 | 0.12500 | 0 | 0 | 0 | 0 | 0 | 0 | 0 | 0 |
| Product Development | 1 | 0 | 0.07796 | 0.07796 | 0.07796 | 0.07796 | 0.07796 | 0.21349 | 0.15046 | 0.08362 |
| Production Planning | 0 | 0.03647 | 0 | 0 | 0 | 0.42323 | 0 | 0 | 0.04980 | 0.02782 |
| Process Management | 0 | 0.09179 | 0 | 0 | 0.12697 | 0 | 0.12360 | 0 | 0.09846 | 0 |
| Quality Management | 0 | 0.24337 | 0 | 0.31742 | 0 | 0 | 0.45533 | 0 | 0.25251 | 0.11877 |
| Facility Management | 0 | 0.07391 | 0.63484 | 0 | 0 | 0 | 0.05591 | 0 | 0 | 0.06199 |
| Logistics Management | 0 | 0.27636 | 0 | 0.31742 | 0.50787 | 0.21161 | 0 | 0 | 0.28608 | 0.17438 |
| Information System | 0 | 0.15310 | 0 | 0 | 0 | 0 | 0 | 0 | 0.16267 | 0.08914 |
| Facility Automation | 0 | 0 | 0.19147 | 0.28720 | 0.19147 | 0 | 0.14360 | 0.26217 | 0 | 0.44427 |
| Performance Assessment | 0 | 0 | 0.09573 | 0 | 0.09573 | 0.28720 | 0.14360 | 0.52434 | 0 | 0 |
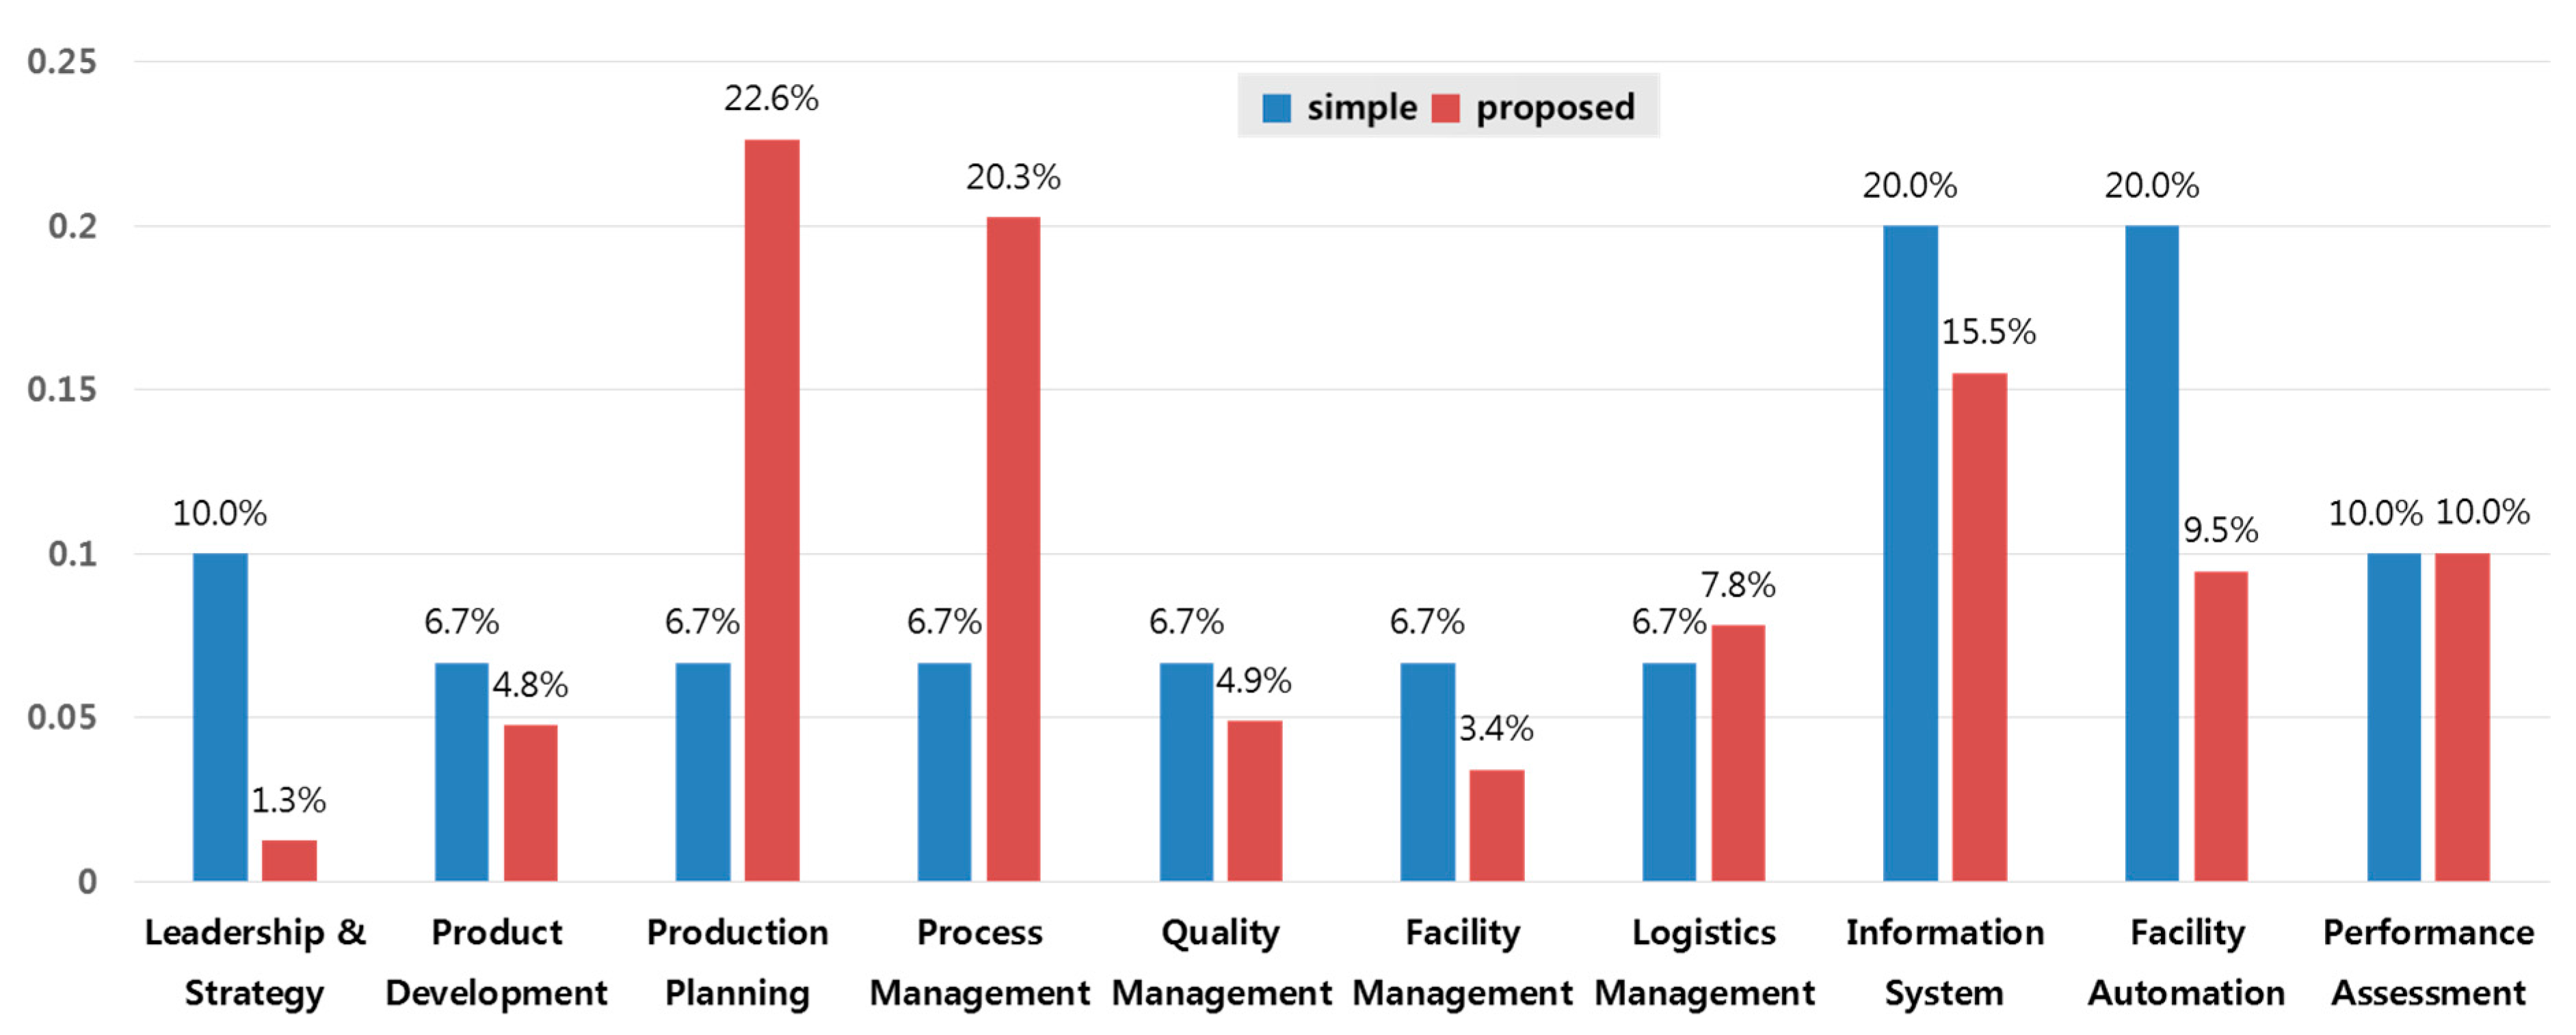
| Leadership & Strategy | Product Development | Production Planning | Process Management | Quality Management | Facility Management | Logistics Management | Information System | Facility Automation | Performance Assessment | |
|---|---|---|---|---|---|---|---|---|---|---|
| Leadership & Strategy | 0.01251 | 0.01251 | 0.01251 | 0.01251 | 0.01251 | 0.01251 | 0.01251 | 0.01251 | 0.01251 | 0.01251 |
| Product Development | 0.04759 | 0.04759 | 0.04759 | 0.04759 | 0.04759 | 0.04759 | 0.04759 | 0.04759 | 0.04759 | 0.04759 |
| Production Planning | 0.22629 | 0.22629 | 0.22629 | 0.22629 | 0.22629 | 0.22629 | 0.22629 | 0.22629 | 0.22629 | 0.22629 |
| Process Management | 0.20260 | 0.20260 | 0.20260 | 0.20260 | 0.20260 | 0.20260 | 0.20260 | 0.20260 | 0.20260 | 0.20260 |
| Quality Management | 0.04898 | 0.04898 | 0.04898 | 0.04898 | 0.04898 | 0.04898 | 0.04898 | 0.04898 | 0.04898 | 0.04898 |
| Facility Management | 0.03415 | 0.03415 | 0.03415 | 0.03415 | 0.03415 | 0.03415 | 0.03415 | 0.03415 | 0.03415 | 0.03415 |
| Logistics Management | 0.07815 | 0.07815 | 0.07815 | 0.07815 | 0.07815 | 0.07815 | 0.07815 | 0.07815 | 0.07815 | 0.07815 |
| Information System | 0.15510 | 0.15510 | 0.15510 | 0.15510 | 0.15510 | 0.15510 | 0.15510 | 0.15510 | 0.15510 | 0.15510 |
| Facility Automation | 0.09451 | 0.09451 | 0.09451 | 0.09451 | 0.09451 | 0.09451 | 0.09451 | 0.09451 | 0.09451 | 0.09451 |
| Performance Assessment | 0.10011 | 0.10011 | 0.10011 | 0.10011 | 0.10011 | 0.10011 | 0.10011 | 0.10011 | 0.10011 | 0.10011 |
© 2017 by the authors. Licensee MDPI, Basel, Switzerland. This article is an open access article distributed under the terms and conditions of the Creative Commons Attribution (CC BY) license (http://creativecommons.org/licenses/by/4.0/).
Share and Cite
Lee, J.; Jun, S.; Chang, T.-W.; Park, J. A Smartness Assessment Framework for Smart Factories Using Analytic Network Process. Sustainability 2017, 9, 794. https://doi.org/10.3390/su9050794
Lee J, Jun S, Chang T-W, Park J. A Smartness Assessment Framework for Smart Factories Using Analytic Network Process. Sustainability. 2017; 9(5):794. https://doi.org/10.3390/su9050794
Chicago/Turabian StyleLee, Jeongcheol, Sungbum Jun, Tai-Woo Chang, and Jinwoo Park. 2017. "A Smartness Assessment Framework for Smart Factories Using Analytic Network Process" Sustainability 9, no. 5: 794. https://doi.org/10.3390/su9050794
APA StyleLee, J., Jun, S., Chang, T.-W., & Park, J. (2017). A Smartness Assessment Framework for Smart Factories Using Analytic Network Process. Sustainability, 9(5), 794. https://doi.org/10.3390/su9050794