Abstract
This study employs the developed simulation software for the energy use of the high-tech fabrication plant (hereafter referred as a fab) to examine six energy-saving approaches for the make-up air unit (MAU) of a TFT-LCD (thin-film transistor liquid-crystal display) fab. The studied approaches include: (1) Approach 1: adjust the set point of dry bulb temperature and relative humidity in the cleanroom; (2) Approach 2: lower the flow rate of supply air volume in the MAU; (3) Approach 3: use a draw-through type instead of push through type MAU; (4) Approach 4: combine the two stage cooling coils in MAU to a single stage coil; (5) Approach 5: reduce the original MAU exit temperature from 16.5 °C to 14.5 °C; and (6) Approach 6: avoid an excessive increase in pressure drop over the filter by replacing the HEPA filter more frequently. The simulated results are further compared to the measured data of the studied TFT-LCD fab in Taiwan. The simulated results showed that Approach 1 exhibits more significant influence on annual power consumption than the other approaches. The advantage/disadvantage of each approach is elaborated. The impact of the six approaches on the annual power consumption of the fab is also discussed.
1. Introduction
Large-scale high-tech cleanrooms need conditioned air from the ambient environment to maintain a positive pressure. Figure 1 shows a typical schematic diagram for a make-up air unit (MAU) and cleanroom heating, ventilation, air conditioning (HVAC) system. Humidity in large-scale high-tech cleanrooms is often controlled by a dedicated MAU which consists of a fan, two stage cooling coils, a heating coil (or heater), filters, and a humidifier. Methods of humidification include mist humidification and steam humidification. The steam humidification process is a quasi-isothermal process, which needs heat energy to generate steam. The mist humidification process is an isenthalpic process, which draws evaporation energy from the air. Irrespective of whether quasi isothermal process or isenthalpic process is adopted, the heating system is indispensable. For mist humidification, outdoor air needs to be pre-heated to a temperature that has the same enthalpy as off-coil saturation condition. Whether a cleanroom uses electric-heater or a boiler, it would be a burden on operation and maintenance costs. Even with a heat recovery chiller, it negatively affects the efficiency of the chiller system. Normally, MAU output air has a temperature range of 14–17 °C, and the humidity is controlled at 9.65 × 10⁻³ kg/kg for TFT-LCD (thin-film transistor liquid-crystal display) fabrication plants. The make-up air (MA) is mixed with return air (RA) to maintain temperature at 23 ± 1 °C and humidity at 55% ± 5% for most TFT-LCD industries [1]. Additionally, the temperature in the cleanroom can be controlled by a dry coil but this does not regulate humidity, thus the MAU output humidity becomes very important, as it is the only mechanism to control humidity in the cleanroom. Figure 2 shows the psychrometric processes of both humidifying a cleanroom by steam and mist humidification.
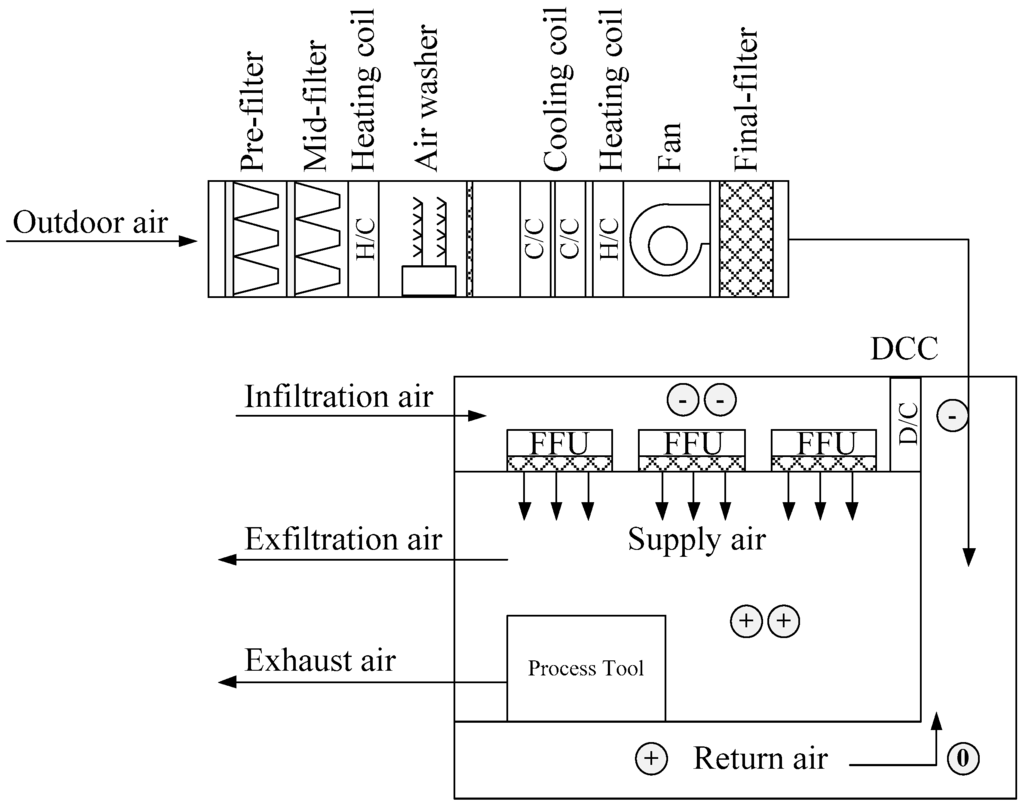
Figure 1.
A typical schematic diagram for MAU and clean room HVAC system.
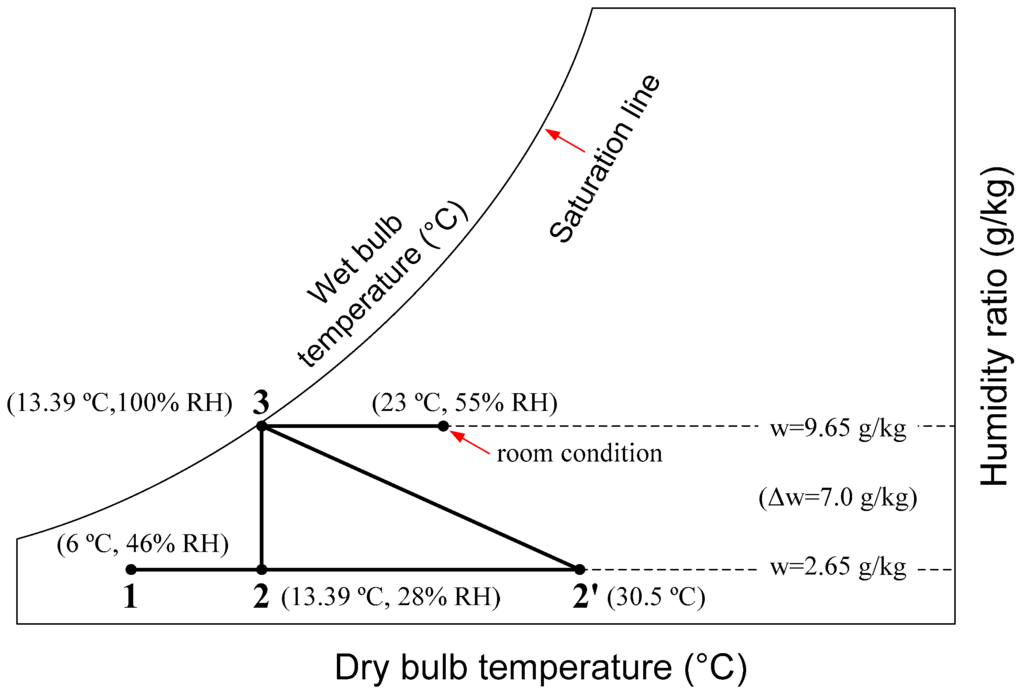
Figure 2.
The psychrometric process of humidification: steam-humidification (1-2-3) and mist-humidification (1-2′-3), where r is the room condition [1].
Depending on the location of the fan relative to the cooling coils (upstream or downstream), a MAU can be categorized as a push-through type MAU (Figure 3a) or a draft-through type MAU (Figure 3b) [2]. As the relative humidity required for industrial cleanroom is low, the designed humidity ratio is lower than the HVAC system used in commercial buildings. Thus, the supply water temperature for the cooling coil inside the MAU is typically 5–7 °C. This low temperature of the supply water reduces water chiller’s efficiency. In general, a rise of 1 °C in evaporator temperature of water chiller can increase chiller efficiency by about 3%. Therefore, by dividing one cooling coil with low supply water temperature into two cooling coils with different supply water temperatures (i.e., 9 °C for first cooling coil and 6 °C for second cooling coil), total energy consumption of water chillers can be reduced [2]. Heat sources of heating coil generally are steam, hot water, or electric heater. However, replacing these high energy consumption components with heat recovery chiller helps reduce energy consumption of heating coil. Reheating is required after the dehumidification process in order to satisfy the temperature requirement, which is determined by the cleanroom temperature and the relative humidity settings. In such a case, mounting the MAU fan after the cooling coils can replace some of the energy required for reheating. This cuts down the energy consumption by reducing the energy load of the heating coil. The last device is a steam humidifier, which provides steam and increases humidity at the discharge, helping to meet the humidity requirement in winter.
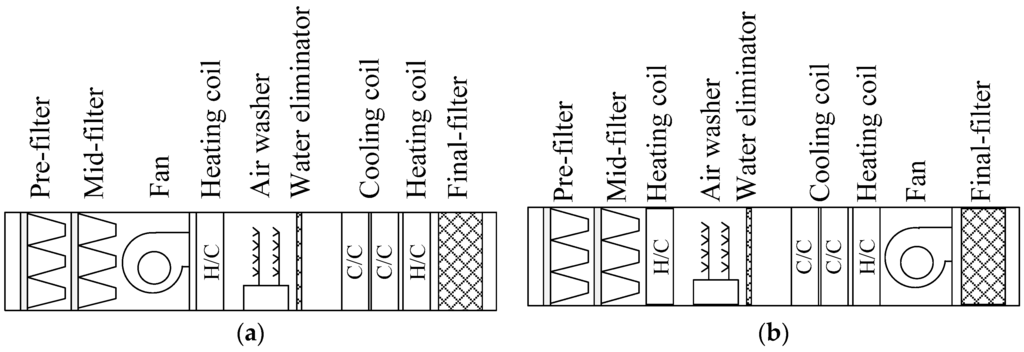
Figure 3.
Components arrangement of MAUs with mist humidifier [3]. (a) A push-through type MAU; and (b) a draft-through type MAU.
On the other hand, energy consumption for controlling humidity by the MAU is huge. Generally, power consumption for air-conditioning in a high-tech facility is about 30%–40% of the total power consumption [3,4,5,6], around 50% of which is accounted for by the chiller. Breaking the power consumption down further, the MAU consumes nearly half of the power load of the chiller [3,4,5,6]. Therefore, it is very important to take energy consumption of the MAU into consideration when operating a fab. There are only a few literatures on energy efficiency of the MAU of cleanrooms [7]. Brown [8] identified energy-saving opportunities within MAU systems for five climatic regions in the United States. Naughton [9,10] pointed out the importance of make-up air systems in semiconductor cleanrooms. Ciborowski and Pluemer [11] described the relationship between fans and acoustic effects of a MAU system in a California semiconductor facility. Sizuki et al. [12] studied the effect of condensation and its treatment on performance of cooling coils inside make-up air units. They obtained 3% energy savings. However, they focused only on cooling equipment, not on equipment of the system itself and thus they did not report on the effects of the MAU system design on energy consumption. Roulet et al. [13] studied real heat recovery with air handling units and Bartholomew [14] investigated recovery of heat from make-up air from exhaust in labs, but neither reported energy-saving opportunities in cooling. Kircher et al. [15] conducted a simulation and modeling of a 1600 m2 university laboratory cleanroom in upstate New York using the TRNSYS model [16] with TMY2 weather data [17]. However, none of the above discussed energy efficiency of individual components of MAU. Chiller energy can account for as much as 10%–20% of total cleanroom energy usage. Standard chiller plant design of cleanrooms provides chilled water at 5–6 °C. While this temperature is required for dehumidification, the low set point imposes an efficiency penalty on the chillers. Typically, heat exchangers and/or mixing loops are used to convert the low temperature, energy intensive chilled water into warmer chilled water for sensible or process cooling loads.
Chiller efficiency is a function of the chilled water supply temperature. Other things being equal, higher chilled water temperatures resulted in improved chiller efficiency. For example, instead of both chillers operating at 6 °C, if one chiller in a dual chiller plant provides water at 12.5 °C, 20%–40% of energy consumption and peak power can be saved. The chilled water temperature is 5 °C for a single-temperature chiller plant system and 5 °C/9 °C for a “dual-temperature” chilled water system [18]. Recently, Wang et al. [19] propose energy use model and energy conservation approaches for a TFT-LCD fab. Their model was verified by monthly energy use. However, no detailed calculation and description on energy conservation approaches are given. This paper aims to compare the effects of the six energy-saving approaches for MAUs in a fab and to identify the best energy-saving approaches. In addition, the simulated results are further compared to the measured data of the studied TFT-LCD fab in Taiwan.
2. Methods
In the present study, we use the simulation software (namely Fab Energy Simulation, FES) to analyze the energy use of the fab. Design parameters or operating conditions such as the room temperature, relative humidity, supply/return temperature of the chilled water, and so on can be inputted via the user interface of the FES. The energy uses in the fabs generally come from several parts, including the HVAC system, exhaust system, process cooling water (PCW), ultra-pure water (UPW), clean dry air (CDA), fan-filter unit (FFU) vacuum, fans (mainly used in the HVAC and exhaust system), pumps (for hot or chilled water), process tools, and lighting system. The detailed description, used models, and validation of the developed FES have been conducted in our recent study [20].
2.1. Basic Conditions of the Fab Studied
The fab is located in the Science Park in Hsinchu, Taiwan. In the studied fab, the cleanroom area is 59,760 m2 (core fabrication area is 49,031 m2). The product is a 3.5 generation small/medium-size display panel with monthly production volume of 75,000 pieces. The quality and design conditions of the utility are described in Table 1.

Table 1.
Operating conditions of the cleanroom.
2.2. Establishing the Baseline of Energy Consumption
Before formulating any energy-saving approach, one should establish the baseline of energy use of the fab. The measured energy use, as shown in Figure 4, is adopted as the base case for the six energy-saving approaches proposed.
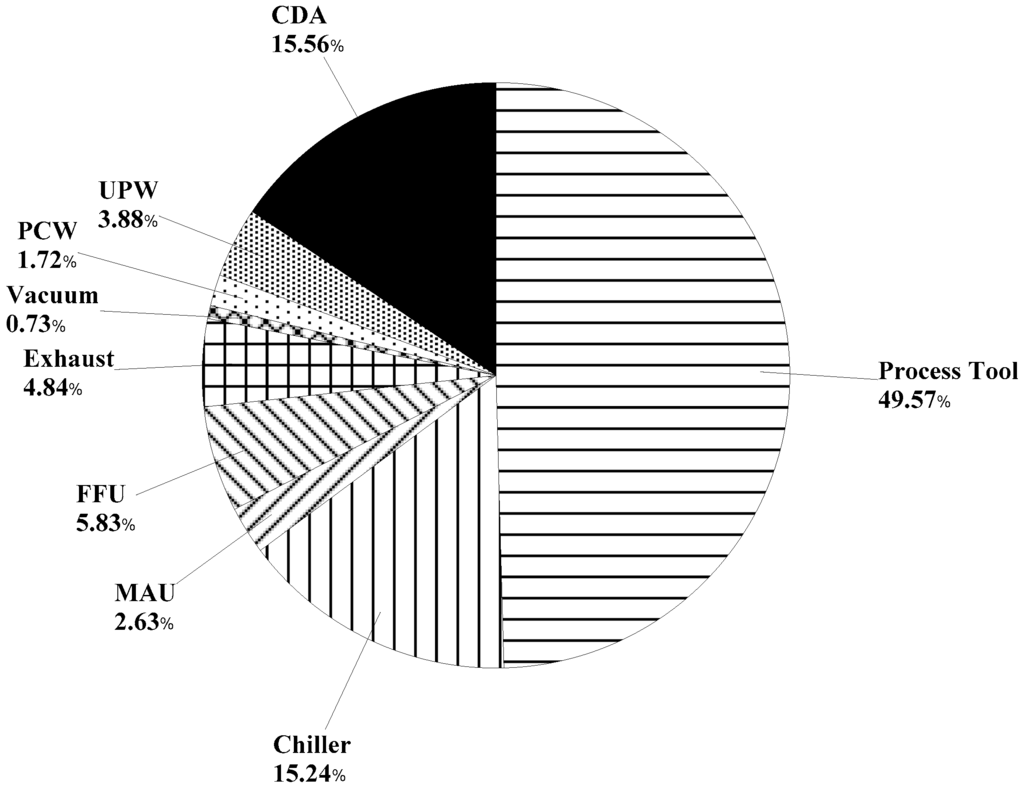
Figure 4.
Measured energy use of the fab.
2.3. Description of the Six Energy-Saving Approaches
The combined chiller and MAU system is the largest energy consumption component of the HVAC system in a fab, as indicated in Figure 4. Six approaches, as detailed in Table 2, are selected because they significantly influence the energy use and only related to the operational mode, without any extra expenditure. Energy-saving approaches to the process tool are not in the scope in this study, although it exhibits great potential. Note that process tool relates to production and is normally very sensitive to the management of the fab.
- (1)
- Approach 1: Adjusting the set point of dry bulb temperature and relative humidity in the cleanroom.
- (2)
- Approach 2: Lower the supply flow rate of make-up air unit.
- (3)
- Approach 3: Use draw through type instead of push through type MAU.
- (4)
- Approach 4: Combine two stage cooling coils in MAU to a single stage coil.
- (5)
- Approach 5: Reduce the original MAU exit temperature from 16.5 °C to 14.5 °C.
- (6)
- Approach 6: Reduce pressure drop across HEPA filters in MAU by increasing frequency of HEPA filter replacement.
Table 2.
Specifications of the energy-saving approaches.
3. Results and Discussion
3.1. Approach 1
This approach is acceptable for most of the area in a fab, except the photolithography area, which is a process very sensitive to temperature variation. Approach 1B exhibits highest energy saving effect, up to 1.01% of annual fab energy consumption, majorly due to a lower cooling load of the MAU. Approach 1D has a negative effect; it consumes 0.94% more of energy (see Table 3). It is noted that the setting on room temperature results a very significant impact on energy-saving. Increasing 1 °C of fab temperature can almost save 1% of fab energy consumption. On the other hand, increasing 3% of RH value in the fab can reduce about 0.65% of fab energy consumption.
Table 3.
Electric power consumption difference of base case and Approach 1.
3.2. Approach 2
Reducing the flow rate of supply air of MAU can reduce the cooling load of the cooling coil in the MAU during summertime and reduce the heating load of pre-heating coil during wintertime. Thus, the total power consumption is reduced. Table 4 shows the simulation results; energy saving of the entire Fab is 0.34%.
Table 4.
Electric power consumption difference of base case and Approach 2.
3.3. Approach 3
The centrifugal fan in the MAU is a kind of fluid mechanics that transports volume instead of mass. As the air density varies when the air temperature changes, transportation of the same volume of low temperature air by fan consumes less energy than transporting high temperature air. For the draft-through type MAU, as the fan is located downstream of cooling coils, the air temperature (also the specific volume) upstream of fan is lower than outdoor air temperature. For the draft-through type MAU, the airflow rate across the fan is less than that in the MAU inlet. Therefore, for the same MAU inlet flow rate, the fan power consumption of the draft-through type MAU is less than that of push-off type. For the same outlet make-up air volume flow rate (i.e., 100,000 m3/h), the draft-through-type MAU requires 97,127 m3/h and the push-through-type MAU requires 105,170 m3/h across the fan (Table 5).
Table 5.
Fan power consumption of draft-through type and push-off type MAU.
In terms of percentage, flow rate (volume) required by the draft-through type MAU is 8.28% less than the push-through type. According to the fan law, the draft-through type MAU consumes 21.23% less power than the push-through type MAU. As stated in the last section, the fan heat load of the draft-through MAU becomes part of the heat source of the re-heating coils, while that of the push-through MAU becomes additional heat load on the cooling coils. Compared with the push-through MAU, savings in electricity consumption for re-heating a draft-through MAU amount to 1,869,576 kWh (as listed in Table 6). This advantage is helpful in reducing the MAU size and downsizing the initial cost of the MAU. However, the housing of draft-through type MAU requires better airtightness than the push-through type MAU. Otherwise, the untreated air infiltrates the conditioned air stream through the seams of MAU housing, which increases the cooling load of MAU during summertime or increases the humidification requirement during wintertime. Moreover, the high negative pressure inside MAU increases the difficulty of draining the condensed water from the cooling coil.
Table 6.
Electric power consumption difference of base case and Approach 3.
3.4. Approach 4
In terms of the initial cost, this approach uses one stage of cooling coil instead of two-stage cooling coils, as shown in Figure 5a,b. As only low temperature chilled water is used, energy consumption in low temperature chiller increases, resulting in an increase of 0.2% in total energy consumption (Table 7). However, the difference between initial costs of single cooling coil and two stage cooling coil is little. Therefore, the increase in operational cost of MAU with single cooling coil easily exceeds the initial cost saving.
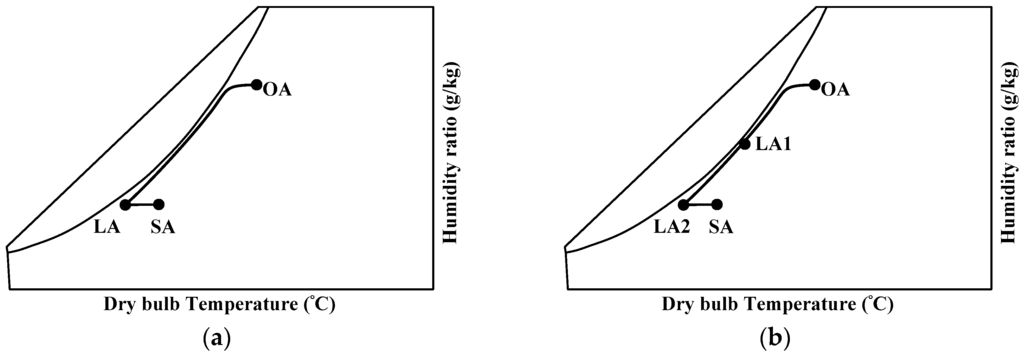
Figure 5.
Air cooling processes of the MAU during summertime. (a) Single cooling coil; and (b) two stage cooling coils.
Table 7.
Electric power consumption difference of base case and Approach 4.
3.5. Approach 5
Reducing the original MAU air exit temperature from SA = 16.5 °C to SA′ = 14.5 °C (as shown in Figure 6a,b) can save 0.22% of total annual energy consumption. The savings come from smaller MAU re-heating and DCC cooling loads. As the chillers are with heat recovery function, i.e., the so-called heat-recovery chillers, which provide warm water (up to about 37 °C) from condensing side, the warm water may be used for reheating. If the hot water generated by heat-recovery chillers is enough for re-heating, no heating facility such as a boiler is required and the energy-saving is mostly from the high temperature chillers, as shown on Table 8. Successive lowering of the air temperature can cause increase of fan power consumption due to higher pressure loss in HEPA filters, caused by the high humidity air. In this case, reducing exit air temperature by 1 °C of MAU saves about 0.1% of fab energy consumption.
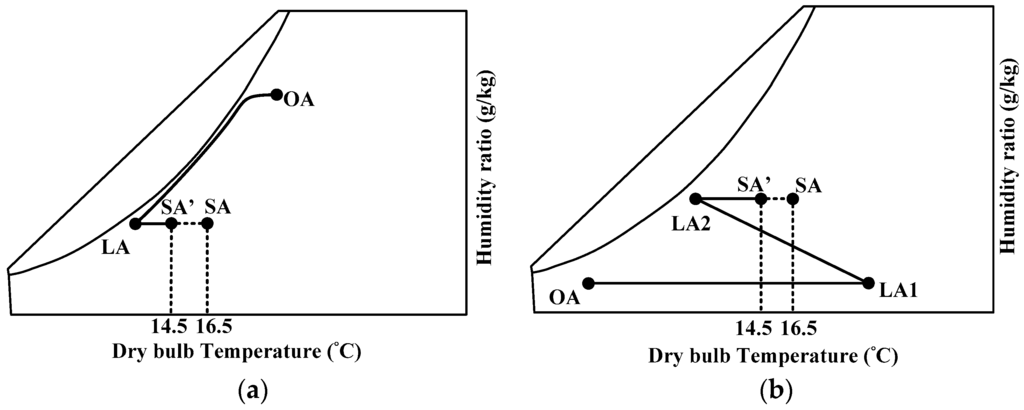
Figure 6.
Reduced MAU supply air temperature (from SA to SA’). (a) Summer; and (b) winter.
Table 8.
Electric power consumption difference of base case and Approach 5.
3.6. Approach 6
Power consumed due to the increased pressure drop over the HEPA filter is simulated by increasing 50, 100, and 150 Pa from the original 1182 Pa. The increase of power consumption is mostly from the fan. The re-heating load is slightly reduced (Table 9), due to a slightly higher temperature rise by the fan power. For Approach 6C, a notable annual 688,801 kWh increase is observed. It is noted that with very high MAU airflow rate, avoiding excessive increase in pressure drop, as the cases studied 50, 100, and 100 Pa, over the filter by replacing HEPA filter more frequently is a worthy approach, as the cost of HEPA filter decreases greatly over the years. By frequently replacing HEPA filter, the pressure drop increase may be maintained to a very low level. Therefore, great fan power increase may be saved. In Approach 6C, pressure drop increase of 100 Pa is avoided and 0.32% of fab energy consumption is saved. In general, about 0.2% of fab energy consumption can be saved by reducing 100 Pa of pressure drop over the filter.
Table 9.
Electric power consumption difference of base case and Approach 6.
The energy consumption for each approach is indicated in Table 10. Approach 1B reduces annual operations energy consumption by 1.01% compared to the base case. This is due to the increase of the humidity ratio from 9.6 g/kg to 10.2 g/kg. The worst case is Approach 1D, which increases the annual energy consumption by 0.94%. This is due to the decrease of humidity ratio from 9.6 g/kg to 9.1 g/kg.
Table 10.
Annual electric power consumption for each approach.
4. Conclusions
This study employs the developed simulation software for the energy use of the high-tech fab to examine six energy-saving approaches for the MAU of a TFT-LCD fab. In addition, the simulated results are further compared to the measured data of the studied TFT-LCD fab in Taiwan. The simulated results demonstrate that the setting on room temperature results a very significant impact on energy-saving. Specifically, increasing 1 °C of fab temperature can almost save 1% of fab energy consumption. On the other hand, increasing 3% of RH value in the fab can reduce about 0.65% of fab energy consumption. Using a single stage coil or push-off type MAU surprisingly consumes more energy. Reducing exit air temperature of MAU by 1 °C saves about 0.1% of fab energy consumption. Avoiding excessive increases in pressure drop over the filter by more frequently replacing HEPA filter is economically possible and its effect on reducing energy consumption is notable, about 0.2% of fab energy consumption can be saved by reducing 100 Pa of pressure drop over the filter.
Acknowledgments
This research project benefited from funding supports from the Ministry of Science and Technology of Taiwan (R.O.C.) with contract number: 104-2622-E-027-011, and from the Department of Industrial Technology, Ministry of Economic Affairs, Taiwan (R.O.C.) with project number: 101-EC-17-A-15-S1-223.
Author Contributions
Cheng-Kuang Chang and Jung-Sheng Hsu collected/analyzed the data. Tee Lin interpreted the results. Shih-Cheng Hu and Ben-Ran Fu prepared/revised the manuscript.
Conflicts of Interest
The authors declare no conflict of interest.
References
- Chen, J.; Hu, S.C.; Tsao, J.M.; Chien, L.H.; Lin, T. Humidification of Large-Scale Cleanrooms by Adiabatic Humidification Method in Subtropical Areas: An Industrial Case Study. ASHRAE Trans. 2009, 115, 299–305. [Google Scholar]
- Tsao, J.M.; Hu, S.C.; Xu, T.; Chan, D.Y.L. Capturing energy-saving opportunities in make-up air systems for cleanrooms of high-technology fabrication plant in subtropical climate. Energy Build. 2010, 42, 2005–2013. [Google Scholar] [CrossRef]
- Hu, S.C.; Chuah, Y.K. Power consumption for semiconductor fabs in Taiwan. Energy 2003, 28, 895–907. [Google Scholar] [CrossRef]
- International SEMATECH Manufacturing Initiative (ISMI). Worldwide Fab Energy Survey Report; Technology Transfer #99023669A-ENG; ISMI: Austin, TX, USA, 1999; pp. 13–18. [Google Scholar]
- International SEMATECH Manufacturing Initiative (ISMI). Summary Facilities Energy Consumption in 200 mm and 300 mm Fabs; Technology transfer #08024920A-TR; ISMI: Albany, NY, USA, 2008. [Google Scholar]
- Japan Mechanical Association. Energy Consumption Survey Report; Japan Mechanical Association: Shinjuku-ku, Japan, 1990. (In Japanese) [Google Scholar]
- ASHRAE. ASHRAE. Chapter 18, Clean Space. In ASHRAE Handbook HVAC Application; ASHRAE: New York, NY, USA, 2011. [Google Scholar]
- Brown, W.K. Makeup air systems energy-saving opportunities. ASHRAE Trans. 1990, 96, 609–615. [Google Scholar]
- Naughton, P. HVAC Systems for Semiconductor Cleanrooms—Part 1: System Components. ASHRAE Trans. 1990, 96, 620–625. [Google Scholar]
- Naughton, P. HVAC Systems for Semiconductor Cleanrooms—Part 2: Total System Dynamics. ASHRAE Trans. 1990, 96, 626–633. [Google Scholar]
- Ciborowski, T.J.; Pluemer, H. Actual results of energy efficient designs. In Cleanroom Technology Forum Proceedings; Canon Communications: Los Angeles, CA, USA, 1991. [Google Scholar]
- Suzuki, H.; Hanaoda, H.; Ohkubo, Y.; Yamazaki, Y.; Shirai, Y.; Ohmi, T. Energy saving in semiconductor fabs by out-air handling unit performance improvement. In Proceedings the 9th International Symposium on Semiconductor Manufacturing, Tokyo, Japan, 26–28 September 2000.
- Roulet, C.A.; Heidt, F.D.; Foradini, F.; Pibiri, M.C. Real heat recovery with air handling units. Energy Build. 2001, 33, 495–502. [Google Scholar] [CrossRef]
- Bratholomew, P. Makeup air heat recovery saving energy in labs. ASHRAE J. 2004, 46, 35–40. [Google Scholar]
- Kircher, K.; Shi, X.; Patil, S.; Zhang, K.M. Cleanroom energy efficiency strategies: Modeling and simulation. Energy Build. 2010, 42, 282–289. [Google Scholar] [CrossRef]
- Solar Energy Laboratory. TRNSYS User Manual; University of Wisconsin-Madison: Madison, WI, USA, 1996. [Google Scholar]
- National Renewable Energy Laboratory. User’s Manual for TMY2s. Available online: http://rredc.nrel.gov/solar/pubs/tmy2/overview.html (accessed on 15 May 2009).
- Tsao, J.M.; Hu, S.C.; Chan, D.Y.L.; Hsu, R.T.C.; Lee, J.C.C. Saving energy in the make-up air unit (MAU) for semiconductor cleanrooms in subtropical areas. Energy Build. 2008, 40, 1387–1393. [Google Scholar] [CrossRef]
- Wang, V.S.; Sie, C.F.; Chang, T.Y.; Chao, K.P. The evaluation of energy conservation performance on electricity: A case study of the TFT-LCD optronics industry. Energies 2016, 9, 206. [Google Scholar] [CrossRef]
- Lin, T.; Hu, S.C.; Fu, B.R.; Cheng, I.Y. Development, validation, and application of an analysis tool for the energy use of high-tech fabrication plants. Energies 2016. submitted. [Google Scholar]
© 2016 by the authors; licensee MDPI, Basel, Switzerland. This article is an open access article distributed under the terms and conditions of the Creative Commons Attribution (CC-BY) license (http://creativecommons.org/licenses/by/4.0/).