Abstract
Surrounded by the ocean, Taiwan has been increasingly developing coastal tourism projects. Concerns that negative impacts might be brought about by prosperous tourism have resulted in a recent focus on sustainable tourism. Sustainable tourism involves policies that acknowledge the interdependences among the environment, the community, and the economy. The goal of sustainable tourism is to enhance and protect the environment while satisfying basic human requirements, as well as those of the contemporary and future tourism industries to improve quality of life. On the other hand, unsustainable coastal tourism might undermine the natural environment and society, resulting in air, water, and soil pollution, wildlife habitat disruption, and changes of local community cultural characteristics. Therefore, performance evaluation of coastal tourism, using an indicator framework to facilitate sustainable development and enhance the effectiveness of coastal resources exploitation, is critical. Through a literature review and expert surveys using the methods of the fuzzy Delphi method (FDM) and the fuzzy analytic hierarchy process (FAHP), this study builds a performance indicator framework and identifies the key factors affecting the sustainable development of coastal tourism in Taiwan. The results can serve as a reference for the public sector to be used for the sustainable planning and development of coastal tourism.
1. Introduction
The tourism industry in Taiwan is growing at a fast pace. The Taiwanese government continuously encourages the development of the tourism sector to boost economic revenues. Since Taiwan is an island, the development of coastal tourism is crucial for the tourism industry as a whole. Coastal areas contribute greatly to sustain people’s lives and lifestyles, such as by providing food, materials, shelter, and recreational amenities. In 1992, the United Nations proposed Agenda 21, which described the marine environment as part of the life-support system of Earth. However, if the coastal environment is a very valuable asset for human development, it is also very vulnerable [1]. Inappropriate planning can damage natural resources and negatively affect coastal communities. To ensure sustainability, it is of utmost importance to develop tools that seek the implementation of careful tourism planning.
Sustainable tourism planning for coastal areas aims at monitoring changes in the coastal zone and adjusting strategies so that a balance can be found between economic, environmental, and societal aspects. There is no recipe for reaching this balance but rather a conceptual framework from which planning procedures and appropriate management methods can be derived to sustainably develop the coastal area, preserve natural resources and culture, while incorporating tourism activities and facilities that satisfy tourists’ experiences [2].
Taiwan, which encompasses a group of islands, is situated between longitudes 120° and 122° E and between latitudes 22° and 25° N. The main island is surrounded by the Pacific Ocean to its east and the Taiwan Strait to its west. Being 377 km long along the north–south direction and 142 km wide along the east–west direction, the main island has approximately 1200 km of coastline. Adding the Penghu archipelago leads to a total coastline of approximately 1520 km. Most of these coasts have sandy beaches, which support very diverse recreational activities and encourage tourism development. Facing the increasing pressure of coastal tourism on local communities and the environment, action should be taken now.
The present study aims to develop a performance indicator framework for the evaluation of coastal tourism sustainability. The framework is intended to provide a holistic view focused on balancing environmental conservation, economic development and socio-cultural harmony, by building a set of indicators. Using such an approach allows for the evaluation of current tourism development plans and the formulation of strategies that seek sustainability. The results are expected to serve as a reference for public sectors and stakeholders.
2. Methodologies
2.1. Fuzzy Delphi Method (FDM)
Fuzzy set theory was proposed by professor Zadeh of the University of California, Berkeley, in 1965 [3]. Since traditional scientific methods ignore fuzziness and uncertainty existing in human life, Zadeh developed fuzzy set theory to address what human language cannot precisely describe or measure.
The Delphi method is an expert knowledge acquisition approach and a group decision-making method that aims at obtaining a consensus from an expert group regarding a specific issue. The Delphi method not only enables the collection of wide and numerous evaluation standards, but also maintains the quality of individual expert judgment [4]. However, since opinions are often expressed with adjectives such as “good” or “bad”, some level ambiguity is likely to result from the Delphi process. In order to lower the resulting uncertainty, the fuzzy Delphi method was proposed [5]. We chose to use the max-min fuzzy Delphi method proposed by Ishikawa et al. [6], for which the operation steps are listed as follows:
- Step 1: Establish two cumulative frequency distribution functions for the value with the highest degree of agreement F1(x) and the value with the lowest degree of agreement F2(x).
- Step 2: Calculate the first quartile, median, and third quartile of F1(x) and F2(x), which are represented by (C1, M1, D1) and (C2, M2, D2), respectively.
- Step 3: Connect (C1, M1, D1) and (C2, M2, D2) to obtain the target value X* at the intersection.
The overlapped part (C1, X*, D2) of the first quartile, median, and the third quartile of F1(x) and F2(x) shown in Figure 1 is known as the gray area.
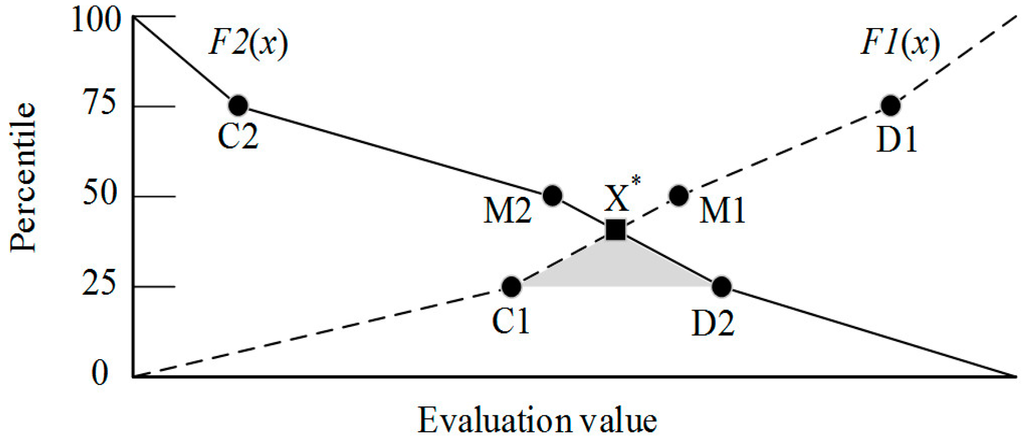
Figure 1.
Max–min FDM membership function and target value X*.
After calculating the prediction value xi of the evaluation factor Ai by using the FDM, we defined the threshold value S to screen for evaluation factors that satisfy the research requirements as follows:
- (1)
- If xi is greater than or equal to S, Ai is accepted as an evaluation factor; or
- (2)
- If xi is lower than S, Ai is rejected as an evaluation factor.
Threshold settings are dependent on distinct needs. By using the max–min FDM, the study was able to screen the preliminary performance indicators based on the experts’ consensus for the subsequent weighting calculation.
2.2. Fuzzy Analytic Hierarchy Process (FAHP)
The purpose of the FAHP is to solve semantic fuzziness and uncertain judgment problems when experts are deciding relative importance in a conventional analytic hierarchy process (AHP). Incorporating the concept of fuzziness can formulate conceptual semantics mathematically. Since the logic of people’s thinking is typically fuzzy, judgment is often made even if the condition and data are unclear. However, computers must operate based on numbers, which do not conform to the fuzzy thinking logic of human beings. Through the use of membership functions, the subjective judgment of people can be numeralized to facilitate more flexible processes in response to decision-making. Fuzzy sets can be used to express the sets containing things of a specific nature without a clear boundary or border. The goal of employing fuzzy sets is to address uncertainty and fuzziness in reality [7].
We used the concept of triangular fuzzy number, as shown in Figure 2, to replace the pairwise comparison of AHP proposed by Saaty [8]. Geometric means were then applied to calculate fuzzy weighting. This approach effectively solves the potential fuzzy problems during a criterion decision-making process [9]. For the FAHP, interval values were applied to replace exact values in the conventional AHP; thus, experts could evaluate problems from a user-friendly scale and provide reasonable comparison values during the decision-making process.
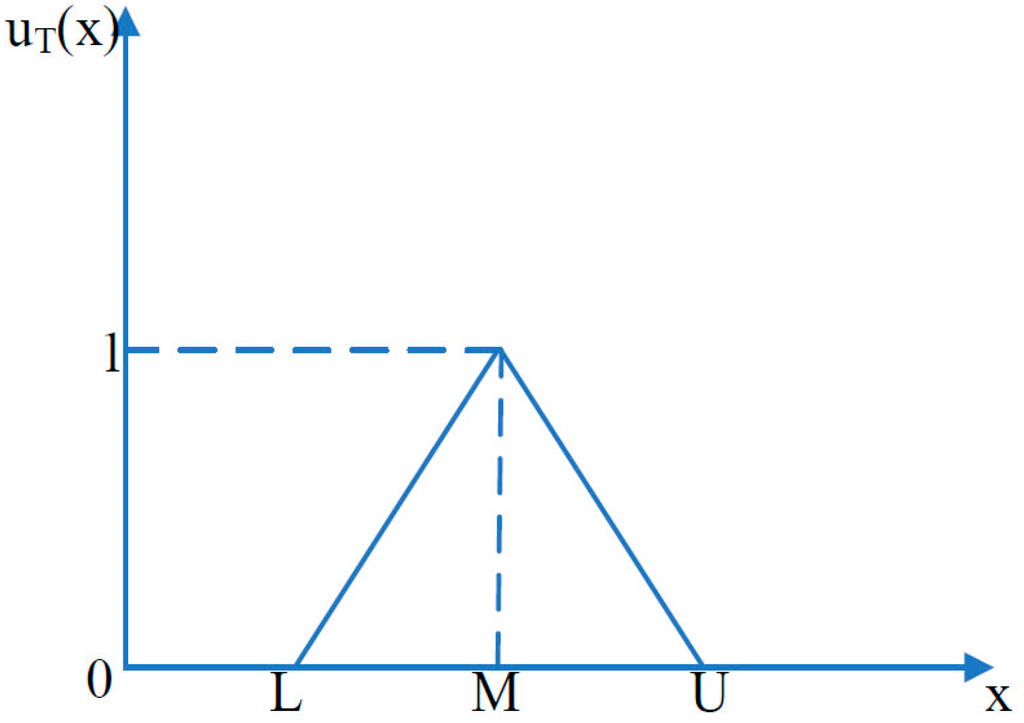
Figure 2.
Triangular fuzzy number.
The detailed implementation procedure of the fuzzy pairwise comparison matrix was performed as follows. Triangular fuzzy numbers were extracted through the transformations described in Table 1 to convert the experts’ opinions. After compiling and calculating the fuzzy numbers for each indicator’s weight, the fuzzy weights were defuzzified to yield crisp weights, which were then normalized to yield a set of comparable weights for the indicators. Finally, a hierarchy of indicators was formulated. The public sector can apply the indicator framework to determine the priority of alternative coastal tourism development plans based on the performance scores. Additionally, the indicator framework articulates the importance of each indicator which influences the sustainable development of coastal tourism.

Table 1.
Fuzzy evaluation scale.
The detailed steps and calculation methods are listed as follows:
2.2.1. Determination of the Fuzzy Pairwise Comparison Matrix
If a conventional judgment matrix A = [aij] is a positive reciprocal, all numbers in the matrix become fuzzy numbers, instead of single values. The matrix then becomes the fuzzy positive reciprocal .
2.2.2. Calculation of Fuzzy Weightings
In accordance with Buckley [10], fuzzy weighting values were calculated using the geometric mean:
Among which
- :column i row j of matrix, i, j = 1, 2, . . . , n;
- :column vector mean value of fuzzy number, i = 1, 2, . . . , n;
- :weight of i-th indicator.
- ⊗: multiplication of fuzzy numbers
- ⊕: addition of fuzzy numbers
2.2.3. Defuzzification
The center of gravity method was applied to defuzzify weighting values as follows:
2.2.4. Normalization
The weighting value of each indicator i was normalized as follows:
2.2.5. Building the Global Weight of Each Indicator
After the preceding steps, weighting values of all dimensions and indicators were determined. To further identify the global weight of the j-th indicator in the bottom level under the i-th dimension, the calculation was conducted based on the hierarchical structure, as follows:
3. Research Flow and Preliminary Indicator Framework
3.1. Research Flow
The research flow is shown on Figure 3. After reviewing the literature on sustainable coastal tourism, we built a preliminary (stage 1) indicator set to cover the diverse aspects that were deemed important to include in the framework.
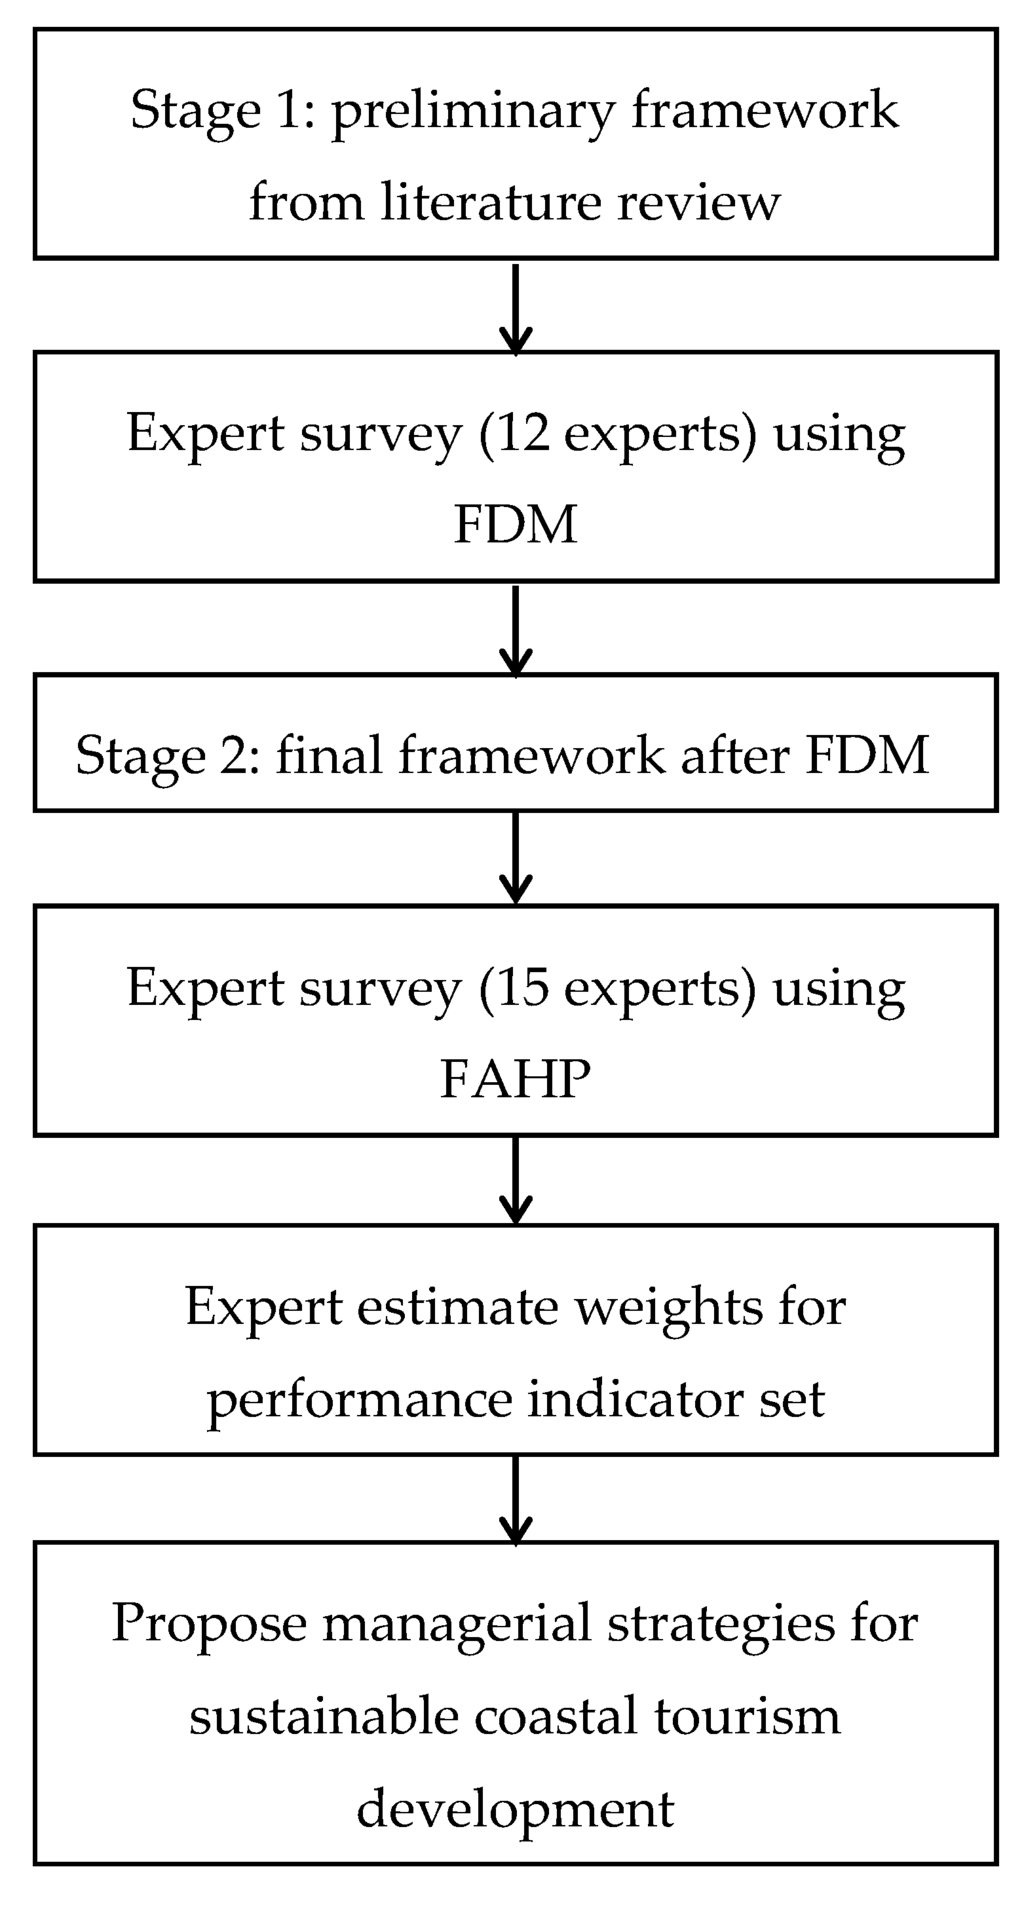
Figure 3.
Study flowchart.
FDM was then applied to consolidate the initial framework with experts’ opinions. Twelve experts from the academic, public, and private sectors were recruited during this phase. Details concerning the profiles of FDM experts are given in Table 2.
Table 2.
FDM expert profiles.
FDM induced modifications in the indicators set which led to the establishment of a (stage 2) final framework.
Another group of fifteen experts was consulted and FAHP was applied with them to calculate the weights for the indicators of the final framework. Details concerning the profiles of FAHP experts are given in Table 3.
Table 3.
FAHP expert profiles.
3.2. Preliminary Indicator Framework
The (stage 1) preliminary performance evaluation framework was organized into a framework covering six dimensions and twenty-nine indicators. According to the literature review, the sustainable coastal tourism needs to consider diverse criteria which were categorized into (a) environment and ecology, (b) economy and development, (c) society and culture, (d) tourism and recreational value creation, (e) management and policy, and (f) climatic conditions. Table 4 presents the contents of these dimensions and associated literature references. For each dimension, several indicators for performance assessment were selected. For example, the indicator “ecological planning”, “pollution prevention”, “environmental maintenance”, “ecological restoration system”, “environmental monitoring system”, and “landscape diversity” are related to the dimension “environment and ecology”.
Table 4.
Dimension and contents of the preliminary (stage 1) indicator framework.
4. Results and Discussion
The responses of the FDM questionnaire from twelve experts were used to finalize the stage 1 indicator framework. Following is an illustrative example of FDM process using the dimension of environment and ecology.
- (1)
- Initially, we built the cumulative frequency distributions of two functions, F1(x) representing the highest value in an interval of agreement, and F2(x) the lowest value in an interval of agreement, based on the FDM questionnaires. For illustration purposes, results related to the dimension of environment and ecology are shown in Table 5.
Table 5. Max–min cumulative frequency of the “environment and ecology” dimension.
- (2)
- The first quartile, median, and third quartile of F1(x) and F2(x) were calculated and expressed as (C1, M1, D1) and (C2, M2, D2). According to the max–min cumulative frequency of F1(x) and F2(x) shown in Table 3, the first quartile, median, and third quartile of F1(x) and F2(x) were F1 (C1, M1, D1) = (7.5, 8.5, 9.25), respectively, and F2 (C2, M2, D2) = (5.5, 7.5, 8.25), respectively.
- (3)
- The intersecting points of (C1, M1, D1) and (C2, M2, D2) represent the target importance value X*. The arithmetic means of C1 and D2 is the intersecting point X* of F1(x) and F2(x) [25]. The X* for the dimension of environment and ecology was (C1 + D2)/2 = (7.5 + 8.25)/2 = 7.88, which summarized the importance of this dimension based on the experts’ opinions. By following the aforementioned steps, the importance values of each dimension and indicator were calculated, as shown in Table 4.
We set the threshold to eliminate less important indicators to a value of 7; dimensions and indicators with an X* value larger or equal to 7 passed the screening process and were adopted in the final evaluation framework for the next stage of FAHP weighting calculation [25,26,27]. The indicator “economic subsidy” under the dimension of “economy and development”, “budget execution” under “management and policy”, and “typhoons” under “climatic conditions” failed to pass the screening threshold (these are grayed out in Table 6). After examining the experts’ responses, we found that three governmental experts and one industry expert gave low importance to “economic subsidy”. Two academic experts and one governmental expert gave low importance to “budget execution”. Two governmental experts and one academic expert gave low importance to “typhoons”. These three indicators were, thus, removed from the indicator framework. The remaining twenty-six indicators still accounted for 89.66% of the preliminary evaluation items. It is noteworthy that results are dependent on the composition of the group of experts. Therefore, it is important to ensure that a variety of sectors, backgrounds, and interests are represented within the group. If possible, more than one expert in each field should be invited to participate in the process.
Table 6.
Importance value of each level of indicator through FDM (indicators with X* < 7 are grayed).
After the FDM screening process was completed, the final performance indicator framework was constituted by six main dimensions and twenty-six indicators. FAHP was then applied by assigning a pairwise comparison questionnaire to the other group of experts. Experts’ responses were analyzed through fuzzification and defuzzification processes using the software Power Choice (Ixon Technology, Taipei, Taiwan) for the calculation of weighting values. Power Choice is a hybrid software system accommodating various multi-criteria decision-making methods, including FAHP. Weights at the dimensional level are shown in Table 7.
Table 7.
Dimensional level weighs and ranks by FAHP.
Power Choice returned low (<0.1) values for both the consistency index and consistency ratio, suggesting that the structure of the FAHP framework is acceptable as is. The experts recognized that “environment and ecology” and “management and policy” were the most important two dimensions influencing the sustainable development of coastal tourism in Taiwan. This result is similar to the finding of the other group of experts who previously participated in the FDM. Eventually the weighting values of all indicators were derived from the FAHP questionnaire using fuzzification and defuzzification processes. The weights and ranks of the indicators are shown in Table 8, while the sorted histogram is displayed as Figure 4.
Table 8.
Weights and ranks of the performance evaluation indicators.
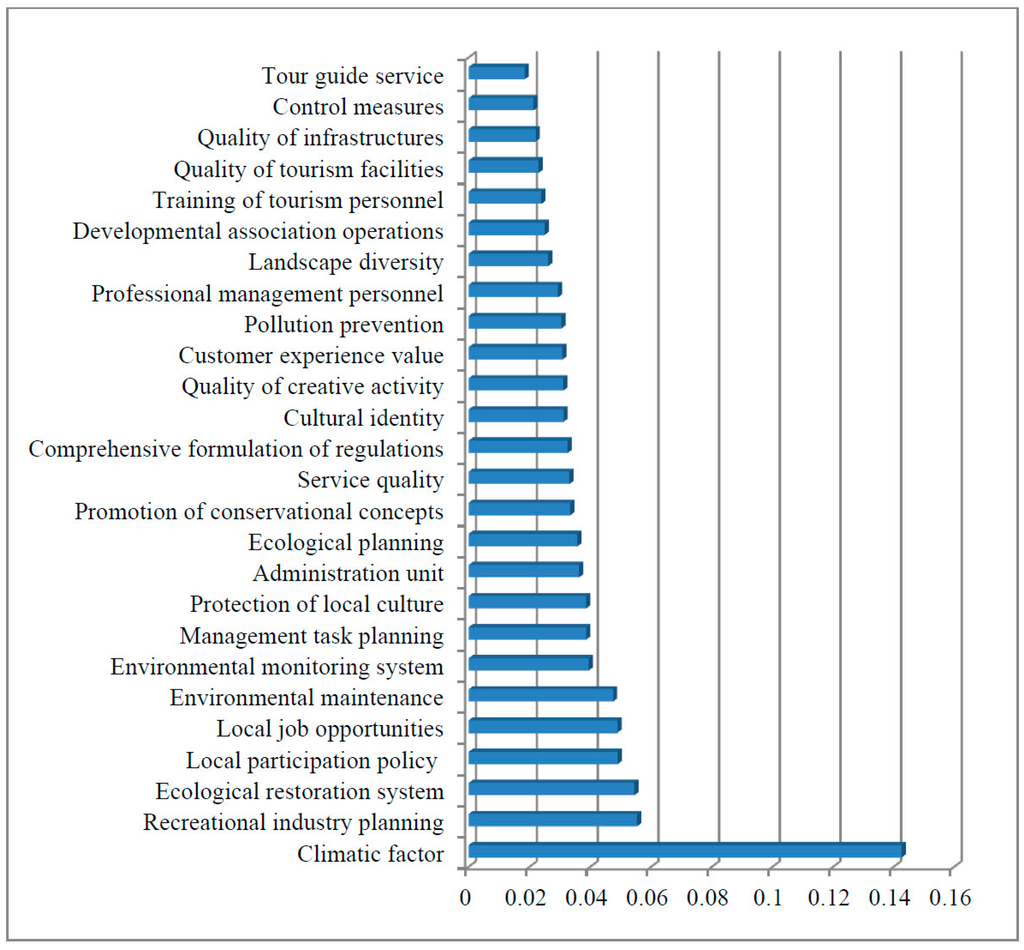
Figure 4.
Sorted weight histogram of all indicators.
The climatic factor, which is under the dimension of “climatic condition”, has the highest weight among all indicators, although the corresponding aspect is ranked fourth out of six dimensions. This situation is reasonable since there is only one indicator under this dimension, and the weight in the criterion level is the same as in the dimensional level. The other indicators have to share the weights with the group of indicators belonging to the same dimension. Tourism is a particularly climate-sensitive economic sector, considering that climate change affects a number of key factors pertinent to the tourism industry [28]. Climate plays an important role in tourism, especially on destination choice and the timing of travel [29,30,31]. Additionally, Taiwan faces changeable weather conditions due to its unique geographic location, which makes the indicator of climatic factor extremely important when considering the sustainable development of coastal tourism.
The indicators of “recreational industry planning” and “local job opportunities”, both belonging to the “economy and development” dimension, are ranked second and fifth. The results indicate that an appropriate planning for local recreational activities associated with coastal tourism may increase local resident employment chances. Public sectors thus need to develop a sustainable coastal tourism plan based on natural scenery, cultural heritage, and other recreational activities which could enhance local economy. Without careful planning and local economic development, coastal tourism may be a flash in the pan. For many communities, countries and regions around the world, coastal tourism constitutes the main economic sector and source of employment [32]. For example in Calvià, a coastal town in the island of Majorca (Spain), 95% of the jobs in 2002 were related to tourism [33].
“Ecological restoration system” is ranked third by the experts, showing a strong need to improve the current situation in Taiwan. Due to inappropriate coastal and watershed development, many coastal zones face the problem of coastal erosion. To mitigate coastline retreat, extensive coastal protection works have been implemented by building concrete breakwaters or placing armor blocks, causing the side-effect of degraded ecosystems. It is, therefore, important to recover the damaged ecosystem, such as wetlands, estuaries, sand dunes, and landscapes, which have high values for sustainable coastal tourism. Especially, coastal wetland ecosystems have been suffering from serious degradation, alteration or loss due to intense anthropogenic activities (i.e., pollution and drainage) [34,35,36] and, thus, coastal wetlands are listed amongst the most heavily damaged of natural ecosystems worldwide [37]. Habitat management is particularly important to the coastal zones of Taiwan to protect natural habitats from the threat of erosion [38].
“Local participation policy” is ranked fourth in the evaluation framework. The experts highly supported the idea that this indicator should be of paramount importance for the public sector since local stakeholder involvement is for a necessary condition for sustainable development. However, many political decisions related to the coastal tourism sector in Taiwan still adopt the top-down approach without much consideration for local people opinions. To involve local stakeholders for policy-making should seek to build a consensus toward the modalities of sustainable coastal tourism development. The lack of or ineffective stakeholder participation is a major obstacle to sustainable tourism [39]. In particular, local participation and support is a very critical factor for sustainable tourism in Taiwan [40,41].
Sustainable tourism, as based on the principles of sustainable development, takes “full account of its current and future economic, social and environmental impacts” [33] and addresses the needs of stakeholders [39]. The first fifteen indicators within the performance evaluation framework of sustainable coastal tourism account for 71.78% of the total weight. These indicators cover all six dimensions articulated in the hierarchy structure. Therefore public sectors and local stakeholders may pay more attention to the fulfillment of these fifteen indicators given limited resources. At least 70% of ideal performance for sustainable coastal tourism in Taiwan can thus be attained.
5. Conclusions
Recently, more visitors have been attracted to the coastal areas in Taiwan for tourism activities. This emerging coastal tourism pressure has made the study of sustainable coastal tourism imperious, so that the impact on the environment can be reduced, while coastal zone development is still promoted. This study adopted a comprehensive approach to establish a performance indicator framework for the evaluation of coastal zone sustainable tourism. Through an extensive literature review, an initial evaluation hierarchy structure was built covering six dimensions and twenty-nine indicators. FDM was then applied by the expert surveys to identify the most important dimensions and indicators. Three indicators were eliminated and the final performance evaluation framework was set forth for consecutive FAHP analyses. Based on the second round of expert surveys using FAHP, the weights associated with all dimensions and indicators were identified. The resulting performance indicator framework can be used as a general guideline to show the most important issues regarding sustainable development of coastal tourism in Taiwan, according to our group of experts. Furthermore, the evaluation framework has laid a useful foundation for future case analyses. The central government agent, in charge of coastal tourism, may adopt this framework to assess the overall performance of each subordinate agent. A local public sector may also apply this evaluation framework to review strengths and weaknesses of current coastal tourism development, so that better managerial plans can be conceived toward sustainable coastal tourism.
Acknowledgments
The authors would like to thank the Ministry of Education, Taiwan, under the ATU plan to NSYSU, and the support from the NSYSU-NKMU joint research project. We also acknowledge the efforts of the reviewers.
Author Contributions
All four authors significantly contributed to the scientific study and writing. Shih-Hao Wang and Yang-Chi Chang worked together to set up and complete the study. Meng-Tsung Lee and Pierre-Alexandre Château helped the study with methodology usages and expert surveys. The manuscript was prepared by all four authors.
Conflicts of Interest
The authors declare no conflict of interest.
Abbreviations
The following abbreviations are used in this manuscript:
| AHP | Analytics Hierarchy Process |
| FAHP | Fuzzy Analytic Hierarchy Process |
| FDM | Fuzzy Delphi Method |
References
- Branch, G.M.; Thompson, R.C.; Crowe, T.P.; Castilla, J.C.; Langmead, O.; Hawkins, S.J. Rocky intertidal shores: Prognosis for the future. In Aquatic Ecosystems: Trends and Global Prospects; Pollunin, N.V.C., Ed.; Cambridge University Press: Cambridge, UK, 2008; pp. 209–225. [Google Scholar]
- Kay, R.; Alder, J. Coastal Planning and Management; Taylor & Francis Group: London, UK, 2005. [Google Scholar]
- Zadeh, L.A. Fuzzy Sets. Inf. Control 1965, 8, 338–353. [Google Scholar] [CrossRef]
- Chiu, W.Y.; Lee, Y.D.; Lin, T.Y. Performance evaluation criteria for personal trainers: An analytical hierarchy process approach. Soc. Behav. Personal. 2010, 38, 895–905. [Google Scholar] [CrossRef]
- Murray, T.J.; Pipino, L.L.; van Gigch, J.P. A pilot study of fuzzy set modification of Delphi. Hum. Syst. Manag. 1985, 5, 76–80. [Google Scholar]
- Ishikawa, A.; Amagasa, M.; Shiga, T.; Tomizawa, G.; Tatsuta, R.; Mieno, H. The max-min Delphi method and fuzzy Delphi method via fuzzy integration. Fuzzy Set Syst. 1993, 55, 241–253. [Google Scholar] [CrossRef]
- Dubois, D.; Prade, H. Operations on Fuzzy Numbers. Int. J. Syst. Sci. 1978, 9, 613–626. [Google Scholar] [CrossRef]
- Saaty, T.L. The Analytic Hierarchy Process; McGraw-Hill: New York, NY, USA, 1980. [Google Scholar]
- Chen, S.J.; Hwang, C.L. Fuzzy Multiple Attribute Decision Making Method and Application; Springer-Verlag: New York, NY, USA, 1992; pp. 467–469. [Google Scholar]
- Buckley, J.J. Fuzzy Hierarchy Analysis. Fuzzy Set Syst. 1985, 17, 233–247. [Google Scholar] [CrossRef]
- Young, M.D. Sustainable Investment and Resource Use: Equity, Environmental Integrity and Economic Efficiency; Parthenon Publishing Group: Cornforth, UK, 1992. [Google Scholar]
- Lane, B. Sustainable rural tourism strategies: a tool for development and conservation. J. Sustain. Tour. 1994, 2, 102–111. [Google Scholar] [CrossRef]
- McCool, S.F.; Watson, A.E. (Eds.) Linking Tourism, the Environment, and Sustainability; Intermountain Research Station, USDA Forest Service: Ogden, UT, USA, 1995.
- Duxbury, J.; Dickinson, S. Principles for sustainable governance of the coastal zone: In the context of coastal disasters. Ecol. Econ. 2007, 63, 319–330. [Google Scholar] [CrossRef]
- Atik, M. Environmental protection in coastal recreation sites in Antalya, Turkey. Coast. Manag. 2010, 38, 598–616. [Google Scholar] [CrossRef]
- Rivera, J.; de Leon, P. Chief executive officers and voluntary environmental performance: Costa Rica’s certification for sustainable tourism. Policy Sci. 2005, 38, 107–127. [Google Scholar] [CrossRef]
- Turton, S.M. Managing environmental impacts of recreation and tourism in rainforests at the wet tropics of Queensland world heritage area. Geogr. Res. 2005, 43, 140–151. [Google Scholar] [CrossRef]
- Moscardo, G.; Woods, B. Managing tourism in the wet tropics world heritage area. In Embracing and Managing Change in Tourism; Laws, E., Faulkner, B., Moscardo, G., Eds.; Routledge: London, UK, 1998; pp. 307–323. [Google Scholar]
- Miller, G. The development of indicators for sustainable tourism: Results of a Delphi survey of tourism researchers. Tour. Manag. 2001, 22, 351–362. [Google Scholar] [CrossRef]
- Lee, C.F.; Huang, H.I.; Yeh, H.R. Developing an evaluation model for destination attractiveness: Sustainable forest recreation tourism in Taiwan. J. Sustain. Tour. 2010, 18, 811–828. [Google Scholar] [CrossRef]
- Wight, P. Tools for Sustainability Analysis in Planning and Managing Tourism and Recreation in the Destination. In Sustainable Tourism: A Geographical Perspective; Hall, C.M., Lew, A.A., Eds.; Addison Wesley Longman Limited: Harlow, UK, 1998; pp. 75–91. [Google Scholar]
- Dumasi, C.F.; Whitehead, J.C. The potential economic benefits of coastal ocean observing systems: The southeast Atlantic region. Coast. Manag. 2008, 36, 146–164. [Google Scholar] [CrossRef]
- Maddison, D.; Rehdanz, K. The impact of climate on life satisfaction. Ecol. Econ. 2011, 70, 2437–2445. [Google Scholar] [CrossRef]
- Ghermandi, A.; Nunes, P.A.L.D. A global map of coastal recreation values: Results from a spatially explicit meta-analysis. Ecol. Econ. 2013, 86, 1–15. [Google Scholar] [CrossRef]
- Tong, R.M.; Bonissone, P.P. Linguistic Solutions to Fuzzy Decision Problems. In TMS/Studies in the Management Science; Zimmermann, H.J., Ed.; Elsevier Science Publishers B.V: Amsterdam, The Netherlands, 1984; pp. 323–334. [Google Scholar]
- Bass, S.M.; Kwakernaak, H. Rating and ranking of multiple aspect alternatives using fuzzy sets. Automatica 1977, 13, 47–58. [Google Scholar] [CrossRef]
- Chen, S.H. Ranking fuzzy numbers with maximizing set and minimizing set. Fuzzy Set Syst. 1985, 17, 113–129. [Google Scholar] [CrossRef]
- Michailidou, A.V.; Vlachokostas, C.; Moussiopoulos, Ν. Interactions between climate change and the tourism sector: Multiple-criteria decision analysis to assess mitigation and adaptation options in tourism areas. Tour. Manag. 2016, 55, 1–12. [Google Scholar] [CrossRef]
- Kozak, N.; Uysal, M.; Birkan, I. An Analysis of Cities Based on Tourism Supply and Climatic Conditions in Turkey. Tour. Geogr. 2008, 10, 81–97. [Google Scholar] [CrossRef]
- Hamilton, J.M.; Tol, R.S.J. The impact of climate change on tourism in Germany, the UK and Ireland: A simulation study. Reg. Environ. Chang. 2007, 7, 161–172. [Google Scholar] [CrossRef]
- Hamilton, J.M.; Lau, M.A. The role of climate information in tourist destination choice decision-making. Tourism and global environmental change. In Tourism and Global Environmental Change; Gössling, S., Hall, C.M., Eds.; Routledge: London, UK, 2005; pp. 229–250. [Google Scholar]
- Moreno, A.; Amelung, B. Climate Change and Coastal & Marine Tourism: Review and Analysis. J. Coast. Res. 2009, 56, 1140–1144. [Google Scholar]
- World Tourism Organization. Making Tourism More Sustainable: A Guide for Policy Makers; United Nations Environment Programme: Paris, France, 2005. [Google Scholar]
- Cvetkovic, M.; Chow-Fraser, P. Use of ecological indicators to assess the quality of Great Lakes coastal wetlands. Ecol. Indic. 2011, 11, 1609–1622. [Google Scholar] [CrossRef]
- Lemly, D.A.; Kingsford, T.R.; Thompson, R.J. Irrigated Agriculture and Wildlife Conservation: Conflict on a Global Scale. Environ. Manag. 2000, 25, 485–512. [Google Scholar] [CrossRef] [PubMed]
- Newton, A.; Carruthers, T.J.B.; Icely, J. The coastal syndromes and hotspots on the coast. Estuar. Coast. Shelf Sci. 2012, 96, 39–47. [Google Scholar] [CrossRef]
- Barbier, E.B.; Hacker, S.D.; Kennedy, C.; Koch, E.W.; Stier, A.C.; Silliman, B.R. The value of estuarine and coastal ecosystem services. Ecol. Monogr. 2010, 81, 169–193. [Google Scholar] [CrossRef]
- Chen, C.L.; Bau, Y.P. Establishing a multi-criteria evaluation structure for tourist beaches in Taiwan: A foundation for sustainable beach tourism. Ocean Coast. Manag. 2016, 121, 88–96. [Google Scholar] [CrossRef]
- Waligo, V.M.; Clarke, J.; Hawkins, R. Implementing sustainable tourism: A multi-stakeholder involvement management framework. Tour. Manag. 2013, 36, 342–353. [Google Scholar] [CrossRef]
- Lee, T.H.; Hsieh, H.P. Indicators of sustainable tourism: A case study from a Taiwan’s wetland. Ecol. Indic. 2016, 67, 779–787. [Google Scholar] [CrossRef]
- Lee, T.H. Influence analysis of community resident support for sustainable tourism development. Tour. Manag. 2013, 34, 37–46. [Google Scholar] [CrossRef]
© 2016 by the authors; licensee MDPI, Basel, Switzerland. This article is an open access article distributed under the terms and conditions of the Creative Commons Attribution (CC-BY) license (http://creativecommons.org/licenses/by/4.0/).