Abstract
Cemented tailings backfill (CTB) is widely used in mining operations due to its operational simplicity, reliable performance, and environmental benefits. However, the poor consolidation of fine tailings with ordinary Portland cement (OPC) remains a critical challenge, leading to excessive backfill costs. This study addresses the utilization of modified manganese slag (MMS) as a supplementary cementitious material (SCM) for fine tailings from an iron mine in Anhui, China. Sodium silicate (Na2SiO3) modification coupled with melt-water quenching was implemented to activate the pozzolanic reactivity of manganese slag (MS) through glassy structure alteration. The MMS underwent comprehensive characterization via physicochemical analysis, X-ray diffraction (XRD), and Fourier-transform infrared spectroscopy (FTIR) to elucidate its physicochemical attributes, mineralogical composition, and glassy phase architecture. The unconfined compressive strength (UCS) of the CTB samples prepared with MMS, OPC, tailings, and water (T-MMS) was systematically evaluated at curing ages of 7, 28, and 60 days. The results demonstrate that MMS predominantly consists of SiO2, Al2O3, CaO, and MnO, exhibiting a high specific surface area and extensive vitrification. Na2SiO3 modification induced depolymerization of the highly polymerized Q4 network into less-polymerized Q2 chain structures, thereby enhancing the pozzolanic reactivity of MMS. This structural depolymerization facilitated formation of stable gel products with low calcium–silicon ratios, conferring upon the T-MMS10 sample a 60-day strength of 3.85 MPa, representing a 94.4% enhancement over the T-OPC. Scanning electron microscopy–energy dispersive spectroscopy (SEM-EDS) analysis revealed that Na2SiO3 modification precipitated extensive calcium silicate hydrate (C-S-H) gel formation and pore refinement, forming a dense networked framework that superseded the porous microstructure of the control sample. Additionally, the elevated zeta potential for T-MMS10 engendered electrostatic repulsion, while the aluminosilicate gel provided imparted lubrication, collectively improving the flowability of the composite slurry exhibiting a 26.40 cm slump, which satisfies the requirements for pipeline transportation in backfill operations.
1. Introduction
CTB technology facilitates optimal resource utilization, ameliorates the stress state of surrounding rock masses, and enables the environmentally benign disposal of solid waste, thereby constituting an ideal approach for reconciling ecological preservation with the mitigation of critical safety hazards [1,2]. However, engineering practice demonstrates that the consolidation efficacy of OPC for tailings is frequently suboptimal. Substantial cement consumption significantly elevates backfill expenditures, thereby undermining the economic viability of sustained mining operations [3,4]. Consequently, the development of novel cementitious materials specifically tailored for tailings applications, coupled with cost reduction strategies, constitutes an effective paradigm for overcoming the technical impediments inherent to the cemented backfill process. Within this framework, the high-value utilization of industrial by-products as SCM emerges as a compelling solution [5]. MS is an industrial solid waste generated during the electrolytic production or metallurgical processing of manganese products from manganese carbonate and manganese oxide ores [6]. Given the escalating demand for manganese across the battery, metallurgical, and chemical sectors, the large-scale disposal and resource utilization of MS have become pivotal challenges impeding the sustainable advancement of these industries [7].
Mechanical modification strategies employed by Allahverdi et al. [8] reported that mechanical modification by increasing fineness was effective in enhancing the reactivity of manganese slag. Blended cements with up to 35% replacement meet standard chemical requirements while maintaining volume stability and setting characteristics. Mechanical modification enabled these mixtures to satisfy compressive strength requirements even at the maximum replacement. At a lower replacement of 15%, strength loss remained marginal at approximately 10% across all curing ages. Zheng et al. [9] developed a sustainable chemical modification using silica-rich acid leaching residue of boron mud (BM) and NaOH. Under optimized conditions (NaOH:BM = 0.4~0.7, 80~100 °C), this synthesized activator effectively replaced sodium silicate, yielding composite samples with 68.58 MPa compressive strength. Hydration products consisted mainly of an amorphous C-S-H gel. Frías et al. [10] conducted a comparative analysis of the hydraulic properties of air-cooled and water-quenched manganese slags. This investigation indicated that the cooling regime governed mineralogical evolution: rapid water quenching suppressed the crystallization of inert phases (e.g., akermanite), thereby elevating the amorphous glass content from less than 10% to over 90%. This thermal treatment imparted substantial latent pozzolanic reactivity, enabling the substitution of up to 35% OPC while maintaining compressive strength exceeding 35 MPa. Accordingly, substantial advancements have been achieved in SCM derived from industrial solid wastes [11]. However, significant research gaps persist regarding the utilization of MS as an SCM in CTB applications. An investigation into the vitreous coordination structure and pozzolanic activity of MS therefore presents a dual advantage: addressing both the disposal and environmental challenges associated with MS while concomitantly enhancing the mechanical performance of CTB [12]. This approach establishes a viable pathway for reducing cement consumption and costs, thereby delivering concurrent economic and environmental benefits.
The fundamental understanding among chemical modification, the glass network structure, and the pozzolanic reactivity of MS in CTB systems remains inadequately elucidated. Previous studies mainly focused on macroscopic incorporation effects, while critically neglecting the role of thermally induced structural transformation on its long-term hydration kinetics and cementation efficiency in backfill environments. To elucidate the fundamental structure–reactivity relationship, this work systematically correlates Na2SiO3-modification-induced glass coordination evolution with hydration dynamics and strength development. Firstly, the MMS was prepared via the synergistic activation of smelting-derived manganese slag through combined Na2SiO3 chemical modification and melt-quenching. The physicochemical properties, mineralogical characteristics, and glass coordination structure of MMS were systematically investigated using comprehensive characterization methods, including physicochemical analysis, SEM-EDS, XRD, and FTIR. The effects of MMS incorporation on slump and UCS were evaluated, thereby elucidating the hydration mechanism and microstructural evolution of the T-MMS composite CTB. The results indicate that MMS incorporation enhanced CTB mechanical performance while reducing cement consumption, thus establishing a feasible pathway for the high-value utilization of manganese slag and promoting the low-carbon sustainable development of the mining and cement industries.
2. Materials and Methods
2.1. Materials
The precursor MS was sourced from an alloy smelting plant located in Guilin, China. This waste originated from the water-quenching of molten slag discharged at an elevated temperature during manganese alloy smelting operations. OPC that satisfied the Chinese standard GB 175-2007 [13] was employed as the reference cement. The tailings used in this study were procured from the discharge outlet of an iron tailings pond in Anhui, China. A reagent grade sodium silicate (Na2SiO3) meeting the GB/T 4209-2008 standard [14] was selected as a chemical modifier to enhance the reactivity of MS. Experimental mixtures were formulated by incorporating Na2SiO3 into the MMS at addition levels of 0%, 5%, and 10% by weight.
2.2. Experimental Methods
Systematic experimental protocols were conducted to characterize the pozzolanic activity of MMS, as detailed in Figure 1.
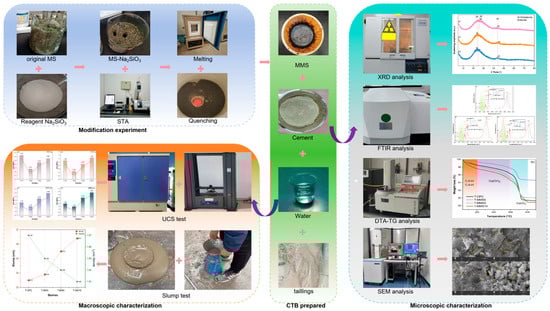
Figure 1.
Schematic diagram of experimental workflow for modification and characterization.
2.2.1. Modification Experiment
The phase-transition characteristics of Na2SiO3–MS mixtures were analyzed using differential scanning calorimetry (DSC, STA449F3, NETZSCH, Selb, Germany) in a nitrogen atmosphere, establishing liquidus temperatures of 1350 °C, 1285 °C, and 1230 °C [15]. Based on the thermal data, a chemical modification protocol was executed by heating approximately 500 g of each mixture in a resistance furnace (KSL-1700X, Hefei, China) following a controlled thermal profile: 100 °C/h to 700 °C, 150 °C/h to liquidus temperature, which was selected to ensure uniform heat transfer while minimizing energy consumption. The 40 min isothermal hold was determined from the results of preliminary tests, which demonstrated that this duration achieves complete slag melting and compositional homogeneity. The quenched samples were subsequently vacuum-dried, sieved to a particle size of 0.075–1.0 mm, and milled for 1.0 h in a vibration ball mill operating at 1000 rpm [16]. The resulting modified materials, designated MMS0, MMS5, and MMS10, corresponded to Na2SiO3 contents of 0, 5, and 10 wt.%, respectively.
2.2.2. Physicochemical Analysis
The physicochemical properties of MMS and tailings were comprehensively characterized. Chemical compositions were quantified by using a Panalytical X-ray fluorescence (XRF) spectroscopy (Almelo, The Netherlands). Specific surface areas were determined using the BET method using a Quadrasorb analyzer (ASAP 2460, Quantachrome, Boynton Beach, FL, USA) after vacuum degassing at 200 °C for 8 h. Density was measured via pycnometry (G-DenPyc), and pH values were acquired using a PHS-25 pH meter [17]. All determinations were performed on approximately 2.0 g of dried sample in triplicate at 20 ± 1 °C, with average values recorded.
2.2.3. XRD Analysis
The mineralogical phases of MMS were characterized via XRD on an X’Pert diffractometer (PANalytical, Almelo, The Netherlands) with Cu Kα radiation over a 2θ range of 10–80° at a scan rate of 5°/min and a step size of 0.026° [18]. Phase identification was performed using HighScore software 5.0 version (PANalytical, Almelo, The Netherlands).
2.2.4. FTIR Analysis
FTIR spectroscopy (PerkinElmer, Waltham, MA, USA) was employed to characterize the [SiO4] coordination structure of MMS0, MMS5, and MMS10. Sample preparation involved mixing approximately 2.0 mg of each sample with dry potassium bromide (KBr) and pressing into transparent pellets under vacuum. Spectra were acquired across 400–4000 cm−1 at a resolution of 1.0 cm−1, with a 20 μm aperture and a scan time of 30 s [19].
2.2.5. Slump Test
The MMS0, MMS5, and MMS10 samples were incorporated as partial replacements for OPC at a fixed proportion of 30 wt.% to formulate composite binders. CTB samples were subsequently prepared using the composite binders (comprising 70% OPC and 30% MMS), tailings, and water at a binder-to-tailings ratio of 1:6 and a solid mass concentration of 70%, based on engineering practice optimization results [20]. The constituent CTB slurry was homogenized via mechanical agitation in a paddle mixer for 20 min, forming final mixtures designated as T-MMS0, T-MMS5, T-MMS10, and T-OPC.
Slump values of the T-MMS0, T-MMS5, T-MMS10, and T-OPC slurry were measured at a controlled ambient temperature of 25 ± 1 °C, in accordance with Chinese standard for the testing method on ordinary fresh concrete (GB/T 50080-2016) [21]. A standard truncated cone (100 mm top diameter, 200 mm bottom diameter, 300 mm height) was positioned on a planar, non-absorbent stainless steel base and filled with slurry in three layers. Each layer was compacted through continuous vibrating for 3 min using a ϕ16 mm steel rod. After leveling the surface, the cone was vertically lifted at a uniform rate within 5–10 s. Slump values were quantified by measuring the vertical displacement from the cone apex to the highest point of the slurry specimen using a steel ruler (precision ±0.1 mm). To ensure the results accuracy, slurry filling commenced within 150 s of mixing, and the entire procedure was completed within 5 min [22]. Each slurry sample was tested in triplicate to determine the average slump value.
2.2.6. UCS Test
The T-MMS0, T-MMS5, T-MMS10, and T-OPC slurry was cast into standard molds, following a 24 h initial set, and then demolded and cured under conditions of 25 ± 1 °C and 95 ± 1% relative humidity. UCS testing was performed using a WDW-2000 kN hydraulic servo machine (Jinan Xinbiao Automation Co., Ltd., Jinan, China). Prior to testing, the fractured CTB samples were oven-dried at 60 °C for 24 h to inhibit hydration and achieve a constant mass and then sealed in airtight containers pending further analysis. Triplicate UCS values were tested for each CTB samples at each curing ages of 3, 7, 28 and 60 days, totaling 12 bodies per mixture.
2.2.7. Differential Thermal (DTA)-Thermogravimetric (TG) Analysis
DTA-TG analysis was performed on 28-day cured T-MMS0, T-MMS5, T-MMS10, and T-OPC samples using a Mettler Toledo TGA3+ simultaneous thermal analyzer (Greifensee, Switzerland). The treated samples were prepared through mechanical cutting, immersion in anhydrous ethanol, drying to constant mass, and loading in Pt-Rh crucibles [23]. Each sample weighed at 5.00 ± 0.01 g was mixed with 2.50 g of deionized water (water-to-binder ratio = 0.5) injected using a syringe at a controlled temperature of 20 ± 0.1 °C [24]. Following uniformly stirring for 10–15 s, the sample container was immediately sealed with a perforated film (1.0 mm orifice) to maintain pressure equilibrium and subsequently inserted into the calorimeter channel. After signal stabilization, the hydration heat evolution for each sample was continuously monitored for 72 h. The DTA-TG thermal data were collected at 1.0 s intervals for the initial hour and 10.0 s intervals, with the sample preparation and loading procedure executed within 45 s.
2.2.8. SEM Analysis
The microstructure and elemental composition of T-MMS0, T-MMS5, T-MMS10, and T-OPC samples were characterized via SEM analysis (Tescan Mira4/Xplore 30, Brno, Czech Republic). The samples for this test were retrieved following the 28-day UCS testing and sectioned into cubic samples with dimensions of 5.0 × 5.0 × 5.0 mm3. Each cubic sample was immersed in anhydrous ethanol for 24 h and vacuum-dried at 50 °C for 48 h. The dried samples were successively ground and polished using graded silicon carbide abrasive papers, followed by carbon coating under vacuum to enhance electrical conductivity and imaging resolution. The processed samples were affixed to conductive carbon tape and examined under an accelerating voltage of 20 kV and an emission current of 2.0 nA.
3. Results and Discussion
3.1. Physicochemical Properties of the MMS and Tailings
Physicochemical properties, including the real density, specific surface area (SSA), and chemical compositions were quantified for the MMS and tailing samples, as shown in Table 1. MMS0 exhibited a real density of 2.84 g/cm3 and an SSA of 440.3 m2/kg. With an increasing Na2SiO3 content, the real density progressively decreased to 2.71 g/cm3 (MMS5) and 2.66 g/cm3 (MMS10), while the SSA correspondingly increased to 451.3 m2/kg and 503.4 m2/kg, respectively. The observed inverse correlation between SSA and the real density suggests that Na2SiO3 incorporation enhances the grindability of MMS, thereby augmenting the SSA of MMS samples and increasing their reactive site density [25]. To assess the suitability of the experimental tailings as backfill aggregate, particle size distribution (PSD) characterization was performed as presented in Table 2. The dn represents the particle diameter at the n% of the cumulative undersize distribution; Cu denotes the uniformity coefficient (Cu = d60/d10), and Cc corresponds to the curvature coefficient, Cc = d302/(d60 × d10). The tailings exhibited a real density of 2.70 g/cm3 with a fines-dominated composition, and 53.46% of particles were finer than 37 μm, while only 6.19% exceeded 150 μm. The characteristic particle diameters d10, d50, and d60 were determined to be 5.58 μm, 33.81 μm, and 45.61 μm, respectively, with Cu = 8.17 and Cc = 1.02. These indices satisfy the conventional criteria for well-graded backfill aggregate (Cu ≥ 5.0, and 1.0 ≤ Cc ≤ 3.0), evidencing continuous gradation. This particle size distribution facilitates the effective filling of interstitial voids between coarse particles by fine fractions, thereby promoting denser packing structures [26].

Table 1.
Physicochemical properties of the MMS and tailings.
Table 2.
Particle size distribution of the tailings.
The chemical data in Table 1 indicate that the tailings are predominantly composed of SiO2 (48.37%), Fe2O3 (18.90%), and SO3 (17.25%), with minor Al2O3 (7.32%) and CaO (4.28%) constituents, suggestive of favorable chemical stability. Otherwise, SiO2, Al2O3, CaO, and MnO are the major oxides collectively accounting for >80% of the total composition in the MMS samples. For the sample of MMS0, the corresponding contents of the above oxides are 28.19%, 19.52%, 19.47%, and 18.91%, respectively. The addition of Na2SiO3 significantly increases the contents of Na2O and SiO2 in MMS. With the Na2SiO3 addition 0→5%→10%, the Na2O content increases from 0.57% (MMS0) to 2.57% (MMS5) and 4.33% (MMS10), while the SiO2 content rises from 28.19% (MMS0) to 36.79% (MMS5) and 37.56% (MMS10), respectively, which satisfies the minimum requirement for pozzolanic cement based on reactive SiO2 of 25% recommended by Chinese standard GB 175-2023 [27]. The contents of most other oxides, including CaO, SO3, MnO, and K2O, exhibited progressive declines with increasing Na2SiO3 addition. However, an anomalous elevation in the Al2O3 content (19.52% MMS0 to 27.33% MMS5) was observed post-modification, attributable to alumina crucible corrosion during high-temperature melting, which introduced extraneous Al2O3 into the MMS samples [28]. Furthermore, the Na2SiO3 incorporation elevated the system pH from 10.22 (MMS0) to 10.97 (MMS5) and 11.88 (MMS10), contributing to an enhanced OH− concentration to establish an alkaline environment, thereby accelerating mineral dissolution and ion exchange to promote hydration reactions and product nucleation in the MMS-OPC composite system [29].
3.2. Mineralogy of the MMS
The XRD patterns in Figure 2 exhibited few sharp diffraction peaks, indicative of a high degree of vitrification for the three MMS formulations under a rapid cooling condition. The broad diffuse halos spanning 2θ = 15–40° originate from scattering within the disordered glass network, confirming to the characteristic of aluminosilicate glass phases [28]. Crystalline phases were identified as wollastonite (CaSiO3) and melilite (Ca2MgSi2O7), evidenced by diffraction peaks at 2θ = 43° and 2θ = 24–26°, respectively. It is also noticeable that there is no crystalline phase containing sodium detected in patterns of MMS5 and MMS10, revealing that the Na2SiO3 modifier integrates compatibly within the MMS glass network without inducing crystallization or secondary phase precipitation.
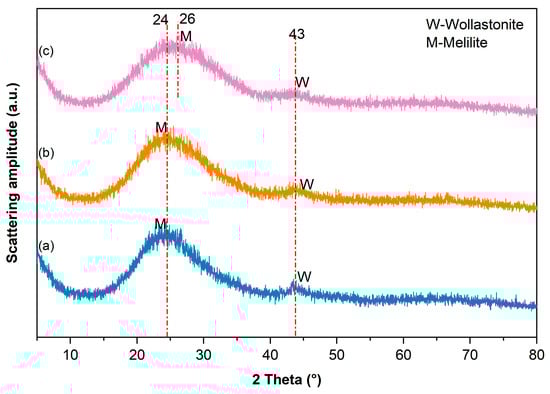
Figure 2.
XRD patterns of the MMS samples: (a) MMS0, (b) MMS5, and (c) MMS 10.
The incorporation of Na2SiO3 induced systematic attenuation of the wollastonite diffraction intensity, exhibiting indiscernible peaks in the XRD pattern of the MMS10 sample, whereas melilite signals persisted as the dominant crystalline feature within the amorphous envelope. This crystallization-suppression evolution is ascribed to the fluxing and network-modifying effects of Na2SiO3, which reduces the melt viscosity and impedes the atomic ordering required for crystal nucleation and growth during quenching process [30]. In addition, the melilite diffraction peak in MMS10 exhibited a measurable shift compared to MMS0, demonstrating the substitutional incorporation of Na+ for Ca2+ and Mg2+ in the melilite crystal lattice, thereby forming solid solutions that induces lattice distortion and modifies interplanar distance [31].
3.3. FTIR Analysis of the MMS
Figure 3 depicts FTIR spectra of MMS0, MMS5, and MMS10 samples, recorded over the 400–1400 cm−1 range. The absorption band at 400–600 cm−1 is assigned to Fe-O stretching vibrations, typically associated with iron oxide phases in [FeO6] or [FeO4] coordination units [32]. With increasing Na2SiO3 addition from 0 to 10 wt%, the central wavenumber of this band shifts from 455 cm−1 (MMS0) to 485 cm−1 (MMS10), indicating that Na+ incorporation into the glass network alters Si-O-Si bond angles and force constants, thereby disrupting the glass network. The 600–800 cm−1 envelope is attributed to [AlO4] tetrahedra stretching vibrations [33]. The MMS0 spectrum exhibits sub-peaks at approximately 700 cm−1 and 760 cm−1, indicating the coexistence of [AlO4] and [AlO6] units. With an increasing Na2SiO3 content, the entire envelope exhibits a central wavenumber shift from 760 cm−1 to 690 cm−1. This shift suggests the gradual substitution of Al3+ for larger Fe3+ cations, leading to elongated bond lengths and decreased force constants, coupled with silicate network reconstruction, confirming the comprehensive regulation of Na2SiO3 on the glass coordination environment. Pronounced spectral changes occur in the 800–1300 cm−1 domain, corresponding to asymmetric Si-O stretching in [SiO4] tetrahedral units [34]. This broad envelope arises from the superposition of variously polymerized Q2, Q3, and Q4 units. With the addition of Na2SiO3, the envelope morphology shows substantial evolution, characterized by relative intensification of low-polymerized contributions from Q2 and Q3 units and attenuation of the high-polymerized Q4 units. This may suggest that Na2SiO3 modification facilitates glass depolymerization through Si-O-Si bridge cleavage, generating additional non-bridging oxygen (NBO) species and reduced network polymerization. There is another broad band centered at approximately 3435 cm−1 assigned to the stretching vibrations of -OH hydroxyl groups. Progressive intensification of this band with Na2SiO3 addition reflects increased concentrations of Si-OH and Al-OH groups, thereby providing abundant reactive sites for subsequent hydration processes [35].
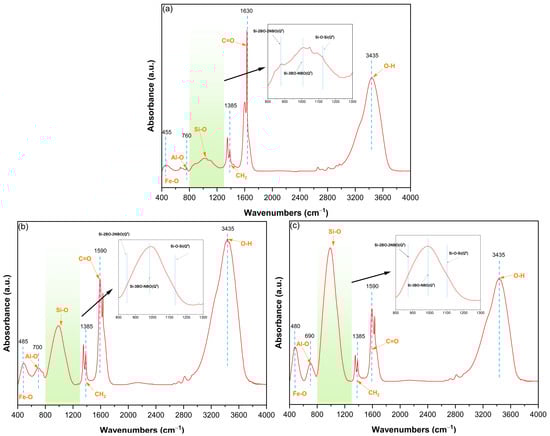
Figure 3.
FTIR spectra of the MMS samples in wavenumber interval of 400–4000 cm−1: (a) MMS0, (b) MMS5, and (c) MMS10.
To elucidate the effect of Na2SiO3 modification on the degree of polymerization of the MMS glass network, Gaussian deconvolution analysis was applied to the Si-O stretching vibration envelope in the 800–1300 cm−1 interval of the FTIR spectra, as shown in Figure 4. The central wavenumber (Cw) and relative integrated area (Ra) of each deconvoluted sub-peak were recorded to quantify the distribution of structural units, as detailed in Table 3. The strong agreement between experimental and fitted curves confirms that this broad spectral envelope comprises three principal sub-peaks corresponding to Q4, Q3, and Q2 units [36]. The first sub-peak at 1114–1118 cm−1 is ascribed to highly polymerized Q4 units wherein each [SiO4] tetrahedron is linked by four bridging oxygen atoms (BOs). With the addition of Na2SiO3 increasing to 10%, the Ra of this peak significantly decreases from 22.15% (MMS0) to 10.97% (MMS10), evidencing systematic disruption of the rigid three-dimensional Q4 network via the Na+-induced cleavage of Si-BOs-Si linkages during modification. The intermediate sub-peak at 1003–1029 cm−1 corresponds to Q3 units with each [SiO4] tetrahedron linked by three BOs and one non-bridging oxygen atom (NBO), exhibiting Ra values decreasing from 64.58% to 48.72% with progressive Na2SiO3 addition. This may indicate that the layered Q3 structures are further depolymerized into simpler configurations accompanied by the increase in NBOs amounts. Additionally, the sub-peak at 875–946 cm−1, attributed to low-polymerization Q2 units with each [SiO4] tetrahedron linked by two BOs and two NBOs, exhibits a noticeable increase in Ra values from 13.27% to 40.31% with the incorporation of Na2SiO3. This corroborates a cascade depolymerization mechanism of Q4→Q3→Q2, wherein Na2SiO3 modification drives progressive network disintegration [37]. The disruption of Si-BOs generates negatively charged NBOs that electrostatically interact with Na+ cations, thereby transforming the initially highly polymerized network into a low-dimensional structure enriched with reactive moieties. This structural reconfiguration substantially reduces the activation energy barrier for glass dissolution, consequently enhancing the pozzolanic reactivity of MMS samples.
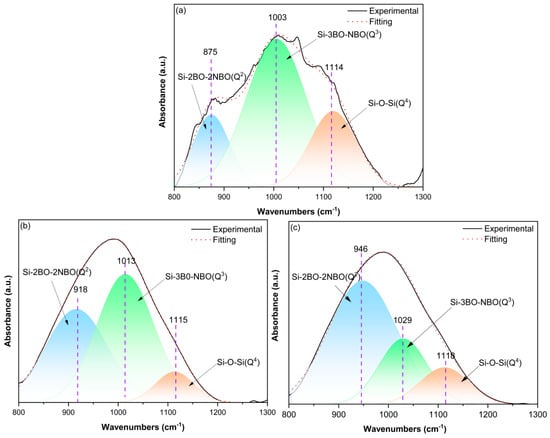
Figure 4.
Deconvoluted FTIR spectra of the MMS samples in the wavenumber interval of 800–1300 cm−1: (a) MMS0, (b) MMS5, and (c) MMS10.
Table 3.
Deconvolution parameters and coordination assignments of the FTIR spectra between 800 and 1300 cm−1 for the MMS samples.
3.4. Flowability of the T-OPC and T-MMS Slurries
Slump test procedures for slurries T-OPC, T-MMS0, T-MMS5, and T-MMS10, prepared at a binder-to-tailing ratio of 1:6 and solid mass concentration of 70%, are presented in Figure 5 [38], with results presented in Figure 6. All slurries exhibited immediate, uniform spreading with continuous flow upon cone removal, maintaining planar surfaces without visible segregation or bleeding, which suggests homogeneous structures suitable for pipeline transportation [39].
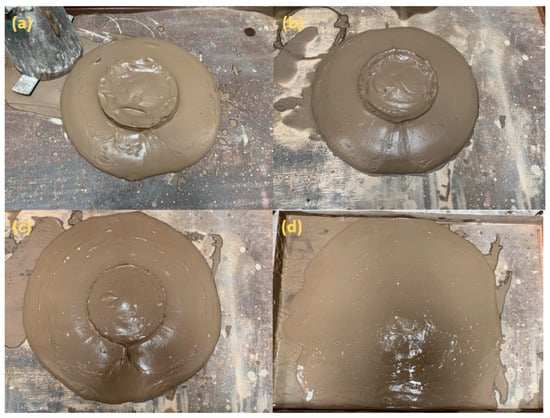
Figure 5.
Slump test photos of the T-OPC and T-MMS slurries: (a) T-OPC, (b) T-MMS0, (c) T-MMS5, and (d) T-MMS10.
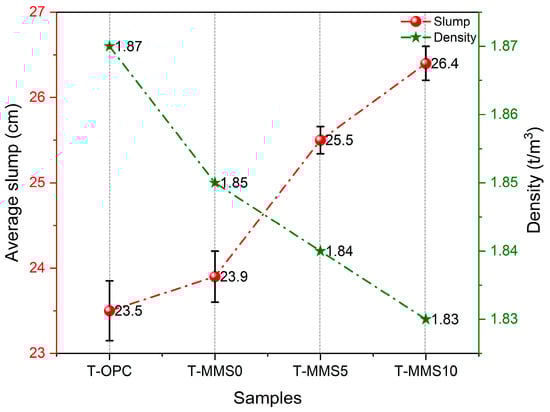
Figure 6.
Slump and density values of the T-OPC and T-MMS slurries.
As illustrated in Figure 6, the density values of T-OPC and T-MMS0 slurries are 1.87 t/m3 and 1.85 t/m3, respectively. With Na2SiO3 addition increasing to 10%, the T-MMS10 slurry density slightly decreases to 1.83 t/m3, consistent with 30% OPC replaced by MMS with a lower density. The slump value is determined by the average value of triplicate tests, and it increased progressively from T-OPC (23.5 cm) to T-MMS0 (23.9 cm), T-MMS5 (25.5 cm), and T-MMS10 (26.4 cm). This trend indicates that Na2SiO3 modification enhances flowability, with T-MMS10 achieving a 2.9 cm increase over T-OPC.
The observed fluidity improvements may be attributed to several plausible mechanisms. Na2SiO3 likely increases the negative surface charge of MMS particles, potentially generating electrostatic repulsion that disperses flocculated structures [40]. Additionally, the formation of an aluminosilicate gel film could act as a lubricating layer, reducing interparticle friction [41]. However, these mechanisms remain speculative as no zeta potential or rheological measurements (yield stress, plastic viscosity) were performed in this study. Future work will include zeta potential analysis, rheometer testing, and bleeding evaluations to validate these hypotheses and quantify the true rheological behavior.
3.5. UCS of the T-OPC and T-MMS Samples
Figure 7 shows the average value from triplicate UCS tests for T-OPC, T-MMS0, T-MMS5, and T-MMS10 samples cured at 3, 7, 28, and 60 days, with the corresponding strength development rates listed in Table 4. The results indicate that the UCS values are 0.63, 1.08, 1.72, and 1.98 MPa for the T-OPC sample at 3, 7, 28, and 60 days, respectively, exhibiting a decelerating rate profile: 0.112 MPa/d from 3–7 days, decreasing to 0.030 MPa/d during 7–28 days, and further diminishing to 0.008 MPa/d in the 28–60-day period. The incorporation of MMS exerts a pronounced stage-dependent influence on CTB strength development. During the early period (3–7 days), T-MMS0 exhibits evident strength retardation with a reduced rate of 0.047 MPa/d, representing only 42% of the T-OPC rate. In contrast, Na2SiO3 modification progressively restores and enhances early-age activity: T-MMS5 achieves a rate of 0.112 MPa/d, matching T-OPC, while T-MMS10 reaches 0.175 MPa/d, which is 56% higher than T-OPC. These quantitative enhancements confirm that the Na2SiO3 modification effectively depolymerizes the glass structure of MMS, releasing reactive SiO2 and Al2O3 species that accelerate hydration kinetics [42,43]. During the middle hydration stage (7–28 days), the pozzolanic activation becomes even more evident. While T-OPC maintains a development rate of 0.030 MPa/d, T-MMS0, T-MMS5, and T-MMS10 exhibit significantly elevated rates of 0.034, 0.064, and 0.081 MPa/d, respectively. Notably, T-MMS10′s rate is 2.7 times higher than T-OPC, directly reflecting supplementary C-A-S-H gel formation via accelerated pozzolanic reactions [44,45]. This acceleration indicates that MMS pozzolanic activity is predominantly concentrated within the 7–28-day curing period. During late-stage hydration (28–60 days), the divergence intensifies further. T-OPC’s rate declines to 0.008 MPa/d, whereas T-MMS5 and T-MMS10 remain at high rates of 0.023 and 0.027 MPa/d, respectively, which are 2.9 and 3.4 times that of T-OPC. This enhanced reactivity drives the 60-day UCS of T-MMS10 to 3.85 MPa, exceeding T-OPC by 1.87 MPa. The persistent high rate in Na2SiO3-modified systems demonstrates that chemical activation considerably enhances long-term pozzolanic reactivity, ensuring continuous strength development even after 28 days of curing [46].
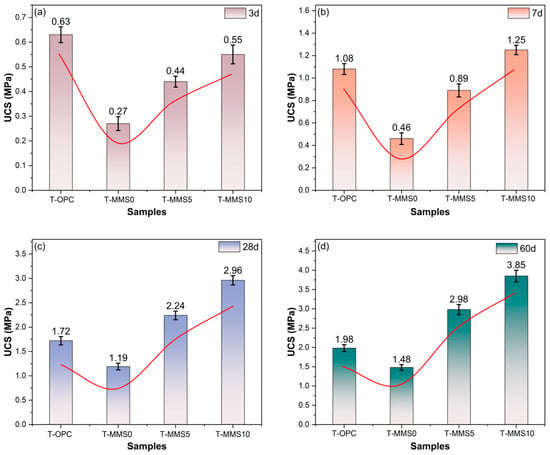
Figure 7.
UCS results of the T-OPC and T-MMS samples: (a) 3 d, (b) 7 d, (c) 28 d, and (d) 60 d.
Table 4.
The strength development rate for T-OPC and T-MMS samples.
3.6. DTA-TG Analysis of the T-OPC and T-MMS Samples
Figure 8 illustrates the DTA-TG curves of T-OPC, T-MMS0, T-MMS5, and T-MMS10 samples after 28 days of curing. Figure 8a shows three characteristic endothermic peaks collected for 28-day CTB samples in temperature intervals of 30–200 °C, 350–580 °C, and 580–800 °C, attributed to the thermal decomposition of C-S-H/C-A-H, dehydration of Ca(OH)2, and decarbonization of CaCO3, respectively [47]. DTA results exhibit diminished endothermic peak intensities for T-MMS5 and T-MMS10 samples compared to T-OPC within the 350–580 °C interval, indicative of enhanced Ca(OH)2 consumption via a pozzolanic reaction.
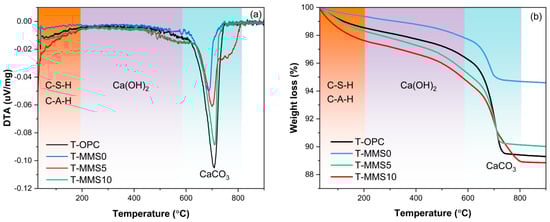
Figure 8.
DTA/TG curves of the T-OPC and T-MMS pastes at 28 days: (a) DTA curves and (b) TG curves.
TG analysis was performed to quantitatively determine the mass loss in each thermal region, thereby revealing the dependence of hydration product assemblage on the mixture design for T-OPC, T-MMS0, T-MMS5, and T-MMS10 samples [48], with TG curves presented in Figure 8b. Within the 30–200 °C dehydration regime, mass loss attributable to C-S-H/C-A-H dehydration exhibits significant variation across formulations, decreasing sequentially as T-MMS10 (2.37%) > T-MMS5 (1.69%) > T-OPC (1.45%) > T-MMS0 (0.64%). The elevated mass loss in T-MMS10 demonstrates that Na2SiO3 modification enhances C-S-H/C-A-H gel formation, exhibiting good agreement with the compressive strength evolution verified by the UCS test. Within the thermal region of 350–580 °C, TG data elucidate the effect of Na2SiO3 modification on Ca(OH)2 dehydration. The T-OPC sample manifests a mass loss of 2.29% within this region, while the T-MMS0 exhibits a diminished mass loss of 1.64% due mainly to the effects of cement dilution associated with MMS0 substitution. However, the corresponding mass losses of T-MMS5 and T-MMS10 increase to 2.99% and 3.07%, respectively. This suggests that the introduction of Na2SiO3 increases the OH− concentration in the T-MMS system, driving the re-dissolution and precipitation of Ca2+ from the MS to form secondary Ca(OH)2 [49]. Within the CaCO3-decarbonation regime of 600–800 °C, T-OPC exhibits the highest mass loss of 6.86%, whereas the T-MMS0, T-MMS5, and T-MMS10 samples demonstrate corresponding mass losses of 3.03%, 5.11%, and 5.68%, respectively. This implies that the additional secondary Ca(OH)2 attributed to Na2SiO3 introduction readily carbonates via a reaction with CO2 in the pore solution during advanced curing stages, thereby precipitating CaCO3 and augmenting the carbonation products at the 28-day curing ages [50].
3.7. Microstructure of the T-OPC and T-MMS Samples
Figure 9 illustrates the morphology and microstructure for the T-OPC, T-MMS0, T-MMS5, and T-MMS10 samples cured for 28 days, demonstrating significant variations among these CTB samples with different formulations. The T-OPC sample of Figure 9a exhibits a microstructure abundant in crystalline calcium hydroxide (CH) enveloped by the C-S-H/C-A-H gel. These crystalline CH phases are generally considered the main reason for microstructural defects and the limited strength-development rate [51]. The T-MMS0 sample (Figure 9b) reveals a looser microstructure containing more pores and continuous cracks existing between particles, as compared to those observed in T-OPC. This testifies that, with the absence of chemical modification, insufficient hydration leads to a paucity of gel-product phases, thereby conferring the lowest compressive strength for the T-MMS0 sample. Compared to the sample T-MMS0, the T-MMS5 sample (Figure 9c) exhibits substantial microstructural densification with concomitant progressive strength enhancement, albeit with remaining residual macropores. Figure 9d indicates that the sample of T-MMS10, with 10% Na2SiO3 added in MMS, manifests the most compact microstructure, characterized by extensive flocculated C-S-H/C-A-H gels that substantially fill voids to establish a cohesive and interconnected network [52]. Notably, the superior microstructure containing fewer macropores and crystalline CH directly corresponds to the highest UCS values recorded for the T-MMS10 sample. This enhancement is principally ascribed to the efficient activation for the T-MMS system, wherein Na+ preferentially incorporates into aluminosilicate glass as a network modifier. The Si-BO covalent bonds are disrupted via ion-exchange reactions, thereby releasing substantial reactive Si and Al species to enhance pozzolanic reaction, leading to the additional formation of beneficial products like C-S-H and C-A-H gels [53].
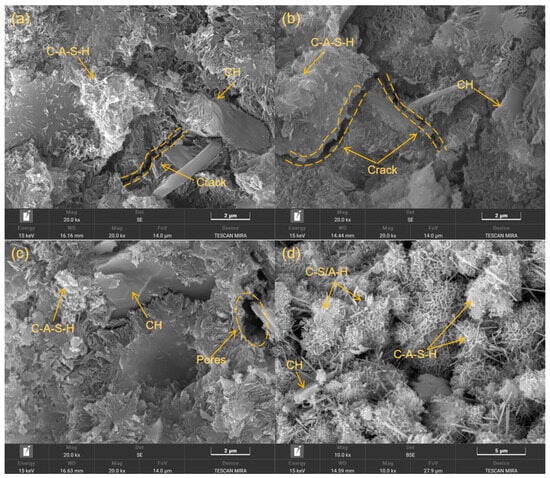
Figure 9.
SEM images of the 28-day T-OPC and T-MMS samples: (a) T-OPC, (b) T-MMS0, (c) T-MMS5, and (d) T-MM10.
4. Conclusions
- (1)
- The MMS samples are predominantly amorphous, principally comprising SiO2, Al2O3, CaO, and MnO, which collectively constitute approximately 80% of the total composition. Na2SiO3 modification induced a systematic reduction in density from 2.84 to 2.66 g/cm3, concomitant with an increase in the specific surface area from 440.3 to 503.4 m2/kg.
- (2)
- Na2SiO3 modification systematically depolymerizes the MMS glass network via a Q4→Q3→Q2 cascade mechanism. The relative abundance of highly polymerized Q4 units decreased from 22.15% to 10.97%, and Q3 units declined from 64.58% to 48.72% as Na2SiO3 addition increased to 10%. However, low-polymerization Q2 units increased significantly from 13.27% to 40.31%. This structural transformation substantially reduces the activation energy barrier for glass dissolution, thereby enhancing the pozzolanic reactivity of MMS samples.
- (3)
- Na2SiO3 modification increased the slump values of T-MMS slurry from 23.5–23.9 cm to 25.5–26.4 cm by elevating the zeta potential to induce electrostatic repulsion. With an increasing Na2SiO3 content in MMS, the T-MMS samples show a significant increase in early strength attributed to an enhanced pozzolanic reaction. The sample of T-MMS10 exhibits a 60-day UCS value of 3.85 MPa, exceeding the corresponding value of T-OPC by 1.87 MPa.
- (4)
- DTA-TG analysis confirmed that Na2SiO3 modification enhanced pozzolanic reactivity by progressively increasing C-S-H/C-A-H gel formation, inducing secondary Ca(OH)2 precipitation, and promoting carbonation. SEM analysis demonstrates progressive microstructural densification via Na2SiO3 modification: transformation from CH-rich T-OPC and porous T-MMS0 to a compact C-S-H/C-A-H network in T-MMS10 corresponded with the highest strength, confirming that Na+-driven aluminosilicate network disruption enhances the pozzolanic reactivity of MMS.
- (5)
- According to an economic assessment, MMS is recommended for CTB with a binder-to-tailings ratio of 1:6~1:10 and a mass concentration of 70~74% in unstable mining stopes where early strength development is critical for cycle time reduction. The MMS10 replacing 30% cement reduces the binder cost by 35% for a typical CTB operation, which also reduces CO2 emissions by about 50 kg CO2/m3 and diverts 1.2 tons of MS per 100 m3 CTB. However, considering the potential environmental risks posed by heavy metal elements that may release and migrate from MMS, future research will prioritize a comprehensive leachability assessment of MMS-based CTB material under simulated field conditions.
Author Contributions
Y.Y. Conceptualization, Methodology, Investigation, Writing-original draft. S.Y. Methodology, Supervision, Resources. Y.H. Data Curation, Review and Editing, Visualization, Funding acquisition. R.Y. Data Curation, Formal analysis, Validation. Q.K. Investigation, Project administration. All authors have read and agreed to the published version of the manuscript.
Funding
The present study was financially supported by Natural Science Foundation of Hunan Province (2026JJ50103), Hunan Provincial Department of Education (23A0335), and Enterprise cooperation horizontal project (6125HX080).
Institutional Review Board Statement
Not applicable.
Informed Consent Statement
Not applicable.
Data Availability Statement
The original contributions presented in this study are included in the article. Further inquiries can be directed to the corresponding author.
Conflicts of Interest
Author Yu Yin was employed by the company Sinosteel Ma’anshan General Institute of Mining Research Co., Ltd. The remaining authors declare that the research was conducted in the absence of any commercial or financial relationships that could be construed as a potential conflict of interest. The authors declare that this study received funding from Changsha Institute of Mining Research Co., Ltd. The funder was not involved in the study design, collection, analysis, interpretation of data, the writing of this article or the decision to submit it for publication.
References
- Qi, C.; Fourie, A. Cemented paste backfill for mineral tailings management: Review and future perspectives. Miner. Eng. 2019, 144, 106025. [Google Scholar] [CrossRef]
- Lin, H.; Zhang, W.; Guo, S.; Zhang, X.; Wang, L.; Zhang, J. Study on the energy evolution mechanism and fractal characteristics of coal failure under dynamic loading. ACS Omega 2025, 10, 54710–54719. [Google Scholar] [CrossRef] [PubMed]
- Fall, M.; Benzaazoua, M.; Saa, E.G. Mix proportioning of underground cemented tailings backfill. Tunn. Undergr. Space Technol. 2008, 23, 80–90. [Google Scholar] [CrossRef]
- Wang, W.; Li, Z.; Du, F.; Cao, Z.; Shi, J.; Zhai, M.; Liu, M. Study on the evolution law of failure depth of large mining height and ultra-wide working surface. Sci. Rep. 2026, 16, 665. [Google Scholar] [CrossRef]
- Ercikdi, B.; Cihangir, F.; Kesimal, A.; Deveci, H.; Alp, I. Utilization of industrial waste products as pozzolanic material in cemented paste backfill of sulphide-rich tailings. J. Hazard. Mater. 2009, 162, 888–893. [Google Scholar] [CrossRef]
- He, S.; Jiang, D.; Hong, M.; Liu, Z. Hazard-free treatment and resource utilisation of electrolytic manganese residue: A review. J. Clean. Prod. 2021, 306, 127224. [Google Scholar] [CrossRef]
- Su, H.; Zhou, W.; Lyu, X.; Liu, X.; Gao, W.; Li, C.; Li, S. Remediation treatment and resource utilization trends of electrolytic manganese residue. Miner. Eng. 2023, 202, 108264. [Google Scholar] [CrossRef]
- Allahverdi, A.; Ahmadnezhad, S. Mechanical activation of silicomanganese slag and its influence on the properties of Portland slag cement. Powder Technol. 2014, 251, 41–51. [Google Scholar] [CrossRef]
- Zheng, Y.; Zhang, Z.Y.; Liu, Y.; Zhang, X.; Kang, S.; Lv, L.; Zhou, J. Preparation of low carbon silicomanganese slag-based alkali-activated materials using alkali-activated silica waste. Buildings 2024, 14, 3835. [Google Scholar] [CrossRef]
- Frias, M.; de Rojas, M.I.S.; Santamaría, J.; Rodríguez, C. Recycling of silicomanganese slag as pozzolanic material in Portland cements: Basic and engineering properties. Cem. Concr. Res. 2006, 36, 487–491. [Google Scholar] [CrossRef]
- Saedi, A.; Jamshidi-Zanjani, A.; Darban, A.K. A review on different methods of activating tailings to improve their cementitious property as cemented paste and reusability. J. Environ. Manag. 2020, 270, 110881. [Google Scholar] [CrossRef] [PubMed]
- Zhu, Y.; Ma, Y.; Hu, J. Adsorption of organic core-shell corrosion inhibitors on cement particles and their influence on early age properties of fresh cement paste. Cem. Concr. Res. 2020, 130, 106000. [Google Scholar] [CrossRef]
- GB 175-2007; Common Portland Cement. Standards Press of China: Beijing, China, 2007.
- GB/T 4209-2008; Sodium Silicate for Industrial Use. Standards Press of China: Beijing, China, 2008.
- Sun, X.; Lee, O.K.; Medina, A.M. Melting temperature and enthalpy variations of phase change materials (PCMs): A differential scanning calorimetry (DSC) analysis. Phase Transit. 2018, 91, 667–680. [Google Scholar] [CrossRef]
- Nath, S.K.; Kumar, S. Evaluation of the suitability of ground granulated silico-manganese slag in Portland slag cement. Constr. Build. Mater. 2016, 125, 127–134. [Google Scholar] [CrossRef]
- Aili, A.; Maruyama, I. Review of several experimental methods for characterization of micro- and nano-scale pores in cement-based material. Int. J. Concr. Struct. Mater. 2020, 14, 55. [Google Scholar] [CrossRef]
- Snellings, R.; Salze, A.; Scrivener, K. Use of X-ray diffraction to quantify amorphous supplementary cementitious materials in anhydrous and hydrated blended cements. Cem. Concr. Res. 2014, 64, 89–98. [Google Scholar] [CrossRef]
- Olalekan, M.Y. Bond characterization in cementitious material binders using Fourier-transform infrared spectroscopy. Appl. Sci. 2023, 13, 3353. [Google Scholar] [CrossRef]
- Öksüzer, N.; Ünal, T.M. Optimization of calcined concrete waste powder as supplementary cementitious material: A comprehensive study on performance and sustainability. J. Aust. Ceram. Soc. 2025, 1–14. [Google Scholar] [CrossRef]
- GB/T 50080-2016; Standard for Test Method of Performance on Ordinary Fresh Concrete. China Architecture & Building Press: Beijing, China, 2016.
- Srinivasamurthy, L.; Chevali, V.S.; Zhang, Z.; Wang, H. Effect of fly ash to slag ratio and Na2O content on leaching behaviour of fly ash/slag based alkali activated materials. Constr. Build. Mater. 2023, 383, 131234. [Google Scholar] [CrossRef]
- Ren, S.; Huang, G.; Zhang, W.; Sha, X.; Liu, G.; Lin, R.-S.; Chen, L. Enhancing cement-based materials hydration and carbonation efficiency with pre-carbonated lime mud. J. CO2 Util. 2024, 88, 102928. [Google Scholar] [CrossRef]
- Seyedmohammad, H.; Ali, R. Thiazole ring—The antimicrobial, anti-inflammatory, and anticancer active scaffold. Arab. J. Chem. 2023, 16, 105234. [Google Scholar] [CrossRef]
- Zhang, H.; Li, Y.; Wei, D.; Wu, X.; Wang, Y. Mechanistic insights into full solid-waste activators for enhancing the performance of blast furnace slag-fly ash cementitious composites. Materials 2025, 18, 3275. [Google Scholar] [CrossRef] [PubMed]
- Ma, J.; Wang, Q.; Jiao, H.; Li, Z.; Li, G.; Xu, P.; Zou, S.; Yang, L.; Liu, X. Solidification/stabilization and leaching behavior of heavy metals in low-binder cemented tailings backfill. Case Stud. Constr. Mater. 2024, 21, 03934. [Google Scholar] [CrossRef]
- GB 175-2023; Common Portland Cement. Standards Press of China: Beijing, China, 2023.
- Sawangboon, N.; Nizamutdinova, A.; Uesbeck, T.; Limbach, R.; Meechoowas, E.; Tapasa, K.; Möncke, D.; Wondraczek, L.; Kamitsos, E.I.; van Wüllen, L.; et al. Modification of silicophosphate glass composition, structure, and properties via crucible material and melting conditions. Int. J. Appl. Glass Sci. 2020, 11, 46–57. [Google Scholar] [CrossRef]
- Dai, X.; Yio, M.; Wu, H.; Bernal, S.A.; Cheeseman, C.; Wong, H.S. Enhancing the rheology, reaction kinetics and early-age strength of limestone calcined clay cement (LC3) with sodium silicate addition. Cem. Concr. Res. 2025, 198, 107997. [Google Scholar] [CrossRef]
- Almasri, K.A.; Matori, K.A.; Zaid, M.H.M. Effect of sintering temperature on physical, structural and optical properties of wollastonite based glass-ceramic derived from waste soda lime silica glasses. Results Phys. 2017, 7, 2242–2247. [Google Scholar] [CrossRef]
- Kimata, M. Crystallo-chemical evolution of a crystal structure due to cationic substitution after the example of melilite. Naturwissenschaften 1985, 72, 372–373. [Google Scholar] [CrossRef]
- Farmer, V.C. The Infrared Spectra of Minerals; Mineralogical Society of Great Britain and Ireland: Middlesex, UK, 1974. [Google Scholar] [CrossRef]
- Sitarz, M. The structure of simple silicate glasses in the light of middle infrared spectroscopy studies. J. Non-Cryst. Solids 2011, 357, 1603–1608. [Google Scholar] [CrossRef]
- Hoyos-Montilla, A.A.; Puertas, F.; Mosquera, J.M.; Tobón, J.I. Infrared spectra experimental analyses on alkali-activated fly ash-based binders. Spectrochim. Acta Part A Mol. Biomol. Spectrosc. 2022, 269, 120698. [Google Scholar] [CrossRef]
- Mollah, M.Y.A.; Yu, W.; Schennach, R.; Cocke, D.L. A Fourier transform infrared spectroscopic investigation of the early hydration of Portland cement and the influence of sodium lignosulfonate. Cem. Concr. Res. 2000, 30, 267–273. [Google Scholar] [CrossRef]
- Mookherjee, M.; Stixrude, L.; Karki, B. Hydrous silicate melt at high pressure. Nature 2008, 452, 983–986. [Google Scholar] [CrossRef] [PubMed]
- Duxson, P.; Fernández-Jiménez, A.; Provis, J.L.; Lukey, G.C.; Palomo, A.; van Deventer, J.S.J. Geopolymer technology: The current state of the art. J. Mater. Sci. 2007, 42, 2917–2933. [Google Scholar] [CrossRef]
- Li, J.; Yilmaz, E.; Cao, S. Influence of solid content, cement/tailings ratio, and curing time on rheology and strength of cemented tailings backfill. Minerals 2020, 10, 922. [Google Scholar] [CrossRef]
- Kalyon, D.M.; Aktaş, S. Factors affecting the rheology and processability of highly filled suspensions. Annu. Rev. Chem. Biomol. Eng. 2014, 5, 229–254. [Google Scholar] [CrossRef]
- Kashani, A.; Provis, J.L.; Qiao, G.G.; van Deventer, J.S. The interrelationship between surface chemistry and rheology in alkali activated slag paste. Constr. Build. Mater. 2014, 65, 583–591. [Google Scholar] [CrossRef]
- Wang, D.; Na, Q.; Liu, Y.; Feng, Y.; Zhang, Q.; Chen, Q. Hydration process and fluoride solidification mechanism of multi-source solid waste-based phosphogypsum cemented paste backfill under CaO modification. Cem. Concr. Compos. 2024, 154, 105804. [Google Scholar] [CrossRef]
- Pan, J.; Zhang, Q.; Feng, Y.; Wang, D.; Lu, R.; Na, Q.; Chen, Q. Low-foam-rate expansive cemented paste backfill for facilitating active roof-contact: Correlation mechanisms between expansion properties and mechanical properties. J. Build. Eng. 2025, 113, 114063. [Google Scholar] [CrossRef]
- Li, N.; Shi, C.; Zhang, Z. Understanding the roles of activators towards setting and hardening control of alkali-activated slag cement. Compos. Part B Eng. 2019, 171, 34–45. [Google Scholar] [CrossRef]
- Sun, J.; Zhang, P. Effects of different composite mineral admixtures on the early hydration and long-term properties of cement-based materials: A comparative study. Constr. Build. Mater. 2021, 294, 123547. [Google Scholar] [CrossRef]
- Yilmaz, E.; Belem, T.; Bussière, B.; Mbonimpa, M.; Benzaazoua, M. Curing time effect on consolidation behaviour of cemented paste backfill containing different cement types and contents. Constr. Build. Mater. 2015, 75, 99–111. [Google Scholar] [CrossRef]
- Richardson, I.G. The nature of C-S-H in hardened cements. Cem. Concr. Res. 1999, 29, 1131–1147. [Google Scholar] [CrossRef]
- Alarcon-Ruiz, L.; Platret, G.; Massieu, E.; Ehrlacher, A. The use of thermal analysis in assessing the effect of temperature on a cement paste. Cem. Concr. Res. 2005, 35, 609–613. [Google Scholar] [CrossRef]
- Tang, S.W.; Li, Z.J.; Shao, H.Y.; Chen, E. Characterization of early-age hydration process of cement pastes based on impedance measurement. Constr. Build. Mater. 2014, 68, 491–500. [Google Scholar] [CrossRef]
- Shi, C.; Krivenko, P.V.; Roy, D. Alkali-Activated Cements and Concretes; CRC Press: Boca Raton, FL, USA, 2006. [Google Scholar] [CrossRef]
- Benzaazoua, M.; Fall, M.; Belem, T. A contribution to understanding the hardening process of cemented pastefill. Miner. Eng. 2004, 17, 141–152. [Google Scholar] [CrossRef]
- Scrivener, K.L. Backscattered electron imaging of cementitious microstructures: Understanding and quantification. Cem. Concr. Compos. 2004, 26, 935–945. [Google Scholar] [CrossRef]
- Fall, M.; Benzaazoua, M. Modeling the effect of sulphate on strength development of paste backfill and binder hydration. Cem. Concr. Res. 2005, 35, 301–314. [Google Scholar] [CrossRef]
- Yilmaz, E.; Belem, T.; Bussiere, B.; Benzaazoua, M. Relationships between microstructural properties and compressive strength of consolidated and unconsolidated cemented paste backfills. Cem. Concr. Compos. 2011, 33, 702–715. [Google Scholar] [CrossRef]
Disclaimer/Publisher’s Note: The statements, opinions and data contained in all publications are solely those of the individual author(s) and contributor(s) and not of MDPI and/or the editor(s). MDPI and/or the editor(s) disclaim responsibility for any injury to people or property resulting from any ideas, methods, instructions or products referred to in the content. |
© 2026 by the authors. Licensee MDPI, Basel, Switzerland. This article is an open access article distributed under the terms and conditions of the Creative Commons Attribution (CC BY) license.