Abstract
In the context of the “Dual Carbon” goals, achieving synergistic development between digitalization and green transformation in the coal power industry is essential for ensuring a just and sustainable energy transition. The core scientific problem addressed is the lack of a robust quantitative tool to evaluate the comprehensive performance of diverse transition scenarios in a complex environment characterized by multi-objective trade-offs and high uncertainty. This study establishes a sustainability-oriented four-dimensional performance evaluation system encompassing 22 indicators, covering Synergistic Economic Performance, Green-Digital Strategy, Synergistic Governance, and Technology Performance. Based on this framework, a Fuzzy DEMATEL–MultiMOORA–Borda integrated decision model is proposed to evaluate seven transition scenarios. The computational framework utilizes the Interval Type-2 Fuzzy DEMATEL (IT2FS-DEMATEL) method for robust causal analysis and weight determination, addressing the inherent subjectivity and vagueness in expert judgments. The model integrates MultiMOORA with Borda Count aggregation for enhanced ranking stability. All model calculations were implemented using Matlab R2022a. Results reveal that Carbon Price and Digital Hedging Capability (C13) and Digital-Driven Operational Efficiency (C43) are the primary drivers of synergistic performance. Among the scenarios, P3 (Digital Twin Empowerment and New Energy Co-integration) achieves the best overall performance (score: 0.5641), representing the most viable pathway for balancing industrial efficiency and environmental stewardship. Robustness tests demonstrate that the proposed model significantly outperforms conventional approaches such as Fuzzy AHP (Analytic Hierarchy Process) and TOPSIS under weight perturbations. Sensitivity analysis further identifies Financial Return (C44) and Green Transformation Marginal Economy (C11) as critical factors for long-term policy effectiveness. This study provides a data-driven framework and a robust decision-support tool for advancing the coal power industry’s low-carbon, intelligent, and resilient transition in alignment with global sustainability targets.
1. Introduction
Global climate change has become the foremost challenge facing human society, driving the international community to accelerate a profound energy transition centered on “decarbonization” [1]. In the context of the Paris Agreement and China’s “Dual Carbon” goals (Carbon Peaking and Carbon Neutrality), the energy structure’s shift from high-carbon to low-carbon is an inevitable trend [2]. As the “ballast stone” for national power security, the coal power industry faces unprecedented pressure [3]. The traditional operation model can no longer meet the new power system’s multiple demands for flexibility, economy, and cleanliness [4]. Therefore, promoting the deep synergistic development of digitalization and green transformation in coal power has become the key to China achieving its “Dual Carbon” goals smoothly and efficiently [5].
Specifically, Green Transformation focuses on environmental benefits and reducing carbon emissions through low-carbon technologies (e.g., CCUS, flexible ramping) [5]. In contrast, Digitalization focuses on efficiency improvement, utilizing technologies like the Industrial Internet of Things (IIoT), Big Data, and Artificial Intelligence (AI) to support fine-grained operations and intelligent decision-making [6]. These two dimensions are interdependent and mutually reinforcing: digitalization provides the technical means for green transformation, while green transformation provides the application direction and value destination for digitalization. Scientifically and systematically evaluating the performance of their “synergistic development” is the primary prerequisite for identifying the optimal transition strategy.
The synergistic transition of coal power possesses irreplaceable specificity and urgent necessity. Its importance stems from three aspects: First, the inherent system contradiction between “carbon reduction” and “supply guarantee” necessitates balancing safety and emission reduction through digital means for precise simulation and optimization of marginal costs and system risk. Second, the transition economic distress (high sunk costs and Stranded Assets risks) demands synergy. Digital investment must directly enhance asset flexibility to offset the high investment of green transformation, achieving the special economics of “digital efficiency promoting green efficacy”. Finally, the operational flexibility and fast response capabilities required for green transformation rely on the intrinsic support of digital technologies (data acquisition and intelligent algorithms). Therefore, transition performance must be measured by the degree of synergy achieved through their mutual driving and deep integration.
While the importance of the synergistic transition is clear, actual corporate decision-making faces considerable complexity and uncertainty [7]. Companies must balance massive initial investment, uncertain carbon and electricity price markets, rapidly changing technical standards, and complex organizational governance structures [8]. This multi-objective, multi-constraint, high-risk decision environment makes scientifically, systematically, and robustly evaluating the comprehensive performance of different transition scenarios an urgent theoretical and practical problem. Lacking a quantitative and precise performance evaluation tool, companies are highly likely to misallocate resources or jeopardize system stability. Therefore, the core problem of this study is focused on constructing a comprehensive evaluation framework that covers all key dimensions to precisely measure the synergistic development performance of the coal power industry and provide a robust decision model in dynamic and fuzzy environments to assist decision-makers in identifying the synergistically optimal development scenario.
Current research has made significant progress in energy transition and system evaluation, primarily in three areas. First, in energy transition pathway studies, research has evolved from traditional methods like Cost–Benefit Analysis (CBA) [9], Life Cycle Assessment (LCA) [10], and Integrated Assessment Models (IAMs) [11]—focusing on comparing the performance of different technologies—to recent studies emphasizing technology empowerment (e.g., “flexible coal power”, “digital twin”) [6,12]. Second, in system analysis, scholars widely apply the Decision Making Trial and Evaluation Laboratory (DEMATEL) method to identify key causal factors, moving to Fuzzy DEMATEL to address the subjectivity of expert judgment and enhance causal analysis accuracy [13,14]. Third, regarding the application of Multi-Criteria Decision Making (MCDM) methods (AHP, TOPSIS, VIKOR, MOORA), there is a trend toward integrating multiple methods and using aggregation mechanisms like the Borda Count method to improve objectivity and reliability [15,16].
Despite providing an important foundation, existing research applied to the synergistic performance evaluation of digitalization and green transformation in the coal power industry still has the following critical gaps:
First, the depth and breadth of the performance evaluation system are insufficient. Existing energy evaluation systems often focus only on hard indicators (technology, economic performance), lacking systematic quantitative attention to soft, systemic indicators crucial for transition success, such as Green-Digital Strategy and Synergistic Governance and Integration [17,18]. This omission prevents performance evaluation results from capturing the overall synergistic effect and long-term sustainability of the transition scenarios.
Second, limitations exist in handling fuzzy information. The coal power transition is a frontier field with scarce data, highly dependent on expert judgment. Traditional fuzzy MCDM methods (using Type-1 Fuzzy Sets) have limited ability to represent the hesitation and high uncertainty in expert opinions, potentially losing important information and affecting the reliability of the final evaluation [19].
Third, model robustness and dynamic adaptability are insufficient. Most MCDM performance evaluation models use static, fixed weight configurations. However, the lack of in-depth testing of the sensitivity to weight changes and the consistency of model performance ranking makes the evaluation results susceptible to short-term market disturbances, reducing the reliability and practicality of decisions in dynamic scenarios [20].
To address these gaps, this paper constructs an evaluation system encompassing four primary dimensions and 22 detailed indicators (market, strategy, governance, and technology) and proposes an innovative Fuzzy DEMATEL-MultiMOORA-Borda integrated decision-making model. The main contributions are:
- (1)
- Methodological Innovation: It innovatively integrates Interval Type-2 Fuzzy Number (IT2FS) with Fuzzy DEMATEL to precisely capture expert fuzziness and calculate scientific indicator weights. Subsequently, the MultiMOORA method (Ratio System, Reference Point, and Full Multiplicative Form) is introduced for multi-angle evaluation, and the Borda Count method is applied to aggregate rankings, providing a robust, self-adaptive novel integrated methodology for tackling high fuzziness and multi-objective conflict problems.
- (2)
- Theoretical Advancement: This study is the first to propose a synergistic development performance evaluation system for the coal power industry, covering 22 hard and soft indicators, filling a gap in systematic performance evaluation indicators in this field.
- (3)
- Practical Guidance: The research provides scientific, quantitative decision support for enterprises and policymakers, guiding them to prioritize resource allocation and select the scenario that maximizes synergistic transition performance and enhances competitiveness and resilience in the dynamic market.
The subsequent structure of this paper is as follows: Section 2 systematically reviews relevant domestic and international research literature; Section 3 elaborates on the construction of the evaluation indicator system, the computational process of fuzzy DEMATEL, and the principles underlying the improved MultiMOORA-Borda integrated decision-making model. It presents key computational results, including causal analysis of indicators, path ranking outcomes, stability tests, and sensitivity analysis, followed by an in-depth discussion of the findings; Section 4 summarizes the entire paper, presenting the main conclusions, limitations, and future research directions worthy of further exploration.
2. Literature Review
2.1. Research Progress on Synergistic Digitalization and Green Transformation and Performance Evaluation in the Coal Power Industry Under the Energy Transition
Driven by the global consensus on climate change and China’s “Dual Carbon” goals, the Chinese coal-fired power generation sector is undergoing a profound strategic shift from a primary energy source to a flexible system-regulating resource [21]. Although coal power remains the core force guaranteeing national power security in the near term, this transition is fraught with significant environmental, economic, and social challenges.
Firstly, environmental and financial pressures are the primary catalysts. The coal power sector is China’s largest single source of CO2 emissions [22]. Concurrently, the rapid growth in wind and solar capacity is causing a continuous decline in coal power utilization hours, exacerbating the risk of Stranded Assets and the deterioration of profitability [23]. Secondly, governance and structural complexity impede the efficiency of the transition. High enthusiasm for new coal power projects for economic growth conflicts with overall decarbonization goals [24]. Furthermore, the transition must address the social issue of a Just Transition, ensuring fairness and stability for coal-dependent regions and affected workers [25].
To counter these challenges, research and practice have focused on the efficient synergy between digitalization and green transformation. Existing literature generally discusses these aspects in isolation. On the Greening front, key technical solutions include Flexibility Retrofitting of existing units, exploring low-carbon fuels (e.g., biomass/ammonia co-firing), and deploying Carbon Capture, Utilization, and Storage (CCUS) technologies for deep decarbonization [26]. On the Digitalization front, IIoT, Big Data, and AI are widely applied to optimize power plant operational efficiency, enhance predictive maintenance, and achieve refined energy and carbon management [27]. Recently, studies have gradually recognized the core role of digital technologies as an enabling tool for green transformation, exploring the “multiplicative effect” of their deep integration. However, methodological research for systematically evaluating the performance of this “synergistic development” is still nascent, lacking a mature performance evaluation system and theoretical consensus. Policy and financial mechanisms, such as China’s “1 + N” policy framework [28] and Transition Finance [29], provide core support, but the performance evaluation must encompass multiple dimensions (Synergistic Economic Performance, Green-Digital Strategy, Synergistic Governance) and possess dynamic robustness to provide reliable scenario selection evidence [30].
In summary, while the conceptual synergy between green and digital goals is clear, the lack of a standardized, multi-dimensional evaluation framework remains a significant barrier to operationalizing this transition in the coal power sector.
2.2. Research Status of Multi-Criteria Decision-Making Methods for Synergistic Development Performance Evaluation
Multi-Criteria Decision-Making (MCDM) is a mature field addressing problems involving multiple, often conflicting, decision criteria [19]. Given the inherent imprecision and vagueness in complex real-world decisions, the integration of fuzzy logic with MCDM methods is paramount [31]. Fuzzy MCDM methods, primarily focusing on Fuzzy Multi-Attribute Decision Making (MADM) [32], have been widely applied across various fields, including manufacturing, supply chain, and environmental science [33]. Recent trends emphasize hybrid MCDM methods to enhance decision robustness [34].
In complex problems like evaluating coal power synergistic development, integrating the strengths of different methods is key. Traditional weighting methods like AHP/ANP are often less efficient and susceptible to subjective judgment when handling interdependencies [35]. Crucially, synergistic performance requires quantifying the coupling and causal relationships between indicators, which prompted the introduction of the DEMATEL method. The core advantage of DEMATEL is identifying the causal coupling relationships among factors, classifying indicators into driving and responsive factors, thus providing objective weights based on system structure, perfectly matching the intrinsic need to evaluate digitalization’s “driving force” [36].
For specifically evaluating scenario performance, while methods like TOPSIS and VIKOR are popular, they risk instability in final rankings due to distance weight settings or the absence of a complete ideal solution [20]. This ranking instability directly undermines the robustness of the optimal scenario judgment. Consequently, researchers are turning toward the Multi-Objective Optimization on the basis of Ratio Analysis (MultiMOORA) method. MultiMOORA evaluates scenarios from multiple perspectives through three different calculation logics (Ratio System, Reference Point, and Full Multiplicative Form), offering a relatively straightforward calculation process and robust results [16]. To resolve ranking conflicts arising from different methods, ranking aggregation techniques like the Borda Count method are widely recognized for their ability to integrate multi-source rankings and provide a comprehensive, fair final performance order, ensuring the robustness of the synergistic development evaluation [37].
By integrating these methods, this study aims to overcome the limitations of single-perspective evaluations, ensuring a more objective and robust ranking of synergistic performance.
2.3. Influencing Factors and Construction of the Performance Evaluation Indicator System for Synergistic Development
Recent research provides a solid foundation for constructing a digitalization and green synergistic performance evaluation indicator system covering the four major dimensions of Market, Strategy, Governance, and Technology.
Studies on Market Mechanisms and Integrated Economic Performance highlight that external signals (e.g., carbon pricing, green certificates) profoundly influence investment behavior [38]. Simulation and empirical studies point out that Green Transformation Marginal Economy and Carbon Price and Digital Hedging Capability are key economic constraints [39,40]. Furthermore, accessibility to financing and the reshaping of cost structures are directly related to long-term financial sustainability [17].
Research on Organizational Behavior and Integrated Green-Digital Strategy emphasizes the decisive role of soft mechanisms. Evolutionary game theory and institutional governance studies show that the Digital Behavior Heterogeneity and Learning Rate of the firm collective, as well as the Digital Policy Responsiveness to market rules, are critical soft drivers [18,41]. Studies on Synergistic Governance and Integration further indicate that the effectiveness of fusion largely depends on cross-departmental coordination arrangements; a lack of effective governance can inhibit social benefits and demonstrative spillovers [42].
Finally, research from Technological Performance confirms that digital technologies (AI dispatch, digital twin) can improve energy efficiency and enhance system resilience at a lower marginal cost, but their effectiveness is highly dependent on system integration and governance arrangements [43]. At the methodological level, research consensus emphasizes the need for hybrid methods capable of characterizing fuzzy causal relationships and ensuring ranking robustness, particularly using methods like Fuzzy DEMATEL and Interval Type-2 Fuzzy Sets (IT2FS) [19]. Based on the consensus from these methodological and applied studies, this research adopts Technological Performance as the outcome variable, uses DEMATEL to identify driving/responsive indicators, and employs MultiMOORA-Borda to evaluate the performance of different transition scenarios from multiple perspectives. Although relevant research provides rich evidence, systemic integration of the Market-Strategy-Governance-Technology four-dimensional causal network with the core logic of digitalization-green transformation “coupling” to compare the performance of specific transition scenarios remains relatively scarce. This research is based on this academic and practical gap.
However, few studies have simultaneously addressed the multi-layered causal dependencies between market, strategy, and technology within a unified fuzzy framework.
2.4. Research Gap
Despite significant advancements in energy transition, MCDM application, and system analysis, applying these methods to the synergistic performance evaluation of the coal power industry’s digitalization and green transformation—a complex and cutting-edge decision scenario—still reveals critical gaps that this research aims to address:
First, Insufficiency in Systemic and Comprehensive Evaluation Frameworks. Existing energy transition evaluation systems often over-rely on “hard indicators,” such as technological and economic performance, lacking systematic quantitative attention to the “soft indicators” crucial for transition success, such as Green-Digital Strategy and Synergistic Governance and Integration [41]. This fragmented indicator system fails to capture the endogenous coupling and long-term sustainable synergistic effects of digitalization on green transformation, making the evaluation results inadequate for guiding corporate strategy formulation and organizational governance.
Second, Limited Capability in Handling Fuzzy Information under High Uncertainty. The synergistic coal power transition is a data-scarce field that heavily depends on the subjective judgments of expert groups. Traditional fuzzy MCDM methods predominantly utilize Type-1 Fuzzy Sets, which inherently have limited capability in representing the hesitation and second-order uncertainty present in expert opinions [19]. In high-uncertainty scenarios, this approach may fail to fully capture the ambiguity and complexity of expert judgments, potentially leading to information loss and compromising the accuracy and reliability of the final decision.
Third, Lack of Model Robustness and Critical Adaptability. Current performance evaluation models often employ static, fixed weight configurations and lack in-depth testing of ranking stability and consistency [20]. In the dynamic environment of rapidly changing policies, prices, and technologies, weight fluctuation is the norm. The absence of robustness testing against weight perturbations makes evaluation results susceptible to short-term market disturbances. This research proposes an integrated MCDM model that not only offers methodological innovation but also ensures the robustness and reliability of the optimal scenario ranking in complex settings, thereby providing decision support with high practical value that critically surpasses traditional approaches.
3. Methodology
3.1. Performance Evaluation Indicator System and Methodology Steps
3.1.1. Performance Evaluation Indicator System
Table 1 summarizes the four primary dimensions and 22 secondary indicators used to evaluate the synergistic development of digitalization and green transformation in the coal power industry. The indicator system follows the principles of representativeness, operability, causality, and comparability, covering external market signals and project economics (Synergistic Economic Performance), corporate behavior and institutional evolution (Green-Digital Strategy), organizational coordination (Synergistic Governance and Integration), and transition outcomes (Green and Digital Technology Performance). Each secondary indicator can be quantified through statistical/financial data or expert scoring and plays different roles—driver, mediator, or responder—in the DEMATEL causal analysis. The normalized weights serve as inputs for the MultiMOORA-Borda performance ranking and sensitivity analysis, forming a closed-loop evaluation process of “Causal Identification—Weight Assignment—Multi-Method Ranking—Robustness Testing.”

Table 1.
Synergistic Digitalization and Green Transformation Performance Evaluation Indicator System.
This study defines the “Level of Synergistic Digitalization and Green Transformation” as the extent to which a scenario achieves system balance, mutual reinforcement, and optimized performance across the four dimensions of Market, Strategy, Governance, and Technology. The measurement is closely tied to the “dual transformation” theme and goes beyond a simple weighted summation. First, the Fuzzy DEMATEL method captures the strong causal coupling between soft driving factors such as Synergistic Governance and Integration (C3) and Green-Digital Strategy (C2) and hard outcomes such as Green and Digital Technology Performance (C4) and Synergistic Economic Performance (C1). This interdependency quantitatively reflects the functioning of the synergy mechanism. Second, the final MultiMOORA-Borda ranking measures the optimized synergistic outcome, reflecting each scenario’s system balance and comprehensive performance while incorporating indicator coupling effects, multi-objective trade-offs, and uncertainty.
Table 2 constructs scenarios using a “Policy Environment × Transition Type” framework to align alternatives with real-world policy tools and technology/business model combinations. Policy Environment includes “Single Carbon Market” and “Carbon Market + Green Policy Synergy,” while Transition Type distinguishes “Green Only” from “Digital-Green Dual Transformation.” P1–P3 represent synergistic digital–green scenarios under composite incentives; P4 reflects a digitalization-led upgrade under a single carbon market; P5–P7 simulate green-technology retrofits with limited digital support. These scenarios enable comparison across policy–technology configurations and clarify indicator impacts during sensitivity and robustness testing, enhancing policy and managerial interpretability.
Table 2.
Digitalization and Green Transformation Synergistic Development Scenarios.
In essence, this indicator system and scenario matrix provide the structured input necessary for the subsequent fuzzy causal modeling, ensuring that the evaluation captures both the technical depth and the strategic breadth of the dual transformation.
3.1.2. Method Steps
To facilitate reader comprehension, the specific logic of this study is illustrated in Figure 1. This logic diagram depicts the integrated methodology flow adopted in this study. It outlines the sequential process from indicator system development and expert-inspired insights to fuzzy information transformation and causal structure analysis. It further illustrates the multi-method synthesis employed for scenario evaluation, along with complementary consistency, stability, and sensitivity checks to ensure result reliability. The framework ultimately derives final rankings and formulates targeted management and policy insights.
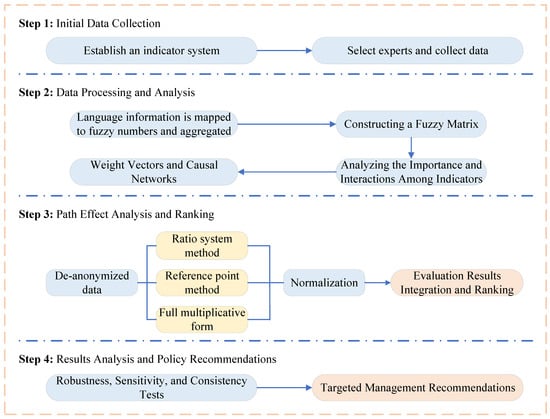
Figure 1.
Research Logic Diagram.
This integrated logic ensures that the evaluation moves beyond static assessment to a dynamic, causal-based understanding of how digitalization drives green performance under uncertainty.
3.2. Quantification and Aggregation of Fuzzy Information
This section applies the Fuzzy DEMATEL and MultiMOORA-Borda methods to quantify expert judgments and determine indicator weights, providing a scientific basis for scenario performance evaluation. The fuzzy direct influence matrix converts expert opinions into Interval Type-2 Fuzzy Sets (IT2FS). Normalization makes these values comparable, while defuzzification transforms them into standardized crisp numbers, enabling structured and data-driven evaluation.
Evaluation data come from expert scoring through a structured IT2FS-based questionnaire collected between April and July 2024 via online surveys and semi-structured interviews. Experts were drawn from key Chinese energy regions—Northwest, North China, and Eastern Coastal—to ensure geographical relevance. The panel includes ten experts: six senior scholars in energy economics or power systems, two senior engineers/managers from coal power enterprises, and two senior policy analysts/consultants specializing in carbon trading, transition finance, or power market design. All experts have over ten years of experience, covering flexible operation, CCUS techno-economics, industrial data/AI applications, and market mechanism design. Data collection concluded in July 2024 after two questionnaire iterations to ensure consistency. These archived fuzzy scores serve as the sole input source for subsequent calculations, ensuring full traceability. This diverse and highly experienced panel ensures that the synthesized direct-influence matrix (Table 3) reflects a comprehensive industry-academia consensus, enhancing the external validity of the research findings.
Table 3.
Fuzzy Linguistic Scale.
To address uncertainty in expert linguistic judgments, the study adopts the Hesitant Fuzzy Linguistic Term Set (HFLTS) to process linguistic expressions and uses IT2FS to convert them into operational data [64].
3.2.1. Fuzzy Direct Influence Matrix
Experts use linguistic terms to describe the influence between evaluation indicators. Typical linguistic terms include “Low,” “Medium,” and “High”. To quantify these terms, this study uses the following mapping rules to map them onto TFNs. The linguistic evaluations used as the input data for Table 3 originate from a structured expert elicitation process involving ten domain specialists from digital energy economics, power-system planning, and low-carbon technology evaluation. Each expert independently provided pairwise linguistic judgments for all indicator combinations based on their professional experience and current national policy guidelines. All collected linguistic inputs were aggregated using the IT2FS framework, ensuring that Table 3 comprehensively reflects the original expert-elicited input data.
Table 3 presents the linguistic scale and its corresponding IT2FS for pairwise comparisons. Experts are invited to evaluate the relationship between two factors using linguistic operators: “Extremely Low (EL),” “Very Low (VL),” “Low (L),” “Medium (M),” “High (H),” “Very High (VH),” and “Extremely High (EH),” which helps quantify the experts’ fuzzy evaluation of the decision problem. The linguistic scale used in Table 3 is adapted from established fuzzy decision-making scales in prior studies on multi-criteria evaluation under uncertainty. All IT2TrFN parameters in Table 3 were constructed by combining the interval boundaries commonly adopted in these foundational studies with additional adjustments informed by the expert inputs collected in this research to ensure contextual relevance to digital-energy performance evaluation.
The interaction between evaluation indicators is expressed by the fuzzy language provided by the experts as TFNs, denoted as [65]:
and denote, respectively, the membership degrees of the -th element in the membership functions and , where . By quantifying these linguistic nuances into IT2TrFNs, the study establishes a mathematically rigorous foundation for the subsequent DEMATEL analysis, minimizing the bias inherent in subjective expert elicitation.
The fuzzy direct-influence matrix obtained in this manner adequately reflects the inherent fuzziness and uncertainty of expert opinions.
3.2.2. Defuzzification
In Equation (2), , , , and represent the lower and upper bounds of the upper membership function, while – represent the corresponding bounds of the lower membership function; , , , and are the membership degrees associated with each point of the trapezoidal functions. All these parameters are derived from the IT2FS-based linguistic inputs described in Section 3.2.1, ensuring that the defuzzified values directly reflect the expert scoring data. The next step is to obtain defuzzified crisp values; from this step the original relation matrix is derived:
This defuzzification technique, derived from the center-of-area method for IT2FS [66], ensures that the complex interval boundaries of expert judgments are condensed into a single representative value without losing the underlying distribution of uncertainty. Consequently, this step bridges the gap between qualitative expert perception and quantitative structural modeling, laying a precise foundation for the matrix operations that follow.
3.2.3. Normalization to Obtain the Standardized Direct-Influence Matrix
OWA Weighted Aggregation
To convert the aggregated expert responses into TFNs and to ensure a reasonable integration of each expert’s opinion, an Ordered Weighted Averaging (OWA) operator is used for weighted aggregation. In the performance evaluation context, denotes the number of fuzzy linguistic terms (HFLTS) involved in the collective decision process. This approach ensures that weights are allocated reasonably according to each indicator’s importance and the overall statistical characteristics. The aggregated fuzzy direct-influence matrix is shown in Table A2. Determining the OWA weights is an important part of the decision process and helps ensure objectivity and reliability.
The OWA operator is employed here to mitigate the influence of extreme expert opinions, a common strategy in group decision-making to enhance the ‘attitudinal character’ of the aggregation [67].
Fuzzy-Number Normalization
To ensure comparability of fuzzy numbers on a common scale, each parameter of the TFNs is normalized individually. This normalization procedure maps the fuzzy numbers into the interval [0, 1], enabling effective comparison and subsequent analysis. The process ensures that fuzzy numbers representing uncertainty or variability can be effectively used in later evaluations. The normalized direct-influence matrix is obtained in this step:
where denotes the defuzzified direct influence of indicator on indicator derived from Equation (2), and represents the matrix composed of these defuzzified elements. By mapping all direct influences onto a [0, 1] scale, the system achieves mathematical convergence, ensuring that subsequent high-order matrix multiplications in DEMATEL remain stable and interpretable.
3.3. Using DEMATEL to Evaluate Inter-Indicator Influences
This section employs the DEMATEL method to assess interdependencies among performance evaluation indicators. The total (comprehensive) impact matrix reveals both direct and indirect influences between indicators. The degrees of influence and the causal groups assist in identifying key factors that drive the performance evaluation process. Causal maps visualize these relationships, while normalized weight computation ensures consistency in decision making. This section clarifies which indicators exert the greatest influence in the performance evaluation.
3.3.1. Calculation of the Total Impact Matrix
By defuzzifying the crisp-value matrix , one can compute the direct and indirect influences among indicators, yielding the total impact matrix , as shown in Table A5. This matrix contains the comprehensive impacts for each considered indicator:
where is the identity matrix used in matrix operations. reflects the aggregated direct and indirect influences among indicators and serves as an important basis for performance evaluation.
3.3.2. Analysis of Influence and Influenced Degrees
From the total impact matrix , the influence degree and the influenced degree for each indicator can be computed—two key metrics in DEMATEL that quantify their roles in the evaluation [7].
Influence degree : the aggregated influence of indicator on other conditions in the system, computed by summing the -th row of :
where denotes the influence of indicator on indicator .
Influenced degree : indicates the extent to which an indicator is affected by other conditions in the system, computed by summing the -th column of :
where denotes the influence of indicator on indicator .
Centrality is defined as the sum of and , denoted , while causality (the net cause effect) is the difference , denoted :
and distinguish the level of causal relationship: if the element is a cause; otherwise it is classified as an effect. By computing and , the importance and influence of each indicator within the system can be assessed. The computation results are presented in Table 4.
Table 4.
Calculated values of the four-factor weights.
By computing influence and influenced degrees, the analysis clearly distinguishes driving, intermediary, and responsive factors. Driving factors exhibit high D and low R and act as core system drivers. For example, Carbon Price and Digital Hedging Capability (C13) and Digital-Driven Operational Efficiency (C43) are decisive indicators: C13 captures exposure to carbon-price volatility and the ability of digital tools—forecasting algorithms, market hedging, and contract management—to stabilize costs; C43 reflects how digital twins, AI-assisted dispatch, and predictive maintenance enhance efficiency and reduce outages. Together, they strengthen system resilience by reducing external market risk (C13) and improving internal operational robustness (C43), explaining their dominant roles.
Intermediary factors sit at the system’s center, influenced by drivers while affecting responsive indicators. Examples such as Long-Term Evolutionary Stability (C26) and Digital Organizational Governance (C31) support system coordination and linkage.
Responsive factors mainly reflect outcome performance. Indicators such as Strategy Diversity and Evolutionary Stability (C21) or Demonstration Spillover (C45) strongly shape the final scenario ranking. For specific classifications, see Table 5.
Table 5.
Classification of primary factors based on centrality and causality.
Driving indicators exhibit high influence , indicating strong effects on other indicators; positive causality () identifies them as primary drivers. Intermediate indicators show a balance between and , occupying central roles where they both receive and exert influence. Responsive indicators have relatively high influenced-degree , indicating sensitivity to changes elsewhere in the system; negative causality () reflects their nature as outcome variables.
This classification enables decision makers to prioritize driving factors, coordinate intermediates, and optimize response indicators, thus providing targeted suggestions for identifying the transition schemes with superior comprehensive performance. In summary, the identification of C13 and C43 as primary drivers aligns with the current industry shift toward ‘data-driven decarbonization’. These results suggest that for coal power firms, digital capability is no longer an optional add-on but a fundamental prerequisite for managing green market risks and operational complexities.
3.3.3. Identification of Causal Groups
Indicators are partitioned into causal groups based on computed influence and influenced degrees.
The visual distribution in Figure 2 illustrates a clear separation between cause-group and effect-group indicators, confirming the structural results computed in Section 3.3.2 and further demonstrating that indicators with high centrality play disproportionate roles in influencing system coordination and performance outcomes.
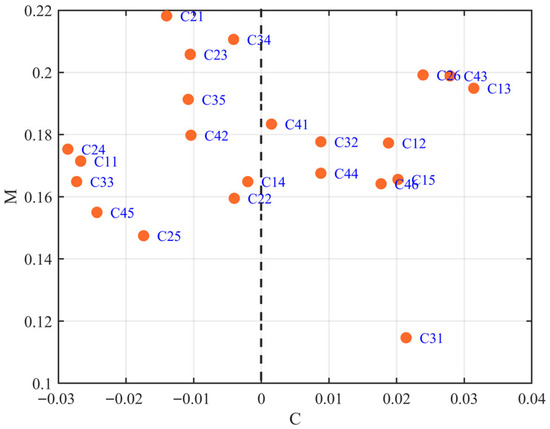
Figure 2.
Distribution of causality and centrality.
3.3.4. Causal Mapping
The causal map visualizes the interactions among performance indicators, providing a basis for understanding the system structure and identifying key leverage points to optimize transition-scheme performance. In the constructed causal graph (Figure 3), an edge-weight threshold of 0.2 is applied to retain only the most significant inter-indicator relationships. This threshold ensures that only edges with absolute weight greater than 0.2 are included, thereby filtering weaker links. The threshold may be adjusted according to the required visualization clarity, permitting more or fewer relationships to be displayed as needed.
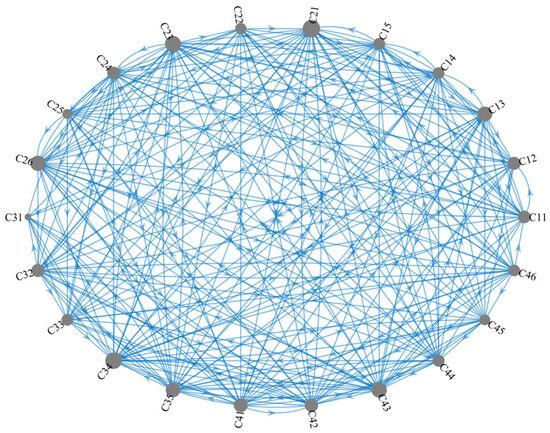
Figure 3.
Causal mapping graph.
The causal map acts as a strategic roadmap for decision-makers; by focusing interventions on the high-weight edges originating from driving groups, policy-makers can achieve the most significant ‘multiplicative effect’ in systemic synergistic performance.
3.3.5. Normalized Weight Calculation
Using centrality as the basis for weight assignment is supported by network theory, which posits that nodes with higher total systemic influence and receptivity should carry greater decision-making weight [68]. Based on this rationale and the preceding analysis, the relative weights of the performance indicators are determined through normalization, whereby the normalized weight reflects each indicator’s relative importance within the overall performance evaluation system and is computed as:
where is the normalized weight of indicator and denotes its centrality. Normalized weights enable direct comparison of indicator importance and provide scientific support for scheme evaluation and decision making. The weights are listed in Table 6. The normalized weights enable direct comparison of indicator importance and provide scientific support for scheme evaluation and decision making. The weights are listed in Table 6. The weight values in Table 6 are derived through the IT2FS-based centrality aggregation and normalization procedure described in Section 3.2 and Section 3.3. Specifically, the centrality inputs originate from expert-evaluated fuzzy influence matrices (as shown in Table 3), which were processed using the interval type-2 fuzzy aggregation algorithm to obtain Center_i values. These centrality values serve as the direct inputs for normalization using Equation (9), thereby ensuring that all listed weights are fully traceable to the expert-elicited data.
Table 6.
Weights of performance-evaluation indicators.
The weight distribution in Table 6 shows that indicators with higher centrality values, including C13 and C43, obtain correspondingly higher normalized weights. This confirms the transmission from causal structure to quantitative importance, thereby ensuring that scheme rankings reflect the embedded influence pathways identified by the DEMATEL analysis. Ultimately, these weights transform the qualitative ‘causal power’ of indicators into a quantitative evaluation metric, ensuring that the performance score of each transition scheme is rooted in its structural impact on the entire system.
3.4. Performance Ranking of Transition Schemes Using the Improved MultiMOORA–Borda Approach
This section presents the procedure for deriving the final performance ranking of transition schemes using the improved MultiMOORA–Borda framework. Scheme performance is assessed with respect to multiple evaluation indicators, and the final ordering is obtained by integrating the rankings generated by different MultiMOORA submethods through the Borda aggregation rule. This combined procedure enables a robust and balanced comparison of schemes by synthesizing information from multiple decision perspectives.
3.4.1. Scheme Evaluation Based on the MultiMOORA Method
The MultiMOORA framework is selected for its “triangulation” capability, as emphasized in robust decision-making studies [69], which argue that reliance on a single evaluation logic (e.g., solely distance-based or product-based) may lead to ranking instability; integrating three distinct computational perspectives effectively mitigates this risk. To enable quantitative assessment, the fuzzy evaluation data are first defuzzified and normalized to obtain comparable crisp values, after which the MultiMOORA method applies three complementary submethods—each representing a distinct evaluation logic—to the processed indicator data in order to compute the utility values of each scheme using the following approaches (see Appendix B (4)–(6) for detailed formulations):
- (1)
- Ratio system
This submethod computes the overall utility of each scheme by aggregating the weighted normalized values of benefit-type indicators while deducting those associated with cost-type indicators.
- (2)
- Reference point approach
Scheme performance is evaluated by measuring the deviation from an ideal reference point, defined by the maximum values of benefit indicators and the minimum values of cost indicators. A smaller deviation indicates superior performance.
- (3)
- Full multiplicative form
This approach assesses schemes by calculating the ratio between the weighted product of benefit indicators and that of cost indicators, where a higher ratio reflects better overall performance.
The utility scores obtained from the three MultiMOORA submethods are summarized in Table 7.
Table 7.
MultiMOORA evaluation results for schemes.
The ranking patterns in Table 7 indicate a consistent advantage for schemes that combine digital-integration capability with flexible operational performance. This trend is coherent across all three MultiMOORA submethods, suggesting that the structural benefits of digital–green synergy are robust across alternative decision logics. The high consistency among these sub-methods reinforces the validity of the evaluation, indicating that the superiority of synergistic Digital-Green configurations is a robust finding rather than a mathematical artifact.
3.4.2. Application of the Borda Method
A Priori Consistency Assessment
Before aggregating the rankings generated by the MultiMOORA submethods, an a priori consistency assessment is conducted to examine the agreement among the three ranking results. Kendall’s coefficient of concordance () is employed as the consistency measure [16]:
where denotes the aggregated ranking score of the -th scheme across all evaluation methods, represents the number of ranking methods, and is the total number of schemes. A statistically significant value of implies a strong level of concordance among the ranking outcomes, thereby confirming the reliability of the MultiMOORA results and the suitability of applying the Borda aggregation. As reported in Table 8, the calculated Kendall’s values fall within the interval , with higher values indicating stronger consistency among the ranking methods. The data used for the consistency test in Table 8 originate from the composite ranking matrices generated by the Ratio System, Reference Point, and Full Multiplicative Form modules within the MultiMOORA framework, all of which are directly derived from the normalized indicator dataset established in the evaluation model.
Table 8.
A priori consistency test results.
The ranking outcomes generated by the MultiMOORA approach demonstrate a strong level of concordance across schemes. Specifically, the Kendall’s values for schemes P1–P7 fall within the interval of 0.6351–0.8176, reflecting a high degree of agreement among the submethod rankings. All consistency tests are conducted at a significance level of ; the maximum observed p-value is 0.0157, which satisfies the statistical significance requirement and confirms the robustness of the ranking results.
Normalization of Evaluation Outcomes
Since the outputs of different ranking techniques may differ in scale and magnitude, a normalization procedure is applied to ensure comparability prior to aggregation. The normalization process is defined as:
where denotes the normalized value of alternative under method , and represents the corresponding original score. The normalized evaluation results obtained using Equation (11) are reported in Table 9. The raw scores used in the normalization equation are drawn from the unscaled performance matrices generated under each ranking method (Ratio System, Reference Point, Full Multiplicative Form), ensuring that Table 9 reflects a consistent transformation applied to the complete original dataset.
Table 9.
Normalized indicator data for each scheme.
Determination of Method Weights
To combine the outcomes derived from different evaluation techniques in a rational manner, the maximum deviation method is adopted to determine the relative importance of each method. The weight assigned to method is calculated as:
where represents the dispersion of evaluation scores produced by method , and denotes the corresponding weight. Methods exhibiting greater dispersion are considered to provide stronger discriminatory power among schemes and are therefore assigned higher weights in the aggregation process. The weight values are shown in Table 10.
Table 10.
Weights of the MultiMOORA submethods.
Computation of the Composite Decision Value
Based on the obtained method weights, the normalized evaluation results are synthesized to generate a comprehensive decision score for each scheme. The composite value is calculated using a weighted averaging approach:
where indicates the overall performance score of scheme . This aggregation process integrates information from all evaluation methods into a single metric, facilitating the final ranking of alternative schemes.
Calculation of the Conversion Score
The likelihood that an alternative attains rank across all evaluation methods is defined as:
where is a binary indicator specifying whether alternative is assigned to position under method . As shown in Table 11, the composite decision value captures the overall performance level of each scheme, while the conversion score characterizes the stability and consistency of its ranking across different methods.
Table 11.
Composite decision values and conversion scores for schemes.
Determination of the Final Ranking
By jointly considering the composite decision value and the conversion score , the final evaluation score of alternative is calculated as:
where controls the relative importance of performance magnitude and ranking consistency. In this study, priority is given to the decision value by setting . Varying allows the evaluation results to reflect different decision preferences and improves the adaptability of the traditional Borda-based framework. According to this formulation, a smaller corresponds to better comprehensive performance and a more balanced system outcome.
Based on Table 12, P3 (Digital Twin Empowerment and New Energy Co-integration) attains the top ranking with a score of 0.5641 and is evaluated as the best overall transition scheme, because the integration of digital-twin architectures with renewable-energy resources simultaneously enhances real-time information transparency, strengthens cross-domain coordination capabilities, and improves dispatch adaptability under uncertainty, which is aligned with socio-technical transition theory regarding the role of digital infrastructures as enablers of systemic change. The ranking of all schemes depends on the combination of indicator performances, and P3’s superior performance reflects the co-evolutionary advantage of digital technologies and new energy systems that generate learning effects, efficiency improvements, and operational synergies consistent with core arguments from innovation-diffusion research. This suggests that P3 represents a ‘technological regime shift’ where digital twins function not just as monitoring tools, but as critical mediators that resolve the intermittent challenges of renewable energy.
Table 12.
DEMATEL–MultiMOORA composite scores.
Overall, the Borda ranking indicates that lower composite scores correspond to better schemes when considering overall balance and performance requirements, because reduced composite scores represent lower transaction and coordination costs across institutional layers, which conforms to institutional-economic explanations of why integrated digital–energy systems achieve higher overall efficiency and stability.
A Posteriori Consistency Assessment
Following the derivation of the composite ranking, an a posteriori consistency evaluation is conducted using Spearman’s rank correlation coefficient, expressed as:
where denotes the rank of alternative obtained from the Borda-based aggregation, and represents the corresponding rank generated by other evaluation methods. The coefficient quantifies the degree of agreement between the composite ranking and the individual method rankings.
For validation purposes, the proposed results are compared with those derived from Fuzzy AHP, Analytic Network Process (ANP), VIKOR, and TOPSIS. Under the adopted Borda scoring rule, smaller values indicate higher priority and superior overall performance. For specific information, see Table 13.
Table 13.
Comparison of scheme performance rankings across decision methods.
Conventional Spearman-based consistency tests typically assume strict rank agreement. However, given the pronounced uncertainty and data variability associated with transition-scheme evaluations, this study applies a more flexible consistency threshold of 0.75. Allowing limited rank variation reduces excessive sensitivity to minor data perturbations while preserving the robustness and rationality of the evaluation outcomes. For specific information, see Table 14.
Table 14.
A posteriori consistency test results.
The mean Spearman correlation coefficient reaches 0.8607, which is well above the predefined threshold of 0.75, indicating a high level of agreement among the ranking results. In addition, the corresponding p-value of 0.0222 is below the 0.05 significance level, confirming that the observed consistency is statistically meaningful.
In conclusion, the high correlation between the proposed MultiMOORA-Borda framework and traditional methods like Fuzzy AHP and TOPSIS confirms its reliability. More importantly, the proposed approach offers superior sensitivity in capturing the ‘driving-responsive’ dynamics that traditional additive models often overlook, providing a more nuanced tool for coal power transition planning.
3.5. Model Robustness and Sensitivity Analysis
This section evaluates the robustness and reliability of the scenario rankings obtained from the proposed framework. The robustness assessment focuses on the stability of rankings under variations in indicator weights, while statistical tests are employed to verify ranking consistency. Furthermore, sensitivity analysis investigates the influence of changes in individual indicator weights on the overall ranking outcomes, thereby identifying critical drivers and validating the resilience of the evaluation results. This rigorous dual-testing approach—combining stability and sensitivity analysis—is essential for addressing the ‘rank reversal’ phenomenon frequently discussed in MCDM literature [70], ensuring that the decision recommendations are not merely artifacts of specific weight assignments.
Conventional MCDM approaches often exhibit limited adaptability to weight perturbations due to their rigid weighting structures. By contrast, the improved MultiMOORA–Borda method combines multiple evaluation mechanisms, enabling it to preserve ranking stability when weights fluctuate and to exhibit adaptive robustness. To examine its performance under uncertainty, a series of weight-variation scenarios is simulated to test ranking behavior in complex decision environments. By integrating multiple evaluation logics, the proposed framework aims to provide a ‘consensus-based’ stability that simpler, single-logic models often lack in volatile energy transition scenarios.
3.5.1. Stability Analysis
Experimental Design
To examine the robustness of the proposed MultiMOORA–Borda hybrid framework in assessing coal-power digitalization–greening transition schemes, a structured stability experiment is conducted. The baseline consists of the objective weights obtained from the fuzzy DEMATEL method. On this basis, random disturbances are applied to the weights, followed by normalization to ensure their sum equals one. Three perturbation intensities are considered, namely ±0.1 (low), ±0.3 (medium), and ±0.5 (high).
The perturbed weight sets are subsequently incorporated into the MultiMOORA–Borda model as well as four widely used MCDM methods—Fuzzy AHP, ANP, VIKOR, and TOPSIS—to re-evaluate the seven candidate schemes and generate alternative ranking results. Kendall’s Tau coefficient is then employed to measure the degree of ranking consistency across different perturbation scenarios, allowing for a comparative assessment of robustness and highlighting the advantages of the proposed hybrid approach under uncertainty.
Stability Analysis Results
In multi-criteria decision-making problems, variations in indicator weights can lead to changes in ranking outcomes. Kendall’s Tau provides a quantitative measure of this sensitivity by evaluating the degree of concordance between rankings obtained under different weight configurations, thereby serving as an indicator of methodological robustness. For specific information, see Table 15.
Table 15.
Average Kendall’s Tau coefficients for different weight-perturbation ranges.
The simulation outcomes presented in Figure 4 demonstrate the ranking behavior of five MCDM methods over 30 weight-perturbation iterations. Among them, the MultiMOORA–Borda approach consistently achieves the highest Kendall’s Tau values, varying approximately between 0.35 and 1.0, which indicates superior ranking stability and consistency. In contrast, TOPSIS exhibits pronounced sensitivity to weight variations, with its stability coefficient declining sharply in several iterations, reflecting substantial ranking fluctuations. Fuzzy AHP, ANP, and VIKOR show intermediate levels of robustness, yet their stability performance remains inferior to that of the proposed hybrid method.
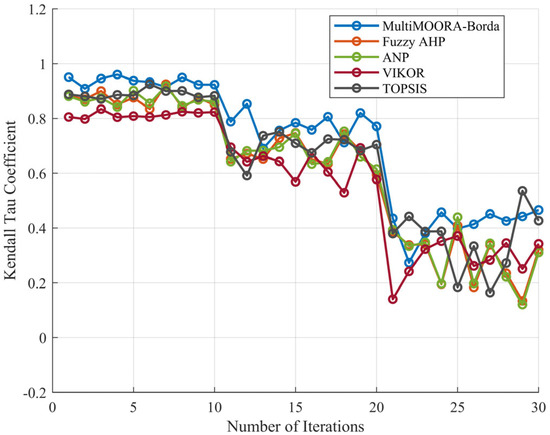
Figure 4.
Trends in Kendall Tau Coefficient for Stability Analysis.
In summary, the superior Kendall’s Tau performance of MultiMOORA-Borda suggests that the hybrid aggregation mechanism acts as a ‘buffer’ against noise in expert weighting, making it a more reliable tool for policy-makers who must deal with imprecise input data.
Overall, these results confirm that the MultiMOORA–Borda framework maintains strong robustness under weight perturbations and is particularly well suited for scheme selection problems characterized by complexity and dynamic uncertainty.
3.5.2. Significance Testing
To further substantiate the applicability of the proposed approach, statistical significance tests are conducted under three perturbation intensities (±0.1, ±0.3, and ±0.5). The results indicate that the Spearman correlation coefficients remain at relatively high levels across all scenarios, suggesting stable ranking behavior and satisfactory robustness in the presence of weight fluctuations. Compared with the alternative methods, MultiMOORA–Borda consistently delivers more reliable and stable evaluation outcomes, supporting its practical effectiveness.
3.5.3. Sensitivity Analysis
- (1)
- Sensitivity analysis procedure
The sensitivity analysis investigates how variations in individual indicator weights (C11–C46) influence the final rankings generated by the MultiMOORA–Borda model. Specifically, the weight of one indicator is gradually adjusted from 0% to 100%, while the weights of the remaining 21 indicators are proportionally rescaled to ensure that the total weight remains equal to one. For each adjustment scenario, Kendall’s Tau is calculated between the resulting ranking and the baseline ranking to quantify the sensitivity of the overall evaluation to changes in that specific indicator.
- (2)
- Sensitivity analysis results
The sensitivity of each indicator is assessed based on the range of variation in Kendall’s Tau observed during the weight-adjustment process. A larger variation range implies greater influence on the ranking results. The detailed outcomes of the sensitivity analysis, along with the performance of key indicators, are summarized in Table 16.
Table 16.
Sensitivity analysis results for indicators.
As reported in Table 16, cost-related financial indicators (C11 and C44) together with strategy and learning indicators (C23) exhibit the highest sensitivity and therefore exert the strongest influence on the ranking results. Among them, C44 (Financial Return) presents the largest fluctuation in Kendall’s Tau, decreasing from 1.000 to 0.190, which suggests that even minor changes in its weight may lead to substantial reordering of schemes. A similar pattern is observed for C11 (Green Transformation Marginal Economy), whose Kendall’s Tau varies between 1.000 and 0.238, highlighting its pivotal role in shaping scheme priorities.
In contrast, indicators such as C12 (Integration of Energy–Digital Market Revenues), C14 (Accessibility of Investment and Financing), and C21 (Strategy Diversity and Evolutionary Stability) show relatively low sensitivity. Their Kendall’s Tau values remain above 0.667 throughout the adjustment process, indicating that variations in these indicators have limited impact on the final ranking and that the evaluation framework remains robust with respect to them.
In general, schemes with higher overall performance demonstrate greater resistance to weight perturbations, whereas lower-ranked schemes are more susceptible to ranking changes (For details, see Appendix C). These findings identify C44, C11, and C23 as the most influential indicators in the evaluation system, providing a quantitative basis for future decision-making and targeted resource allocation.
From a practical scheme-selection standpoint, radar charts offer an intuitive means of visualizing indicator influence under dynamic weighting conditions. As illustrated in Figure 5b, benefit-oriented indicators such as C44 (Financial Return) and C41 (Green Emission Reduction Realization) display pronounced sensitivity, with their curves contracting markedly toward the center, particularly when . Likewise, Figure 5a shows that C11 (Green Transformation Marginal Economy) and C23 (Digital Behavior Heterogeneity and Learning Rate) respond strongly to weight adjustments. The concentration of sensitivity around these indicators indicates that economic performance and key strategic factors constitute the primary sources of ranking variability. By comparison, supportive indicators—including C14 (Investment and Financing Accessibility) and C33 (IT–OT–Green Accounting System Integration)—remain close to the outer boundary across weight changes, reflecting minor fluctuations and high stability in the ranking outcomes.
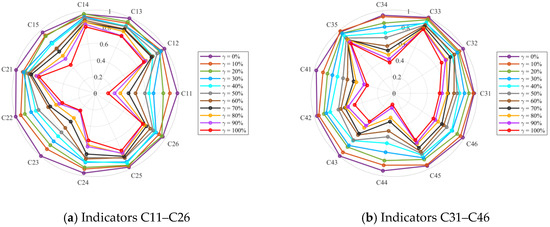
Figure 5.
Sensitivity-analysis radar charts.
The concentration of sensitivity in economic (C44, C11) and strategic (C23) indicators highlights that while digitalization (C43) provides the ‘engine’ for synergy, the final success of the transition is still steered by financial viability and organizational learning speed. Therefore, management interventions should prioritize these high-sensitivity leverage points to ensure ranking stability and project success.
4. Discussion and Conclusions
4.1. Discussion
This study constructs a fuzzy DEMATEL–MultiMOORA–Borda integrated decision model to systematically evaluate seven representative transition schemes for the coal-power industry’s simultaneous digitalization and greening under the energy transition. First, results confirm that “digital + green” transition schemes outperform “green-only” schemes in comprehensive performance. Among all alternatives, P3 (Digital Twin Empowerment and New Energy Co-integration) ranks best under the adopted evaluation framework, reflecting expert recognition of this integrated technological model’s potential to realize digital empowerment and synergistic value with new energy in future energy markets. Second, causal analysis identifies Carbon Price and Digital Hedging Capability (C13) and Digital-driven Operational Efficiency Improvement (C43) as core drivers of coal-power synergistic transformation performance, emphasizing that irrespective of scheme choice, firms must prioritize market risk management and fundamental operational efficiency to improve performance. Furthermore, sensitivity analysis highlights Financial Return (C44), Green Transformation Marginal Economy (C11), and Digital Behavior Heterogeneity and Learning Rate (C23) as the most influential indicators on the final ranking, demanding concentrated strategic attention.
Based on these findings, this study proposes policy and firm-level recommendations. At the policy level, governments should accelerate power-market reform, specifically focusing on mechanisms that monetize Digital Hedging Capability (C13) and guarantee the profitability of Green Transformation Marginal Economy (C11). This includes breaking the limitations of single carbon-market mechanisms and establishing incentive systems that synergize carbon markets with green policies (such as ancillary services and preferential green-power trading). Specifically, to directly reinforce the core driver C13, more stable and predictable price signals for flexible services should be provided to ensure the economic rationale for coal-power plants to undertake flexibility retrofits, thereby effectively hedging the utilization-hours risk brought by higher renewable penetration and ensuring C11 remains positive.
At the firm level, coal-power plant operators should decisively adopt digital–green dual-transformation schemes (P1–P4) rather than adhering to green-only options (P5–P7). Given that Financial Return (C44) and Green Transformation Marginal Economy (C11) are the most sensitive indicators, firms’ digital investments must be strategically deployed to mitigate risks associated with these two sensitive indicators. Operators should prioritize investment in digital infrastructure (e.g., IIoT and digital twins) to achieve precise fuel optimization and marginal improvements in operational efficiency (C43), thereby continuously optimizing cost structure and directly stabilizing the sensitive indicators C44 (revenue side) and C11 (cost side) to cope with market price fluctuations. Concurrently, firms should actively explore transformation into integrated energy service providers (P2), extending digital capabilities to regional multi-energy complementarity and green-power trading integration, thereby consolidating transition revenues and reducing stranded-asset risk.
4.2. Conclusions
This study’s primary strengths lie in methodological innovation and the systematic nature of the performance evaluation framework. Theoretically, a four-dimension, 22-indicator evaluation system is first proposed, covering Synergistic Economic Performance, Green-Digital Strategy, Synergistic Governance and Integration, and Green & Digital Technology Performance, providing a comprehensive framework for coal-power synergistic transition assessment. Methodologically, by integrating fuzzy DEMATEL to handle complex causal relations among indicators and employing MultiMOORA–Borda to aggregate rankings, the approach effectively addresses the fuzziness of expert judgments and conflicts among multi-source rankings typical of traditional MCDM methods. Stability analysis further validates the hybrid model’s high robustness in scheme ranking, offering a robust tool for dynamic decision problems under multiple constraints.
Nevertheless, limitations exist. As an expert-judgment-based MCDM model, even though interval type-2 fuzzy numbers are used to capture uncertainty, the evaluation outcomes still depend on the current experts’ cognitive structures and forecasts of future market trends, which may introduce potential cognitive bias and subjectivity. Crucially, when translating the model output (optimal scenario ranking) into practical policy and resource allocation decisions under conditions of deep uncertainty, decision-makers are still required to interpret the results critically, incorporating non-quantified policy constraints and stakeholder considerations; this is an inherent limitation of the model itself. Future research could integrate temporal analysis or dynamic evolutionary game models and incorporate longer time-series market data to dynamically simulate long-term performance of schemes under the Green-Digital Strategy (C2) dimension. Furthermore, the external validity of this framework warrants discussion. Although the indicator system and model are set against the Chinese coal power transition, the multi-objective decision-making methodology and the four-dimensional framework balancing ‘hard’ and ‘soft’ indicators are, in principle, generalizable to other industrial sectors facing ‘dual transformation’ (e.g., the oil and gas industry’s digitalization and carbon capture transition). Adaptation will primarily focus on replacing the context-specific Green-Digital Strategy indicators related to local policies and market structures, and adjusting the expert panel to include stakeholders from different regions, rather than replacing the core MultiMOORA-Borda integrated decision logic. Additionally, while this study considers collaborative governance and integration, research into the conversion mechanism linking model results with actual policy formulation and benefit distribution remains underdeveloped; future work should incorporate fairness and “just transition” social elements, and explore the establishment of a decision framework to bridge the gap between model output and practical implementation, making transition evaluations more comprehensive and sustainable.
Author Contributions
Conceptualization, methodology, writing—original draft preparation, writing—review and editing, visualization, supervision, Z.L.; funding acquisition, Y.W. All authors have read and agreed to the published version of the manuscript.
Funding
This study was supported by the S&T Program of Energy Shaanxi Laboratory (Grant ESLB202443), the Major Program of the National Social Science Fund of China (Grant No. 21&ZD133), and the Key Program of the National Social Science Fund of China (Grant No. 22AJY006). The funders had no role in the design or conduct of the study.
Institutional Review Board Statement
Ethical review and approval were waived for this study due to legal regulations that do not require ethical review for research involving personal information data, according to Chapter 1, Section 3 of the Trial Regulations on Scientific and Techno-logical Ethics Review—jointly issued by the Ministry of Science and Technology of China and nine other departments.
Informed Consent Statement
This study obtained informed consent from all participants involved in the study.
Data Availability Statement
The datasets used and/or analyzed for this study are available from the corresponding author upon reasonable request.
Conflicts of Interest
The authors declare no conflicts of interest.
Appendix A
Table A1.
Expert Fuzzy Evaluation Form.
Table A1.
Expert Fuzzy Evaluation Form.
| C11 | C12 | C13 | C14 | C15 | C21 | C22 | C23 | C24 | C25 | C26 | C31 | C32 | C33 | C34 | C35 | C41 | C42 | C43 | C44 | C45 | C46 | |
|---|---|---|---|---|---|---|---|---|---|---|---|---|---|---|---|---|---|---|---|---|---|---|
| C11 | 0 | VH | EL | VH | VH | H | VH | VH | L | EH | H | EL | VL | EH | VL | EL | L | VL | EL | EL | M | EL |
| C12 | EH | 0 | L | VH | M | L | EL | VH | EH | EH | L | L | VH | EL | VH | EH | EL | L | EH | EL | H | VL |
| C13 | H | VH | 0 | VH | L | EH | VL | EH | H | M | L | EL | EL | EH | M | VH | EH | EL | VH | EL | EH | VH |
| C14 | H | L | M | 0 | M | EH | EL | M | L | M | VL | VL | VH | VL | VH | VL | VH | M | M | EH | H | EL |
| C15 | EL | VL | H | M | 0 | H | L | EH | VH | H | VH | H | H | H | L | VL | L | EL | M | EH | H | M |
| C21 | VL | VH | EH | H | H | 0 | VL | H | VH | M | L | VL | EH | H | VH | EL | EH | EH | EL | M | EL | H |
| C22 | VH | VL | EH | VL | VH | EH | 0 | VL | L | EL | H | VL | VL | L | L | VH | EL | VH | VL | H | EL | EH |
| C23 | H | EH | VL | H | L | VL | VH | 0 | EH | EH | M | EL | M | EH | H | EH | EL | EL | L | EH | M | VL |
| C24 | VH | EL | EL | VL | EL | EL | M | M | 0 | VH | EH | H | EH | H | L | H | H | EL | H | EL | VL | H |
| C25 | VL | EL | M | L | VL | EL | VH | H | EL | 0 | EH | EL | VL | H | VL | H | H | VH | L | H | L | M |
| C26 | M | EL | L | VH | L | H | H | M | H | VH | 0 | L | H | L | L | EH | M | H | VH | H | EH | EH |
| C31 | EL | M | L | VH | VL | L | EL | VL | VH | L | VL | 0 | VL | EH | EH | VH | L | M | H | M | L | EL |
| C32 | L | EH | L | VL | VL | M | EH | M | EH | EL | VL | VH | 0 | H | EL | VL | H | EH | M | L | EH | EH |
| C33 | VH | M | EL | VL | EH | VH | EL | H | L | VL | VL | VL | EL | 0 | VH | L | L | L | EH | M | VL | H |
| C34 | M | VH | H | H | L | H | M | M | EH | L | VH | M | VH | L | 0 | VL | L | H | EH | EL | M | VH |
| C35 | VL | EL | H | H | H | VH | L | H | VL | L | M | VH | M | EH | VH | 0 | L | M | M | H | VL | H |
| C41 | L | L | EH | VH | EH | L | VH | VL | L | M | L | VH | VH | EL | M | EH | 0 | VH | EL | H | M | EL |
| C42 | EH | VH | VH | VL | EL | EH | VL | M | VL | EL | H | EL | L | VH | VH | M | H | 0 | EL | M | EH | VL |
| C43 | VH | EH | EH | L | EL | H | EH | EH | M | L | H | M | H | M | M | EH | VL | VH | 0 | L | H | VL |
| C44 | VH | VL | H | EL | H | EH | EH | M | L | EH | M | L | EL | L | VH | M | EH | L | M | 0 | VL | EL |
| C45 | L | EL | EL | M | L | M | H | VL | H | L | EL | EL | VL | VL | EH | VH | EH | EH | VL | H | 0 | VL |
| C46 | VH | L | EL | VL | H | H | VL | VH | M | EL | EH | L | H | EL | H | EL | VH | VH | EH | L | VH | 0 |
Table A2.
Direct Effect Matrix for De-blurring.
Table A2.
Direct Effect Matrix for De-blurring.
| C11 | C12 | C13 | C14 | C15 | C21 | C22 | C23 | C24 | C25 | C26 | C31 | C32 | C33 | C34 | C35 | C41 | C42 | C43 | C44 | C45 | C46 | |
|---|---|---|---|---|---|---|---|---|---|---|---|---|---|---|---|---|---|---|---|---|---|---|
| C11 | 0 | 0.7675 | 0.0975 | 0.7675 | 0.7675 | 0.63375 | 0.7675 | 0.7675 | 0.34125 | 0.8775 | 0.63375 | 0.0975 | 0.2075 | 0.8775 | 0.2075 | 0.0975 | 0.34125 | 0.2075 | 0.0975 | 0.0975 | 0.4875 | 0.0975 |
| C12 | 0.8775 | 0 | 0.34125 | 0.7675 | 0.4875 | 0.34125 | 0.0975 | 0.7675 | 0.8775 | 0.8775 | 0.34125 | 0.34125 | 0.7675 | 0.0975 | 0.7675 | 0.8775 | 0.0975 | 0.34125 | 0.8775 | 0.0975 | 0.63375 | 0.2075 |
| C13 | 0.63375 | 0.7675 | 0 | 0.7675 | 0.34125 | 0.8775 | 0.2075 | 0.8775 | 0.63375 | 0.4875 | 0.34125 | 0.0975 | 0.0975 | 0.8775 | 0.4875 | 0.7675 | 0.8775 | 0.0975 | 0.7675 | 0.0975 | 0.8775 | 0.7675 |
| C14 | 0.63375 | 0.34125 | 0.4875 | 0 | 0.4875 | 0.8775 | 0.0975 | 0.4875 | 0.34125 | 0.4875 | 0.2075 | 0.2075 | 0.7675 | 0.2075 | 0.7675 | 0.2075 | 0.7675 | 0.4875 | 0.4875 | 0.8775 | 0.63375 | 0.0975 |
| C15 | 0.0975 | 0.2075 | 0.63375 | 0.4875 | 0 | 0.63375 | 0.34125 | 0.8775 | 0.7675 | 0.63375 | 0.7675 | 0.63375 | 0.63375 | 0.63375 | 0.34125 | 0.2075 | 0.34125 | 0.0975 | 0.4875 | 0.8775 | 0.63375 | 0.4875 |
| C21 | 0.2075 | 0.7675 | 0.8775 | 0.63375 | 0.63375 | 0 | 0.2075 | 0.63375 | 0.7675 | 0.4875 | 0.34125 | 0.2075 | 0.8775 | 0.63375 | 0.7675 | 0.0975 | 0.8775 | 0.8775 | 0.0975 | 0.4875 | 0.0975 | 0.63375 |
| C22 | 0.7675 | 0.2075 | 0.8775 | 0.2075 | 0.7675 | 0.8775 | 0 | 0.2075 | 0.34125 | 0.0975 | 0.63375 | 0.2075 | 0.2075 | 0.34125 | 0.34125 | 0.7675 | 0.0975 | 0.7675 | 0.2075 | 0.63375 | 0.0975 | 0.8775 |
| C23 | 0.63375 | 0.8775 | 0.2075 | 0.63375 | 0.34125 | 0.2075 | 0.7675 | 0 | 0.8775 | 0.8775 | 0.4875 | 0.0975 | 0.4875 | 0.8775 | 0.63375 | 0.8775 | 0.0975 | 0.0975 | 0.34125 | 0.8775 | 0.4875 | 0.2075 |
| C24 | 0.7675 | 0.0975 | 0.0975 | 0.2075 | 0.0975 | 0.0975 | 0.4875 | 0.4875 | 0 | 0.7675 | 0.8775 | 0.63375 | 0.8775 | 0.63375 | 0.34125 | 0.63375 | 0.63375 | 0.0975 | 0.63375 | 0.0975 | 0.2075 | 0.63375 |
| C25 | 0.2075 | 0.0975 | 0.4875 | 0.34125 | 0.2075 | 0.0975 | 0.7675 | 0.63375 | 0.0975 | 0 | 0.8775 | 0.0975 | 0.2075 | 0.63375 | 0.2075 | 0.63375 | 0.63375 | 0.7675 | 0.34125 | 0.63375 | 0.34125 | 0.4875 |
| C26 | 0.4875 | 0.0975 | 0.34125 | 0.7675 | 0.34125 | 0.63375 | 0.63375 | 0.4875 | 0.63375 | 0.7675 | 0 | 0.34125 | 0.63375 | 0.34125 | 0.34125 | 0.8775 | 0.4875 | 0.63375 | 0.7675 | 0.63375 | 0.8775 | 0.8775 |
| C31 | 0.0975 | 0.4875 | 0.34125 | 0.7675 | 0.2075 | 0.34125 | 0.0975 | 0.2075 | 0.7675 | 0.34125 | 0.2075 | 0 | 0.2075 | 0.8775 | 0.8775 | 0.7675 | 0.34125 | 0.4875 | 0.63375 | 0.4875 | 0.34125 | 0.0975 |
| C32 | 0.34125 | 0.8775 | 0.34125 | 0.2075 | 0.2075 | 0.4875 | 0.8775 | 0.4875 | 0.8775 | 0.0975 | 0.2075 | 0.7675 | 0 | 0.63375 | 0.0975 | 0.2075 | 0.63375 | 0.8775 | 0.4875 | 0.34125 | 0.8775 | 0.8775 |
| C33 | 0.7675 | 0.4875 | 0.0975 | 0.2075 | 0.8775 | 0.7675 | 0.0975 | 0.63375 | 0.34125 | 0.2075 | 0.2075 | 0.2075 | 0.0975 | 0 | 0.7675 | 0.34125 | 0.34125 | 0.34125 | 0.8775 | 0.4875 | 0.2075 | 0.63375 |
| C34 | 0.4875 | 0.7675 | 0.63375 | 0.63375 | 0.34125 | 0.63375 | 0.4875 | 0.4875 | 0.8775 | 0.34125 | 0.7675 | 0.4875 | 0.7675 | 0.34125 | 0 | 0.2075 | 0.34125 | 0.63375 | 0.8775 | 0.0975 | 0.4875 | 0.7675 |
| C35 | 0.2075 | 0.0975 | 0.63375 | 0.63375 | 0.63375 | 0.7675 | 0.34125 | 0.63375 | 0.2075 | 0.34125 | 0.4875 | 0.7675 | 0.4875 | 0.8775 | 0.7675 | 0 | 0.34125 | 0.4875 | 0.4875 | 0.63375 | 0.2075 | 0.63375 |
| C41 | 0.34125 | 0.34125 | 0.8775 | 0.7675 | 0.8775 | 0.34125 | 0.7675 | 0.2075 | 0.34125 | 0.4875 | 0.34125 | 0.7675 | 0.7675 | 0.0975 | 0.4875 | 0.8775 | 0 | 0.7675 | 0.0975 | 0.63375 | 0.4875 | 0.0975 |
| C42 | 0.8775 | 0.7675 | 0.7675 | 0.2075 | 0.0975 | 0.8775 | 0.2075 | 0.4875 | 0.2075 | 0.0975 | 0.63375 | 0.0975 | 0.34125 | 0.7675 | 0.7675 | 0.4875 | 0.63375 | 0 | 0.0975 | 0.4875 | 0.8775 | 0.2075 |
| C43 | 0.7675 | 0.8775 | 0.8775 | 0.34125 | 0.0975 | 0.63375 | 0.8775 | 0.8775 | 0.4875 | 0.34125 | 0.63375 | 0.4875 | 0.63375 | 0.4875 | 0.4875 | 0.8775 | 0.2075 | 0.7675 | 0 | 0.34125 | 0.63375 | 0.2075 |
| C44 | 0.7675 | 0.2075 | 0.63375 | 0.0975 | 0.63375 | 0.8775 | 0.8775 | 0.4875 | 0.34125 | 0.8775 | 0.4875 | 0.34125 | 0.0975 | 0.34125 | 0.7675 | 0.4875 | 0.8775 | 0.34125 | 0.4875 | 0 | 0.2075 | 0.0975 |
| C45 | 0.34125 | 0.0975 | 0.0975 | 0.4875 | 0.34125 | 0.4875 | 0.63375 | 0.2075 | 0.63375 | 0.34125 | 0.0975 | 0.0975 | 0.2075 | 0.2075 | 0.8775 | 0.7675 | 0.8775 | 0.8775 | 0.2075 | 0.63375 | 0 | 0.2075 |
| C46 | 0.7675 | 0.34125 | 0.0975 | 0.2075 | 0.63375 | 0.63375 | 0.2075 | 0.7675 | 0.4875 | 0.0975 | 0.8775 | 0.34125 | 0.63375 | 0.0975 | 0.63375 | 0.0975 | 0.7675 | 0.7675 | 0.8775 | 0.34125 | 0.7675 | 0 |
Table A3.
Standardized Direct Impact Matrix.
Table A3.
Standardized Direct Impact Matrix.
| C11 | C12 | C13 | C14 | C15 | C21 | C22 | C23 | C24 | C25 | C26 | C31 | C32 | C33 | C34 | C35 | C41 | C42 | C43 | C44 | C45 | C46 | |
|---|---|---|---|---|---|---|---|---|---|---|---|---|---|---|---|---|---|---|---|---|---|---|
| C11 | 0 | 0.0527 | 0.0067 | 0.0527 | 0.0527 | 0.0435 | 0.0527 | 0.0527 | 0.0234 | 0.0602 | 0.0435 | 0.0067 | 0.0142 | 0.0602 | 0.0142 | 0.0067 | 0.0234 | 0.0142 | 0.0067 | 0.0067 | 0.0334 | 0.0067 |
| C12 | 0.0602 | 0 | 0.0234 | 0.0527 | 0.0334 | 0.0234 | 0.0067 | 0.0527 | 0.0602 | 0.0602 | 0.0234 | 0.0234 | 0.0527 | 0.0067 | 0.0527 | 0.0602 | 0.0067 | 0.0234 | 0.0602 | 0.0067 | 0.0435 | 0.0142 |
| C13 | 0.0435 | 0.0527 | 0 | 0.0527 | 0.0234 | 0.0602 | 0.0142 | 0.0602 | 0.0435 | 0.0334 | 0.0234 | 0.0067 | 0.0067 | 0.0602 | 0.0334 | 0.0527 | 0.0602 | 0.0067 | 0.0527 | 0.0067 | 0.0602 | 0.0527 |
| C14 | 0.0435 | 0.0234 | 0.0334 | 0 | 0.0334 | 0.0602 | 0.0067 | 0.0334 | 0.0234 | 0.0334 | 0.0142 | 0.0142 | 0.0527 | 0.0142 | 0.0527 | 0.0142 | 0.0527 | 0.0334 | 0.0334 | 0.0602 | 0.0435 | 0.0067 |
| C15 | 0.0067 | 0.0142 | 0.0435 | 0.0334 | 0 | 0.0435 | 0.0234 | 0.0602 | 0.0527 | 0.0435 | 0.0527 | 0.0435 | 0.0435 | 0.0435 | 0.0234 | 0.0142 | 0.0234 | 0.0067 | 0.0334 | 0.0602 | 0.0435 | 0.0334 |
| C21 | 0.0142 | 0.0527 | 0.0602 | 0.0435 | 0.0435 | 0 | 0.0142 | 0.0435 | 0.0527 | 0.0334 | 0.0234 | 0.0142 | 0.0602 | 0.0435 | 0.0527 | 0.0067 | 0.0602 | 0.0602 | 0.0067 | 0.0334 | 0.0067 | 0.0435 |
| C22 | 0.0527 | 0.0142 | 0.0602 | 0.0142 | 0.0527 | 0.0602 | 0 | 0.0142 | 0.0234 | 0.0067 | 0.0435 | 0.0142 | 0.0142 | 0.0234 | 0.0234 | 0.0527 | 0.0067 | 0.0527 | 0.0142 | 0.0435 | 0.0067 | 0.0602 |
| C23 | 0.0435 | 0.0602 | 0.0142 | 0.0435 | 0.0234 | 0.0142 | 0.0527 | 0 | 0.0602 | 0.0602 | 0.0334 | 0.0067 | 0.0334 | 0.0602 | 0.0435 | 0.0602 | 0.0067 | 0.0067 | 0.0234 | 0.0602 | 0.0334 | 0.0142 |
| C24 | 0.0527 | 0.0067 | 0.0067 | 0.0142 | 0.0067 | 0.0067 | 0.0334 | 0.0334 | 0 | 0.0527 | 0.0602 | 0.0435 | 0.0602 | 0.0435 | 0.0234 | 0.0435 | 0.0435 | 0.0067 | 0.0435 | 0.0067 | 0.0142 | 0.0435 |
| C25 | 0.0142 | 0.0067 | 0.0334 | 0.0234 | 0.0142 | 0.0067 | 0.0527 | 0.0435 | 0.0067 | 0 | 0.0602 | 0.0067 | 0.0142 | 0.0435 | 0.0142 | 0.0435 | 0.0435 | 0.0527 | 0.0234 | 0.0435 | 0.0234 | 0.0334 |
| C26 | 0.0334 | 0.0067 | 0.0234 | 0.0527 | 0.0234 | 0.0435 | 0.0435 | 0.0334 | 0.0435 | 0.0527 | 0 | 0.0234 | 0.0435 | 0.0234 | 0.0234 | 0.0602 | 0.0334 | 0.0435 | 0.0527 | 0.0435 | 0.0602 | 0.0602 |
| C31 | 0.0067 | 0.0334 | 0.0234 | 0.0527 | 0.0142 | 0.0234 | 0.0067 | 0.0142 | 0.0527 | 0.0234 | 0.0142 | 0 | 0.0142 | 0.0602 | 0.0602 | 0.0527 | 0.0234 | 0.0334 | 0.0435 | 0.0334 | 0.0234 | 0.0067 |
| C32 | 0.0234 | 0.0602 | 0.0234 | 0.0142 | 0.0142 | 0.0334 | 0.0602 | 0.0334 | 0.0602 | 0.0067 | 0.0142 | 0.0527 | 0 | 0.0435 | 0.0067 | 0.0142 | 0.0435 | 0.0602 | 0.0334 | 0.0234 | 0.0602 | 0.0602 |
| C33 | 0.0527 | 0.0334 | 0.0067 | 0.0142 | 0.0602 | 0.0527 | 0.0067 | 0.0435 | 0.0234 | 0.0142 | 0.0142 | 0.0142 | 0.0067 | 0 | 0.0527 | 0.0234 | 0.0234 | 0.0234 | 0.0602 | 0.0334 | 0.0142 | 0.0435 |
| C34 | 0.0334 | 0.0527 | 0.0435 | 0.0435 | 0.0234 | 0.0435 | 0.0334 | 0.0334 | 0.0602 | 0.0234 | 0.0527 | 0.0334 | 0.0527 | 0.0234 | 0 | 0.0142 | 0.0234 | 0.0435 | 0.0602 | 0.0067 | 0.0334 | 0.0527 |
| C35 | 0.0142 | 0.0067 | 0.0435 | 0.0435 | 0.0435 | 0.0527 | 0.0234 | 0.0435 | 0.0142 | 0.0234 | 0.0334 | 0.0527 | 0.0334 | 0.0602 | 0.0527 | 0 | 0.0234 | 0.0334 | 0.0334 | 0.0435 | 0.0142 | 0.0435 |
| C41 | 0.0234 | 0.0234 | 0.0602 | 0.0527 | 0.0602 | 0.0234 | 0.0527 | 0.0142 | 0.0234 | 0.0334 | 0.0234 | 0.0527 | 0.0527 | 0.0067 | 0.0334 | 0.0602 | 0 | 0.0527 | 0.0067 | 0.0435 | 0.0334 | 0.0067 |
| C42 | 0.0602 | 0.0527 | 0.0527 | 0.0142 | 0.0067 | 0.0602 | 0.0142 | 0.0334 | 0.0142 | 0.0067 | 0.0435 | 0.0067 | 0.0234 | 0.0527 | 0.0527 | 0.0334 | 0.0435 | 0 | 0.0067 | 0.0334 | 0.0602 | 0.0142 |
| C43 | 0.0527 | 0.0602 | 0.0602 | 0.0234 | 0.0067 | 0.0435 | 0.0602 | 0.0602 | 0.0334 | 0.0234 | 0.0435 | 0.0334 | 0.0435 | 0.0334 | 0.0334 | 0.0602 | 0.0142 | 0.0527 | 0 | 0.0234 | 0.0435 | 0.0142 |
| C44 | 0.0527 | 0.0142 | 0.0435 | 0.0067 | 0.0435 | 0.0602 | 0.0602 | 0.0334 | 0.0234 | 0.0602 | 0.0334 | 0.0234 | 0.0067 | 0.0234 | 0.0527 | 0.0334 | 0.0602 | 0.0234 | 0.0334 | 0 | 0.0142 | 0.0067 |
| C45 | 0.0234 | 0.0067 | 0.0067 | 0.0334 | 0.0234 | 0.0334 | 0.0435 | 0.0142 | 0.0435 | 0.0234 | 0.0067 | 0.0067 | 0.0142 | 0.0142 | 0.0602 | 0.0527 | 0.0602 | 0.0602 | 0.0142 | 0.0435 | 0 | 0.0142 |
| C46 | 0.0527 | 0.0234 | 0.0067 | 0.0142 | 0.0435 | 0.0435 | 0.0142 | 0.0527 | 0.0334 | 0.0067 | 0.0602 | 0.0234 | 0.0435 | 0.0067 | 0.0435 | 0.0067 | 0.0527 | 0.0527 | 0.0602 | 0.0234 | 0.0527 | 0 |
Table A4.
Comprehensive Impact Matrix.
Table A4.
Comprehensive Impact Matrix.
| C11 | C12 | C13 | C14 | C15 | C21 | C22 | C23 | C24 | C25 | C26 | C31 | C32 | C33 | C34 | C35 | C41 | C42 | C43 | C44 | C45 | C46 | |
|---|---|---|---|---|---|---|---|---|---|---|---|---|---|---|---|---|---|---|---|---|---|---|
| C11 | 0 | 0.0061 | 0.0005 | 0.0063 | 0.0062 | 0.0054 | 0.0062 | 0.0069 | 0.0023 | 0.0077 | 0.0050 | 0.0004 | 0.0012 | 0.0079 | 0.0013 | 0.0006 | 0.0022 | 0.0012 | 0.0005 | 0.0005 | 0.0034 | 0.0005 |
| C12 | 0.0088 | 0.0000 | 0.0024 | 0.0071 | 0.0036 | 0.0028 | 0.0006 | 0.0077 | 0.0090 | 0.0085 | 0.0026 | 0.0020 | 0.0071 | 0.0007 | 0.0076 | 0.0088 | 0.0006 | 0.0026 | 0.0084 | 0.0006 | 0.0055 | 0.0013 |
| C13 | 0.0061 | 0.0072 | 0.0000 | 0.0075 | 0.0025 | 0.0097 | 0.0014 | 0.0097 | 0.0061 | 0.0041 | 0.0027 | 0.0005 | 0.0007 | 0.0091 | 0.0046 | 0.0078 | 0.0091 | 0.0007 | 0.0074 | 0.0006 | 0.0089 | 0.0069 |
| C14 | 0.0054 | 0.0023 | 0.0036 | 0.0000 | 0.0035 | 0.0089 | 0.0006 | 0.0040 | 0.0025 | 0.0036 | 0.0013 | 0.0010 | 0.0067 | 0.0014 | 0.0073 | 0.0014 | 0.0070 | 0.0038 | 0.0035 | 0.0079 | 0.0052 | 0.0005 |
| C15 | 0.0007 | 0.0013 | 0.0052 | 0.0038 | 0.0000 | 0.0060 | 0.0025 | 0.0091 | 0.0075 | 0.0054 | 0.0071 | 0.0044 | 0.0054 | 0.0057 | 0.0028 | 0.0015 | 0.0026 | 0.0006 | 0.0039 | 0.0084 | 0.0055 | 0.0036 |
| C21 | 0.0016 | 0.0071 | 0.0085 | 0.0055 | 0.0053 | 0.0000 | 0.0014 | 0.0062 | 0.0077 | 0.0039 | 0.0026 | 0.0011 | 0.0087 | 0.0058 | 0.0078 | 0.0007 | 0.0089 | 0.0089 | 0.0006 | 0.0038 | 0.0007 | 0.0053 |
| C22 | 0.0069 | 0.0012 | 0.0078 | 0.0013 | 0.0064 | 0.0089 | 0.0000 | 0.0014 | 0.0024 | 0.0005 | 0.0052 | 0.0010 | 0.0012 | 0.0024 | 0.0025 | 0.0067 | 0.0006 | 0.0067 | 0.0013 | 0.0049 | 0.0006 | 0.0077 |
| C23 | 0.0058 | 0.0080 | 0.0013 | 0.0053 | 0.0024 | 0.0016 | 0.0070 | 0.0000 | 0.0088 | 0.0085 | 0.0040 | 0.0005 | 0.0038 | 0.0088 | 0.0059 | 0.0089 | 0.0006 | 0.0006 | 0.0025 | 0.0083 | 0.0038 | 0.0013 |
| C24 | 0.0067 | 0.0005 | 0.0005 | 0.0012 | 0.0005 | 0.0006 | 0.0035 | 0.0038 | 0.0000 | 0.0063 | 0.0080 | 0.0041 | 0.0077 | 0.0052 | 0.0024 | 0.0052 | 0.0050 | 0.0006 | 0.0049 | 0.0005 | 0.0012 | 0.0048 |
| C25 | 0.0013 | 0.0005 | 0.0033 | 0.0021 | 0.0011 | 0.0006 | 0.0062 | 0.0052 | 0.0005 | 0.0000 | 0.0077 | 0.0004 | 0.0011 | 0.0050 | 0.0013 | 0.0051 | 0.0049 | 0.0065 | 0.0021 | 0.0048 | 0.0022 | 0.0032 |
| C26 | 0.0044 | 0.0006 | 0.0026 | 0.0073 | 0.0025 | 0.0065 | 0.0058 | 0.0045 | 0.0061 | 0.0073 | 0.0000 | 0.0021 | 0.0057 | 0.0028 | 0.0030 | 0.0093 | 0.0043 | 0.0061 | 0.0073 | 0.0057 | 0.0090 | 0.0085 |
| C31 | 0.0006 | 0.0033 | 0.0021 | 0.0063 | 0.0011 | 0.0025 | 0.0005 | 0.0013 | 0.0066 | 0.0021 | 0.0012 | 0.0000 | 0.0012 | 0.0079 | 0.0083 | 0.0066 | 0.0022 | 0.0035 | 0.0049 | 0.0033 | 0.0021 | 0.0005 |
| C32 | 0.0027 | 0.0081 | 0.0024 | 0.0013 | 0.0013 | 0.0043 | 0.0081 | 0.0041 | 0.0089 | 0.0006 | 0.0014 | 0.0057 | 0.0000 | 0.0055 | 0.0007 | 0.0015 | 0.0055 | 0.0087 | 0.0038 | 0.0024 | 0.0084 | 0.0079 |
| C33 | 0.0067 | 0.0034 | 0.0005 | 0.0012 | 0.0074 | 0.0070 | 0.0005 | 0.0054 | 0.0024 | 0.0012 | 0.0013 | 0.0009 | 0.0005 | 0.0000 | 0.0069 | 0.0023 | 0.0022 | 0.0022 | 0.0077 | 0.0033 | 0.0012 | 0.0045 |
| C34 | 0.0043 | 0.0072 | 0.0055 | 0.0056 | 0.0024 | 0.0063 | 0.0039 | 0.0045 | 0.0094 | 0.0026 | 0.0075 | 0.0032 | 0.0074 | 0.0027 | 0.0000 | 0.0016 | 0.0027 | 0.0059 | 0.0088 | 0.0006 | 0.0042 | 0.0070 |
| C35 | 0.0015 | 0.0006 | 0.0053 | 0.0054 | 0.0052 | 0.0079 | 0.0024 | 0.0059 | 0.0015 | 0.0024 | 0.0039 | 0.0058 | 0.0038 | 0.0088 | 0.0077 | 0.0000 | 0.0026 | 0.0040 | 0.0039 | 0.0053 | 0.0014 | 0.0051 |
| C41 | 0.0026 | 0.0023 | 0.0084 | 0.0070 | 0.0080 | 0.0029 | 0.0068 | 0.0015 | 0.0026 | 0.0037 | 0.0025 | 0.0059 | 0.0069 | 0.0007 | 0.0042 | 0.0088 | 0.0000 | 0.0072 | 0.0006 | 0.0053 | 0.0039 | 0.0006 |
| C42 | 0.0085 | 0.0066 | 0.0065 | 0.0013 | 0.0005 | 0.0090 | 0.0013 | 0.0040 | 0.0014 | 0.0006 | 0.0052 | 0.0004 | 0.0023 | 0.0070 | 0.0074 | 0.0038 | 0.0053 | 0.0000 | 0.0006 | 0.0035 | 0.0082 | 0.0012 |
| C43 | 0.0080 | 0.0088 | 0.0088 | 0.0027 | 0.0006 | 0.0065 | 0.0088 | 0.0098 | 0.0045 | 0.0026 | 0.0059 | 0.0032 | 0.0057 | 0.0044 | 0.0046 | 0.0095 | 0.0015 | 0.0077 | 0.0000 | 0.0026 | 0.0059 | 0.0014 |
| C44 | 0.0071 | 0.0013 | 0.0053 | 0.0006 | 0.0051 | 0.0091 | 0.0082 | 0.0041 | 0.0026 | 0.0082 | 0.0039 | 0.0019 | 0.0006 | 0.0026 | 0.0073 | 0.0040 | 0.0084 | 0.0025 | 0.0036 | 0.0000 | 0.0013 | 0.0005 |
| C45 | 0.0022 | 0.0005 | 0.0005 | 0.0033 | 0.0020 | 0.0038 | 0.0047 | 0.0013 | 0.0049 | 0.0020 | 0.0005 | 0.0004 | 0.0012 | 0.0012 | 0.0081 | 0.0064 | 0.0077 | 0.0078 | 0.0011 | 0.0047 | 0.0000 | 0.0011 |
| C46 | 0.0073 | 0.0024 | 0.0006 | 0.0014 | 0.0050 | 0.0059 | 0.0014 | 0.0075 | 0.0041 | 0.0006 | 0.0085 | 0.0019 | 0.0054 | 0.0006 | 0.0058 | 0.0006 | 0.0071 | 0.0072 | 0.0082 | 0.0024 | 0.0071 | 0.0000 |
Table A5.
Direct Effect Matrix of Path Effect Blur Based on MultiMOORA.
Table A5.
Direct Effect Matrix of Path Effect Blur Based on MultiMOORA.
| C11 | C12 | C13 | C14 | C15 | C21 | C22 | C23 | C24 | C25 | C26 | C31 | C32 | C33 | C34 | C35 | C41 | C42 | C43 | C44 | C45 | C46 | |
|---|---|---|---|---|---|---|---|---|---|---|---|---|---|---|---|---|---|---|---|---|---|---|
| P1 | H | L | VL | H | VL | H | H | VH | VH | M | H | M | H | EH | H | VL | L | M | H | H | L | L |
| P2 | VH | H | M | M | VH | VH | VL | L | VL | VH | VL | M | VH | M | M | H | H | VL | H | L | VL | H |
| P3 | M | EH | VH | L | VH | EH | L | VL | EL | L | H | VL | H | M | VL | M | L | M | M | H | M | L |
| P4 | VL | VH | L | VH | L | VL | L | VH | VL | L | VH | EL | VL | H | M | L | VL | H | VL | VL | H | H |
| P5 | M | VH | VL | VH | VH | VH | VH | VH | H | VL | L | VH | H | L | VH | VH | M | VH | VH | M | M | EL |
| P6 | M | L | H | H | H | M | H | VH | VH | L | M | VL | L | M | VH | VH | L | H | M | EH | L | L |
| P7 | VL | M | M | H | VL | M | M | H | H | VH | H | L | M | L | VL | H | H | H | VH | M | H | H |
Table A6.
Path Effect Clarity Values Based on MultiMOORA.
Table A6.
Path Effect Clarity Values Based on MultiMOORA.
| C11 | C12 | C13 | C14 | C15 | C21 | C22 | C23 | C24 | C25 | C26 | C31 | C32 | C33 | C34 | C35 | C41 | C42 | C43 | C44 | C45 | C46 | |
|---|---|---|---|---|---|---|---|---|---|---|---|---|---|---|---|---|---|---|---|---|---|---|
| P1 | 0.0435 | 0.0234 | 0.0142 | 0.0435 | 0.0142 | 0.0435 | 0.0435 | 0.0527 | 0.0527 | 0.0334 | 0.0435 | 0.0334 | 0.0435 | 0.0602 | 0.0435 | 0.0142 | 0.0234 | 0.0334 | 0.0435 | 0.0435 | 0.0234 | 0.0234 |
| P2 | 0.0527 | 0.0435 | 0.0334 | 0.0334 | 0.0527 | 0.0527 | 0.0142 | 0.0234 | 0.0142 | 0.0527 | 0.0142 | 0.0334 | 0.0527 | 0.0334 | 0.0334 | 0.0435 | 0.0435 | 0.0142 | 0.0435 | 0.0234 | 0.0142 | 0.0435 |
| P3 | 0.0334 | 0.0602 | 0.0527 | 0.0234 | 0.0527 | 0.0602 | 0.0234 | 0.0142 | 0.0067 | 0.0234 | 0.0435 | 0.0142 | 0.0435 | 0.0334 | 0.0142 | 0.0334 | 0.0234 | 0.0334 | 0.0334 | 0.0435 | 0.0334 | 0.0234 |
| P4 | 0.0142 | 0.0527 | 0.0234 | 0.0527 | 0.0234 | 0.0142 | 0.0234 | 0.0527 | 0.0142 | 0.0234 | 0.0527 | 0.0067 | 0.0142 | 0.0435 | 0.0334 | 0.0234 | 0.0142 | 0.0435 | 0.0142 | 0.0142 | 0.0435 | 0.0435 |
| P5 | 0.0334 | 0.0527 | 0.0142 | 0.0527 | 0.0527 | 0.0527 | 0.0527 | 0.0527 | 0.0435 | 0.0142 | 0.0234 | 0.0527 | 0.0435 | 0.0234 | 0.0527 | 0.0527 | 0.0334 | 0.0527 | 0.0527 | 0.0334 | 0.0334 | 0.0067 |
| P6 | 0.0334 | 0.0234 | 0.0435 | 0.0435 | 0.0435 | 0.0334 | 0.0435 | 0.0527 | 0.0527 | 0.0234 | 0.0334 | 0.0142 | 0.0234 | 0.0334 | 0.0527 | 0.0527 | 0.0234 | 0.0435 | 0.0334 | 0.0602 | 0.0234 | 0.0234 |
| P7 | 0.0142 | 0.0334 | 0.0334 | 0.0435 | 0.0142 | 0.0334 | 0.0334 | 0.0435 | 0.0435 | 0.0527 | 0.0435 | 0.0234 | 0.0334 | 0.0234 | 0.0142 | 0.0435 | 0.0435 | 0.0435 | 0.0527 | 0.0334 | 0.0435 | 0.0435 |
Appendix B
Sections (1)–(3) present a detailed derivation and computation of the OWA aggregation method. Table A5 provides the aggregated fuzzy direct-influence matrix used for path effects. This matrix serves as the underlying dataset for the MultiMOORA analysis and allows a comprehensive assessment of the correlations and interactions between alternative path schemes and the associated impact indicators.
- (1)
- OWA weighted aggregation equation
The OWA operator aggregates HFLTSs by ordering the elements of each HFLTS and applying a weighted average. The weights are computed according to the following equation:
where denotes the element of {()} after sorting according to a given criterion, i.e., ; is the associated weight vector satisfying and . Here is the total number of elements across all HFLTSs. The OWA operator transforms multiple HFLTSs into a collective preference value by aggregating expert opinions according to the assigned weights.
- (2)
- Weight computation equation
The weights for the OWA operator are computed using a normal (Gaussian) distribution method. This method minimizes the influence of unfair parameters on the decision result and assigns lower weights to erroneous or biased parameters. The weight for the position is calculated by
where is the weight vector of the OWA operator, is the mean of the set , and is the standard deviation of that set, reflecting the concentration and dispersion of the number of elements in the HFLTSs.
- (3)
- Computation of the mean and standard deviation
The mean and the standard deviation are obtained as follows:
Sections (4)–(6) provide the detailed derivations and formulae of the MultiMOORA method.
- (4)
- Ratio system method
The ratio system method aggregates the utility of each path alternative by computing the weighted sums of benefit (efficiency) and cost indicators. The raw data for each indicator are normalized using
where denotes the raw score of alternative on indicator , and denotes the normalized score. Let denote the set of benefit (efficiency) indicators and denote the set of cost indicators. Let be the vector of weights corresponding to the indicators. The utility value for alternative is then computed as
where the first term is the weighted sum over benefit indicators and the second term is the weighted sum over cost indicators.
- (5)
- Reference point calculation
For cost indicators the reference point is the minimum value, whereas for benefit indicators it is the maximum value. The reference point is defined as
Subsequently, the distance between each alternative and the reference point is calculated. The distance is defined as
where denotes the maximum deviation of alternative from the reference point. The smaller the value of , the closer the alternative is to the ideal reference point and the better its ranking.
- (6)
- Full multiplicative form
The full multiplicative form computes the utility of a path alternative by the ratio of the weighted product of benefit indicators to the weighted product of cost indicators. The utility value is given by
where denotes the utility of the alternative. The larger the value of , the better the corresponding alternative. This equation thus compares the weighted product of benefit indicators with the weighted product of cost indicators.
Appendix C
This appendix demonstrates the impact of varying indicator weights on pre-selected paths. Figure A1 presents sensitivity analyses of path rankings based on variations in the weights of 22 indicators. Specifically, Path 1 through Path 7 correspond to seven distinct pre-selected paths. Each chart illustrates how the rankings of these paths shift as the weight of each indicator varies from 0% to 100%. The following charts visually demonstrate these changes, illustrating the sensitivity of path rankings to variations in indicator weights.


Figure A1.
Path Ranking Sensitivity Analysis.
References
- Martinez, A.; Iglesias, G. Global Wind Energy Resources Decline under Climate Change. Energy 2024, 288, 129765. [Google Scholar] [CrossRef]
- Shao, T.; Peng, T.; Zhu, L.; Lu, Y.; Wang, L.; Pan, X. China’s Transportation Decarbonization in the Context of Carbon Neutrality: A Segment-Mode Analysis Using Integrated Modelling. Environ. Impact Assess. Rev. 2024, 105, 107392. [Google Scholar] [CrossRef]
- Chen, Z.; Li, C. Energy Emergency Scheduling under Extreme Weather Events: A Novel Emergency Scheduling Method Based on the Improved Supernetwork. Energy 2025, 322, 135491. [Google Scholar] [CrossRef]
- Xu, S.; Zhao, R.; Wang, X.; Yang, F.; Zhang, P. Analysis on Low-Carbon Development Path of Coal-Fired Power Generation Industry. Clean Coal Technol. 2023, 29, 83–94. [Google Scholar]
- Shen, M.; Hou, Y.; Liang, K.; Zhu, W.; Chong, C.; Bin, Y.; Zhou, X.; Ma, L. Energy-System Characteristic Shifts and Their Quantitative Impacts on China’s Co2 Trajectory: Evidence from a High-Resolution Energy Allocation Analysis–Lmdi Sectoral Decomposition. Energy 2025, 335, 137905. [Google Scholar] [CrossRef]
- Si, T.; Huang, Q.; Yang, Y.; Ma, P.; Lei, X.; Li, S. Advancements and Future Outlook in Fundamental Research and Technological Applications for Ammonia Co-Firing with Coal. J. China Coal Soc. 2024, 49, 2876–2886. [Google Scholar]
- Li, T.; Du, P.; Wang, X.-P.; Su, C. Rural Energy Transition in the Context of Rural Revitalization and Carbon Neutrality: Improved Multi-Criteria-Based Decision-Making. Mitig. Adapt. Strateg. Glob. Change 2024, 29, 36. [Google Scholar] [CrossRef]
- Li, Y.; Zhang, K.; Mu, B.; Mo, X. The Long-Term Effects of Transformation and Upgrading Policies on the Market Performance of China’s Coal-Fire Power Generation Industry. Mitig. Adapt. Strateg. Glob. Change 2024, 29, 68. [Google Scholar] [CrossRef]
- Woodard, D.L.; Snyder, A.; Lamontagne, J.R.; Tebaldi, C.; Morris, J.; Calvin, K.V.; Binsted, M.; Patel, P. Scenario Discovery Analysis of Drivers of Solar and Wind Energy Transitions through 2050. Earth’s Future 2023, 11, e2022EF003442. [Google Scholar] [CrossRef]
- Weng, X.; Yang, X.; Guo, Y.; Zhang, W. Life Cycle Assessment and Optimization Analysis of the Hydrogen-Integrated Industrial Park Energy System. Energy Fuels 2025, 39, 18980–18994. [Google Scholar] [CrossRef]
- Yang, F.; Yang, X.; Li, X. China’s Diverse Energy Transition Pathways toward Carbon Neutrality by 2060. Sustain. Prod. Consum. 2024, 47, 236–250. [Google Scholar] [CrossRef]
- Zhi, Z.; Zhou, M.; Yuan, B.; Guo, Z.; Wu, Z.; Li, G. Multipath Retrofit Planning Approach for Coal-Fired Power Plants in Low-Carbon Power System Transitions: Shanxi Province Case in China. Energy 2023, 275, 127502. [Google Scholar]
- Bai, X.; Fan, Y.; Hou, J.; Liu, Y. A Comprehensive Evaluation Method for Reliability Confidence Capacity of Renewable Energy Based on Improved Dematel-Ahp-Ewm. J. Electr. Eng. Technol. 2024, 19, 1205–1216. [Google Scholar]
- Wang, Y.; Li, M.; Sun, L.; Liu, J.; Wang, Y. Resilience Factors and Mechanisms in the Coal Power Supply Chain: A Quantitative Analysis Using Fuzzy Dematel, Ism, and Anp Methods. PLoS ONE 2025, 20, e0322952. [Google Scholar]
- Abhishek, K.; Sah, B.; Singh, A.R.; Deng, Y.; He, X.; Kumar, P.; Bansal, R.C. A Review of Multi Criteria Decision Making (Mcdm) Towards Sustainable Renewable Energy Development. Renew. Sustain. Energy Rev. 2017, 69, 596–609. [Google Scholar] [CrossRef]
- Cai, J.; Xiao, Y.; Wang, Y.; Cai, R. A Six-Stage Evaluation Model for Optimizing Urban Ev Charging and Swapping Station Locations. Sustain. Cities Soc. 2025, 125, 106342. [Google Scholar] [CrossRef]
- Ahiase, G.; Nugraha, N.; Andriana, D.; Sari, M. Digital Financial Inclusion and Environmental Sustainability in Africa: The Moderating Effect of Income Inequality. Manag. Environ. Qual. Int. J. 2024, 35, 1671–1690. [Google Scholar] [CrossRef]
- Liang, Y.; Li, Y.-C.; Yu, M.; He, Y. A Stackelberg Game-Based Electric Carbon Market Trading Mechanism for Shared Energy Storage Considering Carbon Capture, Utilization, and Storage. In Proceedings of the 2024 IEEE 22nd International Conference on Industrial Informatics (INDIN), Beijing, China, 18–20 August 2024. [Google Scholar]
- Bai, W.; Zhang, L.; Lu, S.; Ren, J.; Zhou, Z. Sustainable Energy Transition in Southeast Asia: Energy Status Analysis, Comprehensive Evaluation and Influential Factor Identification. Energy 2023, 284, 128670. [Google Scholar] [CrossRef]
- Maja, M.-B.; Srdjan, V.; Petar, G. Optimization of Energy Mix and Possibilities of Its Application in Energy Transition Using Multi-Criteria Decision Making Approach. Therm. Sci. 2023, 27, 2501–2512. [Google Scholar]
- Meir, A.; Hadden, J.; Su, M. Public Opposition to Coal-Fired Power in Emerging Economies. Energy Policy 2025, 203, 114595. [Google Scholar] [CrossRef]
- Li, W.; Liu, S.; Lu, C. An Evaluation Concentrated on Post-Peak Carbon Trend Scenarios Designing and Carbon Neutral Pathways in Hebei Province, China. J. Clean. Prod. 2024, 441, 140952. [Google Scholar] [CrossRef]
- Malgorzata, W.-M.; Fulghum, N.; Jones, D. Global Electricity Review 2024; Ember Energy: London, UK, 2024. [Google Scholar]
- Wang, H.; Yan, Y.; Li, Z.; Cao, Z.; Fu, Y.; Zhou, Z.; Zhao, D. Carbon Mitigation Potential and Economic Benefits of Biomass Co-Firing in Coal-Fired Power Plants: A Case Study in Nanjing, China. Energy 2025, 314, 134262. [Google Scholar] [CrossRef]
- Wang, X.; Lo, K. Just Transition: A Conceptual Review. Energy Res. Soc. Sci. 2021, 82, 102291. [Google Scholar] [CrossRef]
- Davarpanah, A. Comparative Evaluation of Carbon Capture, Utilization, and Storage (Ccus) Technologies Using Multi-Criteria Decision-Making Approaches. ACS Sustain. Chem. Eng. 2024, 12, 9498–9510. [Google Scholar] [CrossRef]
- Wang, S.; Fang, J.; Wu, J.; Liang, Y.; Ai, X.; Cui, S.; Liu, J.; Zhou, Y.; Gan, W.; Li, M.; et al. Event-Triggered Security-Constrained Energy Management Scheme on Shared Transmission Systems for Renewable Fuels and Refined Oil: Implementation and Field Tests in South China. Appl. Energy 2025, 389, 125727. [Google Scholar] [CrossRef]
- Rueb, D. Measuring the Poverty Effects of a Carbon Tax on Mobility–but How? Ecol. Econ. 2026, 239, 108788. [Google Scholar] [CrossRef]
- Hong, Y.; Jiang, X.; Xu, H.; Yu, C. The Impacts of China’s Dual Carbon Policy on Green Innovation: Evidence from Chinese Heavy-Polluting Enterprises. J. Environ. Manag. 2024, 350, 119620. [Google Scholar] [CrossRef]
- Zhao, X.-G.; Hu, S.; Wang, H.; Chen, H.; Zhang, W.; Lu, W. Energy, Economic, and Environmental Impacts of Electricity Market-Oriented Reform and the Carbon Emissions Trading: A Recursive Dynamic Cge Model in China. Energy 2024, 298, 131416. [Google Scholar] [CrossRef]
- Büyüközkan, G.; Karabulut, Y.; Göçer, F. Spherical Fuzzy Sets Based Integrated Dematel, Anp, Vikor Approach and Its Application for Renewable Energy Selection in Turkey. Appl. Soft Comput. 2024, 158, 111465. [Google Scholar] [CrossRef]
- Karadag, M.; Gul, M.; Yucesan, M.; Ortiz-Barrios, M.; Ishizaka, A.; Khan, J. Evaluation of Green Deal Compliance Performance with a Hybrid Comparative Multi-Attribute Decision Model. Socio-Econ. Plan. Sci. 2025, 98, 102163. [Google Scholar] [CrossRef]
- Fan, J.; Hao, G.; Wu, M. A Bipolar Complex Fuzzy Critic-Electre Iii Approach Using Einstein Averaging Aggregation Operators for Enhancing Decision Making in Renewable Energy Investments. Int. J. Fuzzy Syst. 2024, 26, 2359–2369. [Google Scholar] [CrossRef]
- Seikh, M.R.; Chatterjee, P. Sustainable Strategies for Electric Vehicle Adoption: A Confidence Level-Based Interval-Valued Spherical Fuzzy Merec-Vikor Approach. Inf. Sci. 2025, 699, 121814. [Google Scholar] [CrossRef]
- Dong, J.; Liu, D.; Liu, Y.; Huo, H.; Dou, X.; Bao, A. Trading Performance Evaluation for Traditional Power Generation Group Based on an Integrated Matter-Element Extension Cloud Model. Energy Rep. 2021, 7, 3074–3089. [Google Scholar] [CrossRef]
- Trivedi, A.; Trivedi, V.; Singh, R. Road to Decarbonization: Navigating India’s Green Hydrogen Transition Challenges through Grey Dematel. J. Clean. Prod. 2025, 486, 144502. [Google Scholar] [CrossRef]
- Ecer, F. A Consolidated Mcdm Framework for Performance Assessment of Battery Electric Vehicles Based on Ranking Strategies. Renew. Sustain. Energy Rev. 2021, 143, 110916. [Google Scholar] [CrossRef]
- Wang, X.; Wang, L.; Chen, X.; Ning, R.; Zhou, J. Joint Optimization of Protection Adjustment and Preventive Maintenance Policies for Multi-State Self-Healing Systems with Protective Devices in a Shock Environment. Reliab. Eng. Syst. Saf. 2026, 269, 112000. [Google Scholar] [CrossRef]
- Darpan, D.; Ahmad, S.; Kirshner, J. Opportunities and Challenges Associated with the Uptake of Residential Clean Fuel Usage. Curr. Environ. Health Rep. 2024, 11, 204–209. [Google Scholar]
- Raza, M.Y.; Lin, B. Renewable Energy Substitution and Energy Technology Impact in a Transitional Economy: A Perspective from Pakistan. J. Clean. Prod. 2022, 360, 132163. [Google Scholar] [CrossRef]
- Shang, W.-L.; Lv, Z. Low Carbon Technology for Carbon Neutrality in Sustainable Cities: A Survey. Sustain. Cities Soc. 2023, 92, 104489. [Google Scholar] [CrossRef]
- Wang, T.; Li, R.; Zhang, Q.; Sun, S. Digitalization and Urban Carbon Emissions: Unraveling the Mechanisms of Agglomeration Economics. J. Environ. Manag. 2025, 387, 125855. [Google Scholar] [CrossRef]
- Metallidou, C.; Psannis, K.E.; Vergados, D.D.; Dossis, M. Digital Twin and Industrial Internet of Things Architecture to Reduce Carbon Emissions. In Proceedings of the 2022 4th International Conference on Computer Communication and the Internet (ICCCI), Chiba, Japan, 1–3 July 2022. [Google Scholar]
- Mohamed, A.; Mathieu, G.; Guillaume, P. Does Climate Policy Uncertainty Shape the Response of Stock Markets to Oil Price Changes? Evidence from Gcc Stock Markets. J. Environ. Manag. 2025, 375, 124229. [Google Scholar] [CrossRef]
- Qian, R.; Bajuri, N.H.; Umair, M.; Adam, N.A.; Ullah, Z. China’s Renewable Reformation: Financial Dynamics in the Age of Hydrogen Energy and Green Financing Transformation. Int. J. Hydrogen Energy 2025, 121, 351–360. [Google Scholar] [CrossRef]
- Li, Y.; Bai, B. Dynamic Reconfiguration of Active Distribution Network Considering Electric Vehicle Charging Demand under Real-Time Electricity Price. In Proceedings of the 4th International Conference on Information Science, Electrical and Automation Engineering, Wuhan, China, 24–26 March 2023. [Google Scholar]
- Dugo, V.; Gálvez-Ruiz, D.; Díaz-Cuevas, P. The Sustainable Energy Development Dilemma in European Countries: A Time-Series Cluster Analysis. Energy Sustain. Soc. 2025, 15, 36. [Google Scholar] [CrossRef]
- Mirzania, P.; Gordon, J.A.; Balta-Ozkan, N.; Sayan, R.C.; Marais, L. Barriers to Powering Past Coal: Implications for a Just Energy Transition in South Africa. Energy Res. Soc. Sci. 2023, 101, 103122. [Google Scholar] [CrossRef]
- Geisendorf, S.; Klippert, C. The Effect of Green Investments in an Agent-Based Climate-Economic Model. Environ. Model. Assess. 2017, 22, 323–343. [Google Scholar] [CrossRef]
- Kizilcec, V.; Parikh, P. Solar Home Systems: A Comprehensive Literature Review for Sub-Saharan Africa. Energy Sustain. Dev. 2020, 58, 78–89. [Google Scholar] [CrossRef]
- Liu, H.; Du, Z.; Xue, T.; Jiang, T. Enhancing Smart Building Performance with Waste Heat Recovery: Supply-Side Management, Demand Reduction, and Peak Shaving Via Advanced Control Systems. Energy Build. 2025, 327, 115070. [Google Scholar] [CrossRef]
- Cheng, L.; Peng, P.; Lu, W.; Sun, J.; Wu, F.; Shi, M.; Yuan, X.; Chen, Y. The Evolutionary Game Equilibrium Theory on Power Market Bidding Involving Renewable Energy Companies. Int. J. Electr. Power Energy Syst. 2025, 167, 110588. [Google Scholar] [CrossRef]
- Churchman, P.; Pangbourne, K.; Dekker, T.; Rodrigues, V.S. Purposive Transition Governance for Road Freight Decarbonization. Transp. Policy 2025, 172, 103771. [Google Scholar] [CrossRef]
- Li, T.; Yan, D.; Lv, Y. Complexity of Reverse Supply Chain Pricing Game Model Based on Recycler Heterogeneity Behavior. Int. J. Bifurc. Chaos 2022, 32, 2250033. [Google Scholar] [CrossRef]
- Yan, J.; Yan, H.; Liu, L. Assessment of Carbon Neutrality Pathways Based on the Topsis Method. Sci. Res. Manag. 2025, 46, 169–181. [Google Scholar]
- Deng, X.; Huang, Y.; Fu, W.; Liang, X. Corporate Digital Transformation and Carbon Mitigation: Chain Effects and Evidence from China. Int. J. Prod. Econ. 2025, 109740. [Google Scholar] [CrossRef]
- Ismer, R.; van Asselt, H.; Haverkamp, J.; Mehling, M.; Neuhoff, K.; Pirlot, A. Supporting the Transition to Climate-Neutral Production: An Evaluation under the Agreement on Subsidies and Countervailing Measures. J. Int. Econ. Law 2023, 26, 216–232. [Google Scholar] [CrossRef]
- Cai, C.; Zhao, R.; Xiao, L.; Xie, Z.; Feng, M.; Ji, J.; Xiao, Q. Carbon Budget Estimation and Predictions of Carbon Emission Peak and Carbon Neutrality at Provincial Level in China. Resour. Environ. Yangtze Basin 2024, 33, 2713–2726. [Google Scholar]
- Wang, J.; Wang, J. “Booster” or “Obstacle”: Can Digital Transformation Improve Energy Efficiency? Firm-Level Evidence from China. Energy 2024, 296, 131101. [Google Scholar] [CrossRef]
- Bai, H.; Chen, Y.; Bai, H.; Liu, M.; Fan, Y. Energy Optimization and Efficiency Improvement Model for Enterprise Production Process Based on Deep Learning under the Background of Carbon Peak and Carbon Neutrality. Int. J. Comput. Intell. Syst. 2025, 18, 169. [Google Scholar] [CrossRef]
- Chen, Y.; Ma, X.; Ma, X.; Shen, M.; Chen, J. Does Green Transformation Trigger Green Premiums? Evidence from Chinese Listed Manufacturing Firms. J. Clean. Prod. 2023, 407, 136858. [Google Scholar] [CrossRef]
- Zhang, Q.; Hu, Z.; Zhang, Z.; Zhao, R. Carbon Emission and Idiosyncratic Risk: Role of Environmental Regulation and Disclosure. Int. Rev. Financ. Anal. 2025, 105, 104419. [Google Scholar] [CrossRef]
- Lan, H.; Li, R.; Wang, L.; Yang, S. Research on the Relationship between Carbon Emissions and Resilience of Resource-Based Cities: Taking Liaoning Province, China as an Example. Pol. J. Environ. Stud. 2025, 34, 2497–2511. [Google Scholar] [CrossRef]
- Qin, J.; Liu, X.; Pedrycz, W. An Extended Todim Multi-Criteria Group Decision Making Method for Green Supplier Selection in Interval Type-2 Fuzzy Environment. Eur. J. Oper. Res. 2017, 258, 626–638. [Google Scholar] [CrossRef]
- Du, P.; Wang, X.; Li, T.; Su, C.; Li, Z. Resilience Analysis of Mine Ventilation Cyber-Physical Fusion System. J. Supercomput. 2024, 81, 51. [Google Scholar] [CrossRef]
- Praharaj, M.; Mohan, B.M. Modeling and Analysis of Mamdani Two-Term Controllers Using Non-Uniformly Distributed Multiple Fuzzy Sets and Coa/Cog Defuzzification. IETE Tech. Rev. 2022, 39, 918–939. [Google Scholar] [CrossRef]
- Xie, J.; Wu, B.; Zou, W. Ordered Weighted Utility Distance Operators and Their Applications in Group Decision-Making. Appl. Soft Comput. 2024, 150, 111016. [Google Scholar] [CrossRef]
- Wu, J.; Pu, C.; Ding, S.; Cao, G.; Xia, C.; Pardalos, P.M. Multi-Objective Optimization of Transport Processes on Complex Networks. IEEE Trans. Netw. Sci. Eng. 2023, 10, 780–794. [Google Scholar] [CrossRef]
- Dahooie, J.H.; Raafat, R.; Qorbani, A.R.; Daim, T. Data-Driven Decision-Making to Rank Products According to Online Reviews and the Interdependencies among Product Features. IEEE Trans. Eng. Manag. 2024, 71, 9150–9170. [Google Scholar] [CrossRef]
- Yang, B.; Zhao, J.; Zhao, H. A Robust Method for Avoiding Rank Reversal in the Topsis. Comput. Ind. Eng. 2022, 174, 108776. [Google Scholar] [CrossRef]
Disclaimer/Publisher’s Note: The statements, opinions and data contained in all publications are solely those of the individual author(s) and contributor(s) and not of MDPI and/or the editor(s). MDPI and/or the editor(s) disclaim responsibility for any injury to people or property resulting from any ideas, methods, instructions or products referred to in the content. |
© 2026 by the authors. Licensee MDPI, Basel, Switzerland. This article is an open access article distributed under the terms and conditions of the Creative Commons Attribution (CC BY) license.