Abstract
Wind and sand pose a significant threat to operational safety along the route of the Golmud-Korla Railway. To combat the adverse effects of these hazards, numerous sand retaining dikes and sand intercepting ditches have been constructed along the railway corridor. However, the deposition and erosion mechanisms of sand particles in close proximity to these structures have yet to be fully investigated. Therefore, it uses numerical simulations to study the structure of the wind-sand flow field around the sand retaining dike and the sand intercepting ditch, under varying spacing conditions, with an analysis of sand deposition and erosion laws. The results indicate that vortices form on the leeward side and within the sand intercepting ditch. Among these, the vortex flow occurring on the downstream side of the sand retaining dike exhibits a flow reattachment phenomenon at specific locations (i.e., attachment points). As the spacing increases, clockwise vortices Rd1 and Rd2, develop on the leeward side and inside the ditch, respectively. The leeward side of the spacing range of 0–8H is characterized by reverse erosion and deposition processes. When the spacing is 10–15H, a forward erosion zone emerges and expands progressively with the increase in spacing. When the spacing exceeds 10H, i.e., as the sand intercepting ditch is positioned downstream of the vortex reattachment point of the sand retaining dike, its sand interception efficiency is markedly enhanced. It not only elucidates the wind-sand flow and deposition patterns surrounding sand retaining dike and sand intercepting ditch under various spacing configurations but also offers valuable insights for the future design and implementation of protective structures for railways in wind-sand affected regions.
1. Introduction
In recent years, driven by the ongoing Belt and Road Initiative, transportation infrastructure in western China has undergone rapid development [1]. With the deepening implementation of the initiative, the region has set a strategic goal of establishing a modern integrated transport system, particularly emphasizing the expansion of high-speed railway networks into border areas. The accelerated advancement of these strategic infrastructure projects has not only significantly improved regional transportation but also effectively promoted the optimization and upgrading of the industrial structure in the western region, thereby providing substantial momentum for high-quality economic development in the area.
However, the distinctive natural environment of the western region, particularly the frequent occurrence of sandstorms [2], presents considerable challenges to the construction and operation of transportation infrastructure, especially railway systems [3]. For example, in recent years, numerous newly constructed railways, including the Lanzhou-Xinjiang High-Speed Railway, the Golmud-Korla Railway, and the Ruohe Railway, have repeatedly been interrupted by sandstorms, leading to damage of track structures, operational disruptions, and severely compromising the stability and safety of regional transportation [4,5,6]. Consequently, the mitigation and management of sandstorm-related hazards have emerged as essential protective measures for railway engineering and service continuity in the western region, bearing substantial significance for the long-term sustainable development of the local economy [7,8] (Figure 1).
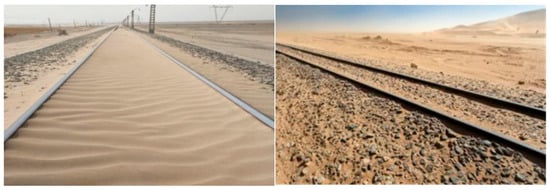
Figure 1.
Impact of wind and sand disasters on railways.
To safeguard railway systems from aeolian sand hazards, wind and sand control measures are indispensable along the corridors. This field has advanced significantly over decades, driven by continuous innovation and practical application in desert management [9,10,11,12]. In general, approaches to wind and sand mitigation can be broadly classified into three distinct categories: methods involving mechanical processes [13], chemical treatments and biological interventions [14]. In arid desert regions where sandstorms severely impact railway sections, biological control is generally impractical due to climatic constraints. Moreover, chemical methods tend to have substantial adverse effects on the local environment. As a result, mechanical control strategies are frequently implemented. These approaches mainly involve the construction of engineering structures targeted at decelerating aeolian sand movement, resulting in sand particle accumulation within the airflow. Standard mechanical measures include sand retaining dikes [15] and sand fixation structures [16]. The former chiefly comprises tall vertical dikes and sand-intercepting ditches, while the latter employs grass checkerboards, soil checkerboards, and likewise utilizes ditches. The installation and maintenance of tall vertical sand retaining dikes are particularly challenging in the sandstorm-prone northwestern regions, due to constrained transportation infrastructure and a scarcity of local construction materials. Sand retaining dikes and intercepting ditches offer advantages in cost and feasibility, as they utilize local materials and are simpler to build compared to vertical barriers. Vertical barriers, however, pose greater environmental impact and durability concerns. Given these factors, dikes and ditches see extensive and often integrated application in China’s northwestern Gobi and desert areas (Figure 2).
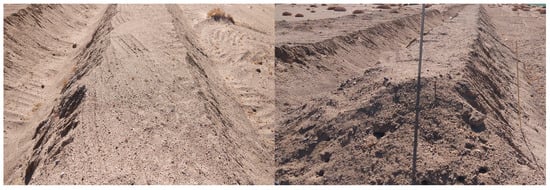
Figure 2.
Schematic diagram of typical sand retention embankments and sand interception ditches along the Golmud-Korla Railway.
Currently, researchers have made certain progress in the investigation of sand retaining dike. Parameters such as barrier height, inclination angle, geometric form, and the related aerodynamics and wind-sand flow dynamics have been the primary focus of prior investigations. Bruno et al. [17] carried out numerical simulation studies on sand retaining dike with various configurations and revealed that the geometric properties of sand retaining dike are closely associated with the mechanisms of wind-sand interaction. Two distinct deposition regimes were identified: one defined by wind velocities below the entrainment threshold for aeolian transport, and the other by particle collisions occurring within the backflow process. McClure et al. [18] argue that to achieve optimal sand protection, it is necessary to consider geometric parameters such as the height, length, thickness, and shape of sand retaining dike, as well as external environmental factors such as the primary wind speed structure, wind direction, and site characteristics of the installation area. Cui et al. [19] conducted numerical simulations of composite sand-blocking measures combining sand retaining dike and sand intercepting ditch based on fluid dynamics principles. It was found that sand-intercepting ditches serve to augment the sand-capture efficiency of retaining dikes. This augmentation is most pronounced under the condition that ditches are installed beyond the embankments’ zone of effective protection. Kim et al. [20] investigated the influence of highway sand retaining dike on the microclimate of the surrounding environment before and after construction, basing on wind tunnel tests and on- to investigate the influence of constructing sand retaining dike on the microclimate (wind speed and temperature) of the surrounding environment before and after construction, thereby providing a reference for the impact of construction in other related fields on the surrounding environment. Shiau and Hsieh [21] studied the flow field changes of embankment models in wind tunnels under different slope conditions and analyzed the effects of pressure components and slope angles on the turbulent Reynolds number.
In addition, considerable advancements have been achieved in the investigation of aeolian sedimentation and erosion mechanisms both domestically and internationally. Zhang et al. [22,23] used numerical simulation methods to establish a prediction model based on the relationship between shear stress on the surface of a sand retaining dike and the critical shear stress of sand particles. Zhang et al. [24] applied numerical simulation to examine the impacting of varying barrier heights and wind velocities on the deposition and erosion patterns of sand particles around bridge abutments (side piers), central piers, and embankments. The findings indicated a more extensive area of sand deposition around the side piers compared to the central piers. Furthermore, accumulation was more pronounced on the downstream face of the embankment than on the upstream face. Horvat et al. [25] carried out a comparative analysis of the performance of various railway substructures and track systems under multiple wind speeds and angles of wind direction. The patterns of sedimentation erosion that they identified were consistent with field observations along desert railway lines. He et al. [26] used CFD fluid dynamics modeling and field observations to study the transport and sedimentation rates of sand particles near bridge piers when sand-retaining dikes are located on the windward and leeward sides of bridges. The literature has predominantly examined how sand-retaining dikes protect infrastructure and how sedimentation occurs around embankments and bridges. In contrast, the erosion and deposition behavior of the dikes and associated intercepting ditches has received less attention.
Although various mechanical sand control measures have achieved certain results in practice, in regions with high sandstorm activity, a single structure often struggles to provide long-term effective protection for railways. Therefore, in engineering practice, sand-catching embankments and sand-catching ditches are frequently deployed in combination to form a complementary composite protection system. However, the coupling mechanism between the internal wind-sand flow field structure and the deposition-erosion processes within this composite system remains poorly understood. This lack of systematic knowledge directly constrains the optimization of the composite protection system’s design and performance enhancement. On the other hand, the prevailing approach is predominantly based on the replacing sand with flow assumption, whereby wind-sand hazard intensity is indirectly inferred from single-phase airflow field parameters. This methodology, however, fails to account for the inherent two-phase nature of wind-sand flow and the associated complex momentum interactions between the solid and gaseous phases. Consequently, it offers limited accurate insight into the dynamic physical mechanisms governing sand deposition and erosion.
Accordingly, this research focuses on a sand-retaining dike and an associated intercepting ditch within the Zhongzaohuo section of the Golmud-Korla Railway. The study aims to systematically analyze variations in wind speed profiles, vorticity, and sand deposition/erosion patterns under different spacing configurations. These insights are intended to establish a theoretical foundation for optimal engineering application, thereby offering scientific and technical guidance for mitigating railway wind-sand disasters in western regions.
2. Research Methods
2.1. Computational Model
2.1.1. Mathematical Model
The numerical simulations in this study were performed using the commercial computational fluid dynamics (CFD) software ANSYS (2021 R1) Fluent. This investigation utilizes a two-dimensional transient formulation of the Reynolds-Averaged Navier–Stokes (RANS) equations, discretized using the finite volume method, for conducting numerical simulations. While the two-dimensional model employed in this study effectively reveals the core flow field structure and sedimentation-erosion patterns within the cross-section, it has inherent limitations. It cannot capture potential three-dimensional flow characteristics present in real wind-sand environments. In the selection of turbulence models, this study employed the realizable k-ε turbulence model. Unlike the standard k-ε model, its incorporation of constraints related to flow rotation and curvature significantly improves the prediction of complex separated flows. This capability is particularly crucial for accurately simulating the vortex zone on the leeward side of the sand-retaining dike and the recirculation zone within the sand-intercepting ditch. However, in extreme cases involving strong three-dimensional effects or highly anisotropic turbulence, the prediction accuracy declines and may fail to accurately capture the true transport of turbulent energy. The model therefore ensures a favorable balance between computational expense and predictive fidelity, justifying its selection [27]. Compared to other models, this model reconstructs the turbulence viscosity calculation formula and, strictly satisfies the physical constraint conditions of Reynolds stress positivity from a mathematical perspective [28]. The core innovation of this model is embodied in three distinct aspects. First, it incorporates a swirl correction factor, which markedly enhances the predictive capability for rotational flows and streamlines with strong curvature. Second, the model reformulates the source term of the ε equation, thereby effectively circumventing the numerical singularities that may occur in conventional models under conditions of low turbulent kinetic energy. Third, it enhances adaptability to complex flows such as separation flows and blunt body flows [29,30,31]. The key feature of this model lies in the fact that it demonstrates a marked advantage in resolving the intense vortex structures formed during flow around bluff bodies, which aligns well with the turbulence modulation effects induced by sand particles in wind-sand transport [32]. While maintaining high computational accuracy, the model also exhibits superior numerical stability and simulation efficiency. The governing equations can be expressed as:
where is the turbulent kinetic energy; is the turbulent kinetic energy dissipation rate; and are the velocity components along the and directions, respectively; and are the fluctuating velocity components along the and directions, respectively; is the kinematic viscosity; is the dynamic viscosity; is the turbulent viscosity, where in this model, and is the eddy viscosity coefficient; is the density; is the turbulent kinetic energy generation term caused by the average velocity gradient; is the magnitude of the average strain rate tensor; is the time strain rate; is the ratio of the average flow time scale to the turbulent time scale; and are empirical constants; and are the Prandtl numbers corresponding to turbulent kinetic energy and its dissipation rate, respectively, with = 1.0 and = 1.2.
In fluid dynamics simulations, the temperature of the surrounding environment is set to 20 °C, and the maximum inflow velocity is specified as 20 m/s. Theoretical analysis confirms that the Mach number remains below the critical threshold of 0.3 under these conditions [33], thereby justifying the adoption of an incompressible fluid model for the research object. The Euler-Euler two-phase flow modeling approach is used to address the problem of representative gas–solid two-phase flow in sand transport. This approach considers the dispersed particle phase as a continuous phase, facilitating an effective representation of the particle phase concentration field and an accurate depiction of the momentum exchange and energy transfer mechanisms between the gas and solid phases [34,35].
Compared to discrete phase models, the Euler-Euler approach exhibits considerable advantages in scenarios with high particle volume fractions (typically > 10%), showing enhanced numerical stability, improved computational efficiency, and more accurate representation of the intricate interactions between the two phases [36]. This characteristic has been corroborated by various experimental studies, such as the wind tunnel validation conducted by Sarafrazi and Talaee [37]. In the model development process, both the gas phase and the sand particle phase are described within the Eulerian framework. By formulating a system of continuous medium equations for each phase and rigorously enforcing the principle of mass conservation, the reliability and validity of the numerical solutions are effectively guaranteed. The fluid flow problem considered in this study adheres to the law of mass conservation.
- Law of conservation of mass:
The gas phase and solid phase are as shown in expressions (5) and (6).
where and are the volume fractions of the gas phase and solid phase, respectively, and ; and are the densities of the gas phase and solid phase, respectively; and are the velocities of the gas phase and solid phase, respectively.
- Momentum conservation equation:
The gas phase and solid phase are as shown in expressions (7) and (8).
where is time, and are the viscous stress tensors of the gas phase and solid phase, respectively; is the shared pressure between the two phases; is the solid phase pressure; is the momentum exchange coefficients of the gas phase and solid phase. J denotes the second-order unit tensor; is the temperature of the dust particle phase; is the radial distribution function; and are the dynamic viscosities of the gas phase and solid phase, respectively. is the collision recovery coefficient of solid particles.
Interphase momentum exchange coefficient : Interphase momentum transfer is primarily achieved through drag forces, employing the Gidaspow hybrid drag model. Given that the sand particle volume fraction in this study is set at 0.01, a classical model suitable for such conditions will be adopted. Drag forces are calculated using the Stokes drag equation:
When Rep > 1, the drag force FD is expressed using the standard drag formula as:
In the equation: is the dynamic viscosity coefficient of the fluid; U is the tensor component of the gas; Us is the tensor component of the sand particle velocity. is the kinematic viscosity coefficient of the gas. represents the separation occurring when flow around an object becomes detached .
The geometric characteristics of the sand retaining dike and the sand intercepting ditch were defined based on findings from previous relevant studies [38,39]. The sand retaining dike was set to a height of 1.5 m, the slope ratio (SR) was specified as 1:1.5 (approximately 33°41′ slope), and the crest width was set to 1 m. The depth of the sand intercepting ditch was set to 1.5 m, with a gradient of 1:1.5 and a toe width of 1 m. The geometric configurations of the sand retaining dike and the sand intercepting ditch employed in the model are illustrated in Figure 3a,b. In the process of developing a model, it is particularly important to determine the dimensions of the computational domain, as this directly affects the accuracy of the simulation results and the computational efficiency. Through comparative simulations using multiple sets of different basin dimensions, and by achieving a balance between solution accuracy and computational resource consumption, the optimal size of the computational domain was finally established as 100 m (length) × 40 m (height). The horizontal separation from the inlet boundary to the toe of the windward slope of the sand retaining dike was designated as 20 m, with the complete computational domain depicted in Figure 3c. To further explore the influence of spacing between the sand retaining dike and the sand intercepting ditch, seven spacing scenarios were established in this study: 0, 3H, 5H, 8H, 10H, 12H, and 15H, the height of the sand retaining dike is denoted by H.
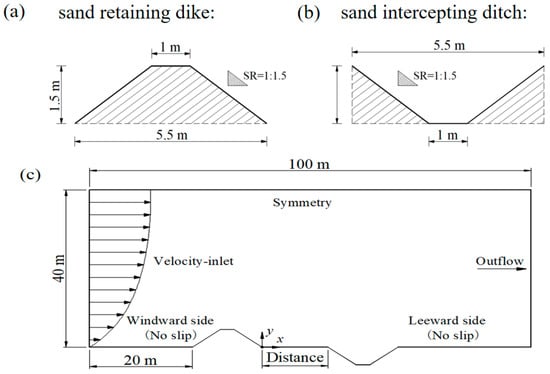
Figure 3.
Schematic diagram of geometric structure and computational domain: (a) geometric structure of sand retaining dike; (b) geometric structure of sand intercepting ditch. (c) overall computational domain layout.
The boundary conditions for the calculation area are specified in Table 1. A velocity inlet is designated at the left boundary, while the right boundary employs a fully developed flow outflow condition. A symmetric boundary condition is assigned to the top boundary, while the bottom boundary is modeled as a no-slip solid wall. Regarding the wind velocity configuration, in accordance with atmospheric boundary layer theory, the logarithmic wind profile is precisely modeled using the User-defined functions (UDF) functionality, with the corresponding mathematical formulation provided as:
where is the height from the surface is the velocity; is the friction wind speed; is the von Karman coefficient, taken as = 0.4; is the aerodynamic roughness length, taken as 0.003 m [40].

Table 1.
Model boundary condition settings.
2.1.2. Numerical Methods
An unstructured mesh was employed for model discretization. Given the critical influence of mesh quality and density on CFD results, a comprehensive mesh independence study was performed to verify the reliability and accuracy of the simulations. The following strategies were implemented for mesh refinement: ten boundary layer mesh layers were applied to the bottom wall surface, a growth rate of 1.1 was used for the boundary layer, and local mesh refinement was applied in key regions such as the sand retaining dike and sand intercepting ditch. An unstructured mesh with gradual refinement was employed across the entire computational domain. As illustrated in Figure 4, six distinct mesh densities were selected, corresponding to grid counts of 0.4, 0.9, 1.8, 4.7, 18.3, and 40.8 × 10⁴. During the validation process, wind velocity measurements at cross-sections located at x = 15 m and y = 0.5, 1, 2, 5, and 10 m were employed as reference data for the grid independence verification [41]. As observed in the figure, wind velocities at 5 m and 10 m height demonstrate minimal variation, whereas those at 0.5 m, 1 m, and 2 m exhibit considerable fluctuations. These variations diminish when the grid cell count reaches 18.3 × 10⁴, suggesting that the mesh resolution at this level is sufficient to meet the required computational accuracy. Consequently, the 18.3 × 10⁴ grid configuration was adopted as the final mesh scheme for the subsequent numerical simulations. A quantitative grid-independence study was conducted using the flow velocity at the characteristic leeward point P5 as the monitoring variable. As presented in Table 2, the computed velocity exhibited noticeable variation as the grid number increased from 0.4 × 10⁴ to 18.3 × 10⁴, beyond which it stabilized. Further mesh refinement to 40.8 × 10⁴ resulted in changes below 0.1%, indicating that grid independence was achieved at 18.3 × 10⁴ cells. Consequently, this grid configuration was deemed sufficient to ensure solution accuracy while maintaining reasonable computational expense, and was employed for all subsequent numerical simulations. Figure 5a presents the overall grid distribution, while Figure 5b,c illustrate the mesh refinement near the sand retaining dike and sand intercepting ditch. It is evident that the grid density in key regions has been substantially increased, thereby ensuring the precision of flow feature resolution in the near-wall area.
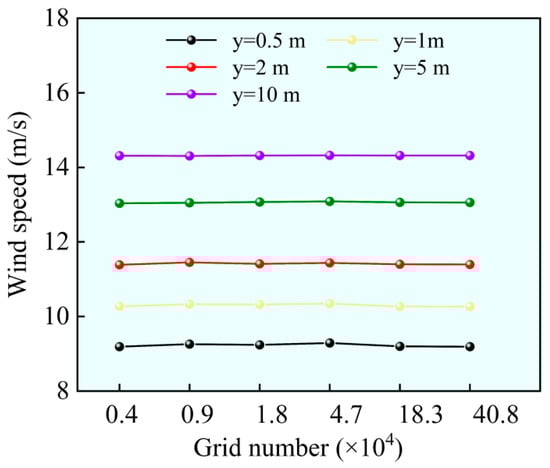
Figure 4.
Grid independence verification.
Table 2.
P5 Point Velocity Variation with Mesh Refinement.
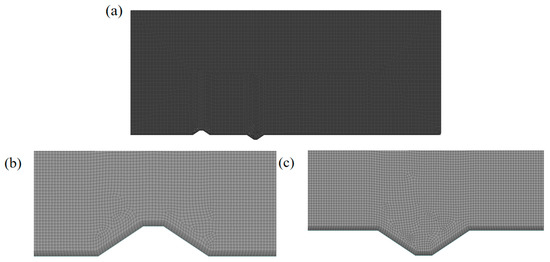
Figure 5.
Grid division: (a) Overall computational domain grid; (b) Local grid around the sand retaining dike; (c) Local grid around the sand intercepting ditch.
The y+ value is a critical parameter that is used to determine the dimensionless spacing between the wall surface and the first grid point [42], and its proper control plays a dual role in enhancing the accuracy of numerical simulations. The maximum and average y+ values are 260 and 85, respectively. First, it helps to effectively mitigate numerical errors and prevent computational instability that may arise from an excessively high aspect ratio of the near-wall mesh. Second, it ensures adequate grid resolution within the boundary layer, which is essential for accurately resolving the gradients of flow variables. Grid wall functionality requirements [43], where is the height of the boundary layer mesh, represents the wall friction velocity, and denotes the wall shear stress. The maximum grid slope ratio of the final mesh is less than 0.7, indicating a high-quality mesh that satisfies the computational demands.
This model utilizes a two-dimensional pressure-based solver for transient flow analysis. To reduce solution inaccuracies and improve the fidelity of the computational results, double-precision arithmetic is implemented. The Eulerian two-fluid model is applied to capture the dynamics of unsteady flows. In consideration of both computational efficiency and solution accuracy, the PISO algorithm [44], known for its high accuracy in handling transient simulations, is chosen. Standard Wall Functions are utilized in the vicinity of the wall due to their computational efficiency and suitability for high Reynolds number flows. This ensures the reliability of simulation outcomes. Spatial discretisation is performed using a second-order upwind scheme. The convergence criterion is set at 10−5, and the time step size is 0.1 s.
2.2. Characteristics of Airflow and Sand Particles
This particular simulation is modeled on the wind velocity conditions at the Zhongzaohuo site, which is located along the Golmud-Korla Railway [45]. The wind speeds specified at the sand-flow inlet, which is located 2 m above ground level, are 8, 12, 16 and 20 m/s. corresponds to inlet friction wind velocities of 0.46, 0.56, 0.65 and 0.75 m/s, respectively. The critical friction wind velocities for erosion, corresponding to sand particle diameters d ∈ [0.063, 1.2] mm, are exceeded by these values [2]. The subsoil in the Golmud-Korla Railway Zhongzaohuo section is primarily composed of fine sand and extremely fine sand. Therefore, the sand particle diameter is set to 0.1 mm [46], the sand particle density is 2650 kg/m3, and the air has a density of 1.225 kg/m3. As the sand component is the dilute phase in the wind-sand interaction, the volume fraction of the sand phase is set to 0.01.
2.3. Characterization of Sand Deposition and Erosion Dynamics Based on
The deposition and erosion of sand particles are primarily governed by the balance between the local shear stress exerted on the surface and the critical shear stress required for particle entrainment, as established in prior research. Consequently, this study employs the dimensionless shear stress ratio , to evaluate the deposition and erosion features of sand particles in the area around the sand retaining dike and sand intercepting ditch. Based on the magnitude of , the distribution of sand particles across space can be categorized into three distinct zones: the forward erosion region ( > 1), the deposition region (−1 < < 1), and the reverse erosion region ( < −1) [47]. The corresponding equations are presented as follows:
where is the local shearing forces at the ground surface; is the local shearing forces in the direction; is the critical shearing forces of sand grains, with a value of 0.045 Pa [47].
2.4. Method Validation
In order to validate the numerical simulation, HOBO gradient anemometers were installed at the Zhongzaohuo site on the Golmud-Korla Railway to conduct on-site wind speed measurements. The anemometers were installed at heights of 0.2, 0.5, 1, and 2 m, with a wind speed sampling frequency of 0.1 Hz and a time interval of 1 min. The layout of the site is shown in Figure 6.
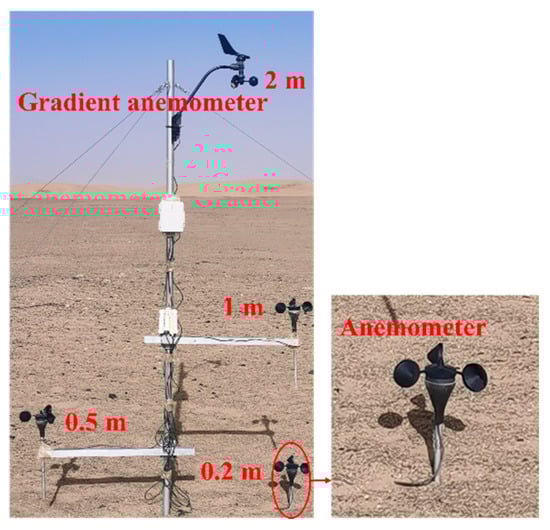
Figure 6.
HOBO Gradient Anemometer.
Wind speed data at a height of 2 m were selected from the field observation data: 8, 12, 16 and 20 m/s, where the deviation remains within 30% [48]. The average values of these datasets were compared with the wind velocity profile at the inlet of the numerical modeling under the specific wind speeds. The results are presented in Figure 7. The comparison between the numerical simulation and the field observation data reveals a favorable agreement in the wind speed profile at the inlet, as both follow a logarithmic distribution and exhibit a similar trend in the variation in the wind speed gradient.
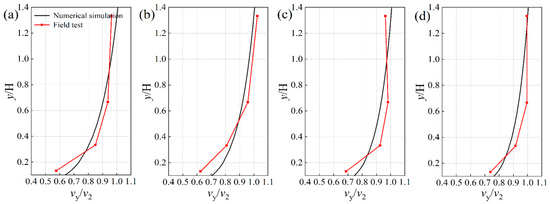
Figure 7.
Comparison of wind speed profiles at the numerical simulation inlet with field observation data: (a) 8 m/s; (b) 12 m/s; (c) 16 m/s; (d) 20 m/s.
Secondly, a comparative analysis of wind speed around the sand-blocking dikes and sand-intercepting ditches was conducted at a height of 2 m above ground under a wind speed condition of 12 m/s, with the results presented in Figure 8. The numerical model reliably captures the wind speed gradient, as validated against field measurements. The predicted trends show good agreement, with a maximum discrepancy of less than 10%, confirming satisfactory model consistency. This validation confirms that the wind speed boundary conditions used in this study accurately represent the properties of the real-world Windfield.
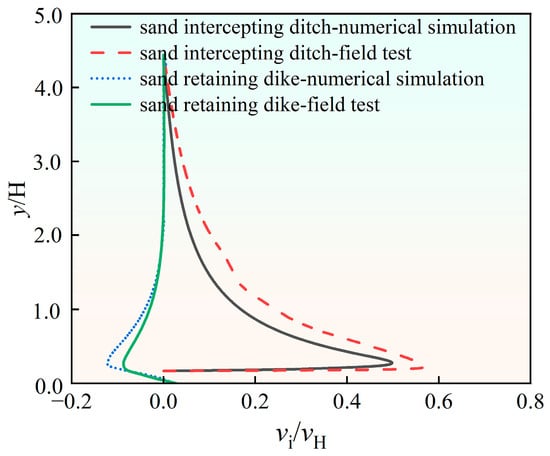
Figure 8.
Comparison of numerical simulation and field test of wind speed in the vicinity of sand retaining dikes and sand intercepting ditches.
To ensure the credibility of the research methodology, this study strictly adhered to the model configuration proposed by Zhang et al. [23]. The numerical method’s accuracy was verified through a comparison of the simulated sediment erosion patterns around sand retaining dike under varying wind speed conditions. Figure 9 presents a comparison of the deposition and erosion features of wind-blown sand around the sand retaining dike at four wind speeds of 8, 12, 16, and 20 m/s. The analysis revealed that within the wind speed range of 8–20 m/s, the average relative errors for the deposition zone and return flow zone lengths were less than 8% and 12%, respectively. The maximum error occurred at the 20 m/s operating condition, reaching approximately 15%. The simulation results obtained in this study are in good agreement with those reported by Zhang et al. [23] under the four selected wind speed scenarios, with the maximum relative error remaining below 15%. This validation confirms the credibility and precision of the computational methods used in this study, thereby establishing a solid basis for the reliability of the subsequent research outcomes.
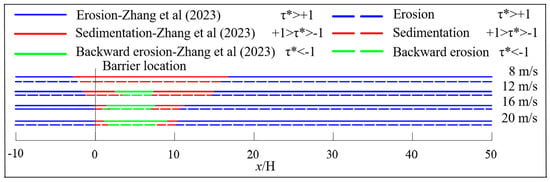
Figure 9.
Comparison of sediment erosion results around sand retaining dike under different wind speeds [23].
3. Results and Discussion
3.1. Features of Sand Flow Field Changes in Sand Retaining Dike and Sand Intercepting Ditch
3.1.1. Changes in Wind-Sand Flow Fields Under Different Inflow Wind Speeds
Taking the 5H spacing between the sand retaining dike and the sand intercepting ditch as an example, the velocity field distribution around the sand retaining dike and sand intercepting ditch under various incoming wind speeds is illustrated in Figure 10. When the airflow traverses the sand retaining dike, the velocity undergoes substantial variations, leading to the formation of distinct velocity regions in the vicinity of the sand retaining dike and sand intercepting ditch. On the side facing the wind, the airflow is impeded by the structure. These airflow patterns are induced by the windward sand retaining dike, which creates low-velocity zones at its base, accelerates flow up its slope, and culminates in high-velocity divergence at the crest of the windward face. A lower-velocity region develops on the side of the sand retaining dike facing away from the wind, which interacts with the high-velocity region at the upper portion of the barrier on the same side, inducing a pressure gradient that drives the airflow to compress and detach, thus generating a pressure differential. This pressure differential deflects the airflow on the backside downward, forming a near-ground recirculating flow, resulting in a vortex recirculation zone (turbulent region) on the side of the sand retaining dike facing away from the wind and sand intercepting ditch. An increase in the incoming wind velocity results in enhanced turbulence intensities in the leeward region of the dike and the intercepting ditch, whereas the overall distribution pattern of the velocity field is preserved.
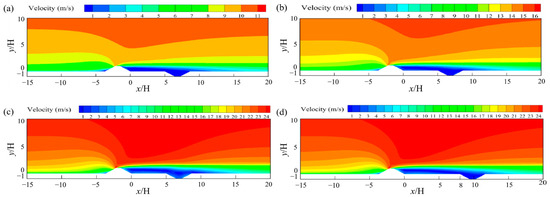
Figure 10.
Distribution of flow fields of surrounding speeds at various inflow speeds, at a distance of 5H between the sand-retaining dike and the sand-intercepting ditch: (a) 8 m/s; (b) 12 m/s; (c) 16 m/s; (d) 20 m/s.
3.1.2. Changes in Wind and Sand Flow Fields at Different Intervals
Figure 11 presents the distribution of the velocity flow field around the sand-retaining dike and the sand-intercepting ditch at different spacings, with an inlet wind speed of 16 m/s. It was observed that flow field variations due to different ditch spacings were largely confined to the leeward side of the dike; the windward side characteristics maintained relative consistency across configurations. With an increase in the distance between the sand retaining dike and the sand intercepting ditch, the turbulent region within the sand intercepting ditch gradually becomes less pronounced. This phenomenon is attributed to the progressive decrease in the pressure differential on the side of the sand retaining dike facing away from the wind. When the separation distance between the sand retaining dike and sand intercepting ditch is 8H, the turbulent region within the sand intercepting ditch can be considered negligible, suggesting that the airflow has reached a relatively stable state and the impact of vortex flows has diminished. As the separation distance increases further, the flow within the sand-intercepting ditch exhibits increasingly stratified layers, while its influence on the overarching aeolian flow structure diminishes progressively. When the separation distance between the sand retaining dike and sand intercepting ditch attains 12H, the trailing edge of the low-velocity area on the downstream side begins to exhibit discontinuities, indicating that the air velocity is gradually recovering to its upstream undisturbed level.
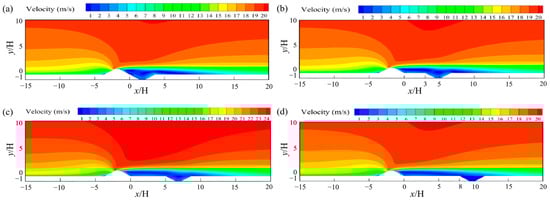
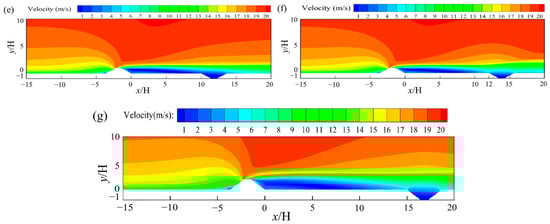
Figure 11.
Velocity field distribution around the sand retaining dike and sand intercepting ditch at different spacings when the speed of the incoming wind is 16 m/s: (a) 0H; (b) 3H; (c) 5H; (d) 8H; (e) 10H; (f) 12H; (g) 15H.
3.2. Wind Speed Profile Changes Around Sand Retaining Dike and Sand Intercepting Ditch
3.2.1. Wind Speed Profile Changes Under Different Inlet Wind Speeds
Figure 12 illustrates the variation patterns in wind speed around the sand retaining dike and sand intercepting ditch under varying incoming wind speeds. To elucidate the height-dependent alterations in wind speed configuration around the sand retaining dike and sand intercepting ditch, nine representative points were selected within the computational domain, as depicted in Figure 12a. The vertical velocity distribution at each of these characteristic points (P1–P9) under different inflow wind speed conditions is presented in Figure 12b. The horizontal velocity component vx and the vertical velocity component vy are both normalized using vH, while the vertical coordinate y is normalized by H. As depicted in the figure, points P1 and P2 are situated on the side of the sand retaining dike that faces the wind. The airflow at the P1 location is mainly horizontal, and the normalized velocity vx/vH increases logarithmically with height. The variation trend of vy/vH differs markedly from that of vx/vH. At location P3, the normalized horizontal velocity vx/vH increases linearly with the height above the ground and is directly proportional to the velocity of the incoming wind. vx/vH reaches its maximum value when the speed of the incoming wind is 20 m/s. Points P4 and P5 are positioned on the side of the sand retaining dike facing away from the wind, where the vx/vH minimum values are both below zero, signifying the existence of a recirculation region in this area. Reverse flow occurs near the ground surface, and its velocity within the leeward recirculation zone exhibits a corresponding increase with higher incoming wind speeds. At locations P6, P7, and P8 within the sand intercepting ditch, the peak reverse velocity of vx/vH is markedly higher than that at P5. At P6 and P7, vx/vH remains negative throughout the sand intercepting ditch, while at P8, vx/vH starts to exhibit positive values, suggesting that the sand intercepting ditch is predominantly characterized by a recirculation zone. At location P9, vy/vH is approximately zero and vx/vH > 0, indicating that the recirculation zone has dissipated and the flow has predominantly resumed its forward horizontal motion. A clear inflection point is identified at y/H = 1.7. For y/H > 1.7, the normalized vertical velocity vy/vH demonstrates an inverse correlation with height, whereas for y/H < 1.7, it is directly proportional to height. At location P2, the variation pattern of vx/vH is largely consistent with that observed at P1. However, the inflection point of vy/vH is shifted downward to y/H = 1, with a gradually increasing trend, implying that the wind speed at P2 experiences a stronger influence from the sand retaining dike compared to P1.
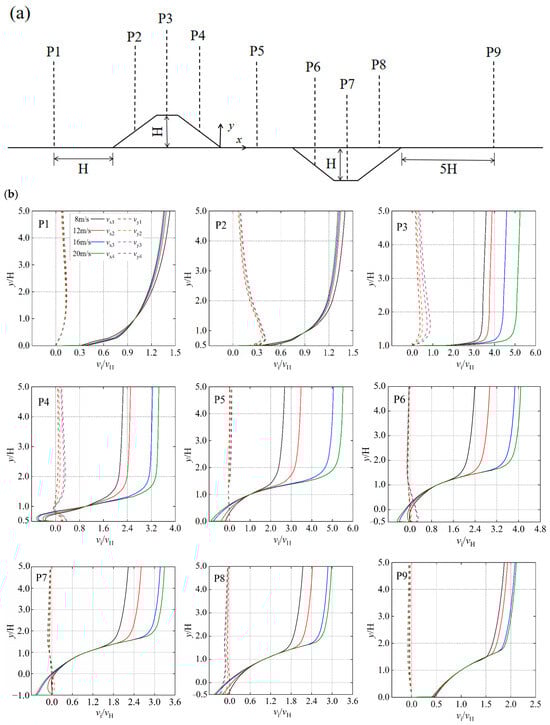
Figure 12.
Changes in the speed of the wind around the sand retaining dike and sand intercepting ditch under wind of different speeds: (a) The locations of the selected characteristic points P1–P9; (b) In the instance that the separation between the sand retaining dike and sand intercepting ditch is 5H, the vertical distribution curves of the dimensionless velocity components (vx/vH and vy/vH, where vx and vy are the velocity components of wind speed in the x and y directions, respectively) along different characteristic points.
3.2.2. Changes in Wind Speed Profiles at Different Intervals
Figure 13 presents the variation in wind speed around the sand retaining dike and sand intercepting ditch changes at different distances from a 16 m/s incoming wind. The results indicate that, at points P1–P4, the vx/vH and vy/vH curves for different spacing configurations exhibit nearly identical trends, with no segmented logarithmic growth pattern observed as height increases. This indicates that the wind speed variations at P1–P4 are not influenced by the spacing between the structures but are dictated exclusively by the incoming wind speed. At positions P5–P9, as the characteristic points are located increasingly farther from the sand intercepting ditch, vx/vH demonstrates a segmented logarithmic growth pattern, this is in alignment with the observations reported earlier by Zhang et al. [24]. When the spacing between the sand retaining dike and the sand intercepting ditch is increased, the locations where vx/vH displays a segmented variation remain consistent, all occurring at y/H approximately equal to 1. Moreover, with proximity to the sand-intercepting ditch, the discrepancies in the x-direction velocity components across different spacing configurations become more pronounced. At location P5, the values of vy/vH exhibit a negative correlation with spacing, and vx/vH also demonstrates a negative correlation with spacing within the backflow region, indicating that the impact of the backflow zone on wind speed at P5 diminishes progressively as spacing increases. Locations P6–P8 are situated within the sand intercepting ditch. When y/H < 1, the vx/vH values display a positive correlation with spacing, whereas when y/H > 1, a negative correlation between vx/vH and spacing is observed.
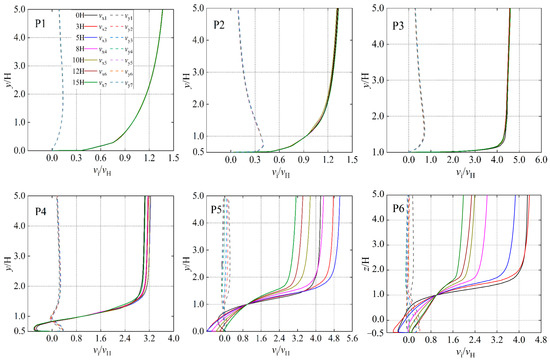
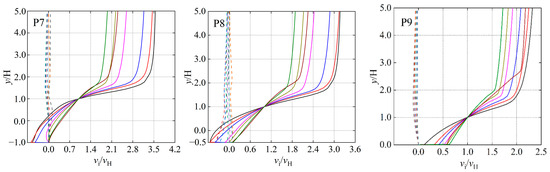
Figure 13.
Profile of changes in speed of wind around sand retaining dike and sand intercepting ditch at positions P1–P9 at different intervals when the speed of the incoming wind is 16 m/s.
3.3. Horizontal Wind Speed Variation Patterns of Sand Retaining Dike and Sand Intercepting Ditch
3.3.1. Horizontal Wind Speed Variation Patterns Under Different Incoming Wind Speeds
Figure 14 illustrates the distribution of horizontal wind speeds at various heights for a dike-ditch separation of 5H, under different incoming wind velocities. The results show that the overall variation trends of the wind speeds are consistent across the tested inflow conditions. Beneath the sand retaining dike, the profiles of horizontal wind velocity display a “V”-shaped pattern, characterized by an initial decrease followed by an increase. At above the H of height of the sand retaining dike, the profiles of horizontal wind velocity follow an overall “Λ”-shaped distribution, velocity increases initially, then decreases. Aerodynamic sheltering on the windward side of the dike results in calmer flow within heights below H. The deceleration is most pronounced near the surface and diminishes with increasing height. Above height H, a minor decline in wind velocity is observed on the side facing the wind, the horizontal wind velocity in the region above the sand retaining dike increases, which aligns with the previously obtained results. As the inflow wind speed rises, the variations in horizontal wind velocity within the sand intercepting ditch become more intense, with this effect being most noticeable at elevations of 0.1, 0.3, and 0.5 m above the ground surface. The results suggest an inverse relationship between dike height and the ditch’s influence on horizontal wind speed, which becomes less pronounced with taller dikes while becoming more substantial under higher inflow wind velocities.
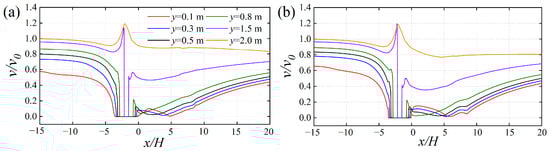
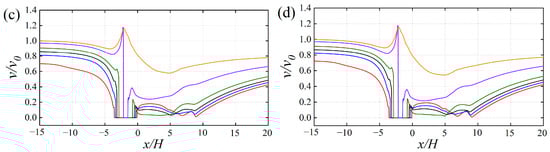
Figure 14.
Horizontal wind speed distribution patterns at various inlet wind speeds when the separation of distance between the sand retaining dike and sand intercepting ditch is 5H: (a) 8 m/s; (b) 12 m/s; (c) 16 m/s; (d) 20 m/s.
3.3.2. Changes in Horizontal Wind Speed at Different Intervals
Figure 15 depicts the spatial properties of horizontal wind velocity in the vicinity of the sand-retaining dike and sand-intercepting ditch under various spacing configurations as the inflow wind speed of 16 m/s. Given the consistency observed in windward-side speed variations across different spacings, the analysis shifts its focus to examining the patterns of horizontal wind velocity alteration on the leeward side of the sand retaining dike. On the leeward side of the dike, the horizontal wind velocity profiles within the ditch transition from a disturbed, non-uniform state to a progressively more stable and uniform pattern as the separation distance from the embankment increases. When the spacing between the sand retaining dike and the sand intercepting ditch is 0, 3H, and 5H, the variations in horizontal wind velocity within the sand intercepting ditch are most significant. This is attributed to the fact that as the sandstorm flows over the sand retaining dike, a larger pressure gradient is established between the high-pressure and low-pressure regions, resulting in a more pronounced vortex effect. A separation of 8H is sufficient to allow the flow within the ditch to stabilize. This flow regime corresponds to diminished vortex effects and a recovery of the wind speed toward its initial magnitude. The impact of vortices on the airflow has diminished. As the separation of distance continues to increase, the impact of the sand-intercepting ditch on horizontal velocity of the wind changes gradually diminishes, and the horizontal velocity of the wind within the sand intercepting ditch displays a “trapezoidal” distribution pattern that aligns with the geometric configuration of the ditch.
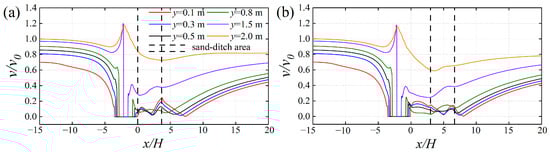
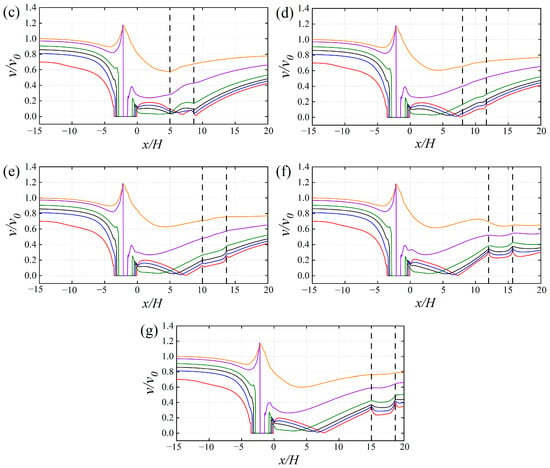
Figure 15.
Profile of changes in speed of wind around the sand retaining dike and sand intercepting ditch at different intervals when the speed of the incoming wind is 16 m/s: (a) 0H; (b) 3H; (c) 5H; (d) 8H; (e) 10H; (f) 12H; (g) 15H.
3.4. Turbulence Characteristics Around Sand Retaining Dike and Sand Intercepting Ditch
3.4.1. Turbulence Characteristics Under Incoming Wind Speed
Figure 16 presents the vorticity evolution characteristics in the vicinity of the sand retaining dike and sand intercepting ditch under varying incoming wind velocities, based on a combined visualization of streamlines and vorticity fields. The combined presence of the dike and ditch results in a primary flow modification: a marked increase in vorticity surrounding the structures, which is particularly pronounced within the near-surface region. With clockwise vortices Rd1 and Rd2 developing on the side of the sand retaining dike facing away from the wind and the inside of the sand intercepting ditch, respectively. This phenomenon arises due to the generation of vortex motion as the airflow traverses the sand retaining dike and is subjected to varying wind velocities and pressure gradients. As the speed of the incoming wind increases, the spatial extent of vortices Rd1 and Rd2 also expands. When the speed of the inlet wind is 8 and 12 m/s, vortex Rd2 within sand intercepting ditch demonstrates a multi-vortex configuration. At relatively low incoming wind speeds, the kinetic energy of fluid particles undergoes rapid dissipation after passing the sand-retaining dike, owing to diminished vortex effects within the intercepting ditch. When the speed of the inlet wind is 16 and 20 m/s, The spatial patterns of vortex distribution for Rd1 and Rd2 remain largely similar, suggesting that the speed of the inlet wind is 16 m/s, the entire protective structure has achieved its peak effect on the dynamics of the sand-laden airflow.
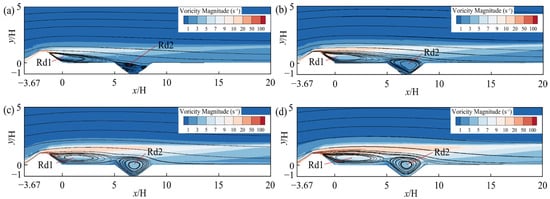
Figure 16.
Vortex intensity contour maps around the sand retaining dike and sand intercepting ditch at various speeds of incoming wind when the separation of distance between the sand retaining dike and sand intercepting ditch is 5H: (a) 8 m/s; (b) 12 m/s; (c) 16 m/s; (d) 20 m/s.
3.4.2. Characteristics of Vortex Flow Changes at Different Intervals
Figure 17 illustrates the variation characteristics of vortex flux around the sand retaining dike and sand intercepting ditch at various spacings under the speed of the inlet wind is 16 m/s. Figure 15 shows, when the separation of distance between the sand retaining dike and the sand intercepting ditch is 8H, the vorticity associated with vortex Rd2 inside the sand intercepting ditch starts to decline. This is attributed to the fact that the kinetic energy loss of fluid particles within the sand intercepting ditch has nearly reached its minimum, leading to a substantial reduction in the impact of vorticity. As the separation distance between the sand retaining dike and the sand intercepting ditch increases, no prominent vortices are observed within the sand intercepting ditch, and the overlying airflow progressively becomes more uniform. When the separation of distance between a sand retaining dike and the sand intercepting ditch is 12H, the vortices present within the sand intercepting ditch can be considered negligible, and the streamlines surrounding the sand intercepting ditch no longer display a downward curving pattern. This suggests that the sand intercepting ditch is starting to have less of an impact on airflow dynamics, thereby reducing the system’s overall protective effectiveness.
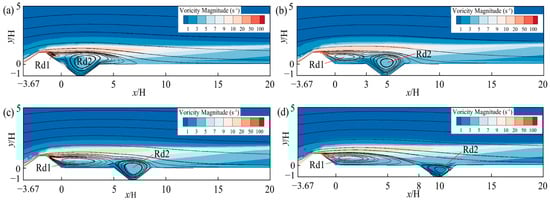
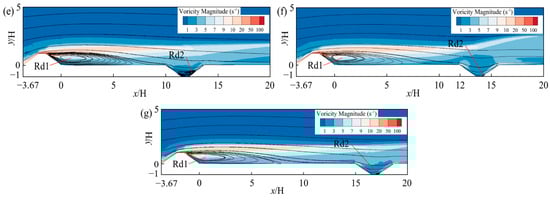
Figure 17.
Vortex intensity maps around the sand retaining dike and sand intercepting ditch at different spacings when the speed of the incoming wind is 16 m/s: (a) 0H; (b) 3H; (c) 5H; (d) 8H; (e) 10H; (f) 12H; (g) 15H.
3.5. Sedimentation and Erosion Properties of Sand Particles Around Sand Retaining Dike and Sand Intercepting Ditch
3.5.1. Sedimentation and Erosion Properties Under Variable Inflow Wind Speeds
Figure 18 illustrates the sediment deposition and erosion processes in the area around sand retaining dike and sand intercepting ditch under varying inflow wind velocities when the spacing is 5H. As depicted in Figure 18a, the sand retaining dike interrupts the incident airflow, generating a localized zone of velocity reduction adjacent to its windward face. Particle deposition on the windward side predominantly takes place at the base of the windward slope of the barrier. As the incoming wind speed increases, zones of sand deposition transition to areas of forward-directed erosion. Meanwhile, the recirculation zones on the leeward side of the dike and within the ditch may experience either net deposition or erosion, depending on local flow conditions. When the dimensionless shear stress ratio in the recirculation region is sufficiently negative ( < −1), the sediment deposition zone is replaced by a reverse erosion zone. The specific quantitative relationships between the deposition and erosion behaviors of sediment in the vicinity of the sand retaining dike and sand intercepting ditch under varying incoming wind velocities are presented in Figure 16b. Since the zone of reverse erosion also impedes the downwind transport of sand particles, this study defines the effective protection zone as the combined extent of the deposition region and the reverse erosion region, hereafter termed Ls. When the speed of the incoming wind is 12 m/s, sediment deposition occurs within the ranges of −4.30 to −3.20H and −0.79 to −11.00H in the vicinity of the sand retaining dike and sand intercepting ditch, while reverse erosion takes place in the range of −1.38 to −0.79H. When the speed of the inlet wind is 16 m/s, the area in which sediment is deposited around the sand retaining dike and sand intercepting ditch are reduced, with deposition observed within the intervals of −3.80 to −3.40H, −0.60 to −0.15H, 5.01 to 6.55H, and 8.67 to 10.60H. Reverse erosion of sediment occurs within the ranges of −1.55 to 0.60H, 0.15 to 5.01H, and 6.55 to 8.67H. At an inlet wind speed of 20 m/s, the sediment deposition zone is confined to 8.80–10.30H. Meanwhile, reverse erosion occurs on the leeward side of the dike and within the ditch, spanning elevations from −1.45H to 8.80H. In field investigations, Jin et al. [49] observed that an increase in the velocity of the wind leads to a corresponding reduction in the amount of sediment deposited around the fence, the present study’s results are in line with this. Specifically, when the speed of the inlet wind is 12, 16, and 20 m/s, the Ls values in the surrounding area of sand retaining dike and sand intercepting ditch are 13.48H, 12.55H, and 11.75H, respectively, suggesting that the speed of the inlet wind increases, the area of effective protective coverage around a sand retaining dike and sand intercepting ditch progressively diminishes.
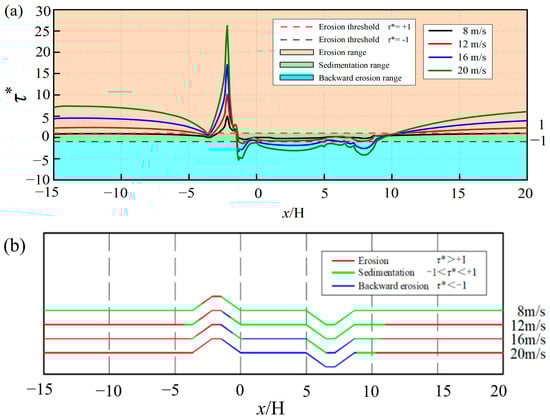
Figure 18.
Sand deposition and erosion properties around sand retaining dike and sand intercepting ditch at various speeds of incoming wind when the separation of distance is 5H: (a) variation curve; (b) quantitative relationship diagram of deposition and erosion characteristics.
3.5.2. Sedimentation and Erosion Characteristics at Different Intervals
Figure 19a presents the variation curves of sediment deposition around the sand retaining dike and sand intercepting ditch at different spacing configurations under a 16 m/s wind is blowing in. The results indicate that, there are mainly differences in the deposition patterns around the sand retaining dike and sand intercepting ditch at various spacings are mainly observed on the side facing away from the wind, whereas the trend of variation on the side facing the wind remains largely consistent. This phenomenon exhibits similarities to the findings reported by Zhang et al. [24] and Horvat et al. [25] Zhang et al. [24] conducted their experiments with a slope gradient of 1:1.75, whereas Horvat et al. [25] employed a slope gradient of 1:1.5, which corresponds to the slope gradient applied in the current study. On the side of the sand retaining dike facing away from the wind, when the separation is in the 0–8H range, the sediment dispersal around the sand retaining dike and sand intercepting ditch are predominantly characterized by zones of reverse erosion and deposition. At spacings between 10H and 15H, a forward erosion zone develops between the sand retaining dike and the intercepting ditch. The spatial extent of this erosion grows with increasing distance. The underlying causes for this phenomenon can be ascribed to two main reasons. First, following the reattachment point of the vortex flow on the side of the sand retaining dike facing away from the wind, the velocity of the wind-sand flow gradually recovers toward its initial condition. Second, as the separation of distance between sand retaining dike and sand intercepting ditch increases, the influence of the sand intercepting ditch on the overall wind-sand flow field progressively diminishes. Figure 19b illustrates the quantitative relationship between the deposition and erosion characteristics of sediment particles surrounding sand retaining dike and sand intercepting ditch at various spacings. When the sand intercepting ditch is situated within the deceleration and recirculation flow zone on the side of the sand retaining dike facing away from the wind, i.e., when the separation of distance between the sand retaining dike and sand intercepting ditch is 0, 3H, 5H, and 8H, respectively, the corresponding Ls values are 11.35H, 12.05H, 12.55H, and 13.45H, and the effective protective area increases with greater spacing. When the sand intercepting ditch is positioned behind the reattachment point of the vortex flow on the side of the sand retaining dike facing away from the wind, i.e., when the separation of distance between the sand retaining dike and sand intercepting ditch are 10H, 12H, and 15H, the corresponding Ls values are 15.95H, 13.5H, and 14.8H, respectively, with the effective protective area reaching its maximum at a distance of 10H. The optimal configuration for maximizing the system’s effective protective distance is achieved by positioning the sand-intercepting ditch downstream of the leeward vortex reattachment point.
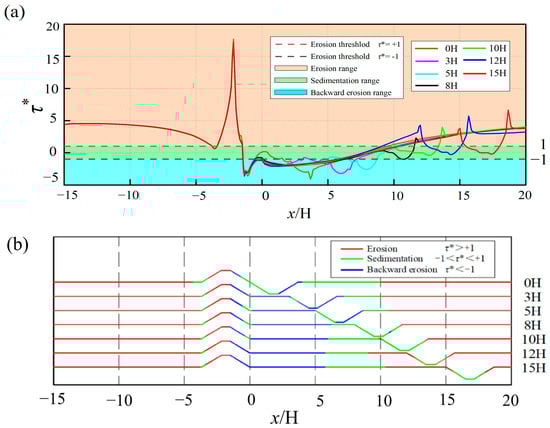
Figure 19.
Deposition and erosion features of sand particles around sand retaining dike and sand intercepting ditch at different spacings when the speed of the incoming wind is 16 m/s: (a) variation curve; (b) quantitative relationship diagram of deposition and erosion characteristics.
Figure 20 presents the radar map illustrating the effective protection zone Ls surrounding the sand retaining dike and sand intercepting ditch under varying inflow wind velocities and different spacings. As depicted in Figure 20a, when the speed of the incoming wind are 12, 16, and 20 m/s, respectively, the peak Ls values are observed at spacings of 8H, 10H, and 12H between the sand retaining dike and sand intercepting ditch, with corresponding Ls values of 13.98H, 15.95H, and 14.05H. This suggests that with the speed of the incoming wind, the separation of distance between the sand retaining dike and sand intercepting ditch must also be increased to sustain the maximum effective protective area. In Figure 20b, when the separation of distance between the sand retaining dike and sand intercepting ditch ranges from 0 to 8H, Ls decreases progressively as the speed of the inlet wind increases. Within the spacing range of 10H to 15H, the value of Ls remains relatively stable when subjected to a 12 m/s incoming wind. However, as the speed of the inlet wind of 16 and 20 m/s, Ls exhibits a notable increase at spacings of 10H and 12H.
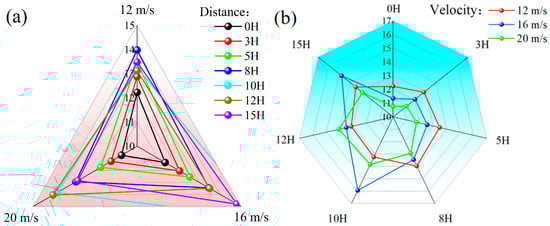
Figure 20.
Effective protection zone Ls radar map around sand retaining dike and sand intercepting ditch: (a) different inflow wind speeds; (b) different distance.
While a sand-intercepting ditch within the leeward backflow region shows limited effectiveness, optimal interception efficacy is achieved when it is positioned downstream of the vortex reattachment point. This improvement occurs because, at high incoming wind speeds, the disturbed flow near the ditch decouples from the upper-level wind, leaving the sediment-transporting layer unaffected. This positioning allows the ditch to intercept sand after particles have settled and shed energy. The ditch then alters the local surface flow, guiding both the airflow and the remaining particles into it for deposition.
4. Conclusions
This study investigates the features of wind-sand flow fields and vortex change characteristics using numerical simulation around sand retaining dike and sand intercepting ditch under varying wind velocities and spacings, thereby elucidating the features of sand particle deposition and erosion.
(1) On the windward side, the ratio vx/vH adheres to a logarithmic distribution pattern, resulting in the formation of low-velocity regions, acceleration zones, and high-velocity zones at the slope toe, slope face, and slope crest, respectively. The presence of the dike alters the leeward flow, causing its velocity distribution to no longer follow the logarithmic law due to the aerodynamic disruption. Starting from the P5 position, a segmented logarithmic growth pattern is observed, with all segmentation points occurring at approximately y/H = 1.
(2) Clockwise vortices Rd1 and Rd2 develop on the side of the sand retaining dike facing away from the wind and on the inside of the sand intercepting ditch, respectively. As the velocity of the inlet wind increases, the turbulence intensity and spatial extent of vortices Rd1 and Rd2 progressively intensify until the velocity of the incoming wind reaches 16 m/s; after this, the growth trajectory of these vortices gradually stabilizes. When the spacing between the sand retaining dike and the sand intercepting ditch increases to 8H, the impact of the vortices on the sand intercepting ditch diminishes. Further increases in the spacing result in a progressively more stable airflow.
(3) Higher wind velocities cause the deposition zone around the structures to shrink, while the erosion zone expands. Under close spacings, like 0–8H, the leeward side of the dike is characterized by a reverse erosion regime. When the spacing is 10–15H, a zone of forward erosion emerging from sand particles appears between the sand retaining dike and the sand intercepting ditch, and this forward erosion zone expands with the increase in spacing. The deposition area on the windward side is gradually replaced by forward erosion. In parallel, the extent of reverse erosion in the leeward separation zone undergoes continued expansion.
(4) Under 5H spacing conditions, the effective protection area Ls of the sand retaining dike and sand interception ditch system demonstrates pronounced wind speed dependence. As the velocity of the inlet wind escalates from 12 to 20 m/s, the system’s effective protection exhibits a marked decreasing trend, with a maximum reduction of 12.8%. When the sand intercepting ditch is situated within the leeward-side deceleration recirculation zone of the sand retaining dike, it fails to fully exploit its sand interception capacity. However, the sand-interception efficiency is significantly enhanced when the sand intercepting ditch is placed beyond the vortex flow reattachment point on the leeward side of the sand retaining dike, particularly under inlet wind speeds of 16–20 m/s and a spacing of 10H–12H. This observation highlights the significant impact that the location at which the vortex flow is reattached has on the performance of the composite protection system, offering a crucial reference for the optimization of protective engineering design. Engineering designs can leverage this approach to optimize the configuration of sand control systems, mitigating the risk of sandstorm-induced damage. Consequently, maintenance can be strategically focused on high-deposition zones. This targeted approach extends infrastructure lifespan and enhances the safety and cost-effectiveness of railway operations in sandy regions.
Author Contributions
Methodology, Y.Z. and H.Z.; Software, Y.Z.; Investigation, Z.D.; Resources, K.Z.; Data curation, Y.Z., K.Z. and J.W.; Writing–original draft, K.Z., Z.C. and J.W.; Writing–review & editing, Z.C.; Visualization, Z.D.; Supervision, H.Z. and J.W.; Funding acquisition, J.W. All authors have read and agreed to the published version of the manuscript.
Funding
The supports by the National Natural Science Foundation of China (42461011, 52378480), and the Natural Science Innovation and Development Joint Foundation of Chongqing (Grant No. CSTB2024NSCO-LZX0010) are greatly acknowledged.
Institutional Review Board Statement
Not applicable.
Informed Consent Statement
Not applicable.
Data Availability Statement
The original contributions presented in this study are included in the article. Further inquiries can be directed to the corresponding author.
Conflicts of Interest
The authors have no conflicts to disclose.
References
- Chen, Z.H.; Li, X.M. Economic impact of transportation infrastructure investment under the Belt and Road Initiative. Asia Eur. J. 2021, 19, 131–159. [Google Scholar] [CrossRef] [PubMed]
- Kok, J.F.; Parteli, E.J.; Michaels, T.I.; Karam, B.D. The physics of wind-blown sand and dust. Rep. Prog. Phys. 2012, 75, 106901. [Google Scholar] [CrossRef] [PubMed]
- Fathali, M.; Nasrabad, M.M.K.; Abbasi, H.R.; Abbasi, H.R.; Amrollahi, A.; Soleymani, M. Aeolian sand challenges in desert rail infrastructures, overview of Iran’s experience and advancement. Constr. Build. Mater. 2024, 438, 136953. [Google Scholar] [CrossRef]
- Zhang, K.C.; Qu, J.J.; Liao, K.T.; Niu, Q.H.; Han, Q.J. Damage by wind-blown sand and its control along Qinghai-Tibet Railway in China. Aeolian Res. 2010, 1, 143–146. [Google Scholar] [CrossRef]
- Wang, T.; Qu, J.J.; Ling, Y.Q.; Xie, S.B.; Xiao, J.H. Wind tunnel test on the effect of metal net fences on sand flux in a gobi desert, China. J. Arid Land 2017, 9, 888–899. [Google Scholar] [CrossRef]
- Tan, L.H.; An, Z.S.; Zhang, K.; Qu, J.J.; Han, Q.J.; Wang, J.Z. Intermittent aeolian saltation over a gobi surface: Threshold, saltation layer height, and high-frequency variability. J. Geophys. Res.-Earth Surf. 2020, 125, e2019JF005329. [Google Scholar] [CrossRef]
- Zhang, W.M.; Qu, J.J.; Tan, L.H.; Jing, Z.F.; Bian, K.; Niu, Q.H. Environmental dynamics of a star dune. Geomorphology 2016, 273, 28–38. [Google Scholar] [CrossRef]
- Mehdipour, R.; Baniamerian, Z. A new approach in reducing sand deposition on railway tracks to improve transportation. Aeolian Res. 2019, 41, 100537. [Google Scholar] [CrossRef]
- Parsons, R.D.; Wiggs, F.G.; Walker, J.I.; Ferguson, R.I.; Garvey, B.G. Numerical modelling of airflow over an idealised transverse dune. Environ. Modell. Softw. 2004, 19, 153–162. [Google Scholar] [CrossRef]
- Lei, J.Q.; Wang, X.Q.; Wang, D.; Zhou, C.H.; Xia, X.C. The blown sand disaster to the Tarim Desert Highway in Xinjiang, China. Sci. China Ser. D 2002, 45, 165–173. [Google Scholar] [CrossRef]
- Fathali, M.; Nasrabad, M.M.K.; Nejad, F.M.; Chalabii, J.; Rad, M.M. Aerodynamic Behavior of Hump Slab Track in Desert Railways: A Case Study in Shuregaz, Iran. Buildings 2024, 14, 2473. [Google Scholar] [CrossRef]
- Fathali, M.; Nasrabad, M.M.K.; Moghadasnejad, F. Performance of hump slab track in sandstorms using simulation and a wind tunnel experiment. J. Eng. Appl. Sci. 2024, 71, 231. [Google Scholar] [CrossRef]
- Bruno, L.; Fransos, D.; Giudice, L.A. Solid barriers for windblown sand mitigation: Aerodynamic behavior and conceptual design guidelines. J. Wind Eng. Ind. Aerody. 2018, 173, 79–90. [Google Scholar] [CrossRef]
- Hesp, A.P.; Dong, Y.X.; Cheng, H.; Booth, J.L. Wind flow and sedimentation in artificial vegetation: Field and wind tunnel experiments. Geomorphology 2019, 337, 165–182. [Google Scholar] [CrossRef]
- Dun, H.C.; Xin, G.W.; Huang, N.; Shi, G.T.; Zhang, J. Wind-tunnel studies on sand sedimentation around wind-break walls of Lanxin High-Speed Railway II and its prevention. Appl. Sci. 2021, 11, 20–34. [Google Scholar] [CrossRef]
- Gong, W.; Zang, Y.X.; Liu, B.L.; Chen, H.L.; Wu, F.S.; Huang, R.H.; Wang, S.K. Effect of using polymeric materials in ecological sand-fixing of Kerqin Sandy Land of China. J. Appl. Polym. Sci. 2016, 133, 44102. [Google Scholar] [CrossRef]
- Bruno, L.; Horvat, M.; Raffaele, L. Windblown sand along railway infrastructures: A review of challenges and mitigation measures. J. Wind Eng. Ind. Aerody. 2018, 177, 340–365. [Google Scholar] [CrossRef]
- McClure, S.; Kim, J.J.; Lee, J.S.; Zhang, W. Shelter effects of porous multi-scale fractal fences. J. Wind Eng. Aerod. 2017, 163, 6–14. [Google Scholar] [CrossRef]
- Cui, X.N.; Liang, K.X.; Wang, Q.C. Sand-control mechanism of sand blocking embankment at Geku Railway. J. Arid Land Resour. Environ. 2019, 33, 85–92. (In Chinese) [Google Scholar]
- Kim, Y.M.; You, K.P.; You, J.Y. Characteristics of wind velocity and temperature change near an escarpment-shaped road embankment. Sci. World J. 2014, 2014, 695629. [Google Scholar] [CrossRef]
- Shiau, B.S.; Hsieh, C.T. Wind flow characteristics and Reynolds stress structure around the two-dimensional embankment of trapezoidal shape with different slope gradients. J. Wind Eng. Ind. Aerod. 2002, 90, 1645–1656. [Google Scholar] [CrossRef]
- Zhang, K.; Zhang, H.L.; Tian, J.J.; Qu, J.J.; Zhang, X.X.; Wang, Z.H.; Xiao, J.H. Flow field, sedimentation, and erosion characteristics around folded linear HDPE sheet sand fence: Numerical simulation study. J. Mt. Sci. 2024, 21, 113–130. [Google Scholar] [CrossRef]
- Zhang, K.; Zhang, H.L.; Deng, Y.H.; Qu, J.J.; Wang, Z.H. Effects of sand sedimentation and wind erosion around sand barrier: Numerical simulation and wind tunnel test studies. J. Mt. Sci. 2023, 20, 962–978. [Google Scholar] [CrossRef]
- Zhang, K.; Wang, Z.H.; Tian, J.J.; Zhang, H.L.; Liu, Y.H. Numerical simulation study of flow field deposition and erosion characteristics around bridge-road transition section. J. Mt. Sci. 2024, 21, 1491–1508. [Google Scholar] [CrossRef]
- Horvat, M.; Bruno, L.; Khris, S. CWE study of wind flow around railways: Effects of embankment and track system on sand sedimentation. J. Wind Eng. Ind. Aerod. 2021, 208, 104476. [Google Scholar] [CrossRef]
- He, W.; Huang, N.; Dun, H.C.; Wang, W.B. CFD evaluation of erosion rate around a bridge near a sand dune. J. Phys. Conf. Ser. 2017, 822, 012044. [Google Scholar] [CrossRef]
- Shih, T.H.; Liou, W.W.; Shabbir, A.; Yang, Z.; Zhu, J. A new k-ϵ eddy viscosity model for high Reynolds number turbulent flows. Comput. Fluids 1995, 24, 227–238. [Google Scholar] [CrossRef]
- Asress, M.B.; Svorcan, J. Numerical investigation on the aerodynamic characteristics of high-speed train under turbulent crosswind. J. Mod. Transp. 2014, 22, 225–234. [Google Scholar] [CrossRef]
- Liu, M.Y.; Jiang, C.; Khoo, B.C.; Zhu, H.F.; Gao, G.J. A cell-based smoothed finite element model for the analysis of turbulent flow using realizable k-ε model and mixed meshes. J. Comput. Phys. 2024, 501, 112783. [Google Scholar] [CrossRef]
- Gong, M.; Shen, Y.H. Study on heat flow decay in vertical jet of aircraft deicing fluid based on phase field and realizable k-ε turbulence model. Therm. Sci. Eng. Prog. 2025, 60, 103446. [Google Scholar] [CrossRef]
- Biadgo, A.M.; Simonovic, A.; Svorcan, J.; Stupar, S. Aerodynamic characteristics of high speed train under turbulent cross winds: A numerical investigation using unsteady-RANS method. FME Trans. 2014, 42, 10–18. [Google Scholar] [CrossRef]
- Souza, D.M.L.; Janiga, G.; Thévenin, D. Multi-objective optimisation of the model parameters for the realisable k-ε turbulence model. Prog. Comput. Fluid Dyn. Int. J. 2017, 17, 90–101. [Google Scholar] [CrossRef]
- Nagata, T.; Nonomura, T.; Takahashi, S.; Mizuno, Y.; Fukuda, K. Investigation on subsonic to supersonic flow around a sphere at low Reynolds number of between 50 and 300 by direct numerical simulation. Phys. Fluids 2016, 28, 056101. [Google Scholar] [CrossRef]
- Zhao, Y.; Liu, X.; Liu, J.T.; Liu, Y.; Li, G.H.; Zhou, L.X. A Euler-Euler hydrodynamic modelling and simulation of dense particle flow in a small-scale fluidized bed. Adv. Powder Technol. 2024, 35, 104691. [Google Scholar] [CrossRef]
- Elreafay, A.M.; Salem, K.M.; Abumandour, R.M.; Dawood Nuaimi, S.A. Effect of particle diameter and void fraction on gas–solid two-phase flow: A numerical investigation using the Eulerian–Eulerian approach. Comput. Part. Mech. 2025, 12, 289–311. [Google Scholar] [CrossRef]
- Chen, X.Z.; Wang, J.W. A comparison of two-fluid model, dense discrete particle model and CFD-DEM method for modeling impinging gas–solid flows. Powder Technol. 2014, 254, 94–102. [Google Scholar] [CrossRef]
- Sarafrazi, V.; Talaee, M.R. Comparing performances of a triangular embankment and a rigid wall-type barrier in sandstorms using simulation and a wind tunnel test. Eur. Phys. J. E Soft. Matter 2020, 43, 74. [Google Scholar] [CrossRef]
- Shi, L.; Li, K.C.; Jiang, F.Q. Optimal analysis of design parameters for sand retaining dike along railway. Railw. Eng. 2017, 57, 119–123. (In Chinese) [Google Scholar]
- Chang, X.B. Study on sand dike through wind tunnel numerical simulation test and sand pile test on Jiuquan to EJiNa Railway. Railw. Stand. Des. 2017, 61, 1–5. (In Chinese) [Google Scholar]
- Bradley, E.F.; Mulhearn, P.J. Development of velocity and shear stress distribution in the wake of a porous shelter fence. J. Wind Eng. Ind. Aerod. 1983, 15, 145–156. [Google Scholar] [CrossRef]
- Zhang, X.; Xie, S.B.; Pang, Y.J. Numerical simulation on wind-sand flow field around railway embankment with different wind angles. Front. Environ. Sci. 2023, 10, 1073257. [Google Scholar] [CrossRef]
- Wakes, S.J.; Maegli, T.; Dickinson, K.J.; Hilton, M.J. Numerical modelling of wind flow over a complex topography. Environ. Modell. Softw. 2009, 25, 237–247. [Google Scholar] [CrossRef]
- Martin, W.; Luciano, C.; William, K.G. A theory for turbulent pipe and channel flows. J. Fluid Mech. 2000, 421, 115–145. [Google Scholar] [CrossRef]
- Kraposhin, M.V.; Ryazanov, D.A.; Elizarova, T.G. Numerical algorithm based on regularized equations for incompressible flow modeling and its implementation in OpenFOAM. Comput. Phys. Commun. 2022, 271, 108216. [Google Scholar] [CrossRef]
- Zhang, K.; Zhao, L.M.; Zhang, H.L.; Guo, A.J.; Yang, B. Numerical simulation on flow field, wind erosion and sand sedimentation patterns over railway subgrades. J. Mt. Sci. 2022, 19, 2968–2986. [Google Scholar] [CrossRef]
- Raffaele, L.; Bruno, L.; Pellerey, F.; Preziosi, L. Windblown sand saltation: A statistical approach to fluid threshold shear velocity. Aeolian Res. 2016, 23, 79–91. [Google Scholar] [CrossRef]
- Horvat, M.; Bruno, L.; Khris, S. Receiver sand mitigation measures along railways: CWE-based conceptual design and preliminary performance assessment. J. Wind Eng. Ind. Aerod. 2022, 228, 105109. [Google Scholar] [CrossRef]
- Chang, J.C.; Hanna, S.R. Air quality model performance evaluation. Meteorol. Atmos. Phys. 2004, 87, 167–196. [Google Scholar] [CrossRef]
- Jin, C.N.; Dong, Z.D.; Li, J.J.; Chen, G.T. Blown sand deposits and its indications on wind activities around high windbreaks. J. Desert Res. 2005, 25, 652–657. (In Chinese) [Google Scholar]
Disclaimer/Publisher’s Note: The statements, opinions and data contained in all publications are solely those of the individual author(s) and contributor(s) and not of MDPI and/or the editor(s). MDPI and/or the editor(s) disclaim responsibility for any injury to people or property resulting from any ideas, methods, instructions or products referred to in the content. |
© 2026 by the authors. Licensee MDPI, Basel, Switzerland. This article is an open access article distributed under the terms and conditions of the Creative Commons Attribution (CC BY) license.