Abstract
The rapid growth of China’s prepared food industry has created new opportunities for industrial upgrading, but it has also intensified concerns regarding product quality, supervision gaps, and the long-term sustainability of governance structures. In response to these challenges, this study develops a tripartite evolutionary game model involving local governments, enterprises, and consumers, and further integrates a Markov chain framework to capture stochastic disturbances and long-run state transitions. This dynamic–stochastic modeling approach enables an examination of how collaborative supervision evolves under varying regulatory intensities, compliance costs, and consumer reporting costs. The results show that (1) multi-actor collaborative supervision substantially increases firms’ incentives to operate honestly and reinforces positive feedback loops between regulators and consumers; (2) excessive regulatory, compliance, or reporting costs weaken system stability and reduce policy effectiveness; (3) aligning regulatory intensity with penalty mechanisms accelerates the system’s convergence toward a stable equilibrium, balancing industrial development with food safety objectives; and (4) Markov chain simulations confirm the robustness and long-term stationarity of the governance system. Overall, this study provides a dynamic and evidence-based framework for designing sustainable and resilient regulatory mechanisms in the prepared food industry. The findings offer practical guidance for advancing Sustainable Development Goals (SDGs) 3, 12, and 16 through improved food safety, responsible production, and stronger institutional governance.
1. Introduction
China’s food industry has undergone a profound structural transformation in recent years, driven by rapid urbanization, rising consumer demand for convenience, and technological upgrading across agricultural and processing sectors [1,2]. Within this broader transformation, the prepared food industry—positioned at the intersection of agriculture, manufacturing, cold-chain logistics, and food services—has experienced particularly rapid expansion. As illustrated in Figure 1, the sector has not only grown in market size but has also been incorporated into national policy agendas. At the policy level, China’s 2023 Central No. 1 Document explicitly calls for improving the standardization of “net vegetables and central kitchens” and fostering the development of the prepared food industry. It also emphasizes strengthening food safety and agricultural product quality supervision and improving traceability systems, underscoring that rapid industrial expansion should be matched with enforceable governance capacity [3]. Building on this policy orientation, in March 2024, the State Administration for Market Regulation, together with five other central departments, issued the Notice on Strengthening Food Safety Supervision of Prepared Dishes and Promoting High-quality Development of the Industry. The Notice clarifies the definition and scope of prepared dishes and calls for advancing a dedicated standards system, developing national food-safety standards, and strengthening supervision through sampling inspection and risk monitoring [4]. Against this backdrop, the prepared food sector—spanning agricultural inputs, standardized processing, cold-chain logistics, and food-service delivery—faces a clear governance challenge: aligning standardization with credible enforcement and participation mechanisms so that compliance can be sustained along a fragmented, fast-expanding supply chain.
While this expansion has created new opportunities for industrial upgrading, it has also revealed emerging governance challenges. The diversification of raw materials, fragmentation of processing and logistics chains, and uneven cold-chain capabilities have increased uncertainty and complexity in quality control [5]. High-profile incidents—such as the 2024 CCTV “3·15” [6] investigation revealing the use of improperly handled “Neck meat” in ready-to-eat meicai kou rou prepared dishes—highlight structural vulnerabilities including regulatory lag, supply-chain opacity, and opportunistic behavior by some firms. These characteristics mirror long-standing risks documented in traditional food processing and cold-chain systems, and they raise new questions about how to design effective governance frameworks for an industry that is expanding faster than regulatory capacity can adapt. Meanwhile, market-regulation authorities have continued to publicize typical food-safety enforcement cases [7] and to strengthen full-chain sampling inspection and risk monitoring, indicating that regulatory pressure is rising while governance challenges remain salient [8].
A growing consensus in both policy and academic communities suggests that traditional top-down supervision models are insufficient for addressing these challenges. Instead, contemporary food governance increasingly emphasizes multi-actor collaboration involving governments, enterprises, consumers, and social actors. Existing empirical research shows that compliance outcomes are influenced not only by regulatory intensity and penalties but also by consumer trust, certification credibility, information transparency, and the digital participation of the public [9,10]. In the context of fast-evolving industries such as prepared foods, coordinated governance—characterized by information sharing, mutual constraints, and joint incentives—has become central to sustainable regulatory strategies [11].
From a global perspective, food safety governance has increasingly shifted from incident-driven enforcement to prevention-oriented and risk-based regulatory designs. For example, the EU’s Official Controls Regulation provides a harmonized framework for risk-based official controls along the agri-food chain, while the U.S. Food Safety Modernization Act similarly emphasizes prevention and frames food safety as a shared responsibility across supply chain actors [12,13]. At the international level, the WHO Global Strategy for Food Safety (2022–2030) further highlights that strengthening food safety systems is tightly linked to the Sustainable Development Goals and requires cross-sector collaboration [14]. Meanwhile, private standards and third-party assurance schemes have become more embedded in global agri-food governance, and evidence suggests that well-designed co-regulatory arrangements can complement official controls by improving transparency, strengthening compliance incentives, and enabling risk-based allocation of enforcement resources [15,16].
Despite these advancements, several gaps remain in the current literature. First, existing research on food safety governance still largely relies on institutional analyses or static, equilibrium-oriented frameworks, which provide limited leverage for explaining adaptive behaviors under bounded rationality and repeated interactions across the supply chain [17,18]. Second, although multi-actor co-governance has been increasingly emphasized, relatively few studies explicitly model the co-evolution of governments, enterprises, and consumers in dynamic and uncertain environments [11,19]. Third, stochastic elements—such as episodic incidents, policy adjustments, or short-term shocks—may trigger abrupt regime shifts in enforcement and compliance, yet are still insufficiently integrated into mainstream evolutionary-governance modeling [20]. Methodologically, Markov-chain-based formulations that can map evolutionary dynamics into state-to-state transitions and characterize long-run state distributions remain underutilized in this governance context [21,22].
Some researchers have begun to bridge these gaps. Tianjun Su et al. [23] develop a tripartite evolutionary game model with time delay among food enterprises, regulators, and inspectors to simulate real-world decision-making under delayed feedback. Meanwhile, the concept of the food supply chain as a health network has been explored: Linhai Wu et al. [24] use an evolutionary game approach to examine how quality investment decisions evolve under shared governance. On the governance side, Qinghua Mao et al. [25] conducted a stochastic evolutionary game analysis on food cooperation among countries, revealing how cross-actor strategies evolve under uncertainty. Also, recent policy-evolution research investigates the shift from single-sector regulation to multi-stakeholder co-governance, aligning closely with our interest in collaborative and sustainable governance [26]. Finally, in the context of agricultural supply chains, studies on quality governance using evolutionary games offer insights into how producers, governments, and consumers co-evolve under different punishment and feedback regimes [27]. Moreover, geographical-indication agricultural product governance has been modeled using multi-party evolutionary games that incorporate self-governance actors and regulators [28]. However, these studies have not fully integrated evolutionary dynamics with stochastic state transitions in the context of prepared food regulation, nor have they explicitly linked analytical outcomes to long-term sustainable governance objectives.

Figure 1.
Market size (left axis) and year-on-year growth rate (right axis) of China’s prepared food industry. Note: Market-size data for 2021–2024 and the 2026 forecast are taken from the industry Bluebook published by iiMedia Research. The 2025 value plotted is a linear interpolation between the 2024 observed value and the 2026 forecast; this is explicitly marked as a projection in the manuscript. Data source: iiMedia Research, “2022–2025 China Prepared Food Industry Bluebook” [29,30,31].
Against this backdrop, the present study makes three contributions: (1) We construct a tripartite evolutionary game model involving local governments, prepared food enterprises, and consumers to examine how regulatory intensity, penalty mechanisms, reporting costs, and compliance incentives jointly shape long-term behavioral trajectories. (2) We embed these dynamics within a Markov chain framework to capture stochastic disturbances—such as sudden policy changes, food safety incidents, or epidemic shocks—and derive steady-state distributions that represent long-run governance outcomes. (3) We conduct a parameter sensitivity analysis to identify leverage points that enhance regulatory effectiveness while balancing cost efficiency and system resilience.
To make the contribution and empirical logic explicit, this study addresses three research questions. The first research question asks how, under bounded rationality, the strategic choices of the government, firms, and consumers co-evolve over time, and which equilibrium outcomes correspond to sustainable governance. The second research question examines how key policy and market conditions, such as regulatory costs, enforcement intensity, penalty severity, consumer compensation and reporting frictions, and firms’ integrity-management costs, influence equilibrium stability and the speed of convergence toward compliance. The third research question considers stochastic disturbances and path dependence and asks what the long-run probability is that the system reaches the desirable state characterized by active government supervision, firm compliance, and consumer reporting, and how alternative policy scenarios reshape this long-run distribution.
Building on these questions, we develop testable hypotheses and evaluate them using Markov-chain simulations grounded in the evolutionary-game payoffs. Hypothesis 1 states that stronger deterrence, reflected in higher penalty severity together with higher effective enforcement intensity, increases the long-run probability of the desirable state. Hypothesis 2 states that lower consumer reporting frictions and stronger participation incentives increase both the probability of reaching the desirable state and the speed of convergence toward compliance. Hypothesis 3 states that lower enforcement costs or higher regulatory capacity makes active supervision more likely to persist over time. The Markov-chain simulation operationalizes these hypotheses by mapping tripartite strategy profiles into discrete states, constructing a one-step transition matrix consistent with the evolutionary dynamics and the feedback rules specified in Section 3.4, and comparing stationary distributions and convergence patterns across policy scenarios.
Overall, by integrating evolutionary game theory with Markov chain modeling, this study establishes a dynamic–stochastic analytical framework suited to the complex and rapidly evolving prepared food industry. More importantly, by situating the analysis within the broader concept of sustainable governance, we demonstrate how collaborative regulatory mechanisms can align short-term risk mitigation with long-term industry resilience, providing actionable insights for policymakers, regulators, and industry stakeholders.
2. Literature Review
The theoretical foundation of this study draws from four strands of literature: (1) the development trajectory of the prepared food industry; (2) collaborative food safety governance; (3) evolutionary game approaches to regulatory behavior; (4) Markov chain modeling in dynamic risk and governance analysis. This section synthesizes major scholarly contributions in these areas and highlights the research gaps motivating our study.
2.1. Development of the Prepared Food Industry: From Rapid Expansion to Sustainable Governance
The prepared food industry originated in the United States in the 1960s and entered China during the early 1990s. Existing research has predominantly examined two areas: industrial development and food safety technologies. At the macro level, Zhen Tan et al. [32] introduced the HACCP system into prepared food production and discussed pathways for regional cuisine industrialization. Dongmei Li et al. [33] further analyzed the inheritance, innovation, and future development prospects of the industry, emphasizing the need for a sustainable transformation of prepared food supply chains. Following the recognition of prepared foods in China’s No. 1 Central Document, Jian Zhong et al. [34] examined institutional bottlenecks and recommended improvements to the sector’s standardization system.
Internationally, scholars have highlighted similar governance challenges. Gary Gereffi et al. [35] showed that globalized food supply chains increase governance complexity and require multi-actor sustainability frameworks. Louise Manning et al. [36] argued that food safety, food fraud prevention, and sustainability concerns must be addressed within an integrated system-level governance structure. Roberta Sonnino [37] emphasized that sustainable food system transitions rely on coordinated institutional and market-based strategies. These studies collectively reveal that prepared foods—characterized by long supply chains, diverse raw materials, and high logistics demands—require governance models that balance industrial expansion with safety and sustainability goals.
At the micro level, an emerging stream of research examines safety governance in prepared-food supply chains by focusing on firm-level compliance and risk-control behaviors across key nodes, including raw-material sourcing, standardized processing, cold-chain distribution, and food-service delivery [38]. Supply-chain analyses indicate that quality-safety risks are jointly shaped by opportunistic incentives, information asymmetry, and fragmented cold-chain responsibilities, and that effective control relies on coordinated mechanisms such as traceability, auditing, and node-level accountability [39]. Recent work further proposes systematic risk-control frameworks and stresses the need to connect firm incentives with enforceable monitoring across stages [38].
In parallel, consumer-side studies show that perceived risk and trust are pivotal determinants of acceptance and continued consumption of prepared dishes, implying that reporting and complaint behavior is sensitive to participation frictions and institutional credibility [40]. Empirical evidence suggests that health- and quality-related risk perceptions reduce consumption intention, whereas trust-building measures, such as information disclosure and credible responses, improve acceptance and engagement [41]. Together, this micro-level evidence indicates that governance outcomes depend on the interaction between firm compliance incentives and consumer information feedback, rather than on single-actor regulation alone. Meanwhile, governance-oriented research on China’s prepared dishes highlights persistent bottlenecks in traceability implementation, certification coordination, and regulatory enforcement, suggesting the need to explicitly model how micro-level regulatory tools—inspection frequency and targeting, penalty severity, risk monitoring, and traceability credibility—interact with firm compliance and consumer participation [42].
At the technological level, research has focused on sterilization techniques, advanced physical-field processing, and 3D food printing [43,44,45], which enhance product stability and safety. However, these studies remain largely technical and offer limited insights into the behavioral and regulatory mechanisms essential for long-term governance sustainability.
Overall, three gaps remain: (1) existing studies still lack a unified micro-level mechanism that links regulatory tools to firm compliance and consumer reporting in a dynamic setting; (2) consumer trust and reporting behavior are often discussed descriptively rather than embedded into incentive-compatible governance mechanisms; and (3) few studies capture incident-triggered shifts in strategies and the resulting “scandal–trust–regulation” feedback over time.
2.2. Collaborative Food Safety Governance: From Government Dominance to Multi-Actor Participation
Food safety is a classic case of market failure caused by information asymmetry, making government intervention essential for safeguarding social welfare [46]. However, as food supply chains grow more complex, traditional government-centered regulatory models face increasing challenges, including high monitoring costs and limited coverage [47,48]. Elodie Rouvière et al. [49], for example, highlight structural weaknesses in inspection and enforcement in extended agri-food supply chains.
In response, China introduced the concept of “social co-governance” for food safety in 2013 [50], advocating a multi-actor governance model involving governments, enterprises, social organizations, and consumers. International scholarship echoes this shift. Chris Ansell et al. [51] conceptualized collaborative governance as a process of shared decision-making and joint responsibility among stakeholders, while Carolin Schweizerhof et al. [52] emphasized the effectiveness of coordinated multi-actor engagement in agri-food systems.
Across many jurisdictions, food safety oversight has evolved toward prevention-oriented and risk-based governance [12,13]. The EU’s Official Controls Regulation sets common rules for official controls and enforcement across the agri-food chain, emphasizing risk-based planning and consistency [13]. In the United States, the Food Safety Modernization Act marks a comparable shift by moving the regulatory focus from responding to outbreaks to preventing contamination, with responsibilities distributed across supply chain nodes [12,53]. Internationally, the Codex Alimentarius Commission, jointly run by the Food and Agriculture Organization of the United Nations and the World Health Organization, has advanced principles for national food control systems and issued guidance on the structured assessment and use of voluntary third-party assurance within food control systems, providing an important reference for integrating credible private assurance into public oversight [15,54]. Synthesizing these developments, contemporary food governance is increasingly characterized as a hybrid or co-regulatory regime, in which public regulation and private standards can be mutually reinforcing when supported by transparent accountability and credible enforcement backstops [16].
Consumers play an increasingly important role in this governance architecture. Their purchasing choices, online reviews, and formal complaints can directly shape firms’ quality strategies. Research on sustainable consumption shows that consumer oversight can significantly increase corporate compliance incentives [55,56]. Digital tools, online public opinion, and platform-based reporting mechanisms further enhance transparency and reduce information asymmetry [57,58].
From a sustainability perspective, collaborative governance not only improves short-term monitoring efficiency but also restores long-term social trust and enhances food-system resilience—key dimensions of Sustainable Development Goals (SDGs) 3 (health), 12 (responsible consumption), and 16 (institutions).
2.3. Evolutionary Games in Regulatory Studies: From Static Equilibrium to Behavioral Dynamics
Evolutionary game theory provides a powerful framework for analyzing how boundedly rational actors adjust strategies over repeated interactions. It has been widely applied in the study of supply-chain regulation, environmental governance, and product quality assurance.
In construction-safety governance, Chen Li et al. [59] showed that risk perception significantly affects the strategic stability among crane users, maintenance firms, and regulators. In environmental governance, Xinran Sun et al. [60] demonstrated that cost–benefit structures and penalty intensity critically shape local government strategies, while Zhenhua Zhang et al. [61] showed that public participation enhances the efficiency of smog-control cooperation. In digital economy contexts, Chao Hu et al. [62] analyzed the tripartite interaction among platforms, merchants, and consumers in livestreaming commerce and proposed stage-based regulatory strategies.
Despite these advances, two key limitations remain: (1) Deterministic EGT models struggle to capture abrupt behavioral shifts caused by food-safety crises, media exposure, or sudden policy changes. (2) They provide limited insight into long-term steady-state distributions, which are critical for evaluating governance sustainability. These shortcomings suggest the need for integrating EGT with stochastic modeling approaches capable of capturing random shocks and non-linear transitions.
2.4. Markov Chain Applications in Risk Evolution and Governance: Capturing Random Transitions and Long-Run Stability
Markov chains are particularly suitable for systems where future states depend only on current conditions. Their ability to model random shocks, transitional probabilities, and long-term stationary distributions has made them powerful tools in dynamic governance analysis.
In supply-chain management, Chen Li et al. [59] analyzed inventory decisions under Markov-modulated demand, while Jie Chen et al. [63] examined how risk aversion and quality uncertainty affect ordering and profitability. In economic prediction, Markov chains are widely employed to model stock-market volatility and oil-price fluctuations [64,65]. In emergency management, Shizhen Bai et al. [66] integrated Markov processes with epidemic models to study supply-chain disruption risks.
International studies similarly support the usefulness of Markov approaches in sustainability analysis. Dmitry Ivanov [67] uses Markov chains to simulate supply-chain resilience under disruption, and Alexey Bosov et al. [68] demonstrate their value in analyzing the stability of sustainable governance systems.
However, Markov-based studies typically lack strategic behavioral foundations and do not account for the co-evolution of multi-actor regulatory decisions. Integrating Markov chains with evolutionary game theory thus offers a more comprehensive analytical framework that captures both behavioral adaptation and stochastic disturbances, addressing a key limitation in existing governance literature.
2.5. Summary and Research Contributions
The literature review reveals four primary gaps: (1) Although an emerging stream of studies has examined node-level risks and behavioral mechanisms in prepared-food supply chains, prior work has not yet consolidated micro-level findings into an explicit mechanism linking key regulatory levers—inspection frequency and targeting, penalty severity, risk monitoring, and the credibility and enforcement of traceability—to firm compliance and consumer reporting across supply-chain stages. (2) Existing studies often emphasize short-term deterrence rather than long-term sustainability. (3) Classical evolutionary game models fail to account for random shocks and non-continuous state transitions. (4) Collaborative governance studies rarely incorporate quantitative simulation or sensitivity analysis.
To address these gaps, this study makes two main contributions:
- (1)
- Governance Contribution
We develop a collaborative supervision mechanism for the prepared food industry grounded in the principles of sustainable governance. The model illustrates how regulatory intensity, enterprise integrity, and consumer participation jointly shape the long-term equilibrium among regulation, development, and safety.
- (2)
- Methodological Contribution
By integrating evolutionary game theory with Markov chain modeling, we build a dynamic–stochastic analytical framework that overcomes key limitations of traditional models. This integrated approach captures: (1) dynamic behavioral responses to food-safety incidents; (2) long-run steady-state distributions reflecting governance sustainability; (3) sensitivity patterns that identify leverage points for policy optimization. Together, these contributions provide a theoretical foundation for designing sustainable, multi-actor regulatory systems capable of enhancing resilience in the prepared food industry.
3. Materials and Methods
3.1. Methodological Justification
3.1.1. Rationale for Using an Evolutionary Game Model
The governance of the prepared-food industry is intrinsically complex because it spans a multi-stage supply chain, including raw-material sourcing, standardized processing, cold-chain logistics, and retail or food-service delivery. This structure is accompanied by persistent information asymmetry, fragmented responsibilities across nodes, and recurrent incident risks. In practice, regulators cannot perfectly observe firms’ true quality effort; firms may face short-term incentives to cut corners, and consumers’ willingness to report violations depends on participation costs, trust, and the credibility of regulatory responses. Importantly, these interactions are repeated and adaptive: regulatory effort, firms’ compliance decisions, and consumer participation adjust over time in response to past outcomes and the observed behavior of other actors. A one-shot static game, therefore, cannot capture the feedback loops and path-dependent dynamics that characterize governance in a rapidly expanding sector.
Evolutionary game theory is well suited to this setting. It represents bounded rationality by allowing actors to adjust strategies through payoff-based learning rather than assuming fully informed optimization. It also captures co-evolution at the population level, which is appropriate when governance performance depends on the prevalence of compliant firms, active supervision, and reporting consumers, rather than on a single representative decision-maker. In addition, the framework provides a coherent way to evaluate policy combinations—such as enforcement intensity, penalty severity, and reporting frictions—by examining how they reshape payoffs, alter the attraction toward different strategy profiles, and determine the stability of the desirable collaborative outcome characterized by active supervision, compliant operation, and consumer reporting. Finally, because governance trajectories in this sector can be disrupted by incident-driven shocks and abrupt behavioral shifts, the subsequent Markov-chain analysis is introduced to characterize state-to-state transitions and long-run distributions under uncertainty.
3.1.2. Reasons for Not Employing System Dynamics, Dynamic System Models, or ABM
Although System Dynamics (SD), dynamic system models, and Agent-Based Modeling (ABM) are widely used in complex systems research, each presents notable limitations in the context of this study.
System Dynamics focuses primarily on macro-level causal loops and stock–flow structures, making it difficult to capture micro-level strategy selection driven by payoff differences or to reflect adaptive behavior among bounded-rational agents. Dynamic system models can describe time-dependent changes in variables, yet they lack the intrinsic “replicator dynamics” structure required to explain stable strategies and their payoff foundations in tripartite interactions. They also offer limited capacity for sensitivity analysis regarding policy instruments.
ABM highlights behavioral heterogeneity and agent-level simulation, but its theoretical interpretability is weaker, and outcomes are highly sensitive to parameter assumptions. This makes it challenging to derive reproducible patterns or obtain clearly defined evolutionarily stable solutions.
In contrast, evolutionary game theory provides rigorous mathematical derivation and systematic strategy stability analysis. Therefore, it is adopted as the core analytical tool in this study.
3.1.3. Necessity of Incorporating the Markov Chain Method
While evolutionary game theory is well suited to depicting long-term strategy evolution, its replicator dynamics are fundamentally deterministic and therefore unable to capture random disturbances that frequently occur in real regulatory systems. Examples include sudden food safety incidents (e.g., collective complaints or media exposure), temporary tightening of policies or increases in regulatory resources, and abrupt shifts in firms’ behavior due to short-term aggressive business decisions. These stochastic factors create strategy jumps that deterministic models alone cannot adequately reflect.
Accordingly, it is necessary to incorporate a Markov Chain framework to characterize random transitions between strategy states and to model the corresponding steady-state probability distribution. The Markov Chain approach offers several advantages: (1) describing probability transitions among different strategy combinations; (2) simulating state shifts under short-term random shocks; (3) computing long-run steady-state distributions and identifying absorbing states; (4) evaluating the robustness and sustainability of the collaborative regulatory system in a stochastic environment.
Integrating Markov Chains with evolutionary game theory enables the model to capture both “long-term evolutionary trajectories” and “short-term random perturbations,” providing a more accurate representation of the dynamic characteristics of the regulatory system in the prepared food industry.
3.1.4. Integrated Advantages of the Methodological Framework
In summary, the combined framework of evolutionary game theory and Markov Chain analysis offers several integrated advantages. It simultaneously captures both deterministic evolutionary processes and stochastic state transitions; uncovers the dynamic interaction patterns among governments, firms, and consumers; and enables assessment of how policy instruments influence system convergence speed, stability, and long-term outcomes. This approach is also well aligned with the research goals of sustainable governance and high-quality industrial development.
Therefore, adopting a hybrid “evolutionary game + Markov Chain” methodological system is not only theoretically necessary but also consistent with Sustainability’s emphasis on system complexity, long-term dynamics, and sustainable governance performance.
3.2. Definition of the Three Actors and Their Strategy Sets
The model derivation in this study follows the evolutionary game theory framework proposed by Friedman [69], which integrates classical game theory with dynamic evolutionary processes and is applicable to analyzing the evolutionary group behavior of agents with bounded rationality. This study develops an evolutionary game model of collaborative regulation involving three key actors: local government regulatory departments (hereafter referred to as “government”), prepared food manufacturers (“firms”), and consumers. The overall structure of the model is illustrated in Figure 2. In this study, bounded rationality is operationalized through an evolutionary adaptation mechanism rather than fully informed, one-shot optimization. Actors are assumed to face information asymmetry and limited ability to compute intertemporal optima; thus, they do not choose globally optimal strategies. Instead, they revise their behavioral tendencies over repeated interactions based on payoff feedback: strategies with higher expected payoffs increase in prevalence, whereas strategies with lower payoffs gradually decline. This adaptive updating process is formalized in Section 3.3 using replicator dynamics. The government’s strategy set is defined as = { active regulation, passive regulation}.
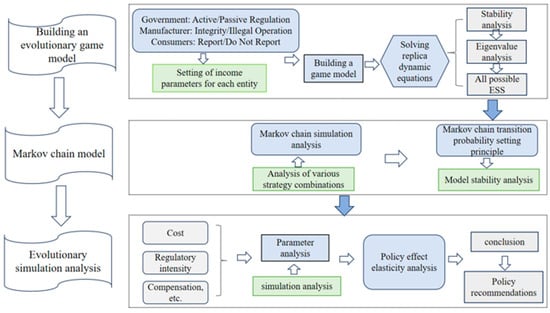
Figure 2.
Framework diagram of the collaborative supervision mechanism of the prepared food industry. Note: The left column summarizes the three main methodological components. In the right panel, blue rounded boxes indicate modelling and analytical procedures, green boxes highlight key parameter-setting or evaluation tasks that connect the modelling steps, and grey boxes denote representative policy levers. Arrows show the analytical workflow, and the dashed bounding boxes delineate the corresponding modules in the overall framework.
When the government adopts an active regulatory strategy, it allocates substantial resources—including personnel and financial inputs—to conduct strict supervision of firms’ production processes. Under a passive regulatory strategy, however, oversight is largely symbolic or limited to occasional sampling inspections. In this study, the government’s regulatory effort is represented by a regulatory-intensity parameter , corresponding, respectively, to active and passive regulation. The firms’ strategy set is defined as = { compliant operation, non-compliant operation}. Compliant operation refers to adhering to food safety standards and following standardized production procedures, whereas non-compliant operation denotes the pursuit of additional profits by reducing quality-related inputs or using substandard raw materials.
The differences between the two strategies adopted by firms are mainly reflected in additional production costs and potential penalty costs . The former captures the extra expenditures required to ensure product quality under compliant operation, while the latter represents fines or reputational losses that may be incurred if non-compliant practices are detected. The consumers’ strategy set is defined as = { report, not report}. When consumers are dissatisfied with product quality, they may report the firm through hotlines, online platforms, or other channels; however, such actions involve certain time and psychological costs, which are represented in this study as reporting costs . Let , , and denote the population shares (strategy frequencies) of choosing active regulation, compliant operation, and reporting, respectively. These shares evolve over time according to payoff-based adaptation. Let the probability that the government adopts active regulation be , and passive regulation be . Likewise, let the probability that firms choose a compliant operation be , and non-compliant operation be . Let the probability that consumers choose to report be , and the probability of not reporting be .
The parameters and descriptions related to the tripartite evolutionary game model for regulating the prepared food industry are presented in Table 1. Based on the settings in Table 1, the government encourages consumers to promptly report any identified quality issues and provides certain rewards and compensatory payments in return. Following the approach of Wang, the monetary reward offered by the government after a consumer report is denoted as , and the appeasement or compensation payment is denoted as . When consumers file false reports, firms may suffer reputational damage or incur additional economic losses, represented by . The quality loss experienced by consumers as a result of firms’ non-compliant behavior is denoted as .

Table 1.
Parameters and descriptions.
This study further assumes that the parameters representing positive or negative social impacts (denoted as or ) are associated only with the government’s social returns and do not directly influence the firms’ economic payoffs. When firms adopt a compliant operation strategy, they not only reduce food safety risks but also generate positive external benefits for the regional economy; the additional governmental benefit arising from such externalities is denoted as . Together, these parameters constitute the payoff foundation for the government, firms, and consumers within the collaborative regulatory evolutionary game. They also provide the basis for constructing the subsequent payoff matrices and replicator dynamic equations.
Based on the above descriptions, the corresponding payoff matrices are presented in Table 2 and Table 3.
Table 2.
The game matrix of each subject under the active supervision of the government .
Table 3.
The game matrix of each subject under the passive supervision of the government .
3.3. Replicator Dynamic Equations and System Stability Analysis
Replicator dynamic equations are essentially differential equations that describe how agents adjust their strategies under bounded rationality to improve their payoffs [70]. Within this evolutionary setting, bounded rationality is modeled as a myopic, payoff-driven adaptation. Specifically, each actor adjusts its strategy share based on the payoff advantage of a strategy relative to the current average payoff, rather than forecasting far into the future or optimizing under full information. Strategy adjustment is therefore gradual and path-dependent, and different long-run outcomes may emerge depending on initial conditions and parameter values. This is a standard bounded-rationality assumption in evolutionary game models, where adjustment is local and payoff-driven. They are used to characterize the evolutionary trajectory of the system and the underlying mechanisms of strategy selection. The tripartite evolutionary game system constructed in this study involves three types of actors—local governments, prepared food manufacturers, and consumers—and their corresponding replicator dynamic equations are formulated as follows.
- (1)
- Replicator Dynamic Equation for the Government
Let the expected payoffs of the government under the strategies of active regulation and passive regulation be denoted as and , respectively, and let represent the average expected payoff. Then
Accordingly, the replicator dynamic equation for the government can be expressed as
- (2)
- Replicator Dynamic Equation for Firms
Let the expected payoffs of firms under the strategies of compliant operation and non-compliant operation be denoted as and , respectively, and let represent the average expected payoff. Then
Accordingly, the replicator dynamic equation for firms can be expressed as
- (3)
- Replicator Dynamic Equation for Consumers
Let the expected payoffs of consumers under the strategies of reporting and not reporting be denoted as and , respectively, and let represent the average expected payoff. Then
Accordingly, the replicator dynamic equation for consumers can be expressed as
In summary, the evolutionary processes of the strategies adopted by the government, firms, and consumers jointly constitute a three-dimensional dynamic system as follows:
The equilibrium points can be obtained directly from the system of replicator dynamic equations. However, determining whether the strategy combinations of the government, firms, and consumers can remain stable in the long run requires the use of Lyapunov’s first stability criterion [71]. According to this method, an equilibrium point is considered an Evolutionarily Stable Strategy (ESS) if all eigenvalues of the Jacobian matrix at that point have negative real parts. Conversely, if at least one eigenvalue has a real part greater than or equal to zero, the equilibrium is unstable. Based on the three-dimensional dynamic system expressed in Equation (13), when the government chooses active or passive regulation or , firms choose compliant or non-compliant operation or , and consumers choose to report or not to report or , the system may contain eight pure-strategy equilibrium points. By substituting each strategy combination into the replicator dynamic equations, the corresponding eigenvalues of the Jacobian matrix can be obtained, as shown in Table 4.
Table 4.
Eigenvalue.
According to Lyapunov’s stability theory, the system reaches an evolutionarily stable state when all eigenvalues have negative real parts. The results in Table 4 indicate that several pure-strategy equilibrium points satisfy this condition and can therefore be regarded as potential ESSs. This suggests that, during long-term evolution, the strategies of the government, firms, and consumers may converge to certain stable combinations, reflecting the properties of repeated mixed-strategy behavior within the game system.
Further analysis shows that when regulatory intensity is insufficient or when penalty–incentive mechanisms are poorly aligned, firms tend to adopt non-compliant practices, while consumers’ willingness to report decreases. As a result, the system may fall into a low-quality stable state. This implies that under spontaneous evolutionary conditions, the current regulatory framework is unlikely to achieve an optimal equilibrium.
To capture the dynamic evolutionary patterns of the system under random state transitions, this study introduces a Markov chain approach in the following section. By analyzing probability transitions among strategy states, the method provides insights into the long-term evolutionary trajectory of the collaborative regulatory system in the prepared food industry. Such analysis offers a theoretical basis for improving governmental regulatory strategies and enhancing overall industry governance.
3.4. Markov Chain Modeling and State Transition Dynamics
Based on the previous stability analysis, the regulatory game involves eight possible locally stable states, each corresponding to a distinct combination of strategies adopted by the government, firms, and consumers. Accordingly, the state space of the Markov Chain can be expressed as . The initial probability distribution of these states, denoted as , is determined by the occurrence probabilities of each strategy combination at the outset of the game. Since mixed-strategy interactions in each stage are mutually independent, the initial probability distribution can be derived using the distribution functions of multidimensional independent random variables. The results are presented in Table 5.
Table 5.
The probability of each initial state.
The one-step transition probability in a Markov Chain refers to the likelihood that the system moves from its current state to the next state. Let the initial state of the system be . The first-step transition process is illustrated in Figure 3, that is , where denotes the probability that the system is in state during the first stage and moves to state in the second stage. By extension, represents the probability that the system transitions from state in stage to state in stage. Thus, .
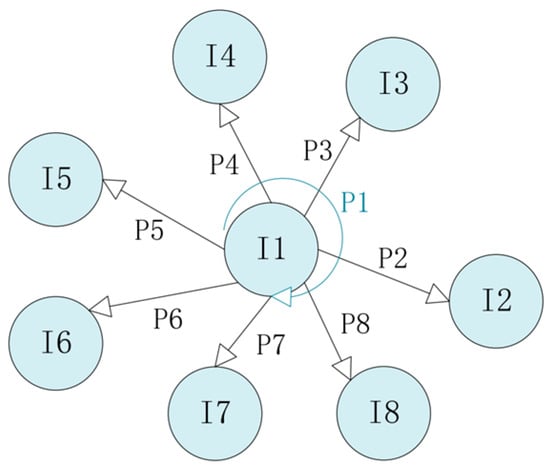
Figure 3.
The process of one-step state probability transfer P(1). Note: The circles denote the states in the Markov-chain state space. Directed arrows indicate possible transitions between states, and the labels represent the corresponding transition probabilities (from the source state to the target state). Color is used only for visual grouping and does not encode additional variables.
To reasonably capture the mutual influence among the strategies of different actors during the game process, this study specifies the following principles for constructing the one-step transition probability matrix of the Markov Chain: (1) When firms adopt compliant (honest) production, the government and consumers tend to shift toward passive regulation and non-reporting in the next stage, so as to avoid excessive intervention in market operations. (2) When firms are found to engage in non-compliant behavior, both the government and consumers will switch to active regulation and reporting in subsequent stages, and will maintain these strategies until firms return to compliant behavior.
These principles reflect the dynamic feedback mechanism embedded in the regulatory system as it responds to changing market behaviors across different stages.
Accordingly, the one-step transition probability matrix of the Markov Chain can be derived as follows:
Let the initial probability of state be as illustrated in Figure 4. The figure shows that as the number of iterations increases, the Markov Chain gradually converges, and the changes in state probabilities become marginal after approximately seven iterations, indicating that the system reaches a stable equilibrium distribution. After 100 iterations, the state probability vector stabilizes at , demonstrating that the Markov Chain exhibits a stationary distribution. This result suggests that the collaborative regulatory system of the prepared food industry will converge to a stable state after repeated strategy interactions, providing a theoretical foundation for subsequent policy simulations and numerical analyses.
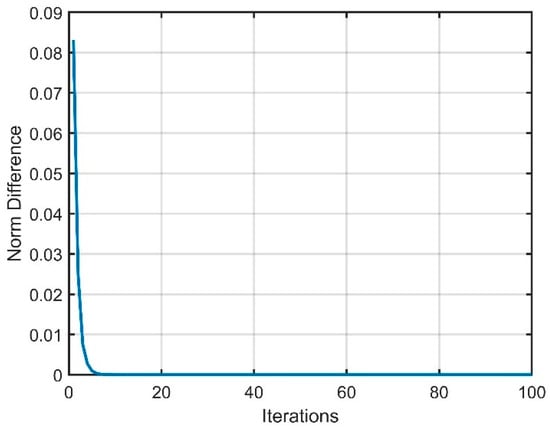
Figure 4.
Stationarity verification of Markov chains .
4. Dynamic Evolution Results and Policy Simulation Analysis
4.1. Markov Chain Simulation Results and State Transitions
Traditional evolutionary game models face limitations in capturing strategy transitions across different time periods. To reveal the long-term dynamic characteristics of the collaborative regulatory system in the prepared food industry, this study incorporates the Markov Chain approach into the previously established modeling framework and conducts simulation analyses.
- (1)
- Basic Principles and Equation Derivation
Based on Equation (15), the Chapman–Kolmogorov (CK) equation is applied to compute the state transition probability matrix for any stage of the process. Let be a Markov chain defined on a discrete state space, with an -step transition probability matrix. Then
where denotes the -step transition probability matrix, which satisfies
This equation captures the stochastic evolution of the system’s state across multiple iterative stages.
- (2)
- Parameter Settings and Simulation Procedure
To simulate the dynamic evolution of the system under different combinations of strategy probabilities, the probabilities of government adopting active regulation (), firms choosing compliant production (), and consumers engaging in reporting behavior () are assumed to vary within the interval [0.1, 0.9] with a step size of 0.1. This yields a total of 729 possible combinations. Using MATLAB R2023b (The MathWorks, Inc., Natick, MA, USA) for iterative computation, the evolution of state probabilities after 100 iterations is obtained, as illustrated in Figure 5. The horizontal axis represents different combinations of strategy probabilities, while the vertical axis denotes the difference between the state probabilities after 100 iterations and their initial distribution.
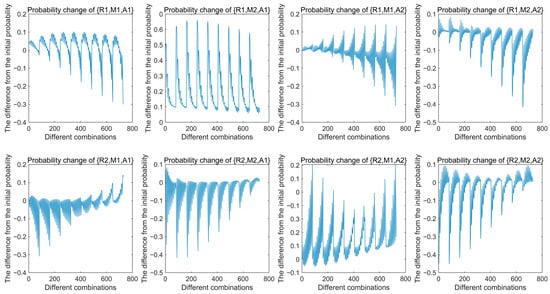
Figure 5.
Changes after 100 iterations of each portfolio strategy.
- (3)
- Simulation Results and Interpretation of Stationarity
As shown in Figure 5, the state probabilities vary considerably across different strategy combinations. After approximately 100 iterations, the probabilities of several states—particularly those involving compliant firms and consumers who choose to report—rise substantially, whereas the probabilities associated with states characterized by passive government regulation and firm non-compliance decline markedly. This pattern indicates that, over the long-term evolutionary process, the system converges toward a stable structure characterized by active government regulation, firm compliance, and consumer reporting. Such convergence suggests that a collaborative regulatory mechanism can effectively enhance the overall efficiency of governance in the prepared food industry.
- (4)
- Simulation-Based Inferences and Mechanism Interpretation
Based on the simulation results, two main inferences can be drawn:
Inference 1: Strengthening collaborative regulation increases the probability of firm compliance.
Proof: Consider the mixed-strategy Nash equilibrium where the probabilities of active government regulation, firm compliance, and consumer reporting are set to 0.65, 0.55, and 0.40, respectively. According to Equation (15), the initial probability distribution of all states is given by , and the distribution after iterations computed in Matlab is denoted as . After adjusting the model by increasing the probability of firm compliance to 0.75, the revised one-step transition probability matrix becomes:
After iterations, the state probability distribution is given by . It can be observed that the probabilities of combinations corresponding to state decrease significantly, while those corresponding to state increase markedly. In addition, except for state , which shows a slight decline possibly due to over-regulation, the probabilities of states , , and all rise. Conversely, the probabilities of combinations , , and decrease. These changes indicate that the likelihood of firms choosing compliant (honest) operations increases, whereas the probability of non-compliant behavior declines.
Inference 2: The Effect of a Single Regulatory Actor Is Limited; Collaborative Regulation Is Most Effective.
Proof: Consider the scenario in which the initial mixed-strategy Nash equilibrium is (0.35, 0.25, 0.40). The initial probability distribution of all states is denoted as , and after iterations, the resulting state probability distribution is given by .
- (5)
- Practical Implications
The simulation results indicate that the collaborative regulatory system in the prepared food industry converges to a relatively stable state after multiple iterations of the game. In this equilibrium, government regulation, firm self-discipline, and consumer supervision achieve a dynamic balance. This stationary distribution reflects the long-term stability of the regulatory system and provides a theoretical foundation for establishing a “multi-stakeholder co-governance” model for food safety regulation in the prepared food sector.
4.2. Parameter Sensitivity and Key Influencing Factors
The parameter design in the evolutionary game–Markov chain framework must ensure both empirical realism and dynamic stability. To enhance external validity, all key parameters are calibrated based on published research, sectoral statistics, and established findings in regulatory economics and food governance. Consistent with methodological practice in evolutionary modeling, all parameters are normalized to the [0, 1] interval to facilitate comparability and maintain boundedness conditions in replicator dynamics. This section outlines the empirical rationale for each parameter, its calibrated range, and its relevance to sustainable governance outcomes.
4.2.1. Setting the Additional Cost for Corporate Integrity Management
The additional cost incurred by firms adopting compliant operation () arises from three components. The first is the input-quality premium: compliant operation typically requires higher-quality raw materials and standardized ingredients, implying a price premium relative to low-quality substitutes, often reported at about 5–15% of raw-material costs [72]. The second component is food-safety management and process-control expenditure, including HACCP implementation and operation, documentation, training, on-site inspection, and cold-chain monitoring, which generates both fixed and variable compliance costs; evidence from China’s food industry indicates that HACCP adoption entails measurable and persistent firm-level expenditures [73,74]. The third component is the opportunity cost of foregone illicit profits: violations such as ingredient substitution and other economically motivated adulteration practices can generate short-term margin gains, implying that compliance also requires giving up these potential returns [75,76,77]. Based on this synthesis, the compliance burden is non-negligible. To ensure empirical plausibility while preserving meaningful strategic heterogeneity and avoiding extreme parameterization that would mechanically lock the system into corner solutions, we set the normalized compliance-cost parameter within 0.15–0.25 (baseline: 0.20) [78].
Calibration note (data basis and normalization). To enhance realism for China’s prepared-food context, the range of is anchored to China-relevant evidence on firm-level HACCP adoption and operating burdens [79]. Since the model normalizes parameters to , is treated as a dimensionless compliance-friction index summarizing input premiums, process-control expenditures, and foregone illicit margins, scaled relative to baseline payoff magnitudes (such as the transaction-value proxy ) in the payoff matrix. Robustness is examined by varying within the stated interval.
4.2.2. Setting the Government Regulatory Cost Parameter
Government regulatory cost () represents the fiscal and operational burden associated with routine sampling, on-site inspection, laboratory testing, and digital monitoring along the prepared-food supply chain. Prior research indicates that enforcement costs are typically high in food-safety governance due to fragmented responsibilities, resource-intensive inspection procedures, and uneven testing capacity across regions, while heterogeneity in laboratory infrastructure and staffing further amplifies spatial variation in enforcement costs [80,81]. Considering these institutional features, we set within 0.45–0.55 (baseline: 0.50), reflecting a relatively high-cost regulatory environment while allowing moderate cross-region variation around the baseline.
Calibration note (China-specific evidence and normalization). To anchor in China’s regulatory practice, we draw on performance disclosures from local inspection and testing institutions as proxies for per-batch sampling and laboratory testing costs; for instance, a disclosed target of an average sampling cost per batch not exceeding 850 RMB illustrates the resource intensity of routine inspection and testing [82]. In addition, public disclosures from the market-regulation system report large-scale nationwide sampling inspection and risk monitoring workloads, implying substantial aggregate fiscal and operational burdens for market-regulation authorities [83]. Because the model normalizes parameters to , we treat as a dimensionless enforcement-cost index and scale it relative to baseline payoff magnitudes in the payoff matrix (including the transaction-value proxy ), and then assess robustness by varying within the stated interval.
4.2.3. Setting of Parameter for Government Regulatory Intensity
To align the active regulation intensity parameter () with observable risk conditions, this study uses national and provincial food-safety supervision sampling releases from 2016–2024, which consistently report overall non-compliance rates at roughly 2–3% (see Figure 6). This persistent pattern indicates that, despite large-scale inspection activities, effective deterrence remains moderate and structural risks continue to exist along the production chain. Representative official disclosures reporting comparable non-compliance levels are available in public releases and sampling analyses [84,85].
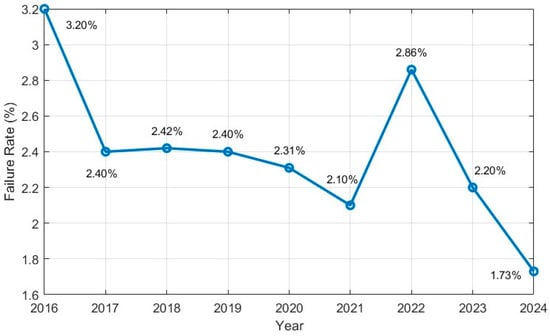
Figure 6.
National food safety sampling failure rate (2016–2024). Note: Annual failure rates (unqualified/non-compliance rates) are compiled from national and provincial food safety supervision communiqués and official reports. Data are compiled from official food-safety supervision sampling communiqués and analyses; representative sources are listed in the References, and the full source list is available upon request.
From a governance perspective, this reflects an enforcement regime that is active but not strong enough to eliminate opportunistic behavior entirely. Accordingly, the active regulation intensity parameter is calibrated within 0.60–0.80 (baseline: 0.70). This medium-to-high band is intended to represent meaningful enforcement capability while preserving strategic heterogeneity and avoiding corner solutions in the evolutionary dynamics (with the passive-regulation intensity set at a lower baseline level).
Calibration note (China-specific evidence and normalization). We interpret as a dimensionless index of effective enforcement intensity (capturing inspection effort, detection capability, and follow-up response) rather than a direct count of inspections. Because the model normalizes parameters to the interval, we calibrate by mapping the observed persistence of non-compliance (around 2–3%) to a plausible enforcement band under two calibration constraints: enforcement must be sufficiently strong to prevent runaway non-compliance, yet not so strong as to imply near-perfect detection and correction that would contradict the consistently non-zero unqualified rates observed in official sampling statistics. This mapping provides an empirically grounded range for while maintaining numerical stability in the replicator dynamics.
4.2.4. Setting of Penalty Parameter
The penalty parameter represents the administrative fine paid by manufacturers to the government once a violation is detected under active regulation, consistent with the payoff setting in Table 1. In practice, food-safety enforcement may also involve confiscation of illegal products and, in severe cases, business suspension or license revocation [86]. These non-monetary sanctions are not modeled as separate terms; instead, their deterrence effect is summarized through the penalty-severity channel (together with related loss terms in the payoff matrix). In enforcement theory, deterrence depends on the expected penalty, which is jointly determined by punishment severity and effective enforcement intensity. Accordingly, in our model captures the severity component, while the active-regulation intensity captures the effective enforcement component.
Calibration note (China-specific legal basis and normalization). China’s food-safety legal framework adopts value-linked, multi-fold administrative fines and confiscation as common sanction mechanisms, with additional escalations for serious violations [87]. To ensure comparability across parameters, is treated as a dimensionless severity index and normalized to by scaling the implied monetary sanction relative to baseline payoff magnitudes in the payoff matrix (including the transaction-value proxy) and applying min–max normalization across a plausible high-deterrence band. Based on statutory upper-bound signals and typical enforcement practice, we set (baseline: 0.45) to represent a high-deterrence environment while preserving strategic heterogeneity in the evolutionary dynamics.
4.2.5. Setting of Consumer Compensation Parameter
Consumer compensation () represents the monetary remedy received by consumers when substandard food products or verified violations lead to economic loss and trigger a formal report. In China, the legal framework provides for compensation and, in qualifying cases, punitive damages [88]. Specifically, the PRC Food Safety Law allows consumers (in addition to claiming losses) to request punitive compensation of either ten times the purchase price or three times the loss, with a statutory minimum for the increased-compensation component, subject to legal conditions [89]. In practice, platform-based dispute-resolution mechanisms may also provide refunds, compensation, or advance-compensation arrangements after verification, which can reduce consumers’ expected recovery costs and affect reporting incentives [90]. Given that the model normalizes parameters to the [0, 1] interval and aims to capture typical, routine remedies rather than extreme punitive outcomes, we set (baseline: 0.10). This range represents a moderate compensation level that can influence reporting incentives without mechanically dominating the payoff structure or eliminating strategic heterogeneity.
Calibration note (China-specific legal basis and normalization). We treat as a dimensionless compensation-intensity index that summarizes (1) the expected monetary remedy received after a verified complaint and (2) the practical availability of administrative channels that facilitate compensation. Statutory punitive-compensation rules provide an upper-bound reference for the severity of consumer remedies in qualifying cases, whereas many day-to-day disputes are resolved through more modest remedies (such as refunds plus limited compensation). Because enforcement effectiveness is captured separately (by regulatory intensity), we adopt a conservative moderate band for and test robustness by varying across the stated interval.
4.2.6. Setting the Cost of Consumer Complaints
The consumer complaint cost parameter captures the participation frictions associated with reporting, including time and opportunity costs, information and evidence-preparation burdens, and psychological costs. In practice, filing a complaint through China’s national 12,315 platform typically requires identifying the business entity, selecting the complaint category, providing detailed descriptions, and submitting supporting materials, which creates non-trivial procedural burdens for consumers [91]. In addition, complaint handling involves administrative processing: under the Interim Measures for Handling Consumer Complaints and Reports, market-regulation departments should decide whether to accept a complaint within seven working days after receipt and inform the complainant, implying that consumers face not only submission costs but also waiting and follow-up costs [92].
Accordingly, we treat as a dimensionless reporting-friction index normalized to the interval. We set (baseline: 0.15) to represent a low-to-moderate level of participation friction consistent with routine online complaint procedures, while preserving strategic heterogeneity and numerical stability in the replicator dynamics. To ensure robustness, Section 4.2.8 conducts a focused cross-parameter analysis by jointly varying the participation friction with two core enforcement levers—active regulation intensity and penalty severity . Specifically, we examine the paired perturbations and to evaluate whether stronger enforcement can compensate for elevated participation frictions and thereby stabilize the evolutionary outcomes.
4.2.7. Integrated Sensitivity Framework
Although each parameter is defined and bounded individually, governance performance in the prepared-food sector is typically shaped by combined policy instruments rather than by a single lever. Therefore, the sensitivity analysis is conducted in two steps. First, we implement one-factor-at-a-time sensitivity tests (Figure 7) around the baseline to quantify the marginal effect of each parameter. Second, we conduct cross-parameter interaction analysis by jointly varying active regulation intensity penalty severity , and consumer reporting cost , and we visualize the resulting high-stability regions through two-way parameter sweeps and heatmaps to identify synergistic or offsetting effects relevant for policy design (Section 4.2.8). In this study, “stability” is operationalized by the long-run system outcome, proxied by the steady-state or long-run average of the firm compliance share. The full parameter definitions and calibrated ranges are summarized in Table 6.
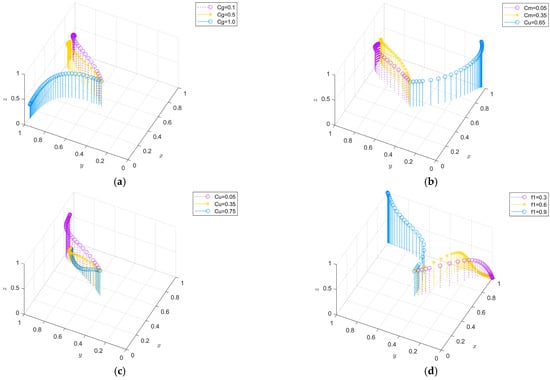

Figure 7.
Effect of changes in each parameter. Note: (a) Effect of the government’s active supervision cost : a higher lowers the probability of active supervision and shifts the system toward passive supervision–non-compliant operation; (b) Effect of firms’ compliance cost : as , firms are more likely to choose non-compliance, and consumers’ willingness to report declines; (c) Effect of consumers’ reporting cost : increasing markedly reduces the reporting probability, weakens external pressure, and increases non-compliance; (d) Effect of regulatory intensity : a higher increases firms’ compliance probability and strengthens consumers’ willingness to report; (e) Effect of penalty level : a higher suppresses non-compliance, showing a pattern similar to increasing regulatory intensity; (f) Effect of consumer compensation : increasing has a limited effect on consumers’ reporting probability compared with government-driven incentives.
Table 6.
The value of each parameter.
In line with the regulatory realities of the prepared food industry, this study selects several key parameters for simulation analysis, including the government’s cost of active supervision (), firms’ compliance cost (), consumers’ reporting cost (), the intensity of government enforcement (), penalty levels imposed on firms (), and the compensation paid to consumers for corporate misconduct (). The simulation results based on these parameters are presented in Figure 7.
- (1)
- Variation in Regulatory Costs (Figure 7a)
Figure 7a shows that as the government’s cost of active supervision () increases, the probability of the government choosing active supervision declines, and the system gradually shifts toward a “passive supervision—non-compliant operation” state. This indicates that rising regulatory costs undermine the government’s incentive to regulate and, in turn, weaken the overall stability of the system.
- (2)
- Variation in Firms’ Compliance Costs (Figure 7b)
Figure 7b indicates that when firms’ compliance cost () increases, enterprises become more inclined to adopt non-compliant behaviors, while consumers’ willingness to report declines, thereby weakening system stability. This suggests that excessively high compliance costs hinder the formation of a healthy regulatory.
- (3)
- Variation in Consumers’ Reporting Costs (Figure 7c)
Figure 7c shows that as consumers’ reporting cost () increases, the probability of reporting declines markedly. The reduction in reporting weakens external pressure on firms, leading to a higher likelihood of non-compliant behavior. This implies that lowering the reporting threshold is a crucial pathway to strengthening social oversight.
- (4)
- Variation in Government Regulatory Intensity (Figure 7d)
Figure 7d indicates that as regulatory intensity () increases, firms become more likely to comply, and consumers show a stronger willingness to report violations. This suggests that strengthening governmental oversight can effectively enhance system-wide coordination and stimulate consumer participation, thereby fostering a positive evolutionary mechanism.
- (5)
- Variation in Penalty Levels (Figure 7e)
Figure 7e shows that increasing the penalty level also suppresses non-compliant behavior, exhibiting a trend similar to that of regulatory intensity. This indicates that appropriately raising penalty strength can enhance the deterrent effect of regulation and promote greater self-discipline among firms.
- (6)
- Variation in Consumer Compensation (Figure 7f)
Figure 7f indicates that increasing the compensation provided by firms to consumers has only a limited impact on consumers’ reporting probability. This suggests that compensation mechanisms offer relatively weak incentives for consumer behavior. Consumers are influenced more strongly by government-driven incentive structures than by compensation offered directly by firms.
- (7)
- Overall Conclusions and Practical Implications
Synthesizing the results in Figure 7a–f, it becomes evident that cost-related factors exert a significant negative impact on system stability, whereas increases in regulatory intensity and penalty strength effectively enhance system stability and promote cooperative dynamics.
Therefore, optimization of regulatory governance in the prepared food industry should focus on three key directions:
- (1)
- Reducing regulatory costs for both government agencies and consumers to alleviate supervision burdens;
- (2)
- Strengthening regulatory enforcement and penalty mechanisms to establish a long-term, stable system of incentives and constraints;
- (3)
- Building a coordinated regulatory framework involving government, firms, and consumers to achieve a dynamic balance between regulatory effectiveness and sustainable industry development.
4.2.8. Cross-Parameter Interaction Analysis
The one-at-a-time sensitivity analysis identifies the marginal effect of each parameter around the baseline, but it cannot reveal whether key policy levers reinforce or offset each other. In collaborative enforcement, governance performance is shaped by the joint configuration of (1) effective enforcement intensity (2) penalty severity and (3) participation frictions represented by the consumer reporting cost . To examine interaction patterns that are most relevant to enforcement design, we conduct a two-factor interaction analysis for the pairs and (see Figure 8).
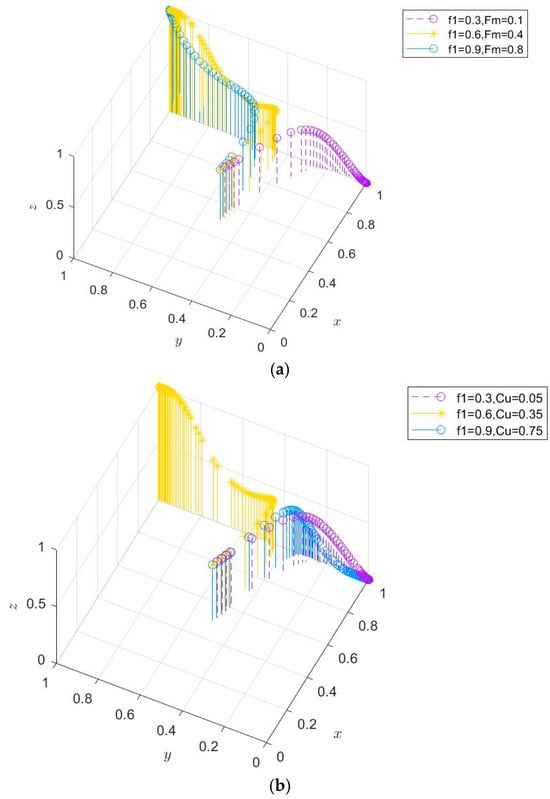
Figure 8.
Cross-Parameter Interaction Analysis: and . Note: (a) Interaction between enforcement intensity and penalty severity under different initial conditions ; (b) Interaction between enforcement intensity and consumer reporting cost under different initial conditions .
Interaction between enforcement intensity and penalty severity . Figure 8a shows a clear complementarity between and . Increasing either lever in isolation improves compliance only partially, whereas strengthening them jointly accelerates convergence toward the compliance-dominant trajectory. When is low, raising does not reliably shift the system away from opportunistic behavior because the expected deterrence remains limited by weak effective enforcement. Conversely, when is low, higher improves oversight but cannot fully stabilize compliant operation because the sanction component is insufficient to keep non-compliance payoff-inferior. When both and increase, the system moves into a larger high-stability region and converges more rapidly to a state characterized by higher firm compliance and stronger collaborative supervision. This result supports the mechanism that expected deterrence is jointly determined by enforcement and punishment, and that policy effectiveness depends on their coordinated calibration rather than single-instrument escalation.
Interaction between enforcement intensity and reporting cost . Figure 8b indicates that acts as a moderator that can weaken the governance gains from higher enforcement intensity. When is low, even a low (which facilitates reporting) does not necessarily produce a compliance-dominant outcome: consumer reports may increase, but if regulatory response is weak or delayed, reporting does not translate into effective correction, and firms’ opportunistic incentives remain. When is high but is also high, consumer reporting becomes infrequent, reducing the flow of distributed information and weakening the co-governance feedback loop; as a result, compliance improvements rely mainly on government inspection alone, which is less effective under information asymmetry and multi-node supply-chain opacity. Overall, the interaction implies that raising enforcement intensity without reducing participation frictions yields diminishing returns, while lowering expands the basin of attraction for collaborative supervision and makes enforcement more cost-effective by improving information feedback and case targeting.
Implication for policy-package design. Together, Figure 8a,b show that governance outcomes are driven by policy packages: (1) and should be increased in a coordinated manner to raise expected deterrence; and (2) lowering is necessary to preserve the effectiveness of enforcement by keeping the consumer feedback channel active, thereby supporting risk-based targeting and faster convergence to high-compliance regimes.
4.3. Policy Scenario Simulation and Comparison of Regulatory Performance
To further examine the stability and regulatory effectiveness of the system under different regulatory strategy combinations, this study constructs three representative policy scenarios based on the Markov chain framework and simulation results: (1) Government-only active regulation; (2) Consumer-only active reporting; (3) Government–consumer coordinated regulation.
These three scenarios correspond to distinct regulatory mechanisms and feedback pathways. By comparing their long-term evolutionary outcomes, we can assess the marginal effectiveness of coordinated regulation and its contribution to enhancing overall regulatory performance in the prepared food industry.
- (1)
- Government-Only Active Regulation
In this scenario, the government’s active regulation probability is increased to 0.65, yielding an equilibrium point of (0.65, 0.25, 0.40), . The simulation results indicate that the system exhibits temporary stability in the early stages. However, after 100 iterations, a portion of firms shift from compliant to non-compliant behavior, and the probability of consumer reporting declines slightly.
This implies that when regulatory pressure relies primarily on the government, violations can be suppressed in the short term, but high regulatory costs and persistent information asymmetry make it difficult for the government to maintain long-term intensive oversight. As a result, the overall system stability weakens.
From an economic perspective, government-only regulation functions as a “cost-driven” mechanism with limited long-term sustainability. It fails to effectively stimulate firm self-discipline or encourage active consumer participation, thereby reducing the overall effectiveness of the regulatory system.
- (2)
- Consumer-Only Active Reporting
In this scenario, the probability of consumer reporting is increased to 0.55, resulting in an equilibrium point of (0.65, 0.25, 0.55), . The simulation results show that active reporting by consumers exerts a certain deterrent effect on firms’ non-compliant behavior, leading to a slight increase in the probability of honest business practices.
However, because government regulatory intensity remains limited, the sanctions following consumer reporting are insufficient, and some violations are not effectively corrected. Thus, consumer-only supervision functions as a “behavior-driven” mechanism—it strengthens public scrutiny and information feedback within the market, but without institutionalized government responses and a robust penalty mechanism, it fails to generate lasting constraints on firms’ behavior.
- (3)
- Government–Consumer Collaborative Regulation
Under the collaborative regulation scenario, the probability of active government regulation is set to , yielding an equilibrium point of (0.65, 0.55, 0.55), . In this configuration, government oversight and consumer reporting jointly form a two-way constraint mechanism.
The simulation results indicate that the system rapidly converges to a stable distribution: the probability of firms engaging in honest business practices increases markedly, while the share of non-compliant behavior drops substantially. Government regulatory efficiency improves, consumer willingness to report violations strengthens, and the three parties develop a self-reinforcing virtuous cycle.
Compared with the first two scenarios, collaborative regulation distributes regulatory burdens more evenly—government oversight is partially offloaded through public participation, and consumer reporting serves as a complementary information channel. This scenario achieves the highest level of long-term system stability and overall performance.
These findings demonstrate that optimal regulatory outcomes emerge only when institutional government oversight and social supervision by consumers interact as complementary forces, jointly supporting a robust and sustainable regulatory framework.
- (4)
- Stakeholder cost–benefit decomposition and burden-sharing under alternative scenarios
The scenario comparison in Section 4.3 indicates that the Government–Consumer Collaborative Regulation setting achieves the highest long-run stability. To explicitly clarify how supervision burdens are distributed between the government and consumers, we conduct a stakeholder-level cost decomposition and quantify the burden-sharing structure under each policy scenario.
For scenario , we use the stationary distribution from the Markov-chain analysis to compute the long-run expected value of each cost component as a probability-weighted average across states . We focus on explicit oversight costs borne by (1) the government and (2) consumers. Specifically, the government’s oversight cost is decomposed into: administrative enforcement expenditure incurred when regulation is active (linked to weighted by the corresponding enforcement intensity), and report-triggered reward payments when consumer reports are verified (linked to ). For consumers, the explicit oversight burden is the reporting cost (linked to ) when consumers choose to report.
Based on these explicit cost components, we define an oversight-burden sharing index:
Table 7 reports the long-run oversight cost components and burden shares across the three policy scenarios, while Figure 9 visualizes the corresponding stacked burden allocation.
Table 7.
Stakeholder cost–benefit decomposition and burden sharing across scenarios.
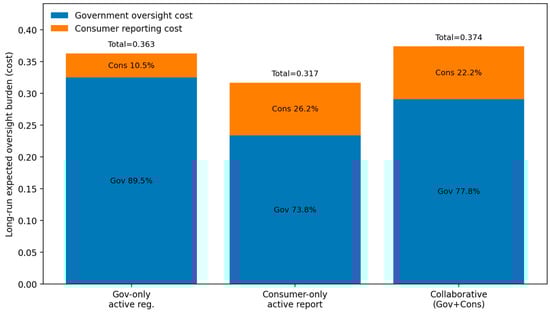
Figure 9.
Oversight-burden sharing across policy scenarios (stacked), based on the stationary distribution.
Results and interpretation. As shown in Table 7, under Government-only active regulation, the long-run supervision burden is dominated by the government: while , implying that the government bears 89.6% of total oversight cost (), whereas consumers bear only 10.4% (). Under Consumer-only active reporting, the consumer burden increases to , and the government burden decreases to , yielding a more distributed structure (, ) and a lower total burden . Under Government–consumer collaborative regulation, the burden allocation becomes more balanced than in the government-only regime: and , corresponding to and . This indicates that collaboration does not eliminate supervision costs; instead, it reallocates part of the information-acquisition burden from costly administrative enforcement to distributed consumer reporting, while maintaining deterrence through the joint configuration of regulatory intensity and penalty severity. Therefore, collaborative regulation achieves superior long-run stability together with a more balanced oversight-burden allocation across stakeholders.
- (5)
- Robustness check with heterogeneous actor characteristics.
The baseline model assumes homogeneous populations, meaning that governments, firms, and consumers share the same payoff parameters. To test generalizability under heterogeneity, we allow key actor characteristics to vary around the baseline calibration. Specifically, government-related parameters capture enforcement capacity and supervision costs, firm-related parameters capture compliance costs and gains from noncompliance, and consumer-related parameters capture reporting costs and responsiveness to compensation. For each parameter , we set , where . We generate heterogeneous parameter draws and, for each draw, simulate the replicator dynamics from multiple random initial states on . As shown in Figure 10, trajectories consistently converge to the same attractor, indicating that the qualitative evolutionary stability and the scenario-comparison conclusions are robust to heterogeneous actor characteristics rather than being driven by a specific homogeneous calibration.
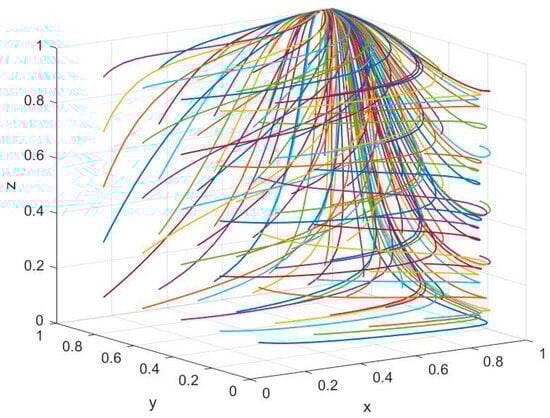
Figure 10.
Phase portrait of the three-population replicator dynamics under heterogeneous actor characteristics. Note: Evolutionary trajectories simulated under heterogeneous parameter draws with random initial states. Each colored curve denotes one trajectory (one draw and one initialization); colors are for visual separation only and do not represent different parameter levels. All trajectories converge to the same attractor, indicating robust qualitative stability under heterogeneity.
Each curve corresponds to one simulation with a randomly drawn heterogeneous parameter set and a random initial state. The trajectories converge toward the same attractor near the boundary , demonstrating that the system’s evolutionary stability is robust to heterogeneity in government enforcement, firm compliance incentives, and consumer reporting preferences.
- (6)
- Comprehensive comparison and conclusionThe dynamic evolutionary results across the three regulatory scenarios reveal several consistent patterns and provide clear policy implications for the governance of the prepared-food supply chain.
- (1)
- Government-only regulation can strengthen oversight in the short run, but it is difficult to sustain. This regime requires substantial administrative resources and tends to suffer from delayed information feedback and persistent enforcement pressure. Over time, these structural constraints undermine long-run stability and limit the formation of a durable governance arrangement.
- (2)
- Consumer-only monitoring relies primarily on individuals’ willingness to report and their tolerance for reporting costs. Such participation is inherently fragile and subject to behavioral volatility, especially when institutional support is weak. As a result, consumer-only monitoring cannot reliably maintain quality and safety oversight in a complex, multi-stage supply chain.
- (3)
- Government–consumer co-regulation outperforms the other regimes by combining the institutional capacity of government enforcement with the distributed information advantages of consumers. This complementarity improves feedback speed and transparency, thereby accelerating convergence and strengthening long-run stability. Importantly, the added stakeholder-level analysis clarifies that collaboration does not eliminate supervision costs; rather, it redistributes the burden in a more balanced manner. As reported in Table 7 and visualized in Figure 9, the government-only regime places the overwhelming share of the explicit oversight burden on the government, whereas co-regulation shifts part of the information-acquisition effort to consumer reporting while keeping government enforcement as a credible backbone. This burden-sharing structure helps sustain deterrence and supports stable system performance.
- (4)
- Robustness to heterogeneous actor characteristics. The scenario-comparison conclusions are not driven by a specific homogeneous calibration. As shown in Figure 10, each trajectory corresponds to one simulation with a randomly drawn heterogeneous parameter set and a random initial state. The trajectories consistently converge toward the same attractor (near the boundary equilibrium identified in the baseline analysis), indicating that the qualitative evolutionary stability and the relative ranking of policy scenarios remain robust under heterogeneity in government enforcement intensity, firm compliance incentives, and consumer reporting preferences.
Taken together, these findings indicate that cooperative regulation is the most effective scenario for improving governance efficiency and strengthening system resilience in the prepared-food supply chain. Therefore, the regulatory framework should evolve toward a multi-actor collaborative governance system that is government-led, firm-centered, and actively supported by consumers and social organizations. In practice, policymakers can enhance performance by jointly deploying: (1) well-designed incentive mechanisms (including reporting rewards and appropriate compensation rules), (2) information-transparency tools such as digital traceability, (3) differentiated and risk-based enforcement strategies, and (4) timely feedback and learning mechanisms. This integrated approach can lower the effective cost of oversight, increase the probability of detecting violations, and foster a long-term, adaptive, and sustainable quality-and-safety governance regime.
4.4. Policy Effect Elasticity Analysis
To further quantify the impact of different policy parameters on the evolutionary stability of the regulatory system in the prepared food industry, this study develops a policy effect elasticity analysis model based on the preceding simulation results. The model calculates the relative change in firms’ probability of honest operation when key policy variables vary by 10%, thereby revealing the dynamic relationship between policy intensity and regulatory stability. The policy effect elasticity coefficient used in this study is defined as follows:
where and denote the probability of firms’ honest operation before and after the policy adjustment, respectively; and represent the initial value and the adjusted value of the corresponding policy variable (e.g., regulatory intensity or reporting cost). indicates that an increase in the variable promotes honest operation, whereas indicates that an increase in the variable inhibits honest operation.
As shown in Table 8 and Figure 11, strengthening government regulatory intensity and increasing penalty levels exhibit the most pronounced positive effects on firms’ honest operation, with elasticity coefficients exceeding 10%. This indicates that enhanced regulation and stricter sanctions are pivotal to maintaining system stability. In contrast, a rise in firms’ compliance costs reduces the probability of honest operation by about 9.8%, suggesting that cost pressures exert a significant deterrent effect on compliant behavior.
Table 8.
Elasticity analysis of policy variables on the probability of firms’ honest operation.
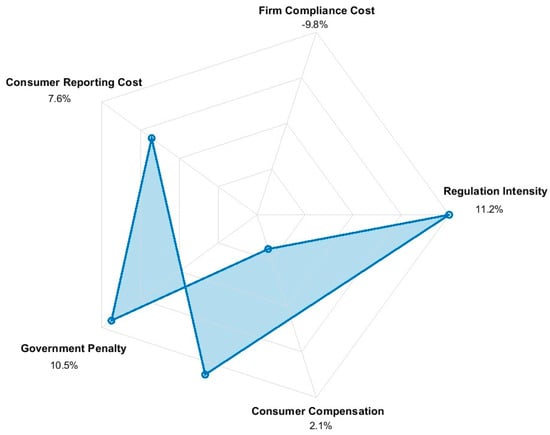
Figure 11.
Radar chart of policy effect elasticity.
From the consumer perspective, lowering reporting costs substantially reinforces social oversight, whereas the marginal effect of increasing compensation is relatively limited. These findings imply that policy design should strike a balance between regulatory strength and cost inputs, enhancing overall regulatory performance through a combination of incentives and constraints.
5. Discussion
5.1. Comparison with Existing Studies
The findings of this study enrich and extend the growing body of research on food-safety regulation, evolutionary governance models, and multi-actor coordination. Overall, the results demonstrate substantial convergence with prior work while offering important methodological and conceptual extensions.
Industry-specific nuances of the prepared-food sector. Compared with many conventional food categories, the prepared-food sector operates through a multi-stage chain that links raw-material sourcing, centralized pre-processing in central kitchens, cold-chain logistics, and platform-enabled retail and food-service delivery. It also relies heavily on standardized processing and strict temperature control, and it features rapid product turnover with high SKU complexity. These characteristics increase information asymmetry and disperse accountability across nodes, which limits the effectiveness of routine inspections alone and makes consumer-generated signals and feedback more valuable as complementary monitoring inputs. In addition, governance risks in prepared foods are often incident-driven, with episodic events triggering sudden changes in enforcement pressure and compliance behavior. This sectoral feature motivates the use of a dynamic–stochastic modeling framework and distinguishes our findings from studies that focus on more stable and slowly evolving food supply chains.
First, our conclusion that government–consumer collaborative supervision significantly increases the long-run probability of honest firm behavior is consistent with recent tripartite evolutionary-game studies. Prior research shows that multi-actor participation alters firms’ incentive structures, improves compliance, and stabilizes cooperative equilibria by incorporating informational, reputational, and sanction-based mechanisms [24]. Consistent with these findings, our model shows that when consumers actively report violations and regulators provide credible enforcement, honest-operation strategies become self-reinforcing in the long run. This effect is particularly pronounced for prepared foods because cold-chain and multi-node processing amplify information gaps; consumer reporting, therefore, serves as a critical, low-cost signal that complements limited inspection coverage and improves effective detection.
Second, the sensitivity-analysis results highlight the critical role of cost structures—including regulatory costs, reporting burdens, and compliance expenses—in shaping governance outcomes. This aligns with empirical studies showing that HACCP adoption, traceability implementation, and process-control investments impose substantial fixed and variable costs on firms [93]. Similarly to existing economic and behavioral models, our simulations show that when compliance costs approach or exceed expected penalties, defection becomes more attractive, leading to unstable or oscillatory system trajectories. Prepared-food firms typically face higher and more variable compliance costs due to standardized processing, documentation, and cold-chain monitoring requirements, which explains why the system is especially sensitive to integrity-management cost and why targeted cost-reduction measures (shared testing, pooled traceability services) can yield large governance gains.
Third, our finding that punishment intensity must be matched with regulatory effort echoes classical enforcement theory. As Polinsky and Shavell [94] emphasize, deterrence depends on the expected penalty—punishment magnitude multiplied by detection probability. Recent food-safety research similarly shows that fines alone cannot guarantee compliance if inspection coverage remains insufficient [95]. Our simulations confirm this principle: only when penalty levels and regulatory intensity are jointly calibrated does the system converge rapidly to compliance-dominant equilibria. This matching requirement is especially relevant for prepared foods, where high SKU complexity and multi-node cold-chain operations reduce routine inspection coverage, making deterrence effective only when sanction severity is paired with sufficient enforcement intensity.
Fourth, this study contributes to a methodological shift toward dynamic–stochastic governance modeling. A growing number of studies integrate evolutionary dynamics with stochastic processes—such as delay effects, random disturbances, or Markovian transitions—to capture path dependence and shock-driven state changes [20,21,23]. Our application of a Markov chain to compute stationary distributions extends this literature by providing quantitative long-run predictions for a specific sector (the prepared-food industry). The observation that the system converges to a stable stationary distribution after repeated transitions validates the robustness of collaborative supervision even under uncertainty. The incident-driven nature of prepared-food governance—where public exposure or sudden shocks can trigger rapid regulatory responses and strategy shifts—makes stochastic state transitions more realistic than purely smooth deterministic evolution, thereby strengthening the relevance of the Markov-chain extension.
Fifth, our results regarding reporting-cost reduction and information transparency align with evidence from digital-platform governance and blockchain-enabled traceability studies. Prior work shows that transparent information flows reduce compliance opportunism and reshape cost–benefit structures for firms [93,96]. Our model similarly indicates that reducing consumer reporting costs enlarges the basin of attraction for honest strategies and enhances the effectiveness of collaborative supervision. In the prepared-food sector, traceability and transparent information flows across central kitchens, cold-chain logistics, and platform channels are particularly important for reducing opacity and enabling faster identification of high-risk nodes.
Sixth, empirical research on consumer trust, complaint behavior, and perceived regulatory effectiveness supports the behavioral mechanisms incorporated in our model. Consumers’ willingness to report depends strongly on perceived costs, expected platform response, and institutional credibility [25,97]. Consistent with these findings, our results suggest that unless reporting barriers and psychological burdens are reduced, consumer participation will remain limited, weakening multi-actor governance. This behavioral channel is salient for prepared foods because consumers often rely on platform information and institutional response to update trust under frequent product turnover and limited direct observability of processing practices.
Finally, our findings contribute to the literature by integrating (1) a tripartite evolutionary game tailored to the prepared-food sector, (2) a stochastic Markov-chain mechanism to capture sudden state shifts, and (3) sensitivity analyses grounded in sectoral parameters. While existing studies often focus on static equilibrium or single-technology interventions (e.g., blockchain adoption), few incorporate stochastic state transitions or compute steady-state distributions. Our framework, therefore, fills a methodological and application-level gap and provides a more realistic representation of governance evolution in rapidly expanding food industries.
5.2. Contributions to the Regulatory System and Sustainable Governance
From a governance perspective, this study offers meaningful implications for designing a sustainable, stable, and resilient regulatory framework for the prepared-food industry.
Collaborative supervision as a mechanism for strengthening regulatory capacity. The results indicate that a collaborative regulatory architecture—integrating government enforcement, firms’ compliance incentives, and consumer reporting—can operate as a self-reinforcing governance loop. When enforcement is credible and information feedback is timely, regulators can enhance effectiveness without relying solely on continual administrative expansion. This contributes to the design of regulatory systems by clarifying how co-governance can internalize distributed monitoring functions and sustain high compliance probabilities under bounded rationality.
Cost-effective compliance improvement through calibrated policy mixes. Rather than implying that stricter regulation is always superior, the analysis identifies a practical “matching zone” among regulatory intensity, penalty severity, and reporting costs. Excessively high enforcement costs or reporting burdens may weaken stability and slow convergence, whereas moderately calibrated costs combined with well-aligned penalties can accelerate convergence toward compliance-dominant outcomes. For the food industry, this implies that differentiated and cost-effective policy packages are more likely to motivate investments in integrity management, traceability, and process control, because they make the expected payoff from compliance consistently exceed that from opportunistic strategies.
Consumer empowerment by reducing participation frictions and improving institutional responsiveness. The model highlights that consumer participation is pivotal but conditional: reporting behavior is sensitive to perceived costs and expected institutional response. Lowering participation frictions—such as procedural complexity, time costs, and psychological burdens—while improving the transparency and credibility of case handling can enlarge the basin of attraction for compliant behavior. This enriches consumer-oriented governance research by linking participation frictions to long-run system outcomes and by specifying where consumer-facing interventions, including streamlined reporting channels, clear remedy rules, and transparent feedback mechanisms, can be most effective.
Resilience of collaborative supervision under shocks and uncertainty. The Markov-chain analysis further shows that collaborative supervision maintains a high long-run probability even under stochastic disturbances, including episodic incidents, temporary enforcement shocks, and abrupt shifts in firm behavior. This suggests structural resilience and provides an operational basis for regulators to design governance systems that remain robust during rapid industry expansion and under uncertainty.
Overall, these contributions support progress toward the Sustainable Development Goals, particularly Good Health and Well-Being, Responsible Consumption and Production, and Strong Institutions, by strengthening public-health protection, promoting responsible industry conduct, and enhancing the durability and credibility of enforcement institutions.
5.3. Limitations and Directions for Future Research
Despite offering a comprehensive analytical framework that integrates evolutionary game theory and Markov-chain modeling, several limitations remain.
- (1)
- Simplifying assumptions and lack of heterogeneity.
The model assumes homogeneous payoffs and strategy sets across actors. In reality, differences exist among regional regulators, firms of varying sizes, and consumer groups. Future work may incorporate heterogeneous payoff structures, multi-population evolutionary games, or agent-based models to capture behavioral diversity.
- (2)
- Absence of networked interaction structures.
The present analysis assumes global and fully mixed interactions. However, food-supply systems typically operate through complex networks. Incorporating network topologies—such as scale-free or small-world structures—could enhance structural realism and identify network-driven governance mechanisms.
- (3)
- Theoretical rather than empirical calibration of transition probabilities.
The Markov-chain transition matrix was constructed based on theoretical assumptions rather than empirical estimation. Future studies could calibrate transition probabilities using micro-level firm behavior data, consumer complaint records, or regulatory enforcement datasets to validate model predictions.
- (4)
- Lack of multi-objective policy optimization.
This study focuses primarily on system stability and does not explicitly evaluate trade-offs among regulatory costs, social welfare, risk reduction, and industrial development. Integrating multi-objective optimization techniques could enrich the practical relevance of policy simulations.
- (5)
- Static payoff assumptions without learning, belief updating, or reputation effects
Real-world actors adjust behavior through experience accumulation, belief updating, and reputation formation. Incorporating dynamic learning processes or Bayesian updating into future evolutionary models would enable a more realistic analysis of regulatory evolution.
5.4. Policy Implications and Practical Recommendations
Drawing on the evolutionary-game results and the Markov-chain simulations, this section translates the main findings into practical recommendations for governments, firms, and consumers to strengthen the sustainability and effectiveness of collaborative supervision in the prepared-food sector. Although the analysis is developed for China’s prepared-food sector. These recommendations are summarized as a policy toolkit in Table 9. The proposed policy toolkit is transferable to other food categories and jurisdictions that share three features: multi-node supply chains, information asymmetry, and limited enforcement capacity. In contexts with lower regulatory capacity, priority should be given to lowering reporting frictions and improving risk-based targeting; in contexts with higher capacity, emphasis can shift toward data integration and differentiated sanctions.
Table 9.
Policy Toolkit for Collaborative Regulation in the Prepared-Food Industry.
(1) Government level: build a data-driven, risk-based, and coordinated governance system. A differentiated, risk-based regulatory regime should be adopted, with enforcement intensity guided by firm size, compliance history, product risk, and critical supply-chain nodes. Inspection resources should prioritize high-risk products and repeat offenders to improve cost-effectiveness. Regulatory capacity can be strengthened through digital tools and interoperable data infrastructures that enable real-time monitoring of cold-chain conditions, processing control points, and traceability records. Cross-departmental data sharing and coordinated enforcement should be enhanced to reduce regulatory fragmentation and enable joint risk assessment, coordinated inspections, and mutual recognition of penalties. Finally, incentives and sanctions should be calibrated: severe violations should face combined measures (administrative penalties, credit downgrades, market-access restrictions, and suspension), while credible compliant firms should receive positive incentives to make compliance consistently more profitable than non-compliance.
Implementation cues and evaluation metrics. These measures can be operationalized through risk-based inspection allocation rules, a unified “complaint–verification–action–feedback” workflow with clear processing deadlines, and standardized data interfaces connecting inspection records, traceability systems, and platform complaints. Progress can be tracked using measurable indicators, including the supervision-sampling non-compliance rate, average complaint handling time, repeat-violation rate, traceability coverage at key nodes, and the share of inspections triggered by risk signals (complaints, abnormal cold-chain logs, or credit downgrades).
(2) Enterprise level: strengthen self-regulation and incentive-compatible quality management. Firms should build end-to-end quality management systems and adopt HACCP-based standardized processing with full-chain control from raw materials to logistics. Internal incentive and constraint mechanisms should be aligned with quality outcomes by embedding food-safety performance into employee evaluation, bonuses, and promotion criteria. Firms should also improve transparency by strengthening traceability and participating in standard-setting activities, which can enhance consumer trust and facilitate external oversight. Leading enterprises can further support small and medium-sized firms through shared standards, joint inspections, and technology diffusion to improve supply-chain resilience.
Implementation cues and evaluation metrics. Practical implementation can include control-point monitoring protocols, periodic third-party audits, and corrective-action routines triggered by non-compliance. Suggested indicators include control-point deviation frequency (such as cold-chain temperature excursions), audit pass rate, batch-level traceability completeness, complaint and return rate, and corrective-action closure time after a non-compliance finding.
(3) Consumer level: reduce participation frictions and institutionalize feedback mechanisms. Consumer participation can be strengthened by reducing reporting burdens and improving the credibility of institutional responses. Governments and platforms should develop unified complaint portals with streamlined reporting, evidence-upload guidance, intelligent case routing, and transparent status tracking. Verified complaints and public-opinion signals should be integrated into risk assessment and firm credit evaluation to form a closed-loop mechanism from complaint to verification, enforcement action, and feedback. In addition, diversified co-governance channels—such as reputation-rating systems and transparency initiatives—can generate sustained external pressure and reinforce industry self-regulation.
Implementation cues and evaluation metrics. Participation can be institutionalized through standardized reporting templates, real-time tracking, and time-bound feedback rules. Key indicators include reporting completion rate, verified (valid) report ratio, average feedback time to reporters, satisfaction with case handling, and the extent to which complaint signals are incorporated into inspection targeting and risk scoring.
5.5. Practical Implementation and Transferability Across Regulatory Contexts
The simulation findings are actionable across different regulatory contexts once policy levers are mapped to three core mechanisms: enforcement capacity (), deterrence severity (), and participation frictions (). Because deterrence is driven by the joint configuration of these mechanisms, policy packages should be adapted to local capacity rather than implemented as uniform “one-size-fits-all” rules.
Context 1: High-capacity regulators (testing infrastructure). Priority should be placed on calibrated penalty design and risk-based inspections to maintain a high expected penalty with lower marginal enforcement costs. Digital traceability data can be used to concentrate inspections on critical nodes and to accelerate case closure.
Context 2: Capacity-constrained regulators (limited testing resources; fragmented cold chains). The most cost-effective entry point is to reduce reporting frictions and institutionalize consumer feedback as a distributed information channel. Incentive-compatible reward mechanisms can increase effective detection without proportionally increasing fiscal burden.
Context 3: Platform-dominated retail and delivery markets. Policy can leverage platform data (complaints, ratings, refunds, temperature logs) to construct dynamic risk scores, enabling rapid targeting of high-risk firms and products and accelerating convergence toward compliance.
Context 4: SME-dominated, highly fragmented supply chains. Governance should rely on leading firms, group standards, and shared audit services to reduce compliance-cost dispersion and stabilize the system.
Staged implementation roadmap. In the short run, regulators can standardize the “complaint–verification–action–feedback” loop and adopt risk-based inspection allocation. In the medium run, interoperable traceability and cold-chain monitoring should be expanded at critical control points (CCPs) and linked to credit evaluation and enforcement prioritization. In the long run, cross-department data sharing, joint enforcement, and differentiated incentives for consistently compliant firms can institutionalize collaborative governance. These mechanisms are consistent with widely adopted international regulatory toolkits, including risk-based official controls in the EU, prevention-oriented compliance systems under the U.S. Food Safety Modernization Act, and the growing use of credible third-party assurance and private standards to complement public oversight within a co-regulatory logic [12,13,15,16].
These steps contribute to sustainable governance at a broader scale by reducing systemic food-safety risks (SDG 3), strengthening transparency and responsible production (SDG 12), and improving institutional credibility through consistent enforcement and participatory oversight (SDG 16).
6. Conclusions
6.1. Key Findings
- (1)
- Collaborative supervision strengthens long-run compliance. In the collaborative regulation setting, joint government enforcement and consumer reporting accelerate convergence toward a stable outcome and increase the long-run likelihood of firm compliance (exceeding 0.55 in the baseline calibration), while reducing the prevalence of opportunistic behavior.
- (2)
- Cost frictions materially shape governance stability. Higher enforcement costs, higher firm compliance costs, or higher consumer reporting costs shift actors toward less active strategies and move the system away from high-compliance stability regions, weakening the effectiveness of supervision.
- (3)
- Deterrence depends on policy coherence. Strong governance performance arises when enforcement intensity and penalty severity are jointly aligned. Adjusting either instrument in isolation produces weaker effects than coordinated policy packages that raise expected deterrence while managing supervision burdens.
- (4)
- Collaborative regulation is robust under uncertainty. The Markov-chain results indicate rapid convergence to a stationary distribution (approximately seven iterations in the baseline setting) and stable long-run behavior under stochastic disturbances, supporting the resilience of the collaborative governance mechanism.
6.2. Theoretical Contributions
This study advances collaborative food-safety governance research by coupling a tripartite evolutionary game (government–firms–consumers) with a Markov-chain state-transition mechanism, enabling long-run probabilistic predictions under bounded rationality and uncertainty. The detailed theoretical and practical contributions are discussed in Section 5.2.
6.3. Limitations and Future Research
This study is subject to limitations related to parameter proxies, stylized transition rules, and abstraction from heterogeneity and additional actors. Future work should incorporate richer China-specific microdata and heterogeneous agent settings to strengthen external validity; a detailed discussion is provided in Section 5.3.
Author Contributions
Conceptualization, W.C. and J.C.; methodology, W.C.; software, W.C.; data curation, W.C.; formal analysis, W.C.; investigation, W.C.; visualization, W.C.; writing—original draft preparation, W.C.; writing—review and editing, W.C., J.C., L.L. and G.X.; validation, L.L. and G.X.; Supervision, J.C.; project administration, J.C.; resources, J.C.; funding acquisition, J.C. All authors have read and agreed to the published version of the manuscript.
Funding
This research was funded by the Science and Technology Department of Xinjiang Uygur Autonomous Region (Xinjiang Science and Technology Major Project), project “Development Paradigm and Effect Evaluation of Ecological Agriculture in Modern Irrigation Areas in Arid Regions”, Project No. 2023A02002-6.
Institutional Review Board Statement
Not applicable.
Informed Consent Statement
Not applicable.
Data Availability Statement
No new external datasets were created in this study. All model equations, parameter settings, and results necessary to interpret the findings are provided within the article.
Conflicts of Interest
The authors declare no conflicts of interest.
References
- Qaim, M. Globalisation of agrifood systems and sustainable nutrition. Proc. Nutr. Soc. 2017, 76, 12–21. [Google Scholar] [CrossRef]
- National Bureau of Statistics of China. National Economy Witnessed Momentum of Recovery with Positive Developments in 2023. 2024. Available online: https://www.stats.gov.cn/english/PressRelease/202401/t20240117_1946605.html (accessed on 15 December 2025).
- Central Committee of the Communist Party of China. 2023 Central No. 1 Document: Opinions on Doing a Good Job in Comprehensively Promoting Rural Revitalization in 2023 (Full Text). 2023. Available online: https://www.lswz.gov.cn/html/xinwen/2023-02/13/content_273655.shtml (accessed on 15 December 2025).
- State Administration for Market Regulation and Other Five Central Departments. Notice on Strengthening Food Safety Supervision of Prepared Dishes and Promoting High-Quality Development of the Industry. 2024. Available online: https://www.gov.cn/lianbo/bumen/202403/content_6940806.htm (accessed on 15 December 2025).
- Ali, I.; Nagalingam, S.; Gurd, B. A resilience model for cold chain logistics of perishable products. Int. J. Logist. Manag. 2018, 29, 922–941. [Google Scholar] [CrossRef]
- CCTV News. CCTV “3·15” Investigation Exposed Improperly Handled “Neck Meat” Used in Meicai Kou Rou Prepared Dishes. CCTV News. 2024. Available online: https://news.cctv.com/2024/03/16/ARTImAYOzmwGkrGNlMIhPE0m240316.shtml (accessed on 15 December 2025). (In Chinese).
- State Administration for Market Regulation (SAMR). Press Conference Transcript: “Conducting Full-Chain Sampling Inspection and Strengthening Full-Chain Supervision” (Five Typical Food Safety Cases Released). 2025. Available online: https://www.fxhz.gov.cn/content/2025/1023493.html (accessed on 15 December 2025). (In Chinese)
- State Administration for Market Regulation (SAMR). Announcement on Food Safety Supervision Sampling Inspection by Market Regulation Departments in the First Quarter of 2024 (No. 16, 2024). 2024. Available online: https://www.bypc.gov.cn/zfxxgk/bmdwxzjd/bmdw/qscjdglj/fdzdgknr/ssjgk/art/2024/art_e4763cac0e9f4ef391ffd3fe697d53cb.html (accessed on 15 December 2025). (In Chinese)
- Ansell, C.; Gash, A. Collaborative governance in theory and practice. J. Public Adm. Res. Theory 2008, 18, 543–571. [Google Scholar] [CrossRef]
- Emerson, K.; Nabatchi, T.; Balogh, S. An integrative framework for collaborative governance. J. Public Adm. Res. Theory 2012, 22, 1–29. [Google Scholar] [CrossRef]
- Gao, H.; Dai, X.; Wu, L.; Zhang, J.; Hu, W. Food safety risk behavior and social co-governance in the food supply chain. Food Control 2023, 152, 109832. [Google Scholar] [CrossRef]
- U.S. Food and Drug Administration (FDA). Food Safety Modernization Act (FSMA). Available online: https://www.fda.gov/food/guidance-regulation-food-and-dietary-supplements/food-safety-modernization-act-fsma (accessed on 24 December 2025).
- European Parliament and of the Council. Regulation (EU) 2017/625 of the European Parliament and of the Council of 15 March 2017 on official controls and other official activities performed to ensure the application of food and feed law, rules on animal health and welfare, plant health and plant protection products (Official Controls Regulation). Off. J. Eur. Union 2017, L 95, 1–142. Available online: https://eur-lex.europa.eu/eli/reg/2017/625/oj/eng (accessed on 24 December 2025).
- World Health Organization (WHO). WHO Global Strategy for Food Safety 2022–2030; WHO: Geneva, Switzerland, 2022; Available online: https://cdn.who.int/media/docs/default-source/food-safety/who-global-strategy-food-safety-2022-2030.pdf (accessed on 24 December 2025).
- Codex Alimentarius Commission. Principles and Guidelines for the Assessment and Use of Voluntary Third-Party Assurance Programmes; CXG 93-2021; FAO/WHO: Rome, Italy, 2021; Available online: https://www.fao.org/fao-who-codexalimentarius/sh-proxy/es/?lnk=1&url=https%253A%252F%252Fworkspace.fao.org%252Fsites%252Fcodex%252FStandards%252FCXG%2B93-2021%252FCXG_093e.pdf (accessed on 24 December 2025).
- Henson, S. Lessons from Private Food Safety Standards as a Governance Mechanism for Agri-Food Value Chains; Working Paper (World Development Report 2025 Background Paper); The World Bank: Washington, DC, USA, 2025; Available online: https://thedocs.worldbank.org/en/doc/360e477d92038c69be582a62c16c0394-0050062025/original/Spencer-Henson-Private-food-standards.pdf (accessed on 24 December 2025).
- Liu, Z.; Mutukumira, A.N.; Chen, H. Food safety governance in China: From supervision to coregulation. Food Sci. Nutr. 2019, 7, 4127–4139. [Google Scholar] [CrossRef] [PubMed]
- Kang, Y. Food safety governance in China: Change and continuity. Food Control 2019, 106, 106752. [Google Scholar] [CrossRef]
- Luo, J.; Chen, T.; Pan, J. Evolutionary dynamics of health food safety regulatory information disclosure from the perspective of consumer participation. Food Sci. Nutr. 2019, 7, 3958–3968. [Google Scholar] [CrossRef]
- Luo, E.; Xiang, S.; Yang, Y.; Sethi, N. A stochastic and time-delay evolutionary game of food safety regulation under central government punishment mechanism. Heliyon 2024, 10, e30126. [Google Scholar] [CrossRef]
- Hajihashemi, M.; Aghababaei Samani, K. Multi-strategy evolutionary games: A Markov chain approach. PLoS ONE 2022, 17, e0263979. [Google Scholar] [CrossRef]
- Fudenberg, D.; Imhof, L.A. Imitation processes with small mutations. J. Econ. Theory 2006, 131, 251–262. [Google Scholar] [CrossRef]
- Su, T.; Wu, L.; Zhang, J. Evolutionary Game and Simulation Analysis of Food Safety Regulation under Time Delay Effect. Mathematics 2024, 12, 1181. [Google Scholar] [CrossRef]
- Wu, L.; Ling, Z.; Zhang, J.; Dai, X.; Chen, X. Safe Food Supply Chain as Health Network: An Evolutionary Game Analysis of Behavior Strategy for Quality Investment. Inquiry 2024, 61, 00469580241244728. [Google Scholar] [CrossRef]
- Mao, Q.; Xu, L.; Sun, Q.; Guo, M. Stochastic Evolutionary Game Analysis of Food Cooperation among Countries along the Belt and Road from the Perspective of Food Security. Front. Sustain. Food Syst. 2023, 7, 1238080. [Google Scholar] [CrossRef]
- Wang, J.; Fan, X.; Dai, M. Evolution and Comparison of Food Safety Governance in China—Based on DTM Model. Front. Sustain. Food Syst. 2025, 9, 1640660. [Google Scholar] [CrossRef]
- Wang, F.; Xu, Y. Evolutionary Game Analysis of the Quality of Agricultural Products in Supply Chain. Agriculture 2022, 12, 1575. [Google Scholar] [CrossRef]
- Zhao, G.; Zhan, K. Research on the Evolutionary Game of Quality Governance of Geographical Indication Agricultural Products in China: From the Perspective of Industry Self-Governance. Sustainability 2025, 17, 3414. [Google Scholar] [CrossRef]
- iiMedia Research. iiMedia Research|2022 China Pre-cooked Food Industry Development White Paper (Download Available). 2023. Available online: https://www.iimedia.cn/c400/92015.html (accessed on 15 December 2025). (In Chinese).
- iiMedia Research. iiMedia Research|2023 China Pre-cooked Food Industry Development Blue Book (Download Available). 2024. Available online: https://www.iimedia.cn/c400/99463.html (accessed on 15 December 2025). (In Chinese).
- iiMedia Research. iiMedia Research|2024-2025 China Pre-Cooked Food Industry Development Blue Book (Download Available). 2025. Available online: https://www.iimedia.cn/c400/106595.html (accessed on 15 December 2025). (In Chinese).
- Tan, Z.; Li, S.; Jiang, L.W. Application of HACCP System in Marinated Quail Egg Production. J. Food Saf. Qual. 2013, 4, 609–612. [Google Scholar]
- Li, D.; Zhang, X.; Bi, J.; Zhang, Y.; Zhu, B. Inheritance and innovation of Chinese prepared dishes industry. J. Chin. Inst. Food Sci. Technol. 2022, 22, 1–8. [Google Scholar] [CrossRef]
- Zhong, J.; Sun, L.; Li, H.; Cai, Y.; Guan, R.; Tian, Q. Research Progress, Problems, and Suggestions on the Standard System of Prepared Dish in China. Storage Process 2024, 24, 91–96. [Google Scholar]
- Gereffi, G.; Posthuma, A.C.; Rossi, A. Disruptions in Global Value Chains—Continuity or Change for Labour Governance? Int. Labour Rev. 2021, 160, 501–517. [Google Scholar] [CrossRef]
- Manning, L.; Soon, J.M. Food Safety, Food Fraud, and Food Defense: A Fast Evolving Literature. J. Food Sci. 2016, 81, R823–R834. [Google Scholar] [CrossRef]
- Sonnino, R. Food System Transformation: Urban Perspectives. Cities 2023, 134, 104164. [Google Scholar] [CrossRef]
- Gong, J.; Sun, Y.; Du, H.; Jiang, X. Research on safety risk control of prepared foods from the perspective of supply chain. Heliyon 2024, 10, e25012. [Google Scholar] [CrossRef] [PubMed]
- Aung, M.M.; Chang, Y.S. Traceability in a food supply chain: Safety and quality perspectives. Food Control 2014, 39, 172–184. [Google Scholar] [CrossRef]
- Zhang, W.; Zheng, J.; Li, Y. Explaining Chinese consumers’ continuous consumption intention toward prepared dishes: The role of perceived risk and trust. Foods 2023, 13, 88. [Google Scholar] [CrossRef] [PubMed]
- Li, C.; Chen, G.; Li, F.; Miao, G.; Wu, Y. Decoding consumer-perceived risks in China’s C-end online purchasing pre-made dishes: A Quality safety risk identification model based on grounded theory. J. Food Prot. 2025, 88, 100522. [Google Scholar] [CrossRef]
- Tang, S.; Yang, Y.; Li, Z. Governance of Food Safety in China’s Pre-Made Dishes Industry: Legal Reforms, Policy Strategies, and International Perspectives. Front. Nutr. 2025, 12, 1702278. [Google Scholar] [CrossRef]
- Huang, M.; Zhang, M.; Bhandari, B. Recent development in the application of alternative sterilization technologies to prepared dishes: A review. Crit. Rev. Food Sci. Nutr. 2019, 59, 1188–1196. [Google Scholar] [CrossRef]
- Yu, Q.; Zhang, M.; Ju, R.; Mujumdar, A.S.; Wang, H. Advances in Prepared Dish Processing Using Efficient Physical Fields: A Review. Crit. Rev. Food Sci. Nutr. 2022, 64, 4031–4045. [Google Scholar] [CrossRef] [PubMed]
- Guo, J.; Zhang, M.; Law, C.L.; Luo, Z. 3D Printing Technology for Prepared Dishes: Printing Characteristics, Applications, Challenges and Prospects. Crit. Rev. Food Sci. Nutr. 2023, 64, 11437–11453. [Google Scholar] [CrossRef]
- Jiang, X.J.; Huang, Y.X. Market Order, market supervision and platform governance in the digital age. Econ. Res. J. 2021, 56, 20–41. [Google Scholar]
- Yan, L.; Yin-He, S.; Qian, Y.; Zhi-Yu, S.; Chun-Zi, W.; Zi-Yun, L. Method of reaching consensus on probability of food safety based on the integration of finite credible data on block chain. IEEE Access 2021, 9, 123764–123776. [Google Scholar] [CrossRef]
- Yan, X.; Guo, L. Research on Food Safety Supervision Dilemma and Legal Regulation of Prepared Dishes. Storage Process 2024, 24, 64–69. [Google Scholar]
- Rouvière, E.; Royer, A. Public–Private Partnerships in Food Industries: A Road to Success? Food Policy 2017, 69, 135–144. [Google Scholar] [CrossRef]
- Tosun, J.; Koos, S.; Shore, J. Co-Governing Common Goods: Interaction Patterns of Private and Public Actors. Policy Soc. 2016, 35, 1–12. [Google Scholar] [CrossRef]
- Ansell, C.; Gash, A. Collaborative platforms as a governance strategy. J. Public Adm. Res. Theory 2018, 28, 16–32. [Google Scholar] [CrossRef]
- Schweizerhof, C.; Bieling, C. Of innovators, enablers and change agents: Disentangling actors and their roles in agri-food transition processes. Ger. J. Agric. Econ. 2024, 73, 1–21. [Google Scholar] [CrossRef]
- U.S. Food and Drug Administration (FDA). FSMA Final Rule for Preventive Controls for Human Food (Current Good Manufacturing Practice, Hazard Analysis, and Risk-Based Preventive Controls for Human Food). Available online: https://www.fda.gov/food/food-safety-modernization-act-fsma/fsma-final-rule-preventive-controls-human-food (accessed on 24 December 2025).
- Food and Agriculture Organization of the United Nations (FAO). Principles and Guidelines for the Assessment and Use of Voluntary Third-Party Assurance Programmes (CXG 93-2021). FAO Knowledge Repository. Available online: https://openknowledge.fao.org/items/24c0eea5-900f-41c5-be96-39b6bad9d5fc (accessed on 24 December 2025).
- Grunert, K.G.; Wills, J.M. A review of European research on consumer response to nutrition information on food labels. J. Public Health 2007, 15, 385–399. [Google Scholar] [CrossRef]
- Prakash, G. Publication trends and green cosmetics buying behaviour: A comprehensive bibliometric analysis. Heliyon 2025, 11, e41513. [Google Scholar] [CrossRef]
- Wang, L. Research on the Transformation of Chinese Government Regulation in the Digital Economy Era. Manag. World 2024, 40, 110–126. [Google Scholar]
- Jin, L.; Zhao, Z.; Liu, L. Game Strategies of Product Quality Collaborative Supervision Driven by Social Media. China Soft Sci. 2024, 2, 167–177. [Google Scholar]
- Chen, L.; Song, J.; Zhang, Y. Serial Inventory Systems with Markov-Modulated Demand: Derivative Bounds and Insights. Oper. Res. 2017, 65, 1231–1249. [Google Scholar] [CrossRef]
- Sun, X.; Wang, W.; Pang, J.; Liu, X.; Zhang, M. Study on the evolutionary game of central government and local governments under central environmental supervision system. J. Clean. Prod. 2021, 296, 126574. [Google Scholar] [CrossRef]
- Zhang, Z.; Zhang, G.; Hu, Y.; Jiang, Y.; Zhou, C.; Ma, J. The evolutionary mechanism of haze collaborative governance: Novel evidence from a tripartite evolutionary game model and a case study in China. Humanit. Soc. Sci. Commun. 2023, 10, 69. [Google Scholar] [CrossRef]
- Hu, C.; Chen, W.; Zhou, Y.; Chen, C.; Sun, S. Regulation Mechanism of Live-streaming E-commerce Based on Evolutionary Gametheory. J. Manag. Sci. China 2023, 26, 126–141. [Google Scholar] [CrossRef]
- Chen, J.; Xing, L.; Li, W. A Risk-Averse Inventory Decision-Making Model with Quality Incompleteness. Chin. J. Manag. Sci. 2024, 32, 54–64. [Google Scholar] [CrossRef]
- Wang, S.; Kang, Y.; Petropoulos, F. Combining probabilistic forecasts of intermittent demand. Eur. J. Oper. Res. 2024, 315, 1038–1048. [Google Scholar] [CrossRef]
- Mehrdoust, F.; Noorani, I.; Kanniainen, J. Valuation of option price in commodity markets described by a Markov-switching model: A case study of WTI crude oil market. Math. Comput. Simul. 2024, 215, 228–269. [Google Scholar] [CrossRef]
- Bai, S.; Wu, W.; Yan, Z.; Su, X.; Zhen, X. Disruption risk propagation in supply chain network based on Markov and epidemic model. J. Ind. Eng. 2023, 37, 206–221. [Google Scholar] [CrossRef]
- Ivanov, D. Two views of supply chain resilience. Int. J. Prod. Res. 2024, 62, 4031–4045. [Google Scholar] [CrossRef]
- Bosov, A.; Borisov, A. Comparative Study of Markov Chain Filtering Schemas. Mathematics 2022, 10, 3381. [Google Scholar] [CrossRef]
- Sugden, R. The Evolutionary Turn in Game Theory. J. Econ. Methodol. 2001, 8, 113–130. [Google Scholar] [CrossRef]
- Hopkins, E. Evolving Game Theory. J. Econ. Surv. 1997, 11, 101–106. [Google Scholar] [CrossRef]
- Clempner, J.B. On Lyapunov Game Theory Equilibrium: Static and Dynamic Approaches. Int. Game Theory Rev. 2018, 20, 1750033. [Google Scholar] [CrossRef]
- Bovay, J.; Ferrier, P.; Zhen, C. Estimated Costs for Fruit and Vegetable Producers to Comply with the Food Safety Modernization Act’s Produce Rule; USDA: Washington, DC, USA, 2018. [Google Scholar]
- Baikadamova, A.; Yevlampiyeva, Y.; Orynbekov, D.; Idyryshev, B.; Igenbayev, A.; Amirkhanov, S.; Shayakhmetova, M. The effectiveness of implementing the HACCP system to ensure the quality of food products in regions with ecological problems. Front. Sustain. Food Syst. 2024, 8, 1441479. [Google Scholar] [CrossRef]
- Romano, D.; Cavicchi, A.; Rocchi, B.; Stefani, G. Exploring costs and benefits of compliance with HACCP regulation in the European meat and dairy sectors. Food Econ. 2005, 2, 52–59. [Google Scholar] [CrossRef]
- Ehmke, M.D.; Bonanno, A.; Boys, K.; Smith, T.G. Food Fraud: Food fraud: Economic insights into the dark side of incentives. Aust. J. Agric. Resour. Econ. 2019, 63, 685–700. [Google Scholar] [CrossRef]
- Everstine, K. Economically Motivated Adulteration: Implications for Food Protection and Alternate Approaches to Detection. Ph.D. Thesis, University of Minnesota, Minneapolis, MN, USA, 2013. [Google Scholar]
- Gonçalves, A.A. Phosphates for Seafood Processing. In Phosphates: Sources, Properties, and Applications; Nova Publishing: New York, NY, USA, 2012; pp. 83–112. [Google Scholar]
- Spagnoli, P.; Defalchidu, L.; Vlerick, P.; Jacxsens, L. The relationship between food safety culture maturity and cost of quality: An empirical pilot study in the food industry. Foods 2024, 13, 571. [Google Scholar] [CrossRef]
- Jin, S.; Zhou, J.; Ye, J. Adoption of HACCP system in the Chinese food industry: A comparative analysis. Food Control 2008, 19, 823–828. [Google Scholar] [CrossRef]
- Wu, Y.; Chen, J. Food Safety Monitoring and Surveillance in China: Past, Present, and Future. Food Control 2018, 90, 429–439. [Google Scholar] [CrossRef]
- Liu, B.; Ma, F.; Rainey, J.J.; Liu, X.; Klena, J.; Liu, X.; Zhao, C. Capacity assessment of the health laboratory system in two resource-limited provinces in China. BMC Public Health 2019, 19, 467. [Google Scholar] [CrossRef]
- Tai’an Municipal Bureau of Finance. 2024 Unit Budget Catalogue of Tai’an Food and Drug Inspection and Testing Research Institute (Tai’an Fiber Inspection Institute). 2024. Available online: https://czj.taian.gov.cn/module/download/downfile.jsp?classid=0&filename=13fc70c5a1384018bc3d1942992870ee.pdf (accessed on 15 December 2025). (In Chinese)
- People’s Daily. National Market Regulation System Food Safety Sampling Non-Compliance Rate Was 2.74%. People’s Daily. 2025. Available online: https://paper.people.com.cn/rmrb/pc/content/202511/26/content_30116951.html (accessed on 15 December 2025). (In Chinese).
- Xinhua News Agency. 2020 National Food Safety Sampling Monitoring: Overall Non-Compliance Rate 2.31. XinhuaNet. 2021. Available online: https://www.xinhuanet.com/politics/2021-04/21/c_1127357953.htm (accessed on 15 December 2025). (In Chinese).
- Liu, Y.T. National Authority Released the Notice on Food Sampling Inspection in the Fourth Quarter of 2016. Health China. 2017. Available online: https://mtest.health-china.com/c/2017-02-06/646115.shtml (accessed on 15 December 2025). (In Chinese).
- Kunming Municipal People’s Procuratorate. Food Safety Law of the People’s Republic of China. 2022. Available online: https://www.kunmingjn.jcy.gov.cn/jwgk/jwzn/202203/t20220315_3581321.shtml (accessed on 15 December 2025). (In Chinese)
- National People’s Congress of the People’s Republic of China. Food Safety Law of the People’s Republic of China. National Laws and Regulations Database. Available online: https://flk.npc.gov.cn/detail?fileId=&id=ff8081817ab22e0c017abd8d85a205f1 (accessed on 15 December 2025). (In Chinese)
- Beijing Political and Legal Affairs Network (BJ148). Bought Problematic Goods: Should the Compensation Be “Three Times” or “Ten Times”? 2021. Available online: https://www.bj148.org/fw/xzsc/wnzz/202103/t20210315_1601646.html (accessed on 15 December 2025). (In Chinese).
- Standing Committee of the National People’s Congress. Food Safety Law of the People’s Republic of China. National Laws and Regulations Database. 2021. Available online: https://flk.npc.gov.cn/detail2.html?MmM5MDlmZGQ2NzhiZjE3OTAxNjc4YmY3NDVlMzA4ODQ%3D (accessed on 15 December 2025). (In Chinese)
- The Beijing News. Meituan Waimai Responded to the Regulatory Interview, Saying It Will Seriously Fulfill Platform Responsibilities. 2019. Available online: https://m.bjnews.com.cn/detail/155246269214632.html (accessed on 15 December 2025). (In Chinese).
- Beijing Municipal Administration for Market Regulation. How to File a Consumer Complaint on the National 12315 Platform? Capital Window (Beijing Municipal Government Portal). 2025. Available online: https://www.beijing.gov.cn/fuwu/bmfw/bmdh/sh/rcxf/rcshbmjy/202504/t20250409_4060597.html (accessed on 15 December 2025). (In Chinese)
- Jingde County Market Supervision Administration. Interim Measures for Handling Complaints and Reports in Market Supervision Administration (Market Regulation Administration Order No. 20, 2019). Jingde County People’s Government Portal. 2024. Available online: https://www.ahjd.gov.cn/Jczwgk/show/2305595.html (accessed on 15 December 2025). (In Chinese)
- Zheng, Y.; Xu, Y.; Qiu, Z. Blockchain traceability adoption in agricultural supply chain coordination: An evolutionary game analysis. Agriculture 2023, 13, 184. [Google Scholar] [CrossRef]
- Polinsky, A.M.; Shavell, S. Economic Theory of Public Enforcement of Law. J. Econ. Lit. 2000, 38, 45–76. [Google Scholar] [CrossRef]
- Zhao, T.; Li, T.; Liu, D.; Luo, Y. The impact of food safety regulatory information intervention on enterprises’ production violations in China: A randomized intervention experiment. Front. Sustain. Food Syst. 2024, 7, 1245773. [Google Scholar] [CrossRef]
- Zhang, C.; Xu, Y.; Zheng, Y. Blockchain Traceability Adoption in Low-Carbon Supply Chains: An Evolutionary Game Analysis. Sustainability 2024, 16, 1817. [Google Scholar] [CrossRef]
- Thomas, M.S.; Feng, Y. Consumer Risk Perception and Trusted Sources of Food Safety Information during COVID-19. Food Control 2021, 130, 108279. [Google Scholar] [CrossRef]
Disclaimer/Publisher’s Note: The statements, opinions and data contained in all publications are solely those of the individual author(s) and contributor(s) and not of MDPI and/or the editor(s). MDPI and/or the editor(s) disclaim responsibility for any injury to people or property resulting from any ideas, methods, instructions or products referred to in the content. |
© 2026 by the authors. Licensee MDPI, Basel, Switzerland. This article is an open access article distributed under the terms and conditions of the Creative Commons Attribution (CC BY) license.