Abstract
Over the past decades, the tourism sector has grown into one of the rapidly expanding sectors in the global economy, becoming an important source of income generation and distribution. Even though tourism development is associated with economic growth and increased employment, its impact on income inequality remains ambiguous and depends on economic, institutional and social conditions. The aim of this study is to assess the impact of international tourism receipts on income inequality in Lithuania, Latvia and Estonia in the period of 2004–2024. This study employed a comparative analysis of scientific literature and a multiple regression model based on macroeconomic indicators. The results showed that international tourism receipts did not have a statistically significant impact on income inequality in any of the Baltic countries. However, the robust model analysis confirmed and strengthened the main model results: international tourism in Latvia reduced income inequality but increased it in Estonia. In Lithuania, the impact remained insignificant. Foreign direct investment in Lithuania and GDP per capita in Latvia were statistically significant in explaining income inequality. The findings highlight that the determinants of inequality vary across the Baltic States.
1. Introduction
Since the last decades of the 20th century, the tourism sector has remained one of the rapidly expanding sectors in the global economy. According to the data of the World Travel and Tourism Council (WTCC) [1], the tourism sector accounted for 10.4% of global GDP in 2019. Despite the share of GDP generated by the tourism sector having decreased to 5.5% of global GDP in 2020, during the COVID-19 pandemic, the tourism sector generated over 10% of global GDP again in 2024, thus reaching pre-pandemic levels. The above facts confirm that the tourism sector has become an important source of income generation and distribution, influencing the social and economic development of countries.
Tourism experts recognise purchasing power that ensures stable consumption as a necessary prerequisite for tourism development. Nonetheless, the development of tourism in regions with lower economic activity also contributes to the reduction in income inequality. As stated by Chancel et al. [2], global income inequality has remained high since the beginning of the 20th century, but between 2000 and 2020, there has been a noticeable decline—the Gini coefficient has decreased from 0.72 to 0.67—and income differences between countries have become smaller than within them. Haddad et al. [3] also claim that global income inequality trends are decreasing: the number of countries with high income inequality (Gini > 40) decreased from 77 in 2000 to 52 in 2022. For this reason, even though some countries remain unequal, inequality is globally decreasing. The problem of income inequality, however, remains one of the most significant challenges to social and economic development, having a direct impact on the well-being of the population and poverty reduction. According to Tanjitpiyanond et al. [4], the world’s top 1% owns twice as much wealth as the remaining 6.9 billion people combined. This shows that the problem of inequality is both relevant and global. The expanding income and wealth inequality not only promotes social exclusion and reduces public trust but can also lead to political instability as well as limit the country’s economic growth. Accordingly, reducing economic inequality becomes an important priority for every country’s economic policy to ensure even economic and social development.
Lagos and Wang [5] claim that tourism development can create more jobs, increase domestic demand and generate foreign exchange flows, thus contributing to economic growth and poverty reduction. In less developed countries, tourism can be a tool for poverty reduction through economic integration and globalisation, as it promotes the development of local infrastructure and the creation of new jobs. On the other hand, tourism can reduce poverty but, at the same time, increase income inequality, and the benefits of tourism can accrue mainly for the rich [5]. Despite the fact that Zhang and Yang [6] argue that tourism development is considered an effective tool for poverty reduction, Ghosh and Mitra [7], Sun et al. [8] and Dossou et al. [9] claim that the impact of this sector on income inequality is ambiguous—it depends on the country’s level of economic development, institutional environment and external shocks.
The growing flow of visitors from abroad and the increasing income generated by international tourism make it possible to classify the tourism sector as an economically and socially significant economic sector for the Baltic States. According to the Eurostat [10] data, the number of foreign tourists staying in accommodation establishments in the Baltic States increased in the period of 2004–2024: in Lithuania by 329%, in Latvia by 200% and in Estonia by 88%. Based on the data of the central banks of Lithuania, Latvia and Estonia [11,12,13], travel expenses of visitors from abroad during the same period of 2004–2024 increased by 182% in Lithuania, by 515% in Latvia and by 110% in Estonia. Alongside the high income figures generated by international tourism, employment figures in the tourism sector have not grown as significantly or have even decreased: according to Eurostat [14], in the period of 2008–2024, the number of people employed in the tourism sector in Lithuania increased by 3% and decreased by 16% in Latvia, while in Estonia, it increased by 7%. These statistics on the development of international tourism flows, income and employment in the Baltic States emphasise the relevance of assessing the impact of international tourism on income inequality in the aforementioned countries.
The relationship between tourism and income inequality has been widely studied in various regions of the world. Alam and Paramati [15] examined the impact of tourism on income inequality in 49 developing countries. Ghosh and Mitra [7] looked into how tourism development affects income inequality, based on data from 41 countries. Nguyen et al. [16] analysed the interaction between tourism and income inequality across 97 countries by income level. Subramaniam et al. [17] studied the impact of tourism on income inequality in nine countries with the lowest levels of inequality. Zhang [18] examined how tourism shapes rural income inequality in China. Zhang and Yang [6] analysed the impact of tourism growth on income and wealth inequality in Iceland. Wang and Tziamalis [19] investigated the impact of international tourism on income inequality by incorporating factors of economic and financial development in 71 countries.
Despite the fact that the impact of tourism on income inequality has been widely examined globally, the Baltic context remains understudied. Some international studies have partially covered this region. Lagos and Wang [5] assessed the impact of international tourism on poverty reduction by national income level in 99 countries, including Latvia. Sun et al. [8] analysed how the decline in tourism during the COVID-19 pandemic affected employment and the risk of income loss in 132 countries, including Latvia and Estonia. However, there is still a lack of empirical assessments of whether the growth of international tourism receipts in the Baltic region helps to reduce income inequality or, on the contrary, deepens social differentiation. Given the growing interest of global researchers in the interaction between international tourism and income inequality, it is necessary to assess the relationship between these indicators in a more detailed way in the Baltic context. This study aims to fill this scientific gap by analysing the role of the tourism sector in the dynamics of income distribution in Lithuania, Latvia and Estonia. Therefore, this study raises the question of whether the development of international tourism in the Baltic States contributes to the reduction in income inequality or, on the contrary, increases it.
The aim of this study is to assess the impact of international tourism receipts on income inequality in the Baltic States, with the following objectives:
- To examine the concept of income inequality, its factors and main indicators of measurement.
- To discuss the links between tourism receipts and macroeconomic indicators (GDP, GDP per capita, foreign direct investment and unemployment rate) and income inequality from a theoretical perspective.
- To analyse changes in income inequality and tourism development indicators in the Baltic States.
- To assess the impact of tourism on income inequality in the Baltic States by applying a research-based regression model.
- To test the stability of the impact of international tourism receipts after replacing the GDP per capita indicator with the unemployment rate.
The following research methods were used: structured, comparative and logical analysis of scientific literature based on comparison, classification and generalisation methods; regression analysis. The insights of the theoretical analysis (chapter two) present the factors and measurement indicators determining income inequality and the nature of the impact of international tourism development on income inequality; the third chapter presents and justifies the research methodology; and the fourth chapter presents the results of the empirical assessment, summarising the macroeconomic significance of international tourism development in reducing income inequality in the Baltic States.
2. Theoretical Background and Context
In order to analyse the concept of income inequality, its factors and key measurement indicators from a theoretical perspective, the insights of researchers on the impact of tourism on income inequality were summarised, and changes in tourism development and income inequality indicators for the period of 2004–2024 were reviewed.
2.1. The Concept, Factors and Key Measurement Indicators of Income Inequality
Income inequality is one of the most important contemporary socio-economic challenges, often considered a form of economic inequality. The European Commission (EC) [20] defines inequality as the unequal distribution of wealth, rights and opportunities. Unlike poverty, inequality refers to all groups in society, since its analysis assesses not only the distribution of income but also access to opportunities and resources.
The concept of economic inequality is interpreted differently by scholars. Wesley and Peterson [21] and Wang [22] classify economic inequality into income and wealth inequality. Foster and Sen [23] attribute aspects of opportunities and constraints to economic inequality, while the International Monetary Fund (IMF) [24] further distinguishes between inequality of life expectancy and inequality of opportunity. According to Dorjnyambuu [25], the distribution of income and low income are the primary focus of economic inequality, but wealth accumulation also plays a crucial role in economic power and financial stability. Since income inequality is analysed as one form of economic inequality, the concept of economic inequality is discussed first (Table 1).

Table 1.
The concept of economic inequality.
Definitions of economic inequality (Table 1) indicate that it is associated with differences in income or wealth [22,27]. Other authors [23,26] emphasise that economic inequality includes not only the distribution of income and wealth but also certain aspects of opportunities and constraints, that is, the obstacles that people face in achieving their life goals.
In order to explain the trends in economic inequality, it is necessary to analyse the factors that influence its emergence. According to Borio [27], despite the fact that inequality reflects differences in income or wealth between different groups of the population, it can increase even when all households benefit from economic growth if their income growth rates differ. On the contrary, if there is no economic growth, then society can become more equal but poorer [27].
The factors that determine economic inequality can be classified on the basis of various approaches. The IMF [29] distinguishes between global factors, such as globalisation, technological progress and commodity price cycles, which are specific factors related to economic development, stability and domestic policies. Factors of economic inequality are presented in Table 2.
Table 2.
Factors of economic inequality.
Table 2 shows that researchers distinguish between different factors of economic inequality. Researchers [30] emphasise individual and social aspects; Refs. [25,31] stress broader macroeconomic, globalisation or demographic factors; Ref. [32] note the distribution of income, wealth and public services; while Ref. [22] highlight the importance of technology and management models.
One of the main factors that have influenced the emergence of inequality on a global scale, as noted by Borio [27], is the relocation of production or services to other countries. Wang [22] claims that globalisation has significantly changed the economic environment, creating conditions for a freer movement of capital and labour between countries. According to researchers [22,27], technological progress has increased the productivity of high-skilled workers more than that of low-skilled ones, which has led to an increase in the income gap. This technological progress has not only increased wage differences but also restructured the labour market, causing job polarisation.
Clark and D’Ambrosio [33] note that income inequality exists when the income of some individuals differs from that of others. Income inequality in the context of globalisation, according to Nissanke and Thorbecke [34], can be examined from four perspectives: mean incomes between countries are compared; income per capita of each country is compared; income inequality is measured at the global, national or regional levels; vertical and horizontal income inequality is assessed.
Unlike many other variables related to individual well-being, as noted by [33], income distribution does not exist at the individual level, since income inequality is measured only at the aggregate, usually societal level. Ref. [33] points out that the main axiom for measuring inequality is the Pigou–Dalton transfer principle, which implies that inequality increases every time income is transferred from a poorer person to a richer one. Table 3 shows the indicators for measuring economic inequality.
Table 3.
Indicators for measuring income inequality.
Income inequality can be measured using various indicators, such as the Gini coefficient, the Palma index or the Theil index. This variety of indicators shows that income inequality is a multifaceted phenomenon that encompasses many aspects. One of the most commonly used indicators of measuring income inequality is the Gini coefficient. Another indicator is the Theil index, which does not have an international standard defining the meaning of a specific value. The Palma index was developed to provide a clearer and more interpretable measure of income inequality. Borio C. [27] suggests examining the distribution of income or wealth using different percentiles of the population. Ghosh et al. [35] proposed the Kolkata index and discovered that the value of this index in income distributions around the world ranges from 0.60 to 0.75.
All in all, it can be stated that economic inequality is most often associated with differences in income or wealth. However, it includes not only the distribution of income and wealth but also certain aspects of opportunities and constraints, that is, obstacles that people face in achieving their life goals. Income inequality is one of the most important forms of economic inequality, defined as the unequal distribution of income among members of society. It is influenced by various factors—globalisation, technological progress, demographic changes, taxation and redistribution policies and institutional environment. Income inequality is assessed by various indicators, the most commonly used of which is the Gini coefficient, the values of which range from 0 (perfect equality) to 1 (perfect inequality). The Theil, Palma, Robin Hood and Kolkata indices are also used. This variety of indicators shows that income inequality is a multifaceted phenomenon.
2.2. Theoretical Foundations for Analysing the Impact of International Tourism Development on Income Inequality
Over the past decades, tourism has become one of the driving forces behind economic growth in various countries around the world. According to the WTCC [37], in the global context, the tourism sector created more than 10% of global GDP and jobs in 2024, making this sector an important factor in income generation and distribution, which determines the growth of the well-being of the country’s population and, at the same time, poverty reduction. Zhang and Yang [6] claim that tourism can reduce poverty for the following reasons: firstly, natural resources and culture, which are often assets of less developed regions, can become the basis of tourism products; secondly, tourism income can reach poorer groups of society through the employment of local residents in tourism enterprises; thirdly, tourism can be a significant source of foreign exchange earnings and government tax revenues, the funds of which can be redistributed for poverty reduction. As noted by Alam and Paramati [15], tourism contributes to economic growth in various ways, including foreign exchange earnings, attracting international investment, increasing tax revenues and creating additional jobs.
Paramati and Thien Nguyen [38] identify three main fields of research that examine the links between tourism and income inequality. Single-province or country studies provide conflicting results on the impact of tourism on income inequality. These results vary depending on the region studied. Multi-country studies find mixed results, based on global or regional datasets. Studies of several provinces in one country provide evidence that tourism competition between provinces helps to distribute income more evenly, which benefits poorer regions.
The impact of tourism on income inequality is controversial in the scientific literature: some authors, including Castilho and Fuinhas [39], Gnangnon [40], Lagos and Wang [5], Li et al. [41], Paramati and Thien Nguyen [38] and Subramaniam et al. [17], identify a positive effect; others, like Zhang [42], identify a negative one; and still others, including Alam and Paramati [15], Dossou et al. [9], Haini et al. [43], Nguyen et al. [16], Wang and Tziamalis [19], Zhang and Yang [6] and Zhang [18], identify a mixed effect. Table 4 and Table 5 below summarise the insights from empirical studies that have analysed the relationship between the tourism sector and income inequality, categorising them according to the nature of the effect—positive or negative.
Table 4.
The positive impact of tourism on income inequality.
Table 5.
The negative and mixed impact of tourism on income inequality.
According to the authors who see the positive impact of tourism on reducing income inequality, tourism can contribute to a decrease in income inequality through various channels: employment growth, better income distribution, increased public revenue or investment promotion. The diversity of impact channels increases the possibilities of using international tourism development as a lever for reducing income inequality.
According to the authors’ opinions summarised in Table 5, the impact of tourism on income inequality is not always positive. Some authors emphasise that tourism can increase income or wealth inequality in cases where the sector is dominated by low-skilled and low-paid jobs, but most often, it is established that the impact of tourism on income inequality is mixed. The impact of tourism also depends on conditions such as the level of financial development, institutional quality or social openness.
Agreeing that income inequality is closely related to the broader social and economic contexts, when assessing the impact of tourism on income inequality, researchers also take into account other macroeconomic factors: GDP per capita, foreign direct investment and unemployment rates. Carrera et al. [44] found that GDP per capita has a negative and statistically significant effect on inequality: a 10% increase in income reduces social inequality. However, growing GDP does not always ensure fair income distribution and reduction in economic inequality. As noted by Duong [31], economic growth and inequality can coexist and have a positive relationship, but this is justified only when the Gini coefficient does not exceed 28. Royal and Singh [45] emphasise the negative relationship between unemployment and GDP as well as small- and medium-sized enterprises, highlighting their contribution to job creation. Duong [31] claims that, in the context of the labour market, inequality contributes to unemployment, causing labour market mismatches when workers migrate in search of better opportunities. Analysing the case of Somalia, Abdi et al. [46] determined that unemployment growth has a positive and statistically significant effect on income inequality—a 1% increase in unemployment increases inequality in the long run by 0.41%. According to Ghosh and Mitra [7], foreign direct investment is another indicator of economic openness, as it leads to capital investment, technology transfer, growth of managerial talent and better production systems. As noted by the authors, foreign direct investment can improve employment in countries with unskilled labour, and this can lead to a reduction in income inequality.
In summary, it can be stated that the impact of tourism on economic inequality is not unambiguous and depends on the level of development of the country’s economic, social and institutional environments. Tourism can reduce income inequality through increased employment, better income distribution, growth of public revenues or promotion of investment. Nevertheless, the impact of tourism on economic inequality can be the opposite. Tourism can increase income or wealth inequality in cases where the sector is dominated by low-skilled, low-paid jobs. Most often, the impact of tourism on income inequality is found to be mixed, since the impact of the development of this sector depends on its structure, the nature of the labour market and the distribution of income generated by tourism.
2.3. Changes in International Tourism Development and Income Inequality in the Baltic States in the Period of 2004–2024
International tourism receipts are based on the Balance of Payments Travel Credit data, defined in accordance with the IMF [47] balance of payments (BPM6) methodology. This indicator includes non-residents’ expenditure on goods and services purchased for personal use or as gifts while visiting the country. According to the [47] methodology, the travel article includes the following groups of products and services: goods, local transport, accommodation, food and other services. As indicated in the United Nations (UN) [48] methodology, the concept of travel is associated with the activities of travellers. A traveller is a person who moves between different geographical locations for any purpose and for any duration. The expenses of international travellers outside their country of residence are recorded in the travel item of the Balance of Payments. Figure 1 presents international tourism receipts in Lithuania, Latvia and Estonia in the period of 2004–2024. The data reflect non-residents’ expenditure in those countries according to the Balance of Payments Travel Credit item.
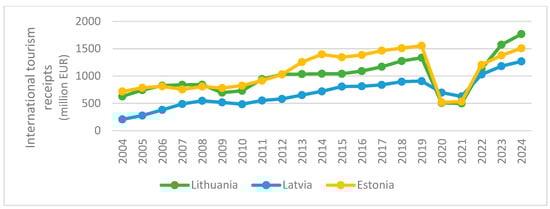
Figure 1.
International tourism receipts in Lithuania, Latvia and Estonia, 2004–2024 (million EUR). Source: authors’ preparation based on [11,12,13].
On the basis of Figure 1, it was established that, during the analysed period of 2004–2024, except for 2020–2021, growth in international tourism receipts was recorded in all Baltic countries. This growth could have had a positive impact on the economies of the countries, since, with the increase in foreign tourist spending, the country’s income also increases. During the period of 2004–2012, the international tourism receipts of Lithuania and Estonia were similar and followed the same trends, while Latvia stood out with lower revenues during the same period. In 2012–2019, the highest tourism receipts were recorded in Estonia (in 2019, they amounted to 1552 million EUR), in second place was Lithuania (in 2019, they amounted to 1.333 million EUR), with the lowest being in Latvia (in 2019, they amounted to 907 million EUR). In all Baltic States, tourism receipts decreased particularly during the COVID-19 pandemic in 2020–2021, when in Lithuania in 2020 they amounted to 507 million EUR, in Latvia 696 million EUR, and in Estonia 517 million EUR. From 2022, receipts began to increase, and in 2024, they were the highest of all Baltic States in Lithuania.
By reference to Figure 2, it was found that, during the analysed period of 2004–2024, except for 2020–2021, the number of foreign tourists increased in all Baltic countries. The indicators of the number of foreign tourists and international tourism receipts have followed similar trends. In 2004–2018, the largest number of non-resident tourists was recorded in Estonia, second place was in Lithuania, and the smallest was in Latvia. In the period of 2004–2011, the number of tourists in Lithuania and Latvia was similar, but later, it began to rapidly grow in Lithuania and, in 2018, surpassed the Estonian indicator. The period of the COVID-19 pandemic in 2020–2021, when the number of tourists in all Baltic countries decreased drastically, should also be noted. Since 2022, growth has been documented, with the majority of tourists being in Lithuania. In order to assess the relationship between international tourism receipts and the number of foreign tourists, a correlation analysis was conducted for 2004–2024, which showed a strong positive relationship in all Baltic countries: in Lithuania r = 0.82, in Latvia r = 0.87, and in Estonia r = 0.81. This confirms that both international tourism receipts and the number of tourist arrivals are changing in the same trends.
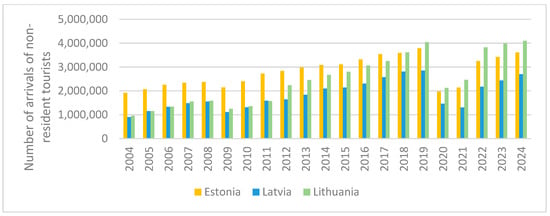
Figure 2.
Number of arrivals of non-resident tourists at accommodation establishments in Lithuania, Latvia and Estonia, 2004–2024. Source: authors’ preparation based on [10].
The dynamics of the Gini index for Lithuania, Latvia and Estonia in 2004–2024, presented in Figure 3, show that the fluctuation limits of the indicators for all countries were between 30 and 40. During the analysed period, income inequality in Latvia remained the most stable, showing a slight downward trend. In Lithuania, inequality was lower than in Latvia in 2004–2014, but in the subsequent period, it became higher. In Estonia, income inequality was the lowest throughout the period and also showed a downward trend.
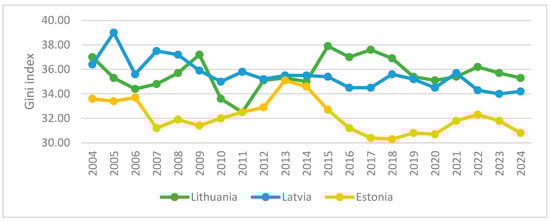
Figure 3.
Dynamics of the Gini index in Lithuania, Latvia and Estonia, 2004–2024. Source: authors’ preparation based on [49,50].
To sum everything, it can be stated that, during the analysed period of 2004–2024, consistent growth of the tourism sector is observed; during the entire period, except for 2020–2021, international tourism revenues and the number of non-resident travellers increased. The dynamics of the Gini index were uneven. For this reason, it can be assumed that the relationship between international tourism and income inequality is not uniform.
3. Materials and Methods
The methodology of the empirical study, which aims to determine the impact of international tourism development on income inequality in the Baltic States in the period of 2004–2024, covering macroeconomic indicators of Lithuania, Latvia and Estonia, is based on the studies of Alam and Paramati [15], Nguyen et al. [16], Subramaniam et al. [17] and Zhang [18] that analyse the impact of tourism on income inequality. The main form of the model is based on the logic of the empirical model of Alam and Paramati [15], according to which income inequality (GINIit) is explained by indicators of economic development, foreign direct investment and the tourism sector.
The model of Alam and Paramati [15] is reflected in Equation (2):
In the study carried out by researchers [15], GDP per capita (GDPpcit) is measured in constant 2005 US dollars; net inflows of foreign direct investment (FDIit) are expressed as a percentage of GDP; trade openness (TOit) is defined as the ratio of the total value of exports and imports to GDP; and tourism receipts (TRit) are defined as the direct and indirect contribution of the tourism sector to GDP. The researchers’ [15] model is constructed by applying the natural logarithm transformation. The study uses the nominal data format while maintaining the same logical structure of the model. The methodological basis of the study is also based on the Nguyen et al. [16] model (3), which explains income inequality through factors of tourism, economic development, foreign direct investment, trade openness and institutional quality.
Model form of Nguyen et al. [16] is presented as follows:
The study of researchers [16] includes the square of GDP per capita (GDPpc2it); the contribution of industry to GDP (Industryit), defined as the share of industrial value added in GDP; urbanisation level (URBANit) defined as the share of urban residents in the total population; and institutional quality index (INSTit). The moderating effect of institutions on the impact of tourism (INSTit·TRit) is analysed by assessing the interaction of institutions and tourism.
The empirical study of the impact of international tourism development on income inequality in the Baltic States assesses the influence of three variables on income inequality—the impact of the tourism sector on the economy (TRt), GDP per capita (GDPpct) and foreign direct investment (FDIt). For the assessment of income inequality, the dependent variable Gini (GINIt) index is used. The higher the Gini value, the greater the inequality. According to Dorjnyambuu [25], the Gini index is one of the most commonly used indices for assessing income inequality. Its application is reflected in the studies of researchers [7,15,16,17,18] analysing the impact of tourism on inequality.
The impact of the international tourism sector on the economy (TRt) is measured by the ratio of international tourism receipts to GDP (as a percentage of GDP). This indicator is calculated based on Balance of Payments Travel Credit data, which reflects foreign tourist spending in the country. Gnangnon [40] and Wang and Tziamalis [19] assessed the impact of the tourism sector using the Balance of Payments Travel Credit to GDP ratio. Ghosh and Mitra [7] also used travel credit data but analysed nominal international tourism receipts rather than their ratio to GDP. Alam and Paramati [15], Nguyen et al. [16] and Subramaniam et al. [17] used WTTC data, which provides a modelled total contribution of the tourism sector to GDP. The indicator used in the research, based on Balance of Payments Travel Credit data, allows for the assessment of actual international tourism receipts and, therefore, is more reflective of real foreign exchange inflows from foreign tourism.
GDP per capita (GDPpct) was chosen to measure the value created in the country, based on the methodological framework of [9,15,16,17,18]. The impact of foreign direct investment is based on the conducted studies [9,15,16,18].
The form of the regression model is defined as follows:
The main (6) model is as follows:
In Equation (6), GINIt is the income inequality index (Gini coefficient) in the period of t; TRt is the ratio of nominal international tourism receipts (from the travel credit component in the balance of payments) to nominal GDP, expressed as a percentage; GDPpct is the gross domestic product per capita, million EUR; FDIt is the amount of foreign direct investment, percent to GDP; and εt is the usual error term. Tests are also applied to model diagnostics to ensure the reliability of the results. Variance Inflation Factor (VIF) is used to check for multicollinearity, assessing the potential correlation between variables. The presence of autocorrelation is checked using the Durbin–Watson (DW) test.
The alternative model includes the unemployment rate (UNEMPt) as part of the robustness analysis, while the main model retains GDP per capita (GDPpct) as the primary economic control variable. This robustness model is designed to test whether the impact of international tourism on income inequality remains stable when the economic development indicator is replaced with a labour market indicator, i.e., the unemployment rate.
Robustness (8) model is as follows:
In Equation (8), UNEMPt is the unemployment rate in percent.
This model variant is based on Abdi et al. [46], who also used the Gini index as a measure of income inequality, as well as GDP per capita and unemployment rate as some of the main explanatory macroeconomic variables. The study by Helpman et al. [51] underscores the importance of labour market dynamics in understanding income inequality. Although the authors’ model focuses on trade, the core insight, where wage inequality and unemployment are jointly determined by labour market frictions and firm-level heterogeneity, can also be applied in the context of international tourism. Since tourism directly affects employment, particularly in the services sector, the inclusion of the unemployment rate in the model as an alternative economic variable allows for testing whether the impact of tourism on income inequality remains stable under different labour market conditions. It is worth noting that authors [7,15,17,18,46] included more macroeconomic variables in their studies.
Data sources are as follows: Gini index—World Bank and Eurostat database; tourism receipts—statistic data of the Balance of Payments (Travel Credit line) of the central banks of Lithuania, Latvia and Estonia; foreign direct investment—World Bank database; GDP per capita and unemployment rate—Eurostat database. All indicators are presented in nominal terms (current prices). The methodological choice is based on the nature of the main independent variable, i.e., the international tourism receipts indicator. The international tourism receipts indicator is calculated using the travel credit component from the balance of payments, as it reflects actual financial inflows from foreign tourists. Since this indicator is reported in nominal terms, all other model variables are also expressed in nominal terms to ensure data consistency and avoid methodological distortions in the analysis.
This study has some limitations. This study analysed the impact of international tourism development on income inequality in the Baltic countries: Lithuania, Latvia and Estonia. Based on the review of literature, it was found that tourism can have a positive, negative or mixed effect on income inequality. The analysis employed a multiple regression model based on the work of Alam and Paramati [15], Nguyen et al. [16] and Zhang [18] and used their proposed macroeconomic variables. The mentioned authors also included additional explanatory factors in their models: Alam and Paramati [15] included a trade openness indicator; Nguyen et al. [16] used the industry’s contribution to GDP, the level of urbanisation, the institutional quality index and an interaction term between institutional quality and tourism; and Zhang [18] included urbanisation, trade openness, average years of schooling and natural population growth. Due to the limited number of observations (N = 21), a simplified model with core variables was used to maintain result reliability.
During the period (2004–2024), the Baltic countries underwent significant structural, economic and institutional transitions. In 2004, all three countries joined the European Union, which required legal and methodological alignment. The adoption of the Euro occurred over a five-year period, starting with Estonia in 2011, Latvia in 2014 and Lithuania in 2015. The global financial crisis of 2008–2009 resulted in significant GDP declines: Lithuania—17.47%, Latvia—20.85%, and Estonia—14.96% [52]. The COVID-19 pandemic affected tourism flows. During this period, there was a significant decline in both international tourism revenues (see Figure 1) and the number of arrivals of non-resident tourists (see Figure 2). In addition, during this period, GDP fell by 1.16% in Latvia and by 2.15% in Estonia, while Lithuania recorded a slight increase of 2.08% [52]. These changes reflect the impact of the pandemic and other external shocks on the tourism sector and may have indirectly influenced the dynamics of income inequality in the Baltic States.
The abovementioned factors likely had an impact on both tourism development and the evolution of income inequality. Given the limited sample size (N = 21), however, the inclusion of additional variables would have further reduced the degrees of freedom and compromised the reliability of the results. The relatively small sample size poses certain limitations regarding statistical power and generalisability. In response to this issue, additional robustness checks were performed to ensure the reliability of the estimates. A comparison between the main regression model, the robustness model and the model including the lagged GINIt−1 variable confirmed the consistency of the results. Although the limited number of observations may have slightly reduced statistical significance in some cases, the direction and magnitude of the key coefficients remained stable across all model specifications. Therefore, the additional tests strengthened the reliability of the findings despite the constraints related to the small sample size.
Since the small sample size may increase the sensitivity of the results to structural changes or outliers, the findings should be interpreted with caution. For this reason, a simplified model specification was chosen, and the inclusion of additional variables is recommended for future research. These limitations do not weaken the main conclusions but rather highlight the need for further research.
4. Empirical Results and Discussion
This section consists of two parts. Section 4.1 presents the results of the regression models, while Section 4.2 explores structural differences to explain the varying impacts of international tourism across the Baltic States.
4.1. Regression Model Results
First of all, before discussing the results obtained, it is necessary to analyse the minimum, maximum and average values of the main indicators that make up the model—GINIt, TRt, GDPpct and FDIt. Table 6 shows the descriptive statistics of the indicators for Lithuania, Latvia and Estonia.
Table 6.
Descriptive statistics.
During the analysed period, the average Gini coefficient values in both Lithuania and Latvia were very similar and amounted to 35.64 and 35.55, respectively. In Estonia, this index was lower—on average it amounted to 32.15, which indicates lower income inequality. The share of international tourism (TRt) in GDP was also similar in both Lithuania and Latvia—2.61% and 2.74%, respectively—while in Estonia, this indicator was higher—5.21%. The largest fluctuation of the TRt indicator was also recorded in Estonia—the standard deviation was 1.56—while in Lithuania, it was 0.7, and in Latvia, it was 0.47. GDP per capita (GDPpct) was the highest in Estonia—on average 16,660.95 million EUR; while in Lithuania, it was 13,861.43 million EUR, and in Latvia, it was 12,380.95 million EUR. The share of foreign direct investment (FDIt) in GDP was also the highest in Estonia—the maximum value was 21.67% (in 2005). In Lithuania, the maximum value of FDI was 7.94%, and in Latvia, it was 9.78%. It is worth noting that all three countries recorded a negative FDI flow in at least one year: in Lithuanian and Latvia in 2009, which can be attributed to the global economic crisis at that time, and in Estonia in 2015. Unemployment rate (UNEMPt) indicators in Estonia were also the best, with the average value being 7.8%; in Lithuania, it was 9.06%, and in Latvia, it was 10.1%. To sum everything, it can be stated that Estonia outperformed Lithuania and Latvia on most macroeconomic indicators. This includes lower income inequality, higher GDP per capita, higher foreign direct investment flows and lower unemployment rate.
Table 7 shows a summary of the Lithuania, Latvia and Estonia model. Based on the results of the regression analysis, it was found that the level of explanation of the dependent variable differs in the Baltic countries. The coefficient of determination R2 showed that the models explain in Latvia (R2 = 0.582), Estonia (R2 = 0.523) and Lithuania (R2 = 0.173). The adjusted R2 decreased to 0.509 in Latvia, to 0.274 in Estonia and to 0.027 in Lithuania, which indicates that the model appropriateness is highest in Latvia, average in Estonia and very weak in Lithuania. The model is statistically significant only in Latvia (F = 7.898; p = 0.002), while significance is not reached in Estonia (p = 0.133) nor Lithuania (p = 0.345). The lowest forecast error was obtained in Latvia (Standard Error = 0.845) and higher in Estonia (Standard Error = 1.252) and in Lithuania (Standard Error = 1.300). The Durbin–Watson statistics showed that the residuals of the Latvian model have almost no autocorrelation (DW = 2.627), while the Estonian (DW = 0.766) and Lithuanian (DW = 1.009) models are characterised by positive autocorrelation, which indicates that the reliability of their forecasts is limited.
Table 7.
Main regression model summary by country.
For transparency, Table A1 in Appendix A presents the uncorrected OLS-based standard errors and p-values. To address this issue, Newey–West heteroskedasticity and autocorrelation consistent (HAC) standard errors were applied to the Lithuanian and Estonian models. Although no autocorrelation was detected in the Latvian model, the correction was also implemented. Table 8 reports the regression coefficients with Newey–West (HAC) corrected standard errors, accounting for potential autocorrelation. Based on Table 8, it was found that neither in Lithuania, Latvia nor Estonia were the coefficients of the international tourism sector (TRt) statistically significant (p > 0.05); thus, it can be stated that international tourism did not have a significant impact on the change in income inequality in the Baltic countries. In Lithuania, the impact of international tourism sector was positive, in Latvia, it was negative, and in Estonia, it was also positive, but in all cases, the effect remained insignificant. These results partially coincide with the findings of Alam and Paramati [15] and Subramaniam et al. [17], which show that the impact of tourism on income inequality depends on the country’s economic development and sector structure. In Estonia, the tourism sector had the largest relative impact (Beta = 0.394), but it was not statistically significant (p = 0.289). The model revealed a statistically significant relationship between economic level and income inequality. In Latvia, GDP per capita (GDPpct) had a negative impact on the Gini index (Beta = −0.532; p < 0.001). In Lithuania, FDIt showed a significant effect (Beta = −0.398; p = 0.004), indicating a negative relationship with income inequality. VIF values below 10 indicate no serious multicollinearity concerns.
Table 8.
Coefficients of the main regression model (with HAC-corrected standard errors) by country.
To further assess the robustness of the results and address potential autocorrelation, an alternative specification including a lagged dependent variable (GINIt−1) was estimated. Even though the model was not used as the primary specification due to the limited number of observations and degrees of freedom, it serves as an additional robustness check. As shown in Appendix Table A2, the Durbin–Watson statistics improved in Lithuania and Estonia, indicating a reduction in autocorrelation. Furthermore, the coefficients of the main explanatory variables (TRt, GDPpct, FDIt) remained consistent (see Table A3), which strengthens the reliability of the model’s results.
In order to check the reliability of the results obtained, a robust regression analysis was performed, the results of which are presented in Table 9. On the basis of the results of the robust model, it was found that the models are statistically significant in Lithuania (R2 = 0.511; p = 0.006) and in Latvia (R2 = 0.365; p = 0.048), while in Estonia (R2 = 0.271; p = 0.137), the significance level was not reached. The Durbin–Watson statistics indicated potential autocorrelation issues; therefore, the Newey–West (HAC) correction was applied to all three Baltic countries.
Table 9.
Robust regression model summary by country.
Table 10 shows the robust regression coefficients for Lithuania, Latvia and Estonia by variables. The purpose of the robust regression is to verify the stability of the results obtained in the main model. The results of the robust regression (Table 10), however, revealed that, in Latvia, international tourism had a negative impact on income inequality (Beta = –0.565; p = 0.035), indicating that a higher contribution of the tourism sector reduced inequality. In Estonia, on the contrary, the impact was positive (Beta = 0.494; p = 0.028); therefore, it can be stated that international tourism increased income inequality. This allows us to state that the impact of international tourism on income inequality does exist, but its fields and strength depend on the chosen model specification and the economic context of the country.
Table 10.
Coefficients of the robust regression model (with HAC-corrected standard errors) by country.
4.2. Explaining Cross-Country Differences in Tourism—Inequality Relationships
The main model did not show a statistically significant relationship between international tourism and income inequality. Nevertheless, the robustness check revealed statistically significant relationships in Latvia and Estonia, indicating that the direction of the effect may have a meaningful impact. The main regression model results were as follows: Lithuania (Beta = 0.048; p = 0.706), Latvia (Beta = −0.302; p = 0.082) and Estonia (Beta = −0.394; p = 0.289). Wang and Tadziamalis [19] found that tourism growth has different effects on income inequality after income redistribution: it can reduce it in less economically developed countries and increase it in more developed countries. Moreover, according to the authors [19], tourism growth helps reduce income inequality in less financially developed countries and may have a similar positive effect in more financially developed ones. Although international tourism did not show a statistically significant effect on inequality in Estonia, a positive direction of impact was observed, which means that international tourism growth might have been associated with higher income inequality. This aligns with the researchers’ findings on the potential for inequality to increase in more economically developed countries. According to Eurostat data [53], during the period of 2004–2024, Estonia had the highest GDP per capita among the three Baltic States. Sokhanvar and Jenkins [56] note that tourism in Estonia is one of the key factors contributing to economic growth, exports and competitiveness, which explains the identified long-term positive impact of tourism on GDP growth.
Similar trends were revealed by Lagos and Wang [5], who found that international tourism reduces both relative and absolute poverty, but the magnitude of its impact varies. Researchers [5] established that international tourism can reduce income inequality in lower-income countries. Even though the effect was not statistically significant, Latvia showed the highest significance level among the Baltic States. The direction of the impact was negative, indicating that the growth of international tourism was associated with a decrease in income inequality. According to the Eurostat [53] data, Latvia had the lowest GDP per capita among the three Baltic States during the 2004–2010 period, except for the years 2006–2009. It is likely that, in Latvia, this may be related to a regional, cultural tourism model that includes rural areas, crafts and local events. A statistically significant negative relationship between GDP per capita and the Gini index was also identified in Latvia. This suggests that economic growth rather than the international tourism sector had a significant impact on reducing income inequality.
According to the World Competitiveness Centre [57], Lithuania holds the highest position among the Baltic countries, ranking 21st out of 69 evaluated nations. Compared to Estonia and Latvia, Lithuania received higher ratings in all four assessed areas: economic performance, government efficiency, business efficiency and infrastructure. This indicates that FDI in Lithuania was likely absorbed more effectively and directed toward income-generating sectors, which may have contributed to a reduction in income inequality. In Lithuania, FDI (Beta = −0.398; p = 0.004) (Table 8) emerged as a significant factor that negatively influenced income inequality. This result is consistent with the conclusion of Ghosh and Mitra [7] that the income inequality index in developed countries is not affected by tourism income; therefore, income distribution is determined by other factors.
Subramaniam et al. [17] emphasise that targeted tourism policies can be an effective tool for reducing income inequality. Policymakers should encourage the development of tourism businesses, such as catering and accommodation services, travel agencies, transport, retail and souvenir industries. Such activities have the potential to create jobs in local communities and attract more tourists, which ultimately increases income and reduces inequality [17].
Due to geographical characteristics, the Baltic States are characterised by pronounced seasonality. According to Ahas et al. [58], coastal areas in Estonia were popular for summer tourism, while inland areas were favoured for winter tourism. Seasonality creates very different patterns of tourist distribution, which leads to regional employment issues. Indeed, during the summer, fewer tourists visit inland regions, while in the winter, fewer tourists travel to coastal areas [58]. Therefore, it is necessary to develop tourism services that, as much as possible, reduce the impact of seasonality and encourage longer tourist stays. This would contribute to greater sustainability, lower pollution and more efficient use of resources. All of this supports the Sustainable Development Goals SDG8 (decent work and economic growth) and SDG10 (reduced inequalities).
Given that the direction of international tourism’s impact in Latvia is associated with a reduction in inequality but with an increase in Estonia, it can be assumed that the following could be related to different tourism development models. In Latvia, regional and cultural tourism is likely more developed compared to Estonia, where tourism activities are more concentrated in the capital and coastal regions. According to the OECD data [59], during the period of 2008–2021, Latvia had the highest tourism share of employment, averaging 7.3%, compared to 4.6% in Lithuania and 3.3% in Estonia. Therefore, it is recommended that Latvia continues strengthening its local and regional tourism models. According to the Latvian Tourism Development Plan for 2021–2027 [60], the goal of Latvian tourism development policy is the sustainable development of tourism by promoting the creation of new tourism products and increasing competitiveness. For the implementation of sustainable tourism development, Latvia has identified three main sectoral development priorities: strengthening the international competitiveness of the tourism sector and promoting exports; developing an attractive tourism offer in the context of local values and lifestyle and encouraging domestic tourism; and improving tourism governance, education and research. In contrast, Estonia should consider the possibilities of decentralising tourism. Tourism decentralisation in Estonia can be implemented through targeted tax incentives for regional businesses, infrastructure development, financial support for local tourism initiatives and the promotion of community-based projects that would encourage diversification of tourism services and contribute to the development of international tourism. This aligns with the Long-Term Outlook for Estonian Tourism 2025–2035 [61], in which Estonia seeks to increase the share of higher value-added tourism, particularly business and digital tourism; strengthen regional tourism; enhance destination visibility through smart technologies and support a highly skilled tourism workforce. Occupying relatively small territories, the Baltic States, and especially Estonia, may face the risk of centralisation, when the majority of tourism activity and its economic benefits (employment, income, business development) are concentrated only in the capital or coastal areas. To reduce this disparity, it is necessary to promote tourism development in regional and rural areas, thereby ensuring more balanced development and a broader distribution of economic benefits. According to Pilving et al. [62], the impact of tourism in rural regions can extend beyond economic benefits, as tourism also provides social value that is equally important. Tourism development in rural areas builds confidence among vulnerable social groups, unites community members and families, helps residents feel a sense of belonging and homeliness, creates opportunities for interaction and events as well as allows rural people to feel needed and meaningful [62]. Sokhanvar and Jenkins [56] argue that tourism development should be evaluated not only by income growth but also by the diversity of products and the quality of services. In recent years, investments in Estonia have focused on encouraging repeat visits, extending the duration of stays and increasing the variety of tourism services [56]. All of this contributes to the achievement of Sustainable Development Goals SDG8 (decent work and economic growth) and SDG10 (reduced inequalities).
In order to ensure sustainable development and balanced economic growth, it is recommended to develop tourism attractions and create infrastructure aimed at encouraging longer stays in the Baltic States. In this context, Smith [63] emphasises that, despite the fact that health tourism, for example, accounts for a smaller share of overall tourism, it has deep-rooted traditions and potential for sustainable regional development in the Baltic States. Bockus et al. [64], however, take a different view. According to the researchers [64], it is essential to strengthen international wellness tourism in the Baltic States. The local and unique features of a destination are among the main comparative advantages that appeal to international tourists. The integration of local natural resources, natural environments and authentic healing practices and traditions into wellness services should be one of the top priorities. Accordingly, promoting these unique, destination-specific elements may help distinguish providers from their competitors, allowing for an increase in the competitiveness of the destination and attraction of more international customers looking for novelty [64].
One example of tourism infrastructure aimed at encouraging longer stays is the application of the slow philosophy in tourism development. In Latvia, as noted by Serdane [65], the implementation of the slow philosophy on the supply side is inconsistent. Although the concept is used in destination marketing through the national tourism brand, it receives uneven support from internal stakeholders. Serdane [65] points out that the public sector does not see strong potential in applying the principles of the slow philosophy in tourism development. According to the authors [5,17], governments are recommended to implement effective tourism policies that strengthen the integration of the tourism sector with other areas, including education, vocational training and environmental protection. The development of new international routes, such as Rail Baltica, could also contribute to the achievement of SDG8 and SDG10 goals. Convenient transportation would help increase the flow of international tourists, while growing tourism promotes higher employment, business development, income growth and, consequently, a reduction in inequality. Furthermore, it supports environmental sustainability by reducing pollution caused by car traffic.
5. Conclusions
- Income inequality is one of the most important forms of economic inequality, defined as the unequal distribution of income among members of society. Unlike poverty, according to EC [20], inequality encompasses all groups in society, as it assesses not only earned income but also access to opportunities and resources. In the scientific literature, Foster, Sen [23], IMF [24] and Wang [22] define economic inequality in a broader way—as differences in income, wealth, opportunities, constraints or even life expectancy. Economic inequality is determined by both individual and structural factors. Heath [30] emphasises personal characteristics and social differences, and Duong [31] and Wang [22] emphasise global factors such as globalisation, technological progress, education, birth rate and labour market changes. Income inequality is assessed by various indicators, the most commonly used of which is the Gini coefficient, the values of which range from 0 (perfect equality) to 1 (perfect inequality). The Theil, Palma, Robin Hood and Kolkata indices are also used. This variety of indicators shows that income inequality is a multifaceted phenomenon.
- The impact of tourism on income inequality can be positive, negative or mixed. Paramati and Thien Nguyen [38], Subramaniam et al. [17] and Lagos and Wang [5] claim that tourism contributes to employment growth and income distribution improvement, thus reducing inequality. Zhang [42] distinguishes cases where the tourism sector is dominated by low-skilled jobs, which contribute to the widening of the income gap. Mixed impact, according to Nguyen et al. [16], Dossou et al. [9] and Wang and Tziamalis [19], is associated with factors of institutional environment, social openness or financial development. GDP per capita, as noted by Carrera et al. [44], has a negative relationship with income inequality. According to Duong [31], a growing economy does not always guarantee equal income distribution—inequality may persist or even increase if the Gini index exceeds 28. Foreign direct investment, as stated by Ghosh and Mitra [7], can reduce inequality through employment growth and productivity gains. Rising unemployment, from the perspective of Abdi et al. [46], can, in the long run, increase inequality.
- Regression results showed that the tourism sector did not have a statistically significant impact on income inequality in any of the Baltic countries (p > 0.05). In Estonia, this impact was relatively strongest (Beta = 0.394; p = 0.289) but also insignificant. In Latvia, the model was statistically significant and the most appropriate (R2 = 0.582; p = 0.002). In this country, GDP per capita had a significant negative effect on the Gini index (Beta = −0.532; p < 0.001). In Lithuania, the model was weakest; however, foreign direct investment was found to be statistically significant (Beta = −0.398; p = 0.004). In summary, tourism had no significant impact on income inequality, and the strongest negative relationship was found between GDP and the Gini index in Latvia.
- On the basis of the robust model, it was determined that tourism had a negative impact on inequality in Latvia (Beta = −0.565; p = 0.035), a positive one in Estonia (Beta = 0.494; p = 0.028), while in Lithuania, the impact was insignificant. The main model showed no significant impact, while the robust model revealed that, in certain cases, tourism can reduce inequality (in Latvia) or increase it (in Estonia). In Lithuania, foreign direct investment (Beta = −0.713; p = 0.002) became a significant factor, showing a negative impact on inequality. These results strengthen the conclusion of the main model for Lithuania, confirming the negative link of foreign direct investment with income inequality.
6. Limitations and Recommendations for Future Research
This study acknowledges the following methodological limitations:
- Limited sample size (N = 21). The small number of observations is one of the methodological limitations of this study, which may constrain statistical power and the generalisability of the findings. The 2004–2024 period was chosen based on the availability of data across all Baltic countries. Comparable data on travel credits within the balance of payments for the Baltic countries were obtained from the respective central bank databases [11,12,13]. These sources provided a consistent time series available since 2004, while Eurostat [66] only offers comparable balance of payments data for these countries from 2008 onwards. Even though a larger sample could be achieved using quarterly data, the Gini index data [49,50] are only available on an annual basis. Accordingly, this study was conducted using annual data. Due to the limited sample size and data availability, the results should be interpreted as reflecting general trends. Future studies are recommended to increase the number of observations by using broader datasets, including more countries, longer time series or quarterly data where available. However, as this study specifically aimed to assess the impact of international tourism on income inequality within the Baltic context, the analysis focused on this region to reveal its unique dynamics and the cross-country differences in the international tourism’s impact. Expanding future analyses to include neighbouring countries would further mitigate the limitations associated with the small sample sizes.
- Reliability of t-tests and significance levels. Due to the small sample size and limited degrees of freedom (df = 17), the interpretation of t-tests and p-values requires caution. The Newey–West (HAC) correction was applied in this study.
- Autocorrelation and OLS efficiency. The presence of autocorrelation in Lithuania and Estonia indicates that the OLS estimates may be less efficient. To address this issue and improve the reliability of the estimates, the Newey–West (HAC) correction was applied. Moreover, an additional model incorporating a lagged dependent variable (GINIt−1) was estimated and contributed to assessing the robustness of the results.
- Biased standard errors. This study acknowledges that a small sample size can result in biased standard errors. Taking this into account, the Newey–West (HAC) correction was applied. Furthermore, a robustness analysis was conducted by replacing the economic development indicator with the unemployment rate to assess whether the impact of international tourism on income inequality remains stable.
- Low degrees of freedom and model specification constraints. This study acknowledges a critical trade-off: while the inclusion of additional variables improves model specification, it simultaneously reduces the degrees of freedom, potentially affecting the reliability of the results. The structure of the main model was developed based on previous studies [15,16,18]. Future research using longer time series (if such data is available) or expanding the geographical scope to include neighbouring countries would allow for a more comprehensive assessment of the relationship between international tourism and income inequality.
- Limited exploration of transmission mechanisms. Given that this study focused on identifying the correlation between international tourism and income inequality, possible impact mechanisms were presented in Section 4.2 and examined several channels of impact, specifically employment, regional development and investment. Future studies should aim to examine these impact mechanisms in greater detail, but the feasibility of such analyses will depend largely on the availability of more granular data.
Author Contributions
Conceptualisation, R.L. and D.L.; methodology, R.L.; software, R.L.; validation, D.L.; formal analysis, R.L.; investigation, D.L. resources, R.L.; data curation, R.L.; writing—original draft preparation, R.L.; writing—review and editing, D.L.; visualisation, D.L.; supervision, D.L.; project administration, R.L.; funding acquisition, D.L. All authors have read and agreed to the published version of the manuscript.
Funding
This research received no external funding.
Data Availability Statement
The original contributions presented in this study are included in the article. Further inquiries can be directed to the corresponding authors.
Conflicts of Interest
The authors declare no conflicts of interest.
Appendix A
Appendix A.1
Table A1 presents regression coefficients by variables in Lithuania, Latvia and Estonia prior to applying autocorrelation-corrected procedures. The table shows that only Latvia had a statistically significant predictor—GDPpct (Beta = −0.532 p = 0.008). None of the variables in Lithuania or Estonia were statistically significant in the initial OLS model.
Table A1.
Coefficients of the main regression model by country.
Table A1.
Coefficients of the main regression model by country.
| Country | Variable | B (Unstandardised) | Standard Error | Beta (Standardised) | t-Statistic | p-Value | VIF |
|---|---|---|---|---|---|---|---|
| Lithuania | Constant | 35.727 | 2.329 | 15.337 | <0.001 | ||
| TRt | 0.090 | 0.580 | 0.048 | 0.155 | 0.878 | 1.952 | |
| GDPpct | 0.00004 | 0.000 | 0.194 | 0.634 | 0.535 | 1.933 | |
| FDIt | −0.241 | 0.135 | −0.398 | −1.783 | 0.092 | 1.024 | |
| Latvia | Constant | 39.144 | 1.643 | 23.825 | <0.001 | ||
| TRt | −0.778 | 0.557 | −0.302 | −1.397 | 0.180 | 1.907 | |
| GDPpct | 0.000 | 0.000 | −0.532 | −3.032 | 0.008 | 1.251 | |
| FDIt | 0.062 | 0.094 | 0.131 | 0.661 | 0.517 | 1.604 | |
| Estonia | Constant | 30.762 | 2.841 | 10.829 | <0.001 | ||
| TRt | 0.341 | 0.291 | 0.394 | 1.175 | 0.256 | 2.627 | |
| GDPpct | −0.00003 | 0.000 | −0.162 | −0.471 | 0.643 | 2.771 | |
| FDIt | 0.021 | 0.052 | 0.104 | 0.406 | 0.690 | 1.540 |
Appendix A.2
To address the autocorrelation detected in the primary OLS regressions, this section introduces a robustness specification (Model 9) that incorporates a lagged dependent variable. Despite the limited number of observations, the improved Durbin–Watson statistics (see Table A2) and the consistency of coefficients (see Table A3) support the reliability of the results.
Table A2.
Summary of the robust regression model by country, including lagged dependent variable (GINIt−1).
Table A2.
Summary of the robust regression model by country, including lagged dependent variable (GINIt−1).
| Country | R2 | Adjusted R2 | F(ANOVA) | p-Value | Standard Error | Durbin–Watson |
|---|---|---|---|---|---|---|
| Lithuania | 0.355 | 0.183 | 2.064 | 0.137 | 1.187 | 1.677 |
| Latvia | 0.633 | 0.535 | 6.458 | 0.003 | 0.832 | 1.859 |
| Estonia | 0.505 | 0.373 | 3.830 | 0.024 | 1.067 | 1.592 |
Table A3.
Coefficients of the robust regression model by country, including lagged dependent variable (GINIt−1).
Table A3.
Coefficients of the robust regression model by country, including lagged dependent variable (GINIt−1).
| Country | Variable | B (Unstandardised) | Standard Error | Beta (Standardised) | t-Statistic | p-Value | VIF |
|---|---|---|---|---|---|---|---|
| Lithuania | Constant | 23.463 | 7.279 | 3.223 | 0.006 | ||
| TRt | −0.113 | 0.537 | −0.060 | −0.211 | 0.836 | 1.867 | |
| GDPpct | 0.0004 | 0.000 | 0.168 | 0.591 | 0.564 | 1.885 | |
| FDIt | −0.255 | 0.124 | −0.435 | −2.067 | 0.056 | 1.029 | |
| GINIt−1 | 0.360 | 0.206 | 0.370 | 1.745 | 0.101 | 1.043 | |
| Latvia | Constant | 48.368 | 9.375 | 5.159 | <0.001 | ||
| TRt | −1.344 | 0.656 | −0.473 | −2.050 | 0.058 | 2.177 | |
| GDPpct | 0.000 | 0.000 | −0.646 | −3.119 | 0.007 | 1.750 | |
| FDIt | 0.007 | 0.099 | 0.015 | 0.071 | 0.944 | 1.828 | |
| GINIt−1 | −0.193 | 0.226 | −0.189 | −0.855 | 0.406 | 1.994 | |
| Estonia | Constant | 11.608 | 7.073 | 1.641 | 0.122 | ||
| TRt | 0.112 | 0.260 | 0.126 | 0.429 | 0.674 | 2.621 | |
| GDPpct | 0.000 | 0.000 | −0.041 | −0.140 | 0.891 | 2.556 | |
| FDIt | 0.031 | 0.044 | 0.158 | 0.698 | 0.496 | 1.548 | |
| GINIt−1 | 0.615 | 0.214 | 0.617 | 2.876 | 0.012 | 1.396 |
References
- World Travel & Tourism Council. Global Travel & Tourism Sector Suffered a Loss of Almost US$4.5 Trillion in 2020 due to the Impact of COVID-19. Available online: https://wttc.org/news/global-tandt-sector-suffered-a-loss-of-almost-us4-trillion-in-2020 (accessed on 2 September 2025).
- Chancel, L.; Piketty, T.; Saez, E.; Zucman, G. World Inequality Report 2022; World Inequality Lab: Paris, France, 2022; Available online: https://wir2022.wid.world/www-site/uploads/2021/12/WorldInequalityReport2022_Full_Report.pdf (accessed on 6 October 2025).
- Haddad, C.N.; Mahler, D.G.; Diaz-Bonilla, C.; Hill, R.; Lakner, C.; Ibarra, G.L. The World Bank’s New Inequality Indicator: The Number of Countries with High Inequality; World Bank: Washington, DC, USA, 2024; Available online: https://documents1.worldbank.org/curated/en/099549506102441825/pdf/IDU-bd155bac-6d78-43af-8833-f87564a9d6c8.pdf (accessed on 6 October 2025).
- Tanjitpiyanond, P.; Jetten, J.; Peters, K. How economic inequality shapes social class stereotyping. J. Exp. Soc. Psychol. 2022, 98, 104248. [Google Scholar] [CrossRef]
- Lagos, K.; Wang, Y. International tourism and poverty alleviation: Cross-country evidence using panel quantile fixed effects approach. J. Travel Res. 2023, 62, 1347–1371. [Google Scholar] [CrossRef]
- Zhang, H.; Yang, Y. Is tourism growth able to shrink economic inequalities? A DSGE analysis. Ann. Tour. Res. Empir. Insights 2023, 4, 100089. [Google Scholar] [CrossRef]
- Ghosh, S.; Mitra, S.K. Tourism and inequality: A relook on the Kuznets curve. Tour. Manag. 2021, 83, 104255. [Google Scholar] [CrossRef]
- Sun, Y.Y.; Li, M.; Lenzen, M.; Malik, A.; Pomponi, F. Tourism, job vulnerability and income inequality during the COVID-19 pandemic: A global perspective. Ann. Tour. Res. Empir. Insights 2022, 3, 100046. [Google Scholar] [CrossRef]
- Dossou, T.A.M.; Kambaye, E.N.; Berhe, M.W.; Alinsato, A.S. Toward efforts to lessen income inequality in Asia: Exploring synergies between tourism and governance quality. Tour. Manag. Perspect. 2023, 46, 101086. [Google Scholar] [CrossRef]
- Eurostat. Arrivals at Tourist Accommodation Establishments. Available online: https://ec.europa.eu/eurostat/databrowser/view/tour_occ_arnat__custom_18286278/default/table (accessed on 2 September 2025).
- Bank of Lithuania. Balance of Payments. Available online: https://www.lb.lt/en/external-statistics-3 (accessed on 2 September 2025).
- Latvian Bank. BOP Quarterly/Annual Data Tables. Available online: https://statdb.bank.lv/lb/Data/200/f4abf359a948d399593ce09b85f6120c-html (accessed on 2 September 2025).
- Estonian Bank. Balance of Payments. Available online: https://statistika.eestipank.ee/#/en/p/436/r/1950/1799 (accessed on 2 September 2025).
- Eurostat. Unemployment by Sex and Age—Annual Data. Available online: https://ec.europa.eu/eurostat/databrowser/view/une_rt_a__custom_17959014/default/table (accessed on 6 October 2025).
- Alam, M.S.; Paramati, S.R. The impact of tourism on income inequality in developing economies: Does Kuznets curve hypothesis exist? Ann. Tour. Res. 2016, 61, 111–126. [Google Scholar] [CrossRef]
- Nguyen, C.P.; Schinckus, C.; Su, T.D.; Chong, F.H.L. The Influence of Tourism on Income Inequality. J. Travel Res. 2021, 60, 1426–1444. [Google Scholar] [CrossRef]
- Subramaniam, Y.; Masron, T.A.; Loganathan, N. Tourism and income inequality. J. Bus. Socioecon. Dev. 2022, 2, 181–194. [Google Scholar] [CrossRef]
- Zhang, J. The nonlinear effects of tourism on rural income inequality and urban–rural income inequality: Evidence from China. Tour. Econ. 2023, 29, 172–193. [Google Scholar] [CrossRef]
- Wang, Y.; Tziamalis, A. International tourism and income inequality: The role of economic and financial development. Tour. Econ. 2023, 29, 1836–1864. [Google Scholar] [CrossRef]
- European Commission. Addressing Income Inequalities Through Development Cooperation: A Quick Guide; Publications Office of the European Union: Luxembourg, 2022; Available online: https://data.europa.eu/doi/10.2841/209509 (accessed on 2 September 2025).
- Peterson, E.W.F. Is Economic Inequality Really a Problem? A review of the arguments. Soc. Sci. 2017, 6, 147. [Google Scholar] [CrossRef]
- Wang, Z. The Dynamics of Disparity: A Comprehensive Analysis of the Causes and Consequences of Income and Wealth Inequality and Policy Interventions for Mitigation. Trans. Econ. Bus. Manag. Res. 2024, 10, 131–138. [Google Scholar] [CrossRef]
- Foster, J.; Sen, A. On Economic Inequality; Oxford University Press: Oxford, UK, 1997. [Google Scholar]
- International Monetary Fund. Fiscal Policy and Income Inequality; International Monetary Fund: Washington, DC, USA, 2014; Available online: https://www.imf.org/en/Publications/Policy-Papers/Issues/2016/12/31/Fiscal-Policy-and-Income-Inequality-PP4849 (accessed on 6 October 2025).
- Dorjnyambuu, B.A. Systematic Literature Review of Income Inequality in Central–Eastern European Countries. Comp. Econ. Stud. 2025, 67, 1–49. [Google Scholar] [CrossRef]
- Bapuji, H. Individuals, interactions and institutions: How economic inequality affects organizations. Hum. Relat. 2015, 68, 1059–1083. [Google Scholar] [CrossRef]
- Borio, C., II. The Distributional Footprint of Monetary Policy. In BIS Annual Economic Report 2021; Bank for International Settlements: Basel, Switzerland, 2021; Available online: https://www.bis.org/publ/arpdf/ar2021e2.pdf (accessed on 6 January 2025).
- Salverda, W.; Nolan, B.; Smeeding, T.M. The Oxford Handbook of Economic Inequality; Oxford University Press: Oxford, UK, 2009. [Google Scholar]
- International Monetary Fund. Income inequality. Introduction to Inequality. Available online: https://www.imf.org/en/Topics/Inequality/introduction-to-inequality (accessed on 6 October 2025).
- Heath, J. Three sources of economic inequality. Soc. Philos. Policy 2023, 39, 99–121. [Google Scholar] [CrossRef]
- Duong, K. If inequality is an economic choice, what is the relationship between inequality and growth? Struct. Change Econ. Dyn. 2025, 74, 116–128. [Google Scholar] [CrossRef]
- O’Connor, N.; Staunton, C. Cherishing All Equally: Economic Inequality in Ireland; TASC: Dublin, Ireland, 2015; Available online: http://www.tasc.ie/download/pdf/tasc_cherishing_all_equally_web.pdf (accessed on 2 September 2025).
- Clark, A.E.; D’Ambrosio, C. Attitudes to Income Inequality: Experimental and Survey Evidence. In Handbook of Income Distribution. Volume 2A; Atkinson, A.B., Bourguignon, F., Eds.; Elsevier: Amsterdam, The Netherlands, 2015; pp. 1147–1208. [Google Scholar] [CrossRef]
- Nissanke, M.; Thorbecke, E. Channels and policy debate in the globalization–inequality–poverty nexus. World Dev. 2006, 34, 1338–1360. [Google Scholar] [CrossRef]
- Ghosh, A.; Chattopadhyay, N.; Chakrabarti, B.K. Inequality in societies, academic institutions and science journals: Gini and k-indices. Phys. A Stat. Mech. Its Appl. 2014, 410, 30–34. [Google Scholar] [CrossRef]
- Eurostat. Glossary: Gini Coefficient. Available online: https://ec.europa.eu/eurostat/statistics-explained/index.php?title=Glossary:Gini_coefficient (accessed on 2 September 2025).
- World Travel & Tourism Council. World Travel & Tourism Economic Impact Research Factsheet. Available online: https://researchhub.wttc.org/product/factsheet-world-travel-tourism-economic-impact-research (accessed on 2 September 2025).
- Paramati, S.R.; Thien Nguyen, T.P. The effects of national and international tourism on income inequality: Evidence from Asia-Pacific economies. Equal. Divers. Incl. Int. J. 2023, 43, 1–22. [Google Scholar] [CrossRef]
- Castilho, D.; Fuinhas, J.A. Exploring the effects of tourism capital investment on income inequality and poverty in the European Union countries. J. Econ. Struct. 2025, 14, 6. [Google Scholar] [CrossRef]
- Gnangnon, S.K. Impact of international tourism receipts on public revenue in developed and developing countries. Tour. Rev. 2020, 75, 809–826. [Google Scholar] [CrossRef]
- Li, H.; Chen, J.L.; Li, G.; Goh, C. Tourism and regional income inequality: Evidence from China. Ann. Tour. Res. 2016, 58, 81–99. [Google Scholar] [CrossRef]
- Zhang, J. The effects of tourism on income inequality: A meta-analysis of econometrics studies. J. Hosp. Tour. Manag. 2021, 48, 312–321. [Google Scholar] [CrossRef]
- Haini, H.; Wei Loon, P.; Yong, S.K.; Husseini, S. Does Social Globalization Affect the Relationship Between International Tourism and Economic Growth? J. Travel Res. 2023, 63, 252–269. [Google Scholar] [CrossRef]
- Carrera, E.J.S.; Rombaldoni, R.; Pozzi, R. Socioeconomic inequalities in Europe. Econ. Anal. Policy 2021, 71, 307–320. [Google Scholar] [CrossRef]
- Royal, S.; Singh, K. Equitable wealth creation and MSME promotion: A policy perspective. Dev. Sustain. Econ. Financ. 2025, 7, 100089. [Google Scholar] [CrossRef]
- Abdi, A.H.; Mohamed, A.A.; Mohamed, A.A.; Mohamed, A.A. Do globalization, foreign direct investment, and inflation drive income inequality? Evidence from Somalia within the Kuznets curve hypothesis. Res. Glob. 2025, 11, 100301. [Google Scholar] [CrossRef]
- International Monetary Fund. Balance of Payments and International Investments Position, 6th ed.; International Monetary Fund: Washington, DC, USA, 2009; Available online: https://www.imf.org/external/pubs/ft/bop/2007/pdf/bpm6.pdf (accessed on 6 October 2025).
- United Nations. Tourism Satellite Account: Recommended Methodological Framework 2008 (Series F, No. 80); United Nations: New York, NY, USA, 2008; Available online: https://unstats.un.org/unsd/publication/seriesf/seriesf_80rev1e.pdf (accessed on 2 September 2025).
- Eurostat. Gini Coefficient of Equivalised Disposable Income. Available online: https://ec.europa.eu/eurostat/databrowser/view/ilc_di12__custom_18469304/default/table (accessed on 2 September 2025).
- World Bank. Gini Index. Available online: https://databank.worldbank.org/source/gender-statistics/Series/SI.POV.GINI (accessed on 2 September 2025).
- Helpman, E.; Itskhoki, O.; Redding, S. Inequality and unemployment in a Global economy. Econometrica 2010, 87, 1239–1283. Available online: https://www.jstor.org/stable/40928439 (accessed on 2 September 2025). [CrossRef]
- Eurostat. Gross Domestic Product (GDP) and Main Components. Available online: https://ec.europa.eu/eurostat/databrowser/view/nama_10_gdp__custom_19151691/default/table (accessed on 1 December 2025).
- Eurostat. Gross Domestic Product (GDP) and Main Components per Capita. Available online: https://ec.europa.eu/eurostat/databrowser/view/nama_10_pc__custom_19172109/default/table (accessed on 2 September 2025).
- Estonian Statistics. Unemployment Rate by Indicator, Group of Persons and Reference Period. Available online: https://andmed.stat.ee/en/stat/sotsiaalelu__tooturg__tootud__aastastatistika/TT70/table/tableViewLayout2 (accessed on 2 September 2025).
- World Bank. Foreign Direct Investment, Net Inflows (% of GDP). Available online: https://databank.worldbank.org/source/world-development-indicators (accessed on 2 September 2025).
- Sokhanvar, A.; Jenkins, G.P. Impact of foreign direct investment and international tourism on long run economic growth of Estonia. J. Econ. Stud. 2022, 49, 2. 364–378. [Google Scholar] [CrossRef]
- World Competitiveness Center. World Competitiveness Ranking. Available online: https://www.imd.org/centers/wcc/world-competitiveness-center/rankings/world-competitiveness-ranking/rankings/wcr-rankings/#_tab_List (accessed on 2 December 2025).
- Ahas, R.; Aasa, A.; Mark, U.; Pae, T.; Kull, A. Seasonal tourism spaces in Estonia: Case study with mobile positioning data. Tour. Manag. 2007, 28, 898–910. [Google Scholar] [CrossRef]
- OECD. Key Tourism Economic Indicators. Tourism Share of Employment. Available online: https://data-explorer.oecd.org/vis?lc=en&fs[0]=Topic%2C1%7CIndustry%252C%20business%20and%20entrepreneurship%23STI%23%7CTourism%23STI_TOR%23&pg=0&fc=Topic&bp=true&snb=7&vw=tb&df[ds]=dsDisseminateFinalDMZ&df[id]=DSD_TOURISM_KEY%40DF_KEY_IND_PC&df[ag]=OECD (accessed on 4 December 2025).
- Ministry of Economics Republic of Latvia. Latvia’s Tourism Development Action Plan 2021–2027. Available online: https://www.em.gov.lv/sites/em/files/turisma_ricibas_plans_2021_202720brandtour_final201.pdf (accessed on 4 December 2025).
- Ministry of Economic Affairs and Communications. The Long-Term Outlook for Estonian tourism 2025–2035. Creating Value Sustainably. Available online: https://mkm.ee/sites/default/files/documents/2025-05/MKM_Estonian-Tourism-Long-Vision_25-35_WEB%20%281%29.pdf (accessed on 4 December 2025).
- Pilving, T.; Kull, T.; Suškevics, M.; Viira, A.H. The tourism partnership life cycle in Estonia: Striving towards sustainable multisectoral rural tourism collaboration. Tour. Manag. Perspect. 2019, 31, 219–230. [Google Scholar] [CrossRef]
- Smith, M. Baltic health tourism: Uniqueness and commonalities. Scand. J. Hosp. Tour. 2015, 15, 357–379. [Google Scholar] [CrossRef]
- Bočkus, D.; Sulkinoja, E.; Kolesnikova, N.; Komppula, R. Differences in the concept of wellness and its materialisation in service offering: A multiple case study from Eastern Finland, Russian Karelia, and Lithuania. Tour. Recreat. Res. 2024, 1, 75–90. [Google Scholar] [CrossRef]
- Serdane, Z. Slow philosophy in tourism development in Latvia: The supply side perspective. Tour. Plan. Dev. 2020, 17, 3. 295–312. [Google Scholar] [CrossRef]
- Eurostat. Balance of Payments by Country—Annual Data (BPM6). Available online: https://ec.europa.eu/eurostat/databrowser/view/bop_c6_a__custom_19491889/default/table (accessed on 29 December 2025).
Disclaimer/Publisher’s Note: The statements, opinions and data contained in all publications are solely those of the individual author(s) and contributor(s) and not of MDPI and/or the editor(s). MDPI and/or the editor(s) disclaim responsibility for any injury to people or property resulting from any ideas, methods, instructions or products referred to in the content. |
© 2026 by the authors. Licensee MDPI, Basel, Switzerland. This article is an open access article distributed under the terms and conditions of the Creative Commons Attribution (CC BY) license.