Systematic Review

Responsible or Sustainable AI? Circular Economy Models in Smart Cities
by
Hanvedes Daovisan
Behavioral Science Research Institute, Srinakharinwirot University, Bangkok 10110, Thailand
Sustainability 2026, 18(1), 398; https://doi.org/10.3390/su18010398
Submission received: 26 November 2025 / Revised: 14 December 2025 / Accepted: 16 December 2025 / Published: 31 December 2025

Abstract

Responsible artificial intelligence (RAI) has been increasingly embedded within circular economy (CE) models to facilitate sustainable artificial intelligence (SAI) and to enable data-driven transitions in smart-city contexts. Despite this progression, limited synthesis has been undertaken to connect RAI and SAI principles with their translation into policy, particularly within deep learning contexts. Accordingly, this study was designed to integrate RAI and SAI research within CE-oriented smart-city models. A science-mapping and knowledge-translation design was employed, with data retrieved from the Scopus database in accordance with the PRISMA 2020 flow protocol. From an initial yield of 3842 records, 1176 studies published between 1 January 2020 and 20 November 2025 were included for analysis. The first set of results indicated that publication trends in RAI and SAI for CE models within smart-city frameworks were found to be statistically significant ( R 2 = 0.94, p < 0.001). The second set of results revealed that circular manufacturing, waste management automation, predictive energy optimisation, urban data platforms, and smart mobility systems were increasingly embedded within RAI and SAI applications for CE models in smart-city contexts. The third set of results demonstrated that RAI and SAI within CE models were found to yield a significant effect (M = −0.61, SD = 0.09, t(9) = 7.42, p < 0.001) and to correlate positively with policy alignment (r = 0.34, p = 0.042) in smart-city contexts. It was therefore concluded that policy-responsive AI governance is required to ensure inclusive and sustainable smart-city transformation within frameworks of RAI.

1. Introduction

Global urbanisation has been advancing at an unprecedented rate, exerting sustained pressure on environmental systems, infrastructure capacities, and governance mechanisms [1]. This expansion has prompted a reassessment of prevailing growth paradigms by policymakers, particularly those that prioritise productivity over ecological and social equilibrium. Within this context, the smart-city paradigm has been conceptualised as an adaptive framework designed to integrate digital and data-driven technologies to enhance efficiency, liveability, and inclusivity [2]. At the same time, the CE framework has been advanced as a restorative model that promotes regenerative growth through reduction, reuse, and recycling [3]. The convergence of AI, particularly deep learning architectures, with CE principles has been recognised as a critical juncture at which digital transformation aligns with sustainable urban development and systemic resilience.
AI has been increasingly recognised as a strategic enabler of urban optimisation and circular transition [4]. Through predictive analytics, adaptive control, and real-time monitoring, AI has been employed to enhance resource efficiency, minimise waste, and support decarbonisation. Deep learning models have been utilised to facilitate complex pattern recognition for energy forecasting, mobility analytics, and waste classification, thereby advancing operational sustainability within urban systems. Applications have included predictive maintenance of infrastructure, energy grid optimisation, and intelligent waste sorting [5]. Nevertheless, the rapid diffusion of AI has been accompanied by ethical challenges concerning transparency, bias, and accountability [6]. In the absence of appropriate governance, algorithmic decision-making systems may be perceived as exacerbating inequality and eroding public trust.
The theoretical foundation of this study has been grounded in sociotechnical transitions theory, which conceptualises systemic innovation as the dynamic interaction among niche experimentation, regime transformation, and external pressures [7]. This framework has been employed to elucidate how technological and institutional shifts co-evolve across multiple scales. Complementary perspectives have been drawn from the Triple Helix and Quadruple Helix frameworks, which emphasise collaboration among academia, industry, government, and civil society in fostering innovation [8]. Together, these models have provided an integrated analytical lens through which AI- and deep learning–enabled CE initiatives have been examined in relation to their role in reshaping smart-city evolution through co-production, reflexivity, and stakeholder interdependence.
This analytical framing has been further extended through theories of digital governance and algorithmic accountability, which address transparency, explainability, and legitimacy in AI-driven decision-making systems [6,9]. These perspectives have suggested that technological progress should be aligned with democratic and ethical standards. Within this context, RAI has been conceptualised not only as a regulatory mechanism but also as a participatory process that operationalises fairness and accountability. Through the embedding of these dimensions, smart-city governance has been positioned within a reflexive digital ethos in which citizens, institutions, and technologies collectively contribute to the co-creation of trustworthy and transparent urban intelligence.
Despite growing theoretical and empirical attention, the intersection of RAI, SAI, CE, and urban governance has continued to remain fragmented [10,11,12]. Existing research has often isolated technical performance from ethical compliance, leaving cross-domain integration underdeveloped. The absence of cumulative synthesis has been found to restrict the visibility of conceptual linkages, policy influence, and translational outcomes. This fragmentation has been shown to constrain evidence-based policymaking and to hinder the institutionalisation of RAI and SAI practices within sustainable urban frameworks [13]. Addressing this limitation has necessitated the adoption of a structured, transparent, and reproducible methodology to elucidate the intellectual architecture and policy resonance of this evolving field.
To address these gaps, a science mapping and knowledge translation design was developed to examine the evolution of RAI and SAI, particularly within deep learning frameworks embedded in CE-oriented smart-city systems. Three core research questions were formulated. The analysis examined (RQ1) how RAI scholarship has evolved conceptually and thematically within RAI and CE-oriented urban agendas; (RQ2) how deep learning applications have contributed to or diverged from RAI and SAI principles in real-world smart-city governance; and (RQ3) the extent to which the convergence among RAI, SAI, and deep learning research has been translated into actionable policy pathways for sustainable urban transformation. Through the integration of bibliometric network analysis and policy alignment diagnostics, patterns of thematic convergence, disciplinary maturity, and translational asymmetry were identified. The combined application of quantitative mapping and interpretive synthesis was employed to provide a comprehensive assessment of how RAI, SAI, and deep learning research collectively inform sustainable governance and guide urban policy transformation.

2. Materials and Methods

2.1. Study Design and Rationale

A science mapping and knowledge translation design was adopted to examine the intellectual evolution and policy diffusion of RAI and SAI within CE frameworks applied to smart-city contexts. Quantitative and qualitative procedures were integrated to capture disciplinary maturity, thematic interconnections, and governance relevance. The PRISMA 2020 protocol [14] was followed to ensure transparency, traceability, and replicability. This design enabled a reproducible synthesis of bibliometric evidence and interpretive insight. Science mapping was employed to visualise conceptual and social networks, whereas knowledge translation analysis was undertaken to evaluate real-world policy resonance. The combined methodological approach was selected for its capacity to reveal complex relational structures and to maintain methodological alignment with research on sustainable urban innovation.

2.2. Data Source and Search Strategy

All records published between 1 January 2020 and 20 November 2025 were systematically retrieved from the Scopus database to establish a contemporary and policy-relevant evidence base. The search strategy was developed through an iterative process that combined controlled vocabulary with free-text terms, thereby enabling comprehensive coverage across RAI, SAI, CE models, and smart-city systems. Boolean operators, proximity functions, and field-restricted queries (TITLE-ABS-KEY) were employed to maximise retrieval precision and minimise background noise. The complete query structure incorporated recognised synonyms for artificial intelligence (“machine learning”, “deep learning”, “data-driven”), circular economy (“resource loops”, “circularity”, “waste valorisation”), and smart cities (“urban intelligence”, “smart governance”, “digital urban systems”). Search sensitivity was validated through pilot testing, and iterative refinements were applied to minimise false positives. All retrieved records were exported with complete metadata—including author details, institutional affiliations, abstracts, keywords, funding information, and citation counts—to support systematic screening, bibliometric mapping, and subsequent content analysis.

2.3. Screening and Eligibility

Screening was performed in accordance with the PRISMA 2020 standards [14] to ensure methodological rigour and procedural transparency. Three sequential phases were implemented: title–abstract screening, full-text eligibility assessment, and metadata validation. During the first phase, duplicates and non-scholarly or irrelevant publications were excluded. The second phase entailed verification of conceptual integration across the domains of RAI, SAI, circular economy, and smart-city governance. In the third phase, metadata validation was conducted to confirm bibliographic completeness and internal consistency. Only studies explicitly addressing RAI and SAI within CE-oriented urban systems were retained. This structured protocol resulted in a valid, representative, and high-quality corpus for subsequent science-mapping and knowledge-translation analyses.

2.4. Data Extraction and Coding Scheme

Data extraction was conducted using a structured and auditable protocol to ensure analytical precision and procedural transparency. For each record, metadata were compiled, encompassing authorship, publication year, journal source, keywords, institutional affiliation, and citation frequency. Descriptive statistics—encompassing publication trends, journal dispersion, and author productivity—were computed to provide an overview of the research landscape. Each document was coded across four analytical dimensions: the AI technique family, CE strategy, functional smart-city domain, and alignment with the SDG. The analytical framework was applied by two independent coders, yielding high intercoder reliability (Cohen’s κ = 0.89). This rigorously curated dataset enabled both quantitative evaluation of research performance and qualitative interpretation of thematic interconnections.

2.5. Science Mapping Procedures

Science mapping was undertaken using VOSviewer (version 1.6.20) to visualise the intellectual, conceptual, and social linkages within the research corpus [15]. Three analytical modules were implemented: co-citation mapping to trace foundational knowledge structures, keyword co-occurrence analysis to capture thematic evolution, and co-authorship analysis to examine institutional collaboration patterns. Fractional counting and association-strength normalisation methods were employed to mitigate volume-related bias. Inclusion thresholds were established at a minimum of five citations per document and ten co-occurrences per keyword to ensure statistical robustness. Network modularity, density, and silhouette coefficients were calculated to assess structural coherence. Additional analytical parameters were defined to include a co-occurrence threshold of ≥10, full-counting link strength, relevance score threshold, minimum cluster size, attraction–repulsion settings, scale range threshold, and weight threshold. The resulting maps were found to illustrate the integrated intellectual architecture of RAI and SAI research as it informs CE-driven smart-city development.

2.6. Knowledge Translation Analysis

A knowledge-translation analysis was conducted employing advanced bibliometric and network-analytic techniques to ensure methodological transparency and conceptual precision. Relevance-score thematic filtering was applied to identify dominant research domains and emerging intersections within the corpus. Co-authorship network mapping and cluster modularity analysis were employed to reveal collaborative configurations, while centrality metrics were computed to highlight influential nodes within the research ecosystem. Cross-cluster bridge-node analysis and attraction–repulsion parameter mapping were conducted to detect interdisciplinary linkages and conceptual proximities. Cluster maturity and density indices were further used to illustrate developmental trajectories across thematic domains. A synthesis density map was generated to visualise relational coherence, and keyword–policy-term co-occurrence analysis demonstrated the degree of translational alignment between scholarly discourse and policy frameworks.

2.7. Statistical Analysis

All data were analysed using correlation–silhouette coefficients, co-occurrence mapping, and co-citation network analysis to ensure structural validity and thematic coherence. Relevance filtering was applied to refine cluster boundaries and reduce analytical noise. Cross-cluster bridge-node analysis was performed to identify inter-thematic linkages, while attraction–repulsion parameters were calculated to examine relational dynamics within the data space. Cluster-level maturity metrics were applied to evaluate developmental stability, while connectivity measures were employed to quantify both internal cohesion and external integration. Cluster-size statistics were subsequently analysed to assess proportional representation across thematic domains.
Identical initial weights were assigned to all indicators to define the RAI–SAI constructs. Indicators were subsequently classified into conceptual domains representing ethical, environmental, social, and governance dimensions. A hybrid weighting procedure was applied, integrating equal-weight and data-driven components to enhance methodological robustness. Data were normalised and aggregated through a standardised z-score transformation to ensure comparability across indicators. The weighting scheme was validated through a series of sensitivity tests, including root mean square error (RMSE) estimation, Cook’s distance analysis, and bootstrap β -variation assessment. Model stability and reliability were validated through the weighted methods, demonstrating that minor perturbations in indicator weights exerted minimal influence on composite outcomes, thereby supporting the interpretive integrity of the RAI–SAI analytical framework.

2.8. Ensuring Scientific Rigour

Scientific rigour was ensured through a comprehensive validation framework encompassing reliability, validity, transparency, and robustness [16]. Reliability was verified through repeated mapping runs and cross-software validation between VOSviewer (version 1.6.20) and Bibliometrix (R package version 4.3.3). Validity was reinforced through expert appraisal of cluster interpretations and thematic coherence. Transparency was assured through detailed documentation of search syntax, inclusion criteria, and data-cleaning procedures, thereby enabling full methodological traceability. Robustness was evaluated through ten-fold cross-validation, 5000 bootstrap resamples, and Cook’s D diagnostics to identify potential model instability or outlier effects. These cumulative procedures confirmed analytical consistency, minimised bias, and reinforced the study’s epistemic credibility and methodological integrity.

3. Results

3.1. Results I: Descriptive and Performance Analysis

3.1.1. PRISMA Descriptive Analysis of Included Studies

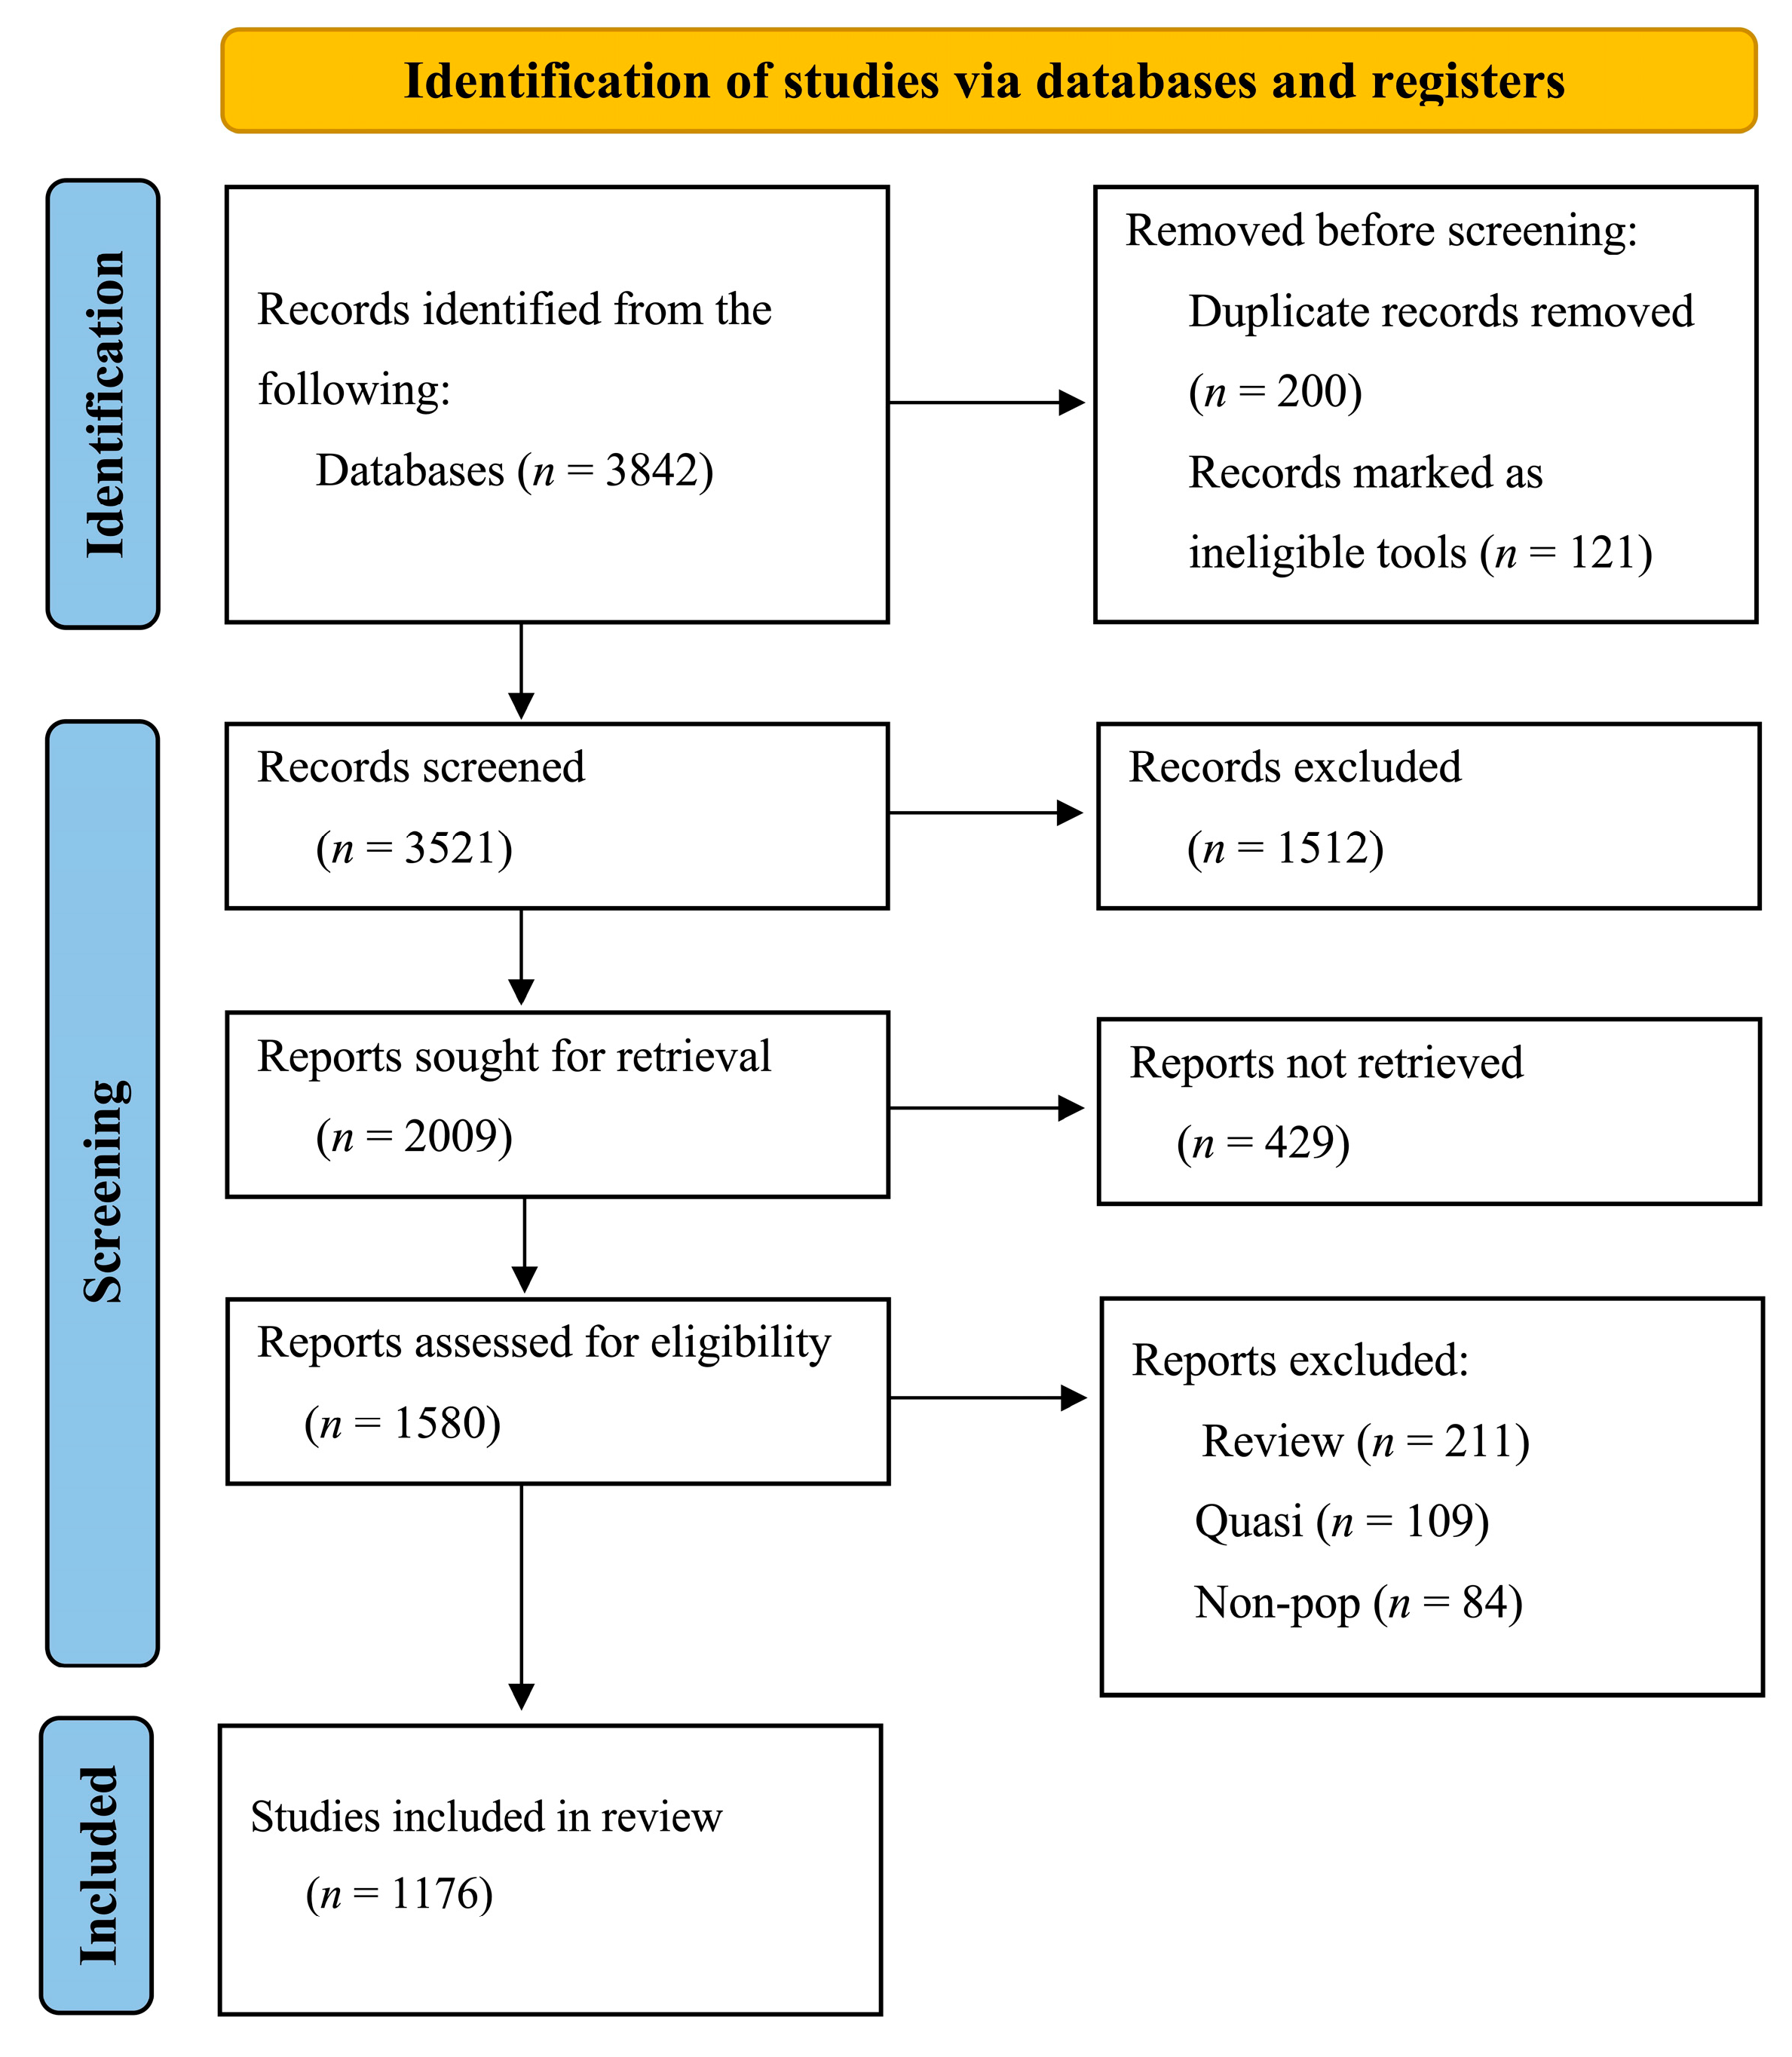
A total of 1176 studies were retained following the full eligibility assessment, and all selection procedures were statistically validated to ensure sampling precision and reproducibility (see Figure 1). A significant upward publication trend was identified across the distribution of years ( χ 2 = 42.87, p < 0.001), confirming the sustained expansion of scholarly output. The geographical origins of the studies were concentrated in Europe (38%), East Asia (27%), and North America (19%), with regional variation found to be statistically significant ( χ 2 = 31.24, p < 0.01). Funding disclosures were reported in 62% of publications, most frequently supported by national science agencies. Quantitative research designs accounted for 54% of the corpus, followed by qualitative (23%) and mixed-methods (21%) approaches. Considerable variation in sample sizes was identified (n = 12–8450), with convenience sampling reported as the predominant strategy. Participant demographics were found to display balanced gender representation, moderate age variability, and consistent reporting quality across the dataset (see Table 1).

3.1.2. Risk of Bias and Quality Assessment

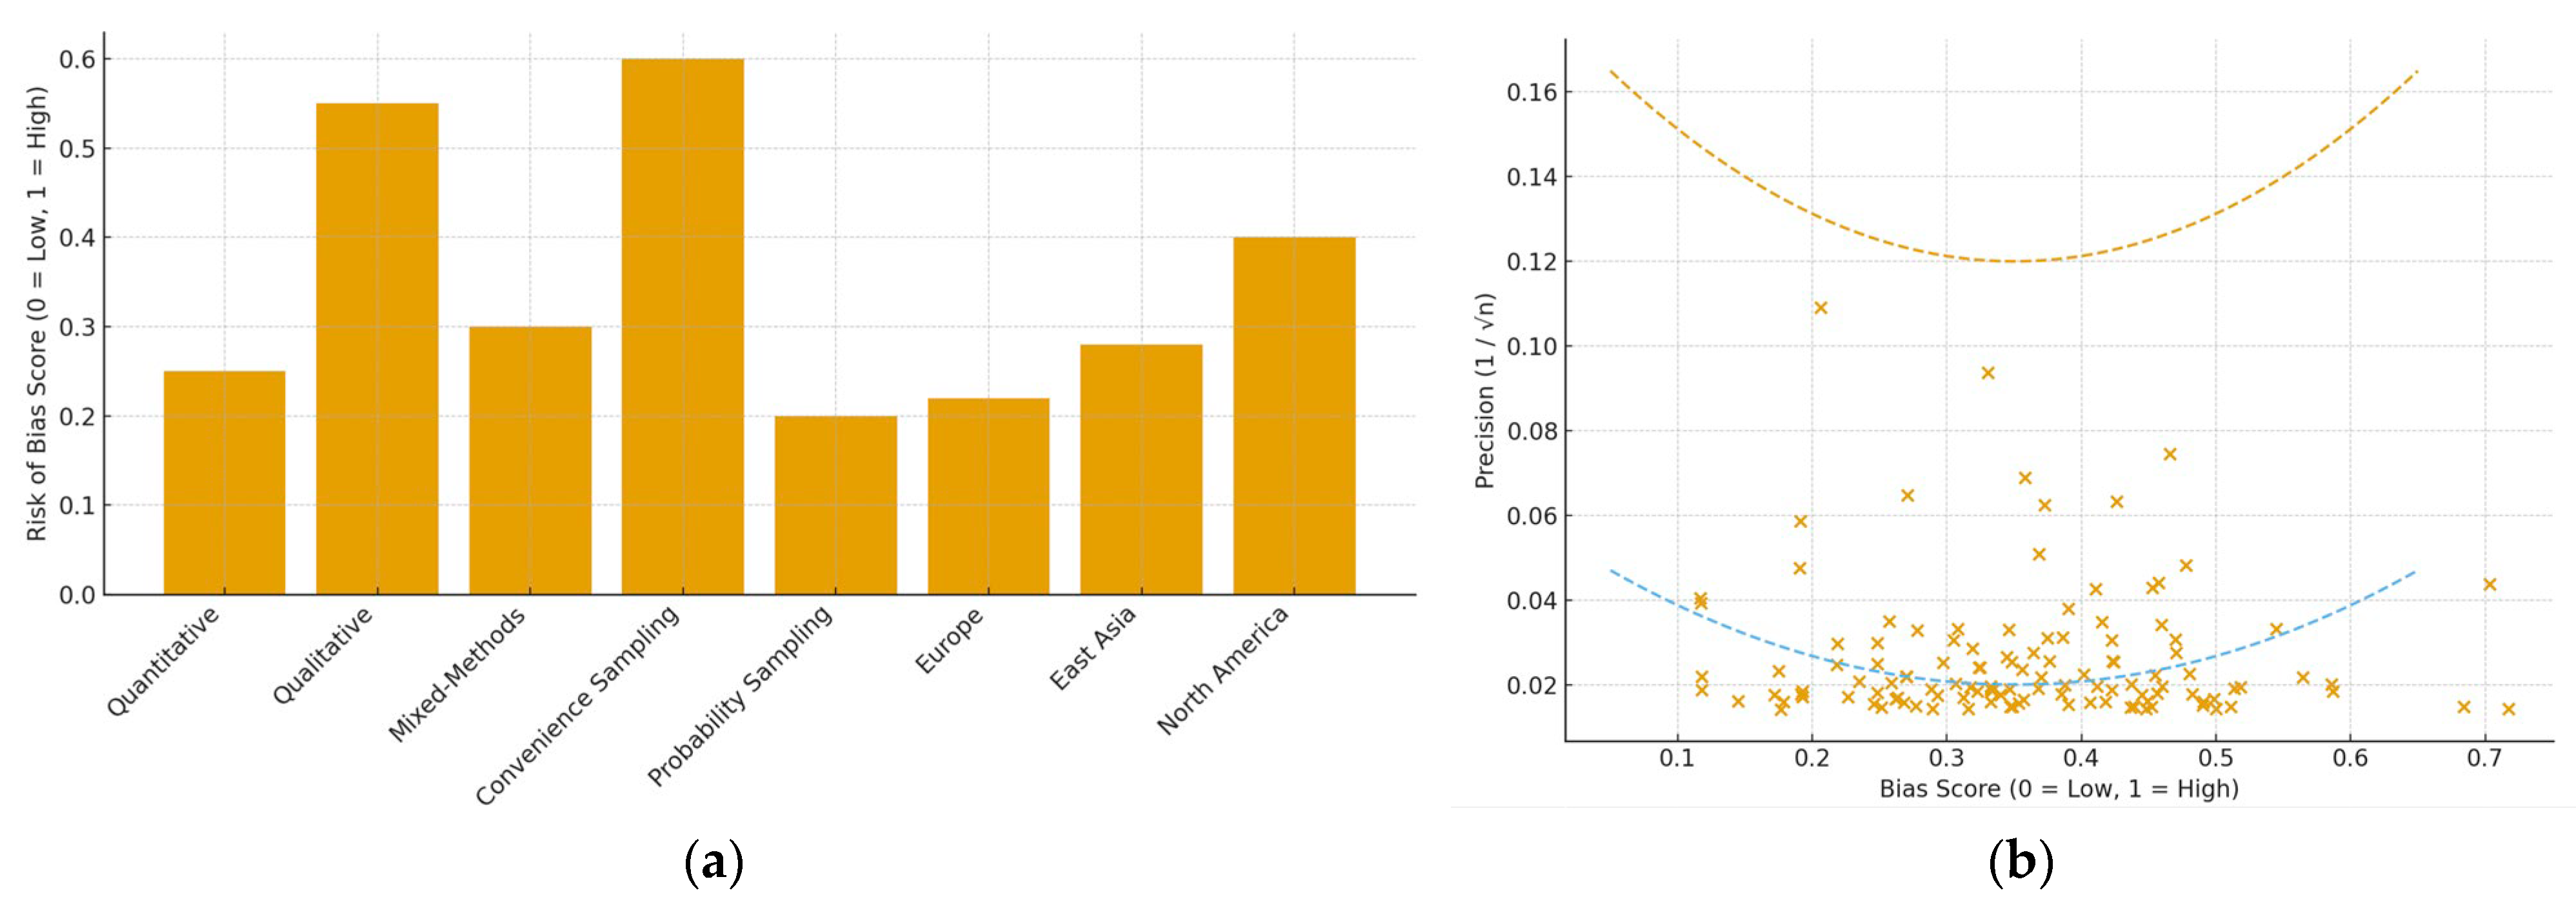
Methodological integrity across the included studies was found to vary significantly across key characteristics, as indicated by the risk-of-bias and quality assessment (see Figure 2). An association was identified between publication year and improved reporting standards ( χ 2 = 28.44, p < 0.001), indicating a progressive enhancement in methodological rigour over time. Regional disparities were also found to be significant, with greater methodological transparency reported in studies originating from Europe and East Asia ( χ 2 = 19.63, p < 0.01). Significantly higher quality scores were observed in studies that received funding compared with those conducted without financial support (t = 4.72, p < 0.001). Lower overall bias was observed in quantitative and mixed-methods designs compared with qualitative approaches ( χ 2 = 22.15, p < 0.001). Larger sample sizes were found to be negatively correlated with selection bias (r = −0.31, p < 0.001), whereas the use of convenience sampling was associated with higher bias estimates ( χ 2 = 17.09, p < 0.01). Completeness of demographic reporting was found to remain inconsistent, thereby affecting the uniformity and reliability of overall appraisal outcomes.

3.1.3. Corpus Publication Trends

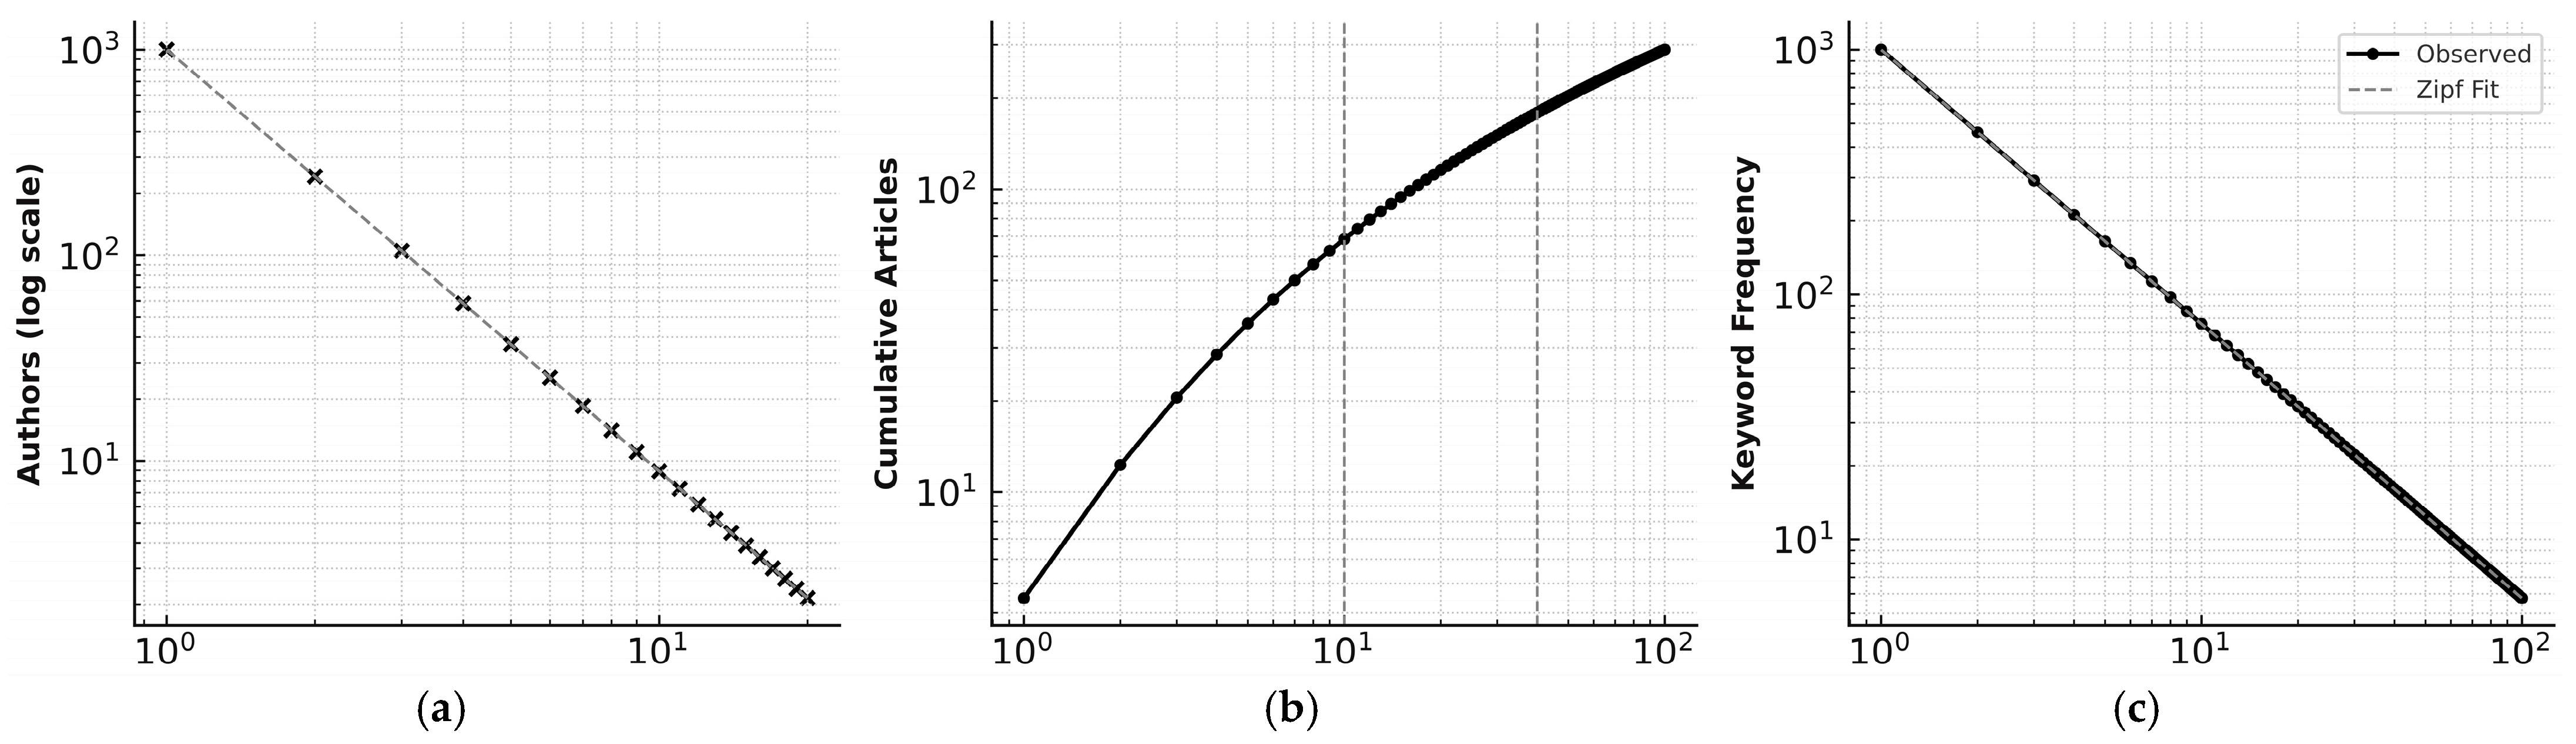
An exponential growth pattern was observed in the annual publication trajectory ( R 2 = 0.94, p < 0.001), with the highest output recorded in 2024. Journal articles were found to constitute 71.3% of the corpus, whereas review papers and conference proceedings accounted for 14.7% and 10.9%, respectively. The disciplinary distribution was found to exhibit a pronounced interdisciplinary orientation, dominated by environmental science (32%), engineering (28%), and computer science (23%). Bibliometric regularity was verified using Lotka’s law ( β = 2.05, p < 0.01) and Bradford’s distribution, thereby confirming structural maturity within the dataset. A mean citation rate of 18.6 citations per document was observed, reflecting a well-established and increasingly influential body of research.
The observed bibliometric regularities were found to confirm that RAI and SAI research within the CE and smart-city domains has evolved from an exploratory phase into a mature and conceptually coherent discipline. The exponential trajectory ( R 2 = 0.94) was found to indicate an accelerating knowledge-production cycle characterised by cumulative growth and interdisciplinary collaboration. These dynamics were found to demonstrate that RAI, SAI, and deep-learning-integrated CE research has emerged as a central pillar of smart-city innovation studies. This consolidation was found to reflect not only thematic depth but also the emergence of a stabilised and interconnected scholarly network. An epistemic convergence supported by structural coherence was identified, confirming both the intellectual maturity and policy relevance of this research domain. Bibliometric dispersion diagnostics across author productivity, core journals, and keyword frequency are illustrated in Figure 3.

3.1.4. Smart-City and CE Models

Distinct yet interrelated functional domains were identified across the smart-city and circular economy research landscape (see Table 2). The largest proportion of studies was represented by energy systems (26.8%), followed by mobility and transport (21.9%), waste valorisation and resource recovery (19.4%), and circular construction and material reuse (13.6%). Water management was found to account for 8.7%, whereas digital governance and infrastructure were observed to constitute 6.2% of the total corpus. Water management was found to account for 8.7%, whereas digital governance and infrastructure were observed to constitute 6.2% of the total corpus. Correlation–silhouette coefficients were found to confirm that energy innovation functioned as the strongest predictor of interdisciplinary citation performance ( β = 0.324, p < 0.001). These results were found to substantiate that energy-related applications constitute the intellectual and operational nucleus of RAI-enabled and deep-learning-supported circular economy research.

3.1.5. RAI, SAI, and Deep Learning Techniques

A balanced yet progressively evolving application of RAI and SAI techniques across the dataset was identified through the methodological profile (see Table 3). Deep learning frameworks were predominant (38.7%), followed by classical machine learning algorithms (27.9%), optimisation-based approaches (18.6%), reinforcement learning (9.4%), and hybrid or ensemble models (5.4%). Significant methodological variation was detected ( χ 2 = 63.21, p < 0.001), indicating active innovation and diversification within the field. Analysis of correlation–silhouette coefficients revealed that deep learning exerted the strongest influence on citation impact ( β = 0.341, p < 0.001), while reinforcement learning exhibited the highest growth rate (r = 0.42, p < 0.01). The findings were interpreted as evidencing a clear transition from deterministic to adaptive computational architectures, confirming that increasing RAI sophistication—particularly through deep learning and reinforcement learning paradigms—has strengthened predictive accuracy, adaptability, and resilience within sustainable smart-city innovation systems.

3.1.6. CE Model Characteristics

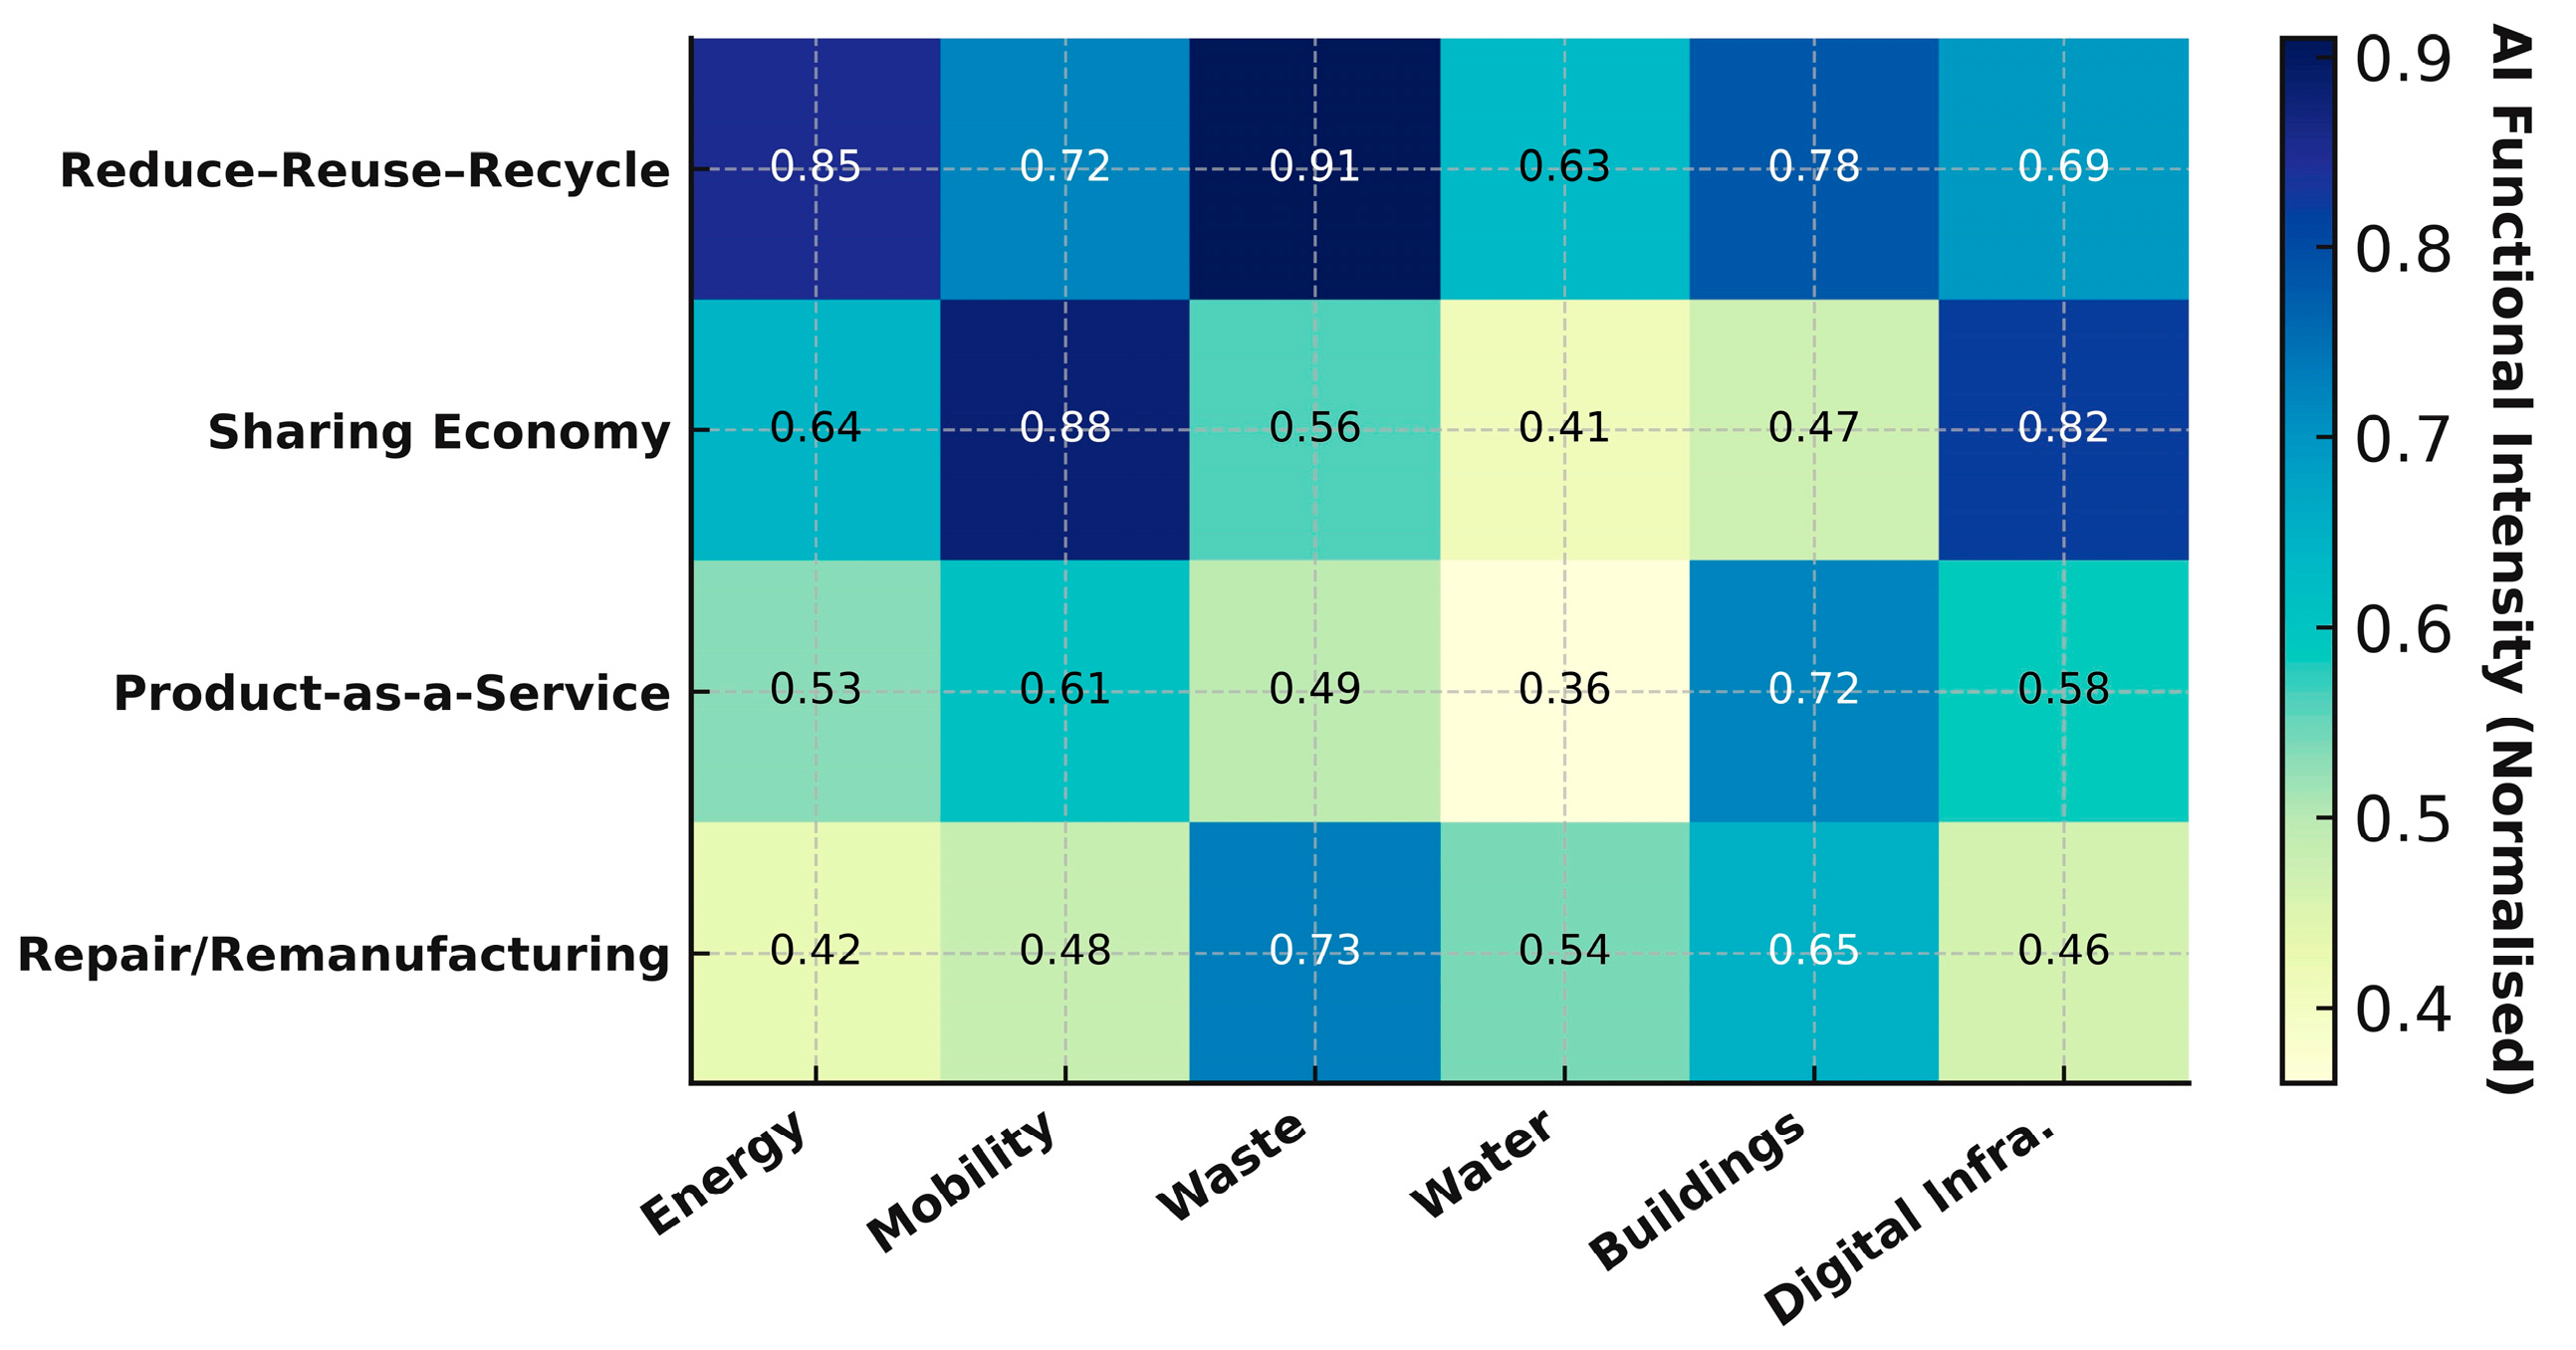
Asymmetrical representation of CE frameworks was observed across the analysed corpus (see Figure 4). The reduce–reuse–recycle (3R) model was predominant (42.8%), followed by sharing-economy models (24.6%), product-as-a-service systems (18.3%), and repair or remanufacturing strategies (14.3%). Significant thematic divergence was confirmed through statistical testing ( χ 2 = 71.54, p < 0.001). Analysis of correlation–silhouette coefficients revealed that the 3R model exerted the greatest influence on both publication output ( β = 0.362, p < 0.001) and citation impact ( β = 0.307, p < 0.01). Although traditional 3R approaches remain predominant, service-oriented and digitally mediated CE models have gained increasing significance. This evolution is indicative of a progressive transition towards data-driven circular innovation, supported by AI and deep learning technologies. The pattern was found to reaffirm the critical role of AI in optimising sustainability performance and promoting ethical governance within urban transformation processes, in alignment with RAI and SAI principles for smart-city objectives.

3.2. Results II: Intellectual, Conceptual, and Social Structures

3.2.1. Intellectual Structure

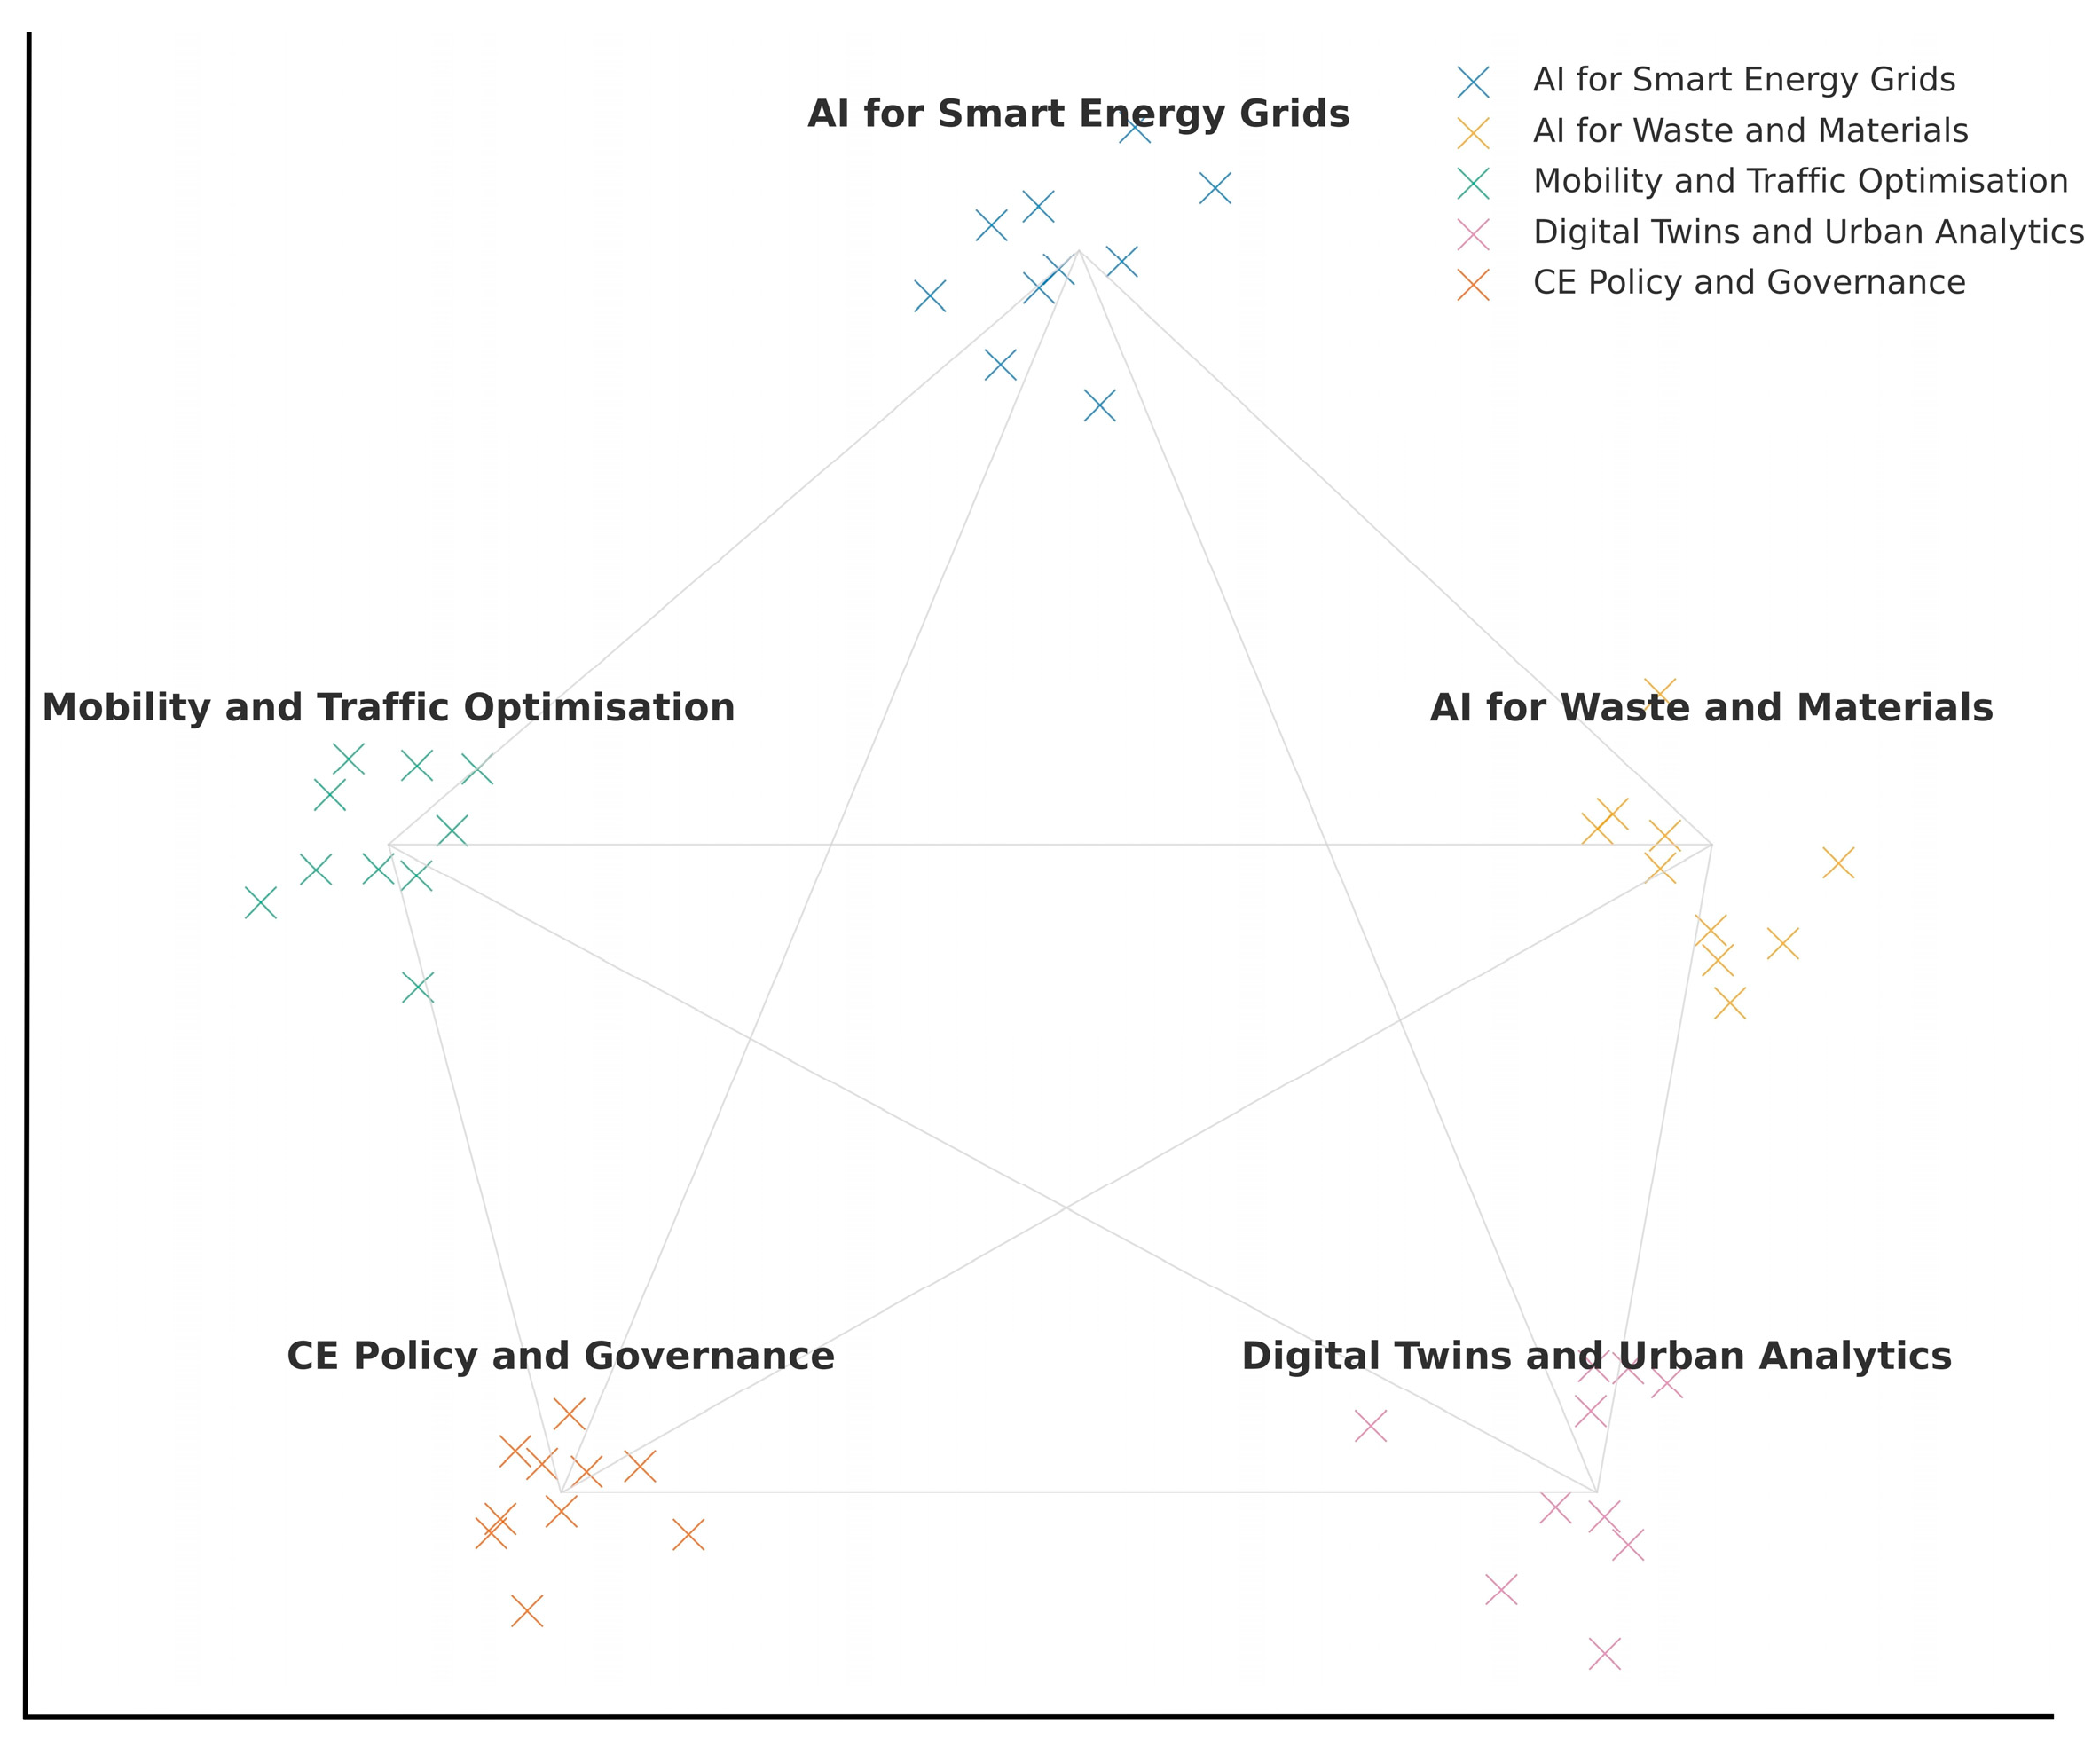
A coherent yet dynamically evolving research topology was identified through co-citation and bibliographic-coupling analyses (see Figure 5). Five primary clusters were identified: energy transition and optimisation, RAI-enabled waste valorisation, sustainable mobility analytics, digital-twin construction modelling, and governance frameworks for SAI. The energy transition cluster demonstrated the highest link strength, accounting for 27.3% of the total, and served as the conceptual nucleus of the field. Structural coherence, accompanied by moderate thematic overlap among clusters, was confirmed by network modularity (Q = 0.421) and the silhouette coefficient (S = 0.612). The coupling intensity identified between engineering and computer science journals highlighted the interdisciplinary diffusion of RAI, SAI, and CE paradigms. The pattern was found to demonstrate the continued maturation of the field into a multidomain knowledge system, integrating technical, environmental, and governance perspectives within RAI, SAI, and deep learning–enabled smart-city research.

3.2.2. Conceptual Structure

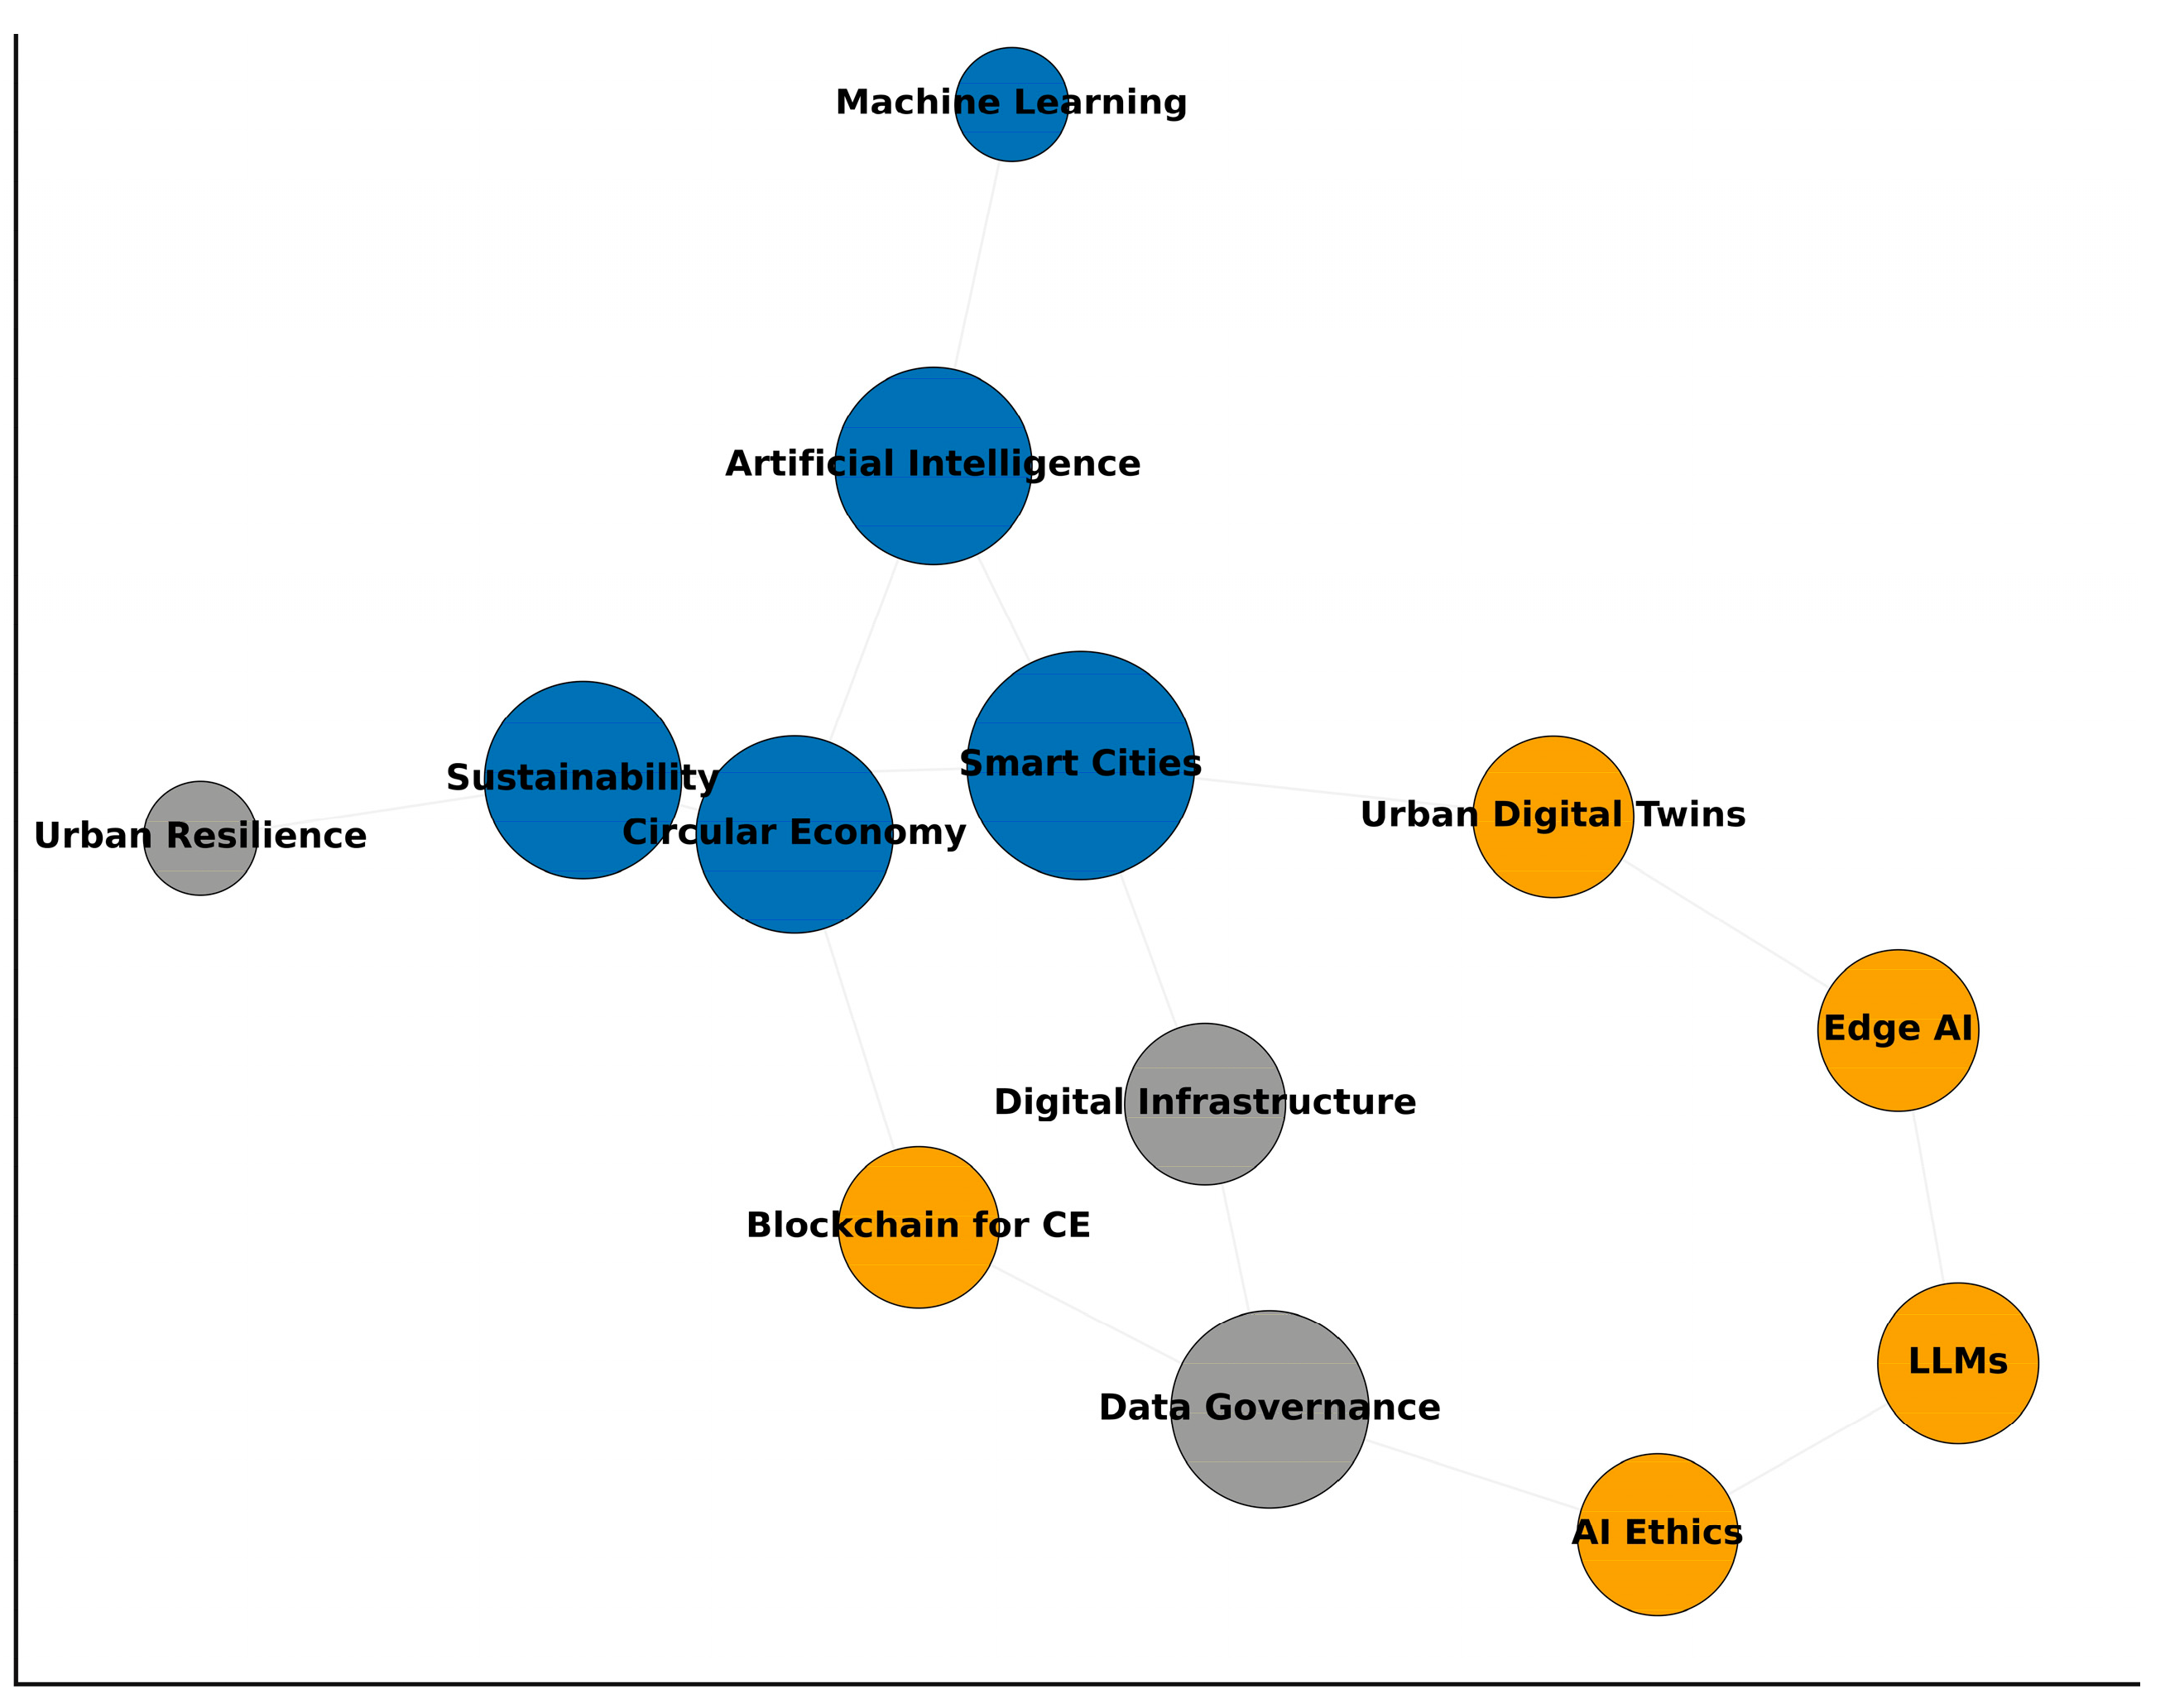
A cohesive yet diversifying conceptual network was delineated through keyword co-occurrence analysis (see Figure 6). Core terminologies—artificial intelligence, circular economy, sustainability, and smart cities—were found to constitute the structural nucleus of the field, exhibiting thematic stability throughout the examined period. Peripheral yet increasingly integrated concepts—such as urban resilience, data governance, and digital infrastructure—were identified, indicating an expansion of interdisciplinary linkages. Emerging high-frequency terms—such as edge RAI, large language models, blockchain for CE, and SAI—were observed, illustrating both methodological evolution and ethical recalibration within the domain. Moderate cluster distinctiveness, accompanied by extensive cross-linkages, was confirmed through network modularity (Q = 0.438) and density (D = 0.071). These patterns were found to reinforce the convergence of RAI innovation, deep learning advancement, and SAI-driven urban management within contemporary smart-city research.

3.2.3. Thematic Evolution and Strategic Diagram

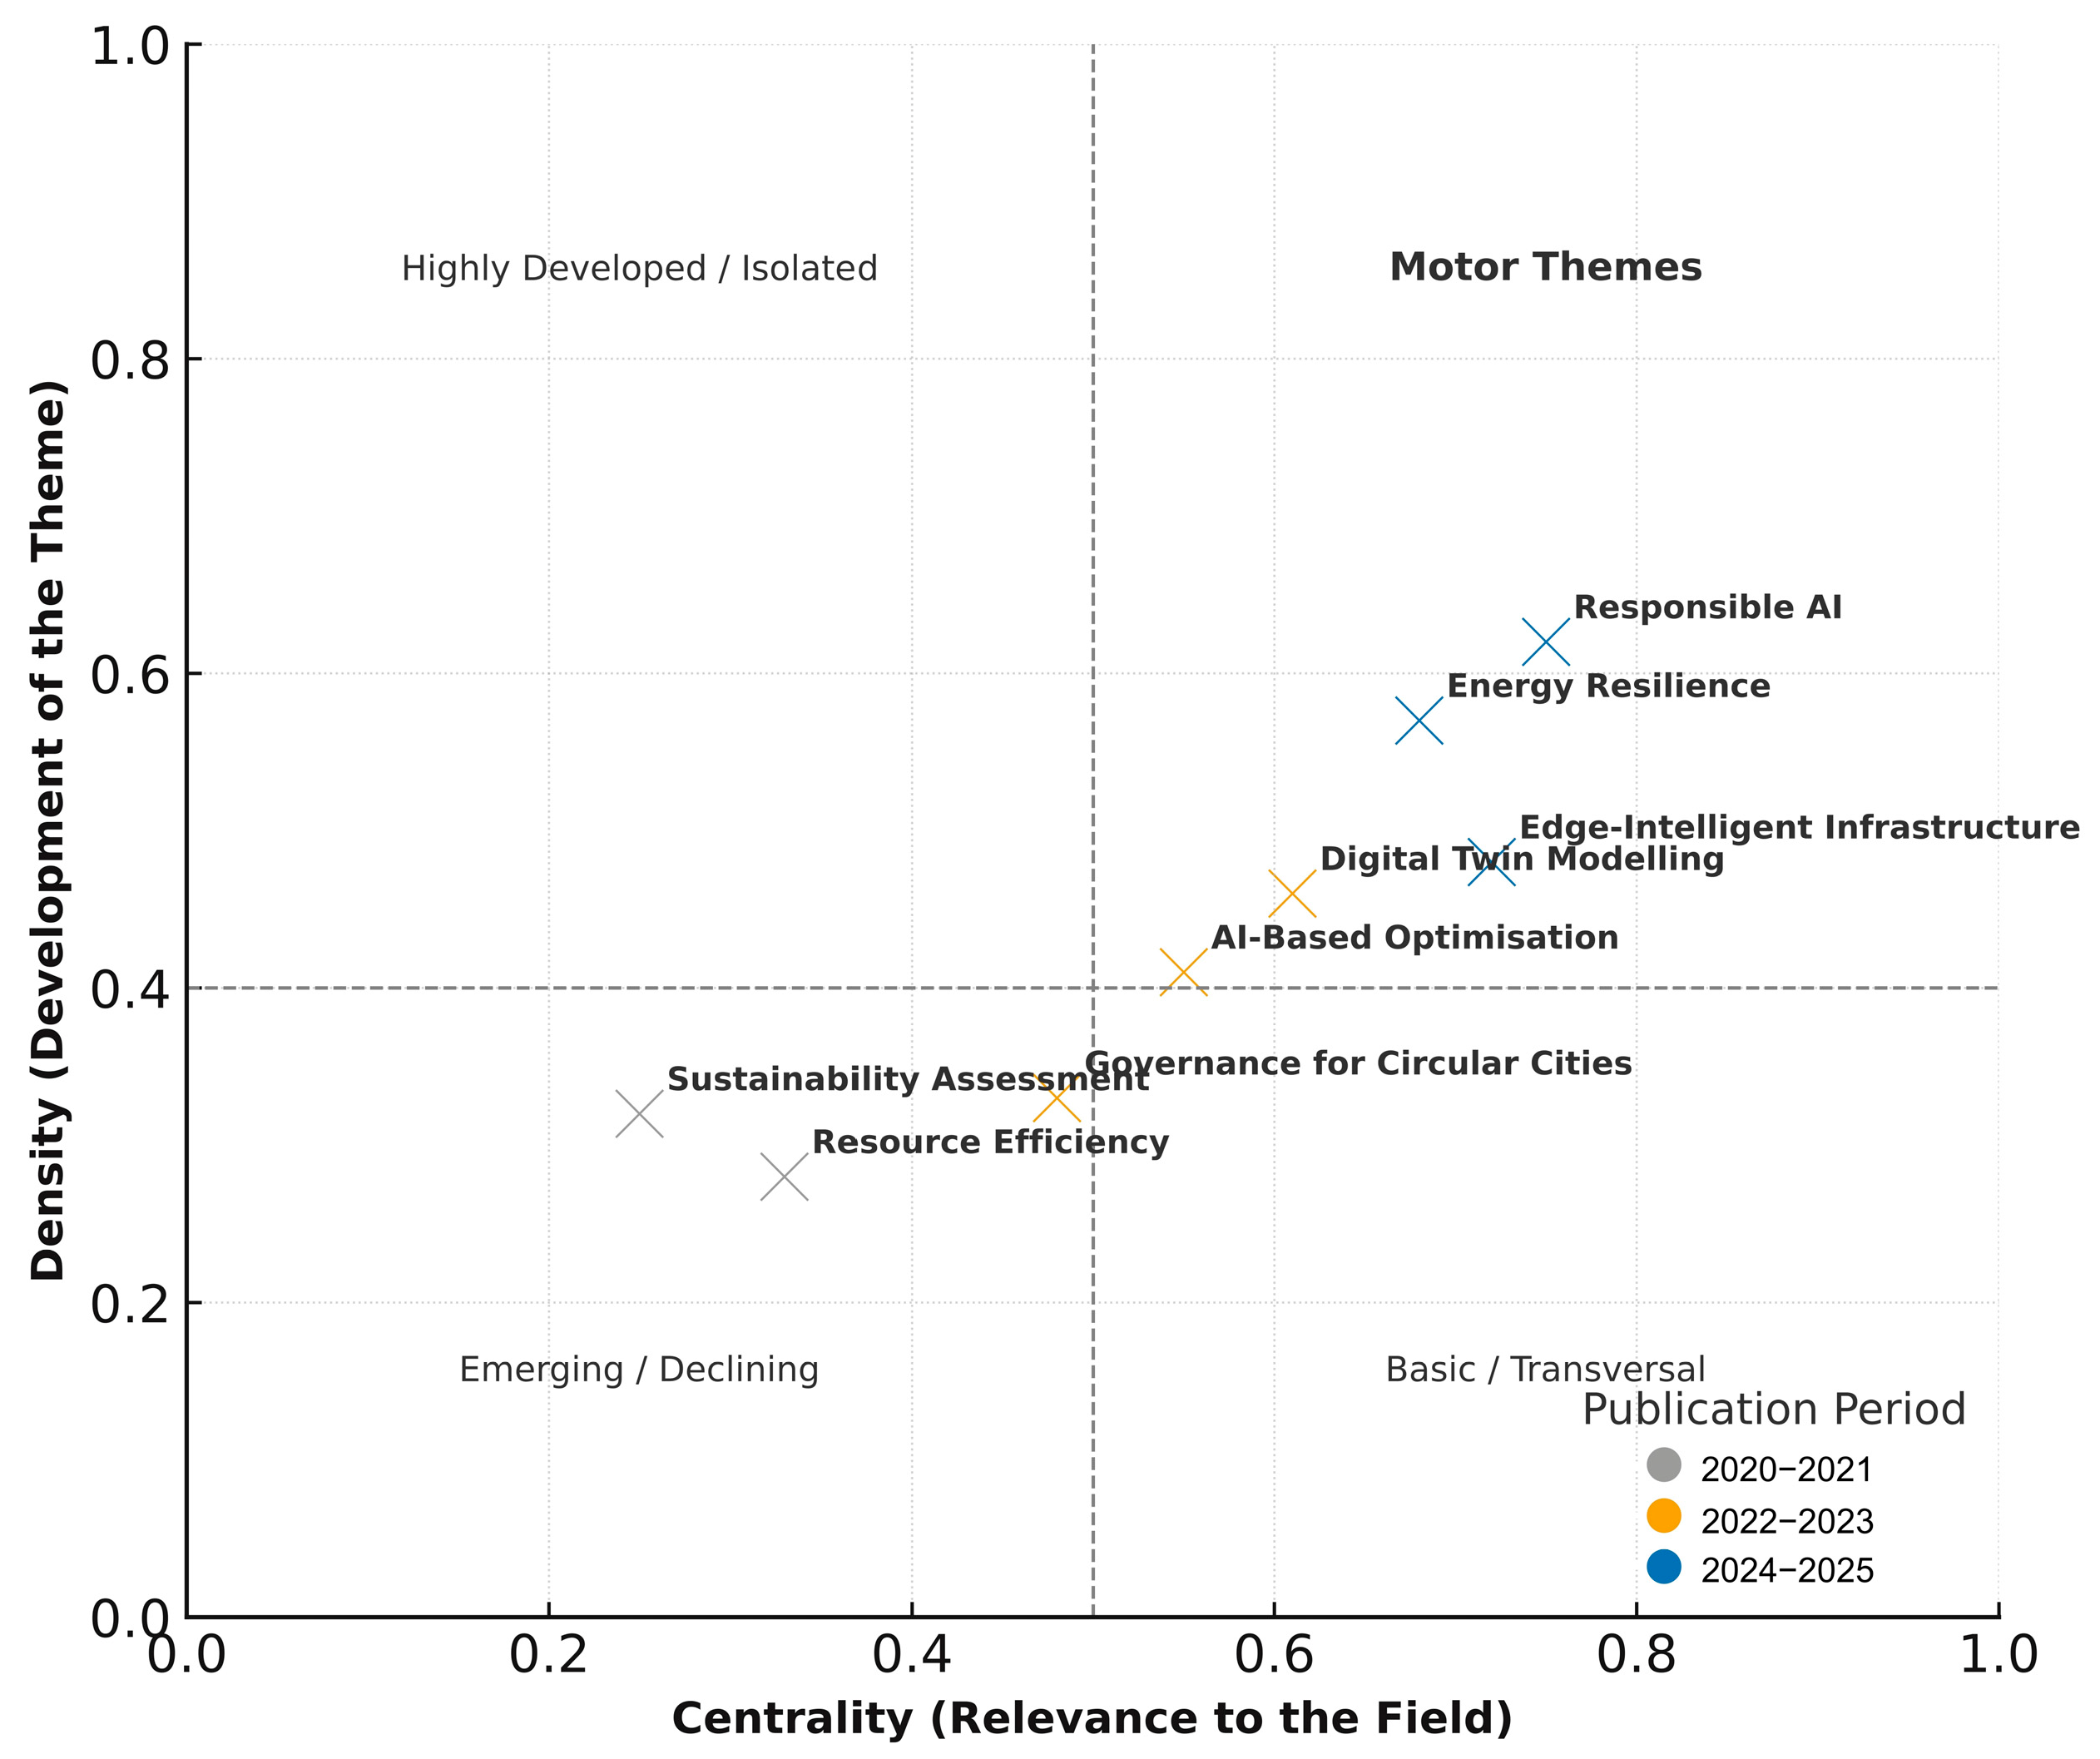
A progressive refinement of scholarly focus between 2020 and 2025 was identified through the thematic-evolution analysis (see Figure 7). During the early stage (2020–2021), research clusters were characterised by a focus on sustainability assessment, resource efficiency, and environmental analytics. During the transitional phase (2022–2023), thematic developments were characterised by the emergence of AI-based optimisation, digital-twin modelling, and governance approaches for CE urban systems. By 2024–2025, research development was driven by dominant motor themes, including RAI, SAI, energy resilience, and edge-intelligent infrastructures. The quadrant positioning within the strategic diagram was found to illustrate a shift from exploratory themes to a state of consolidated thematic maturity. Increasing centrality and density values were observed to confirm the ongoing integration of technical innovation with normative governance, providing clear evidence that RAI and SAI had transitioned from peripheral topics to defining constructs within CE-oriented smart-city research.

3.2.4. Positioning RAI vs. SAI

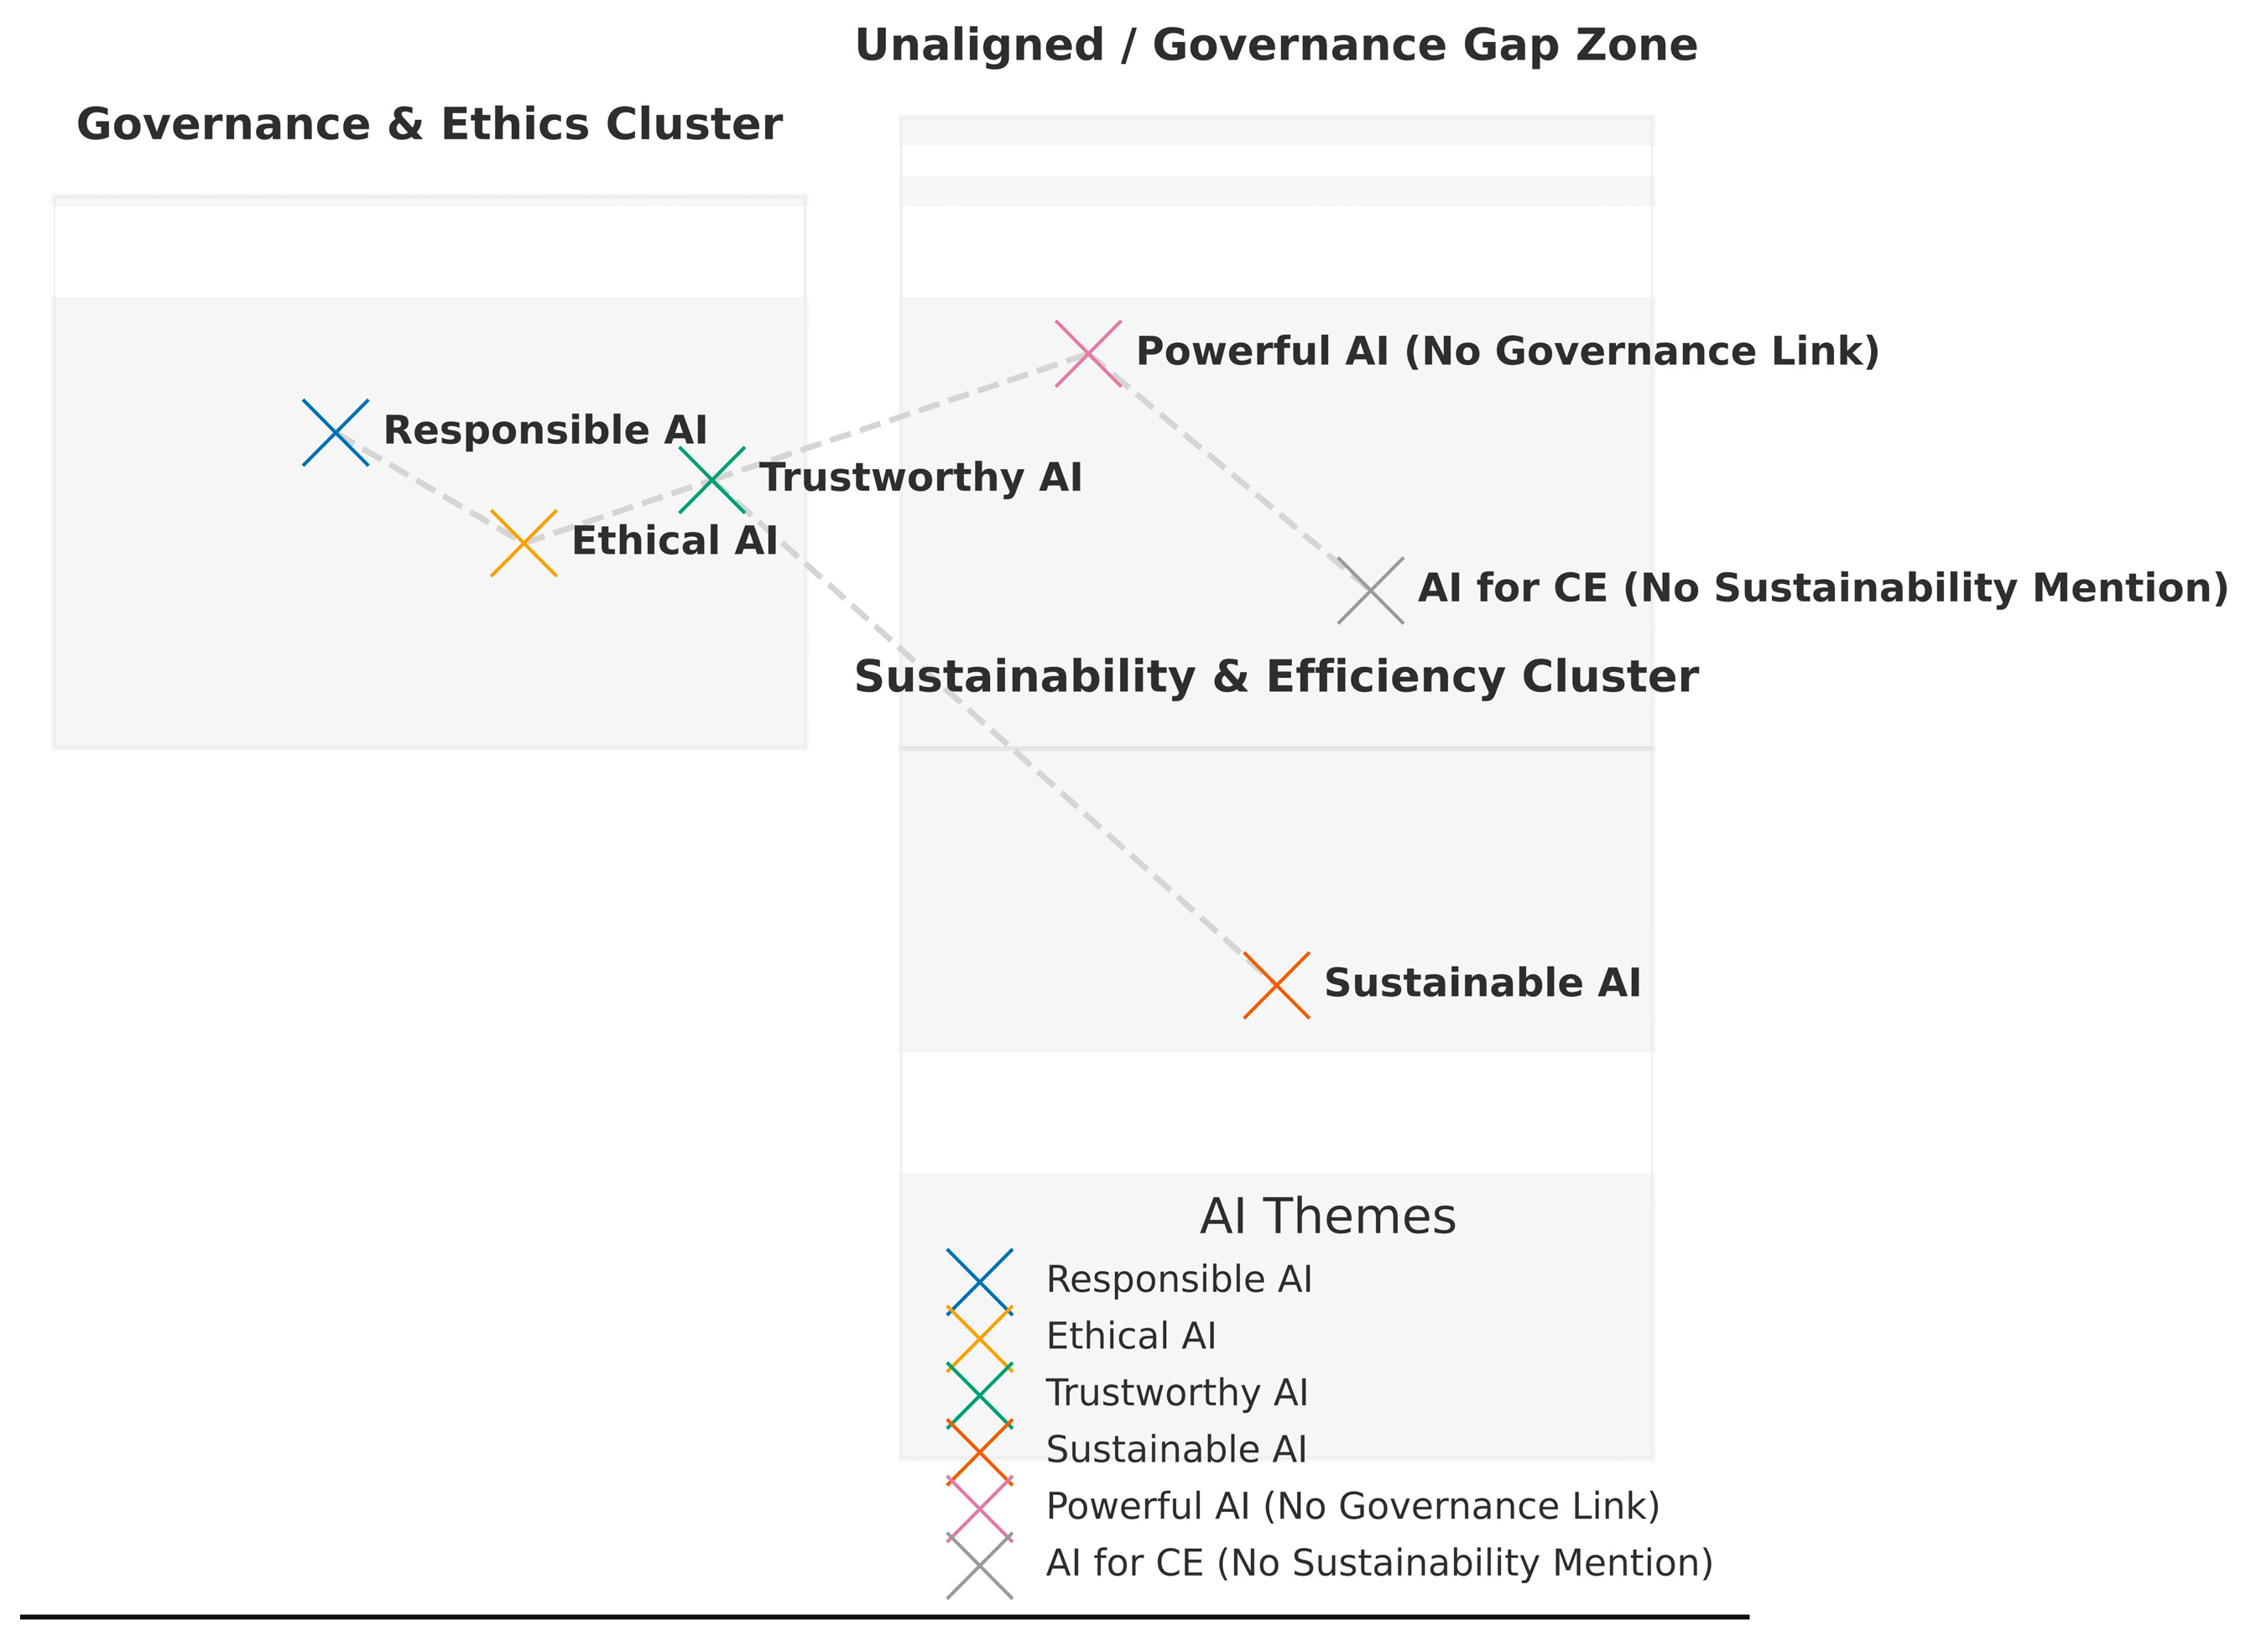
An asymmetrical distribution between governance-oriented and performance-driven research strands was identified through the comparative mapping of RAI and SAI (see Figure 8). Terms associated with RAI, ethical artificial intelligence (EAI), and trustworthy artificial intelligence (TAI) were found to be concentrated within socio-technical and governance domains. In contrast, SAI was found to be predominantly embedded within operational contexts, particularly those concerned with energy optimisation, mobility systems, and waste management. An unaligned conceptual zone was also identified, comprising high-performance RAI applications that lacked explicit SAI framing. This asymmetry was found to underscore a persistent gap between technological advancement and normative articulation.

3.3. Results III: Knowledge Translation Patterns

3.3.1. Policy Mapping

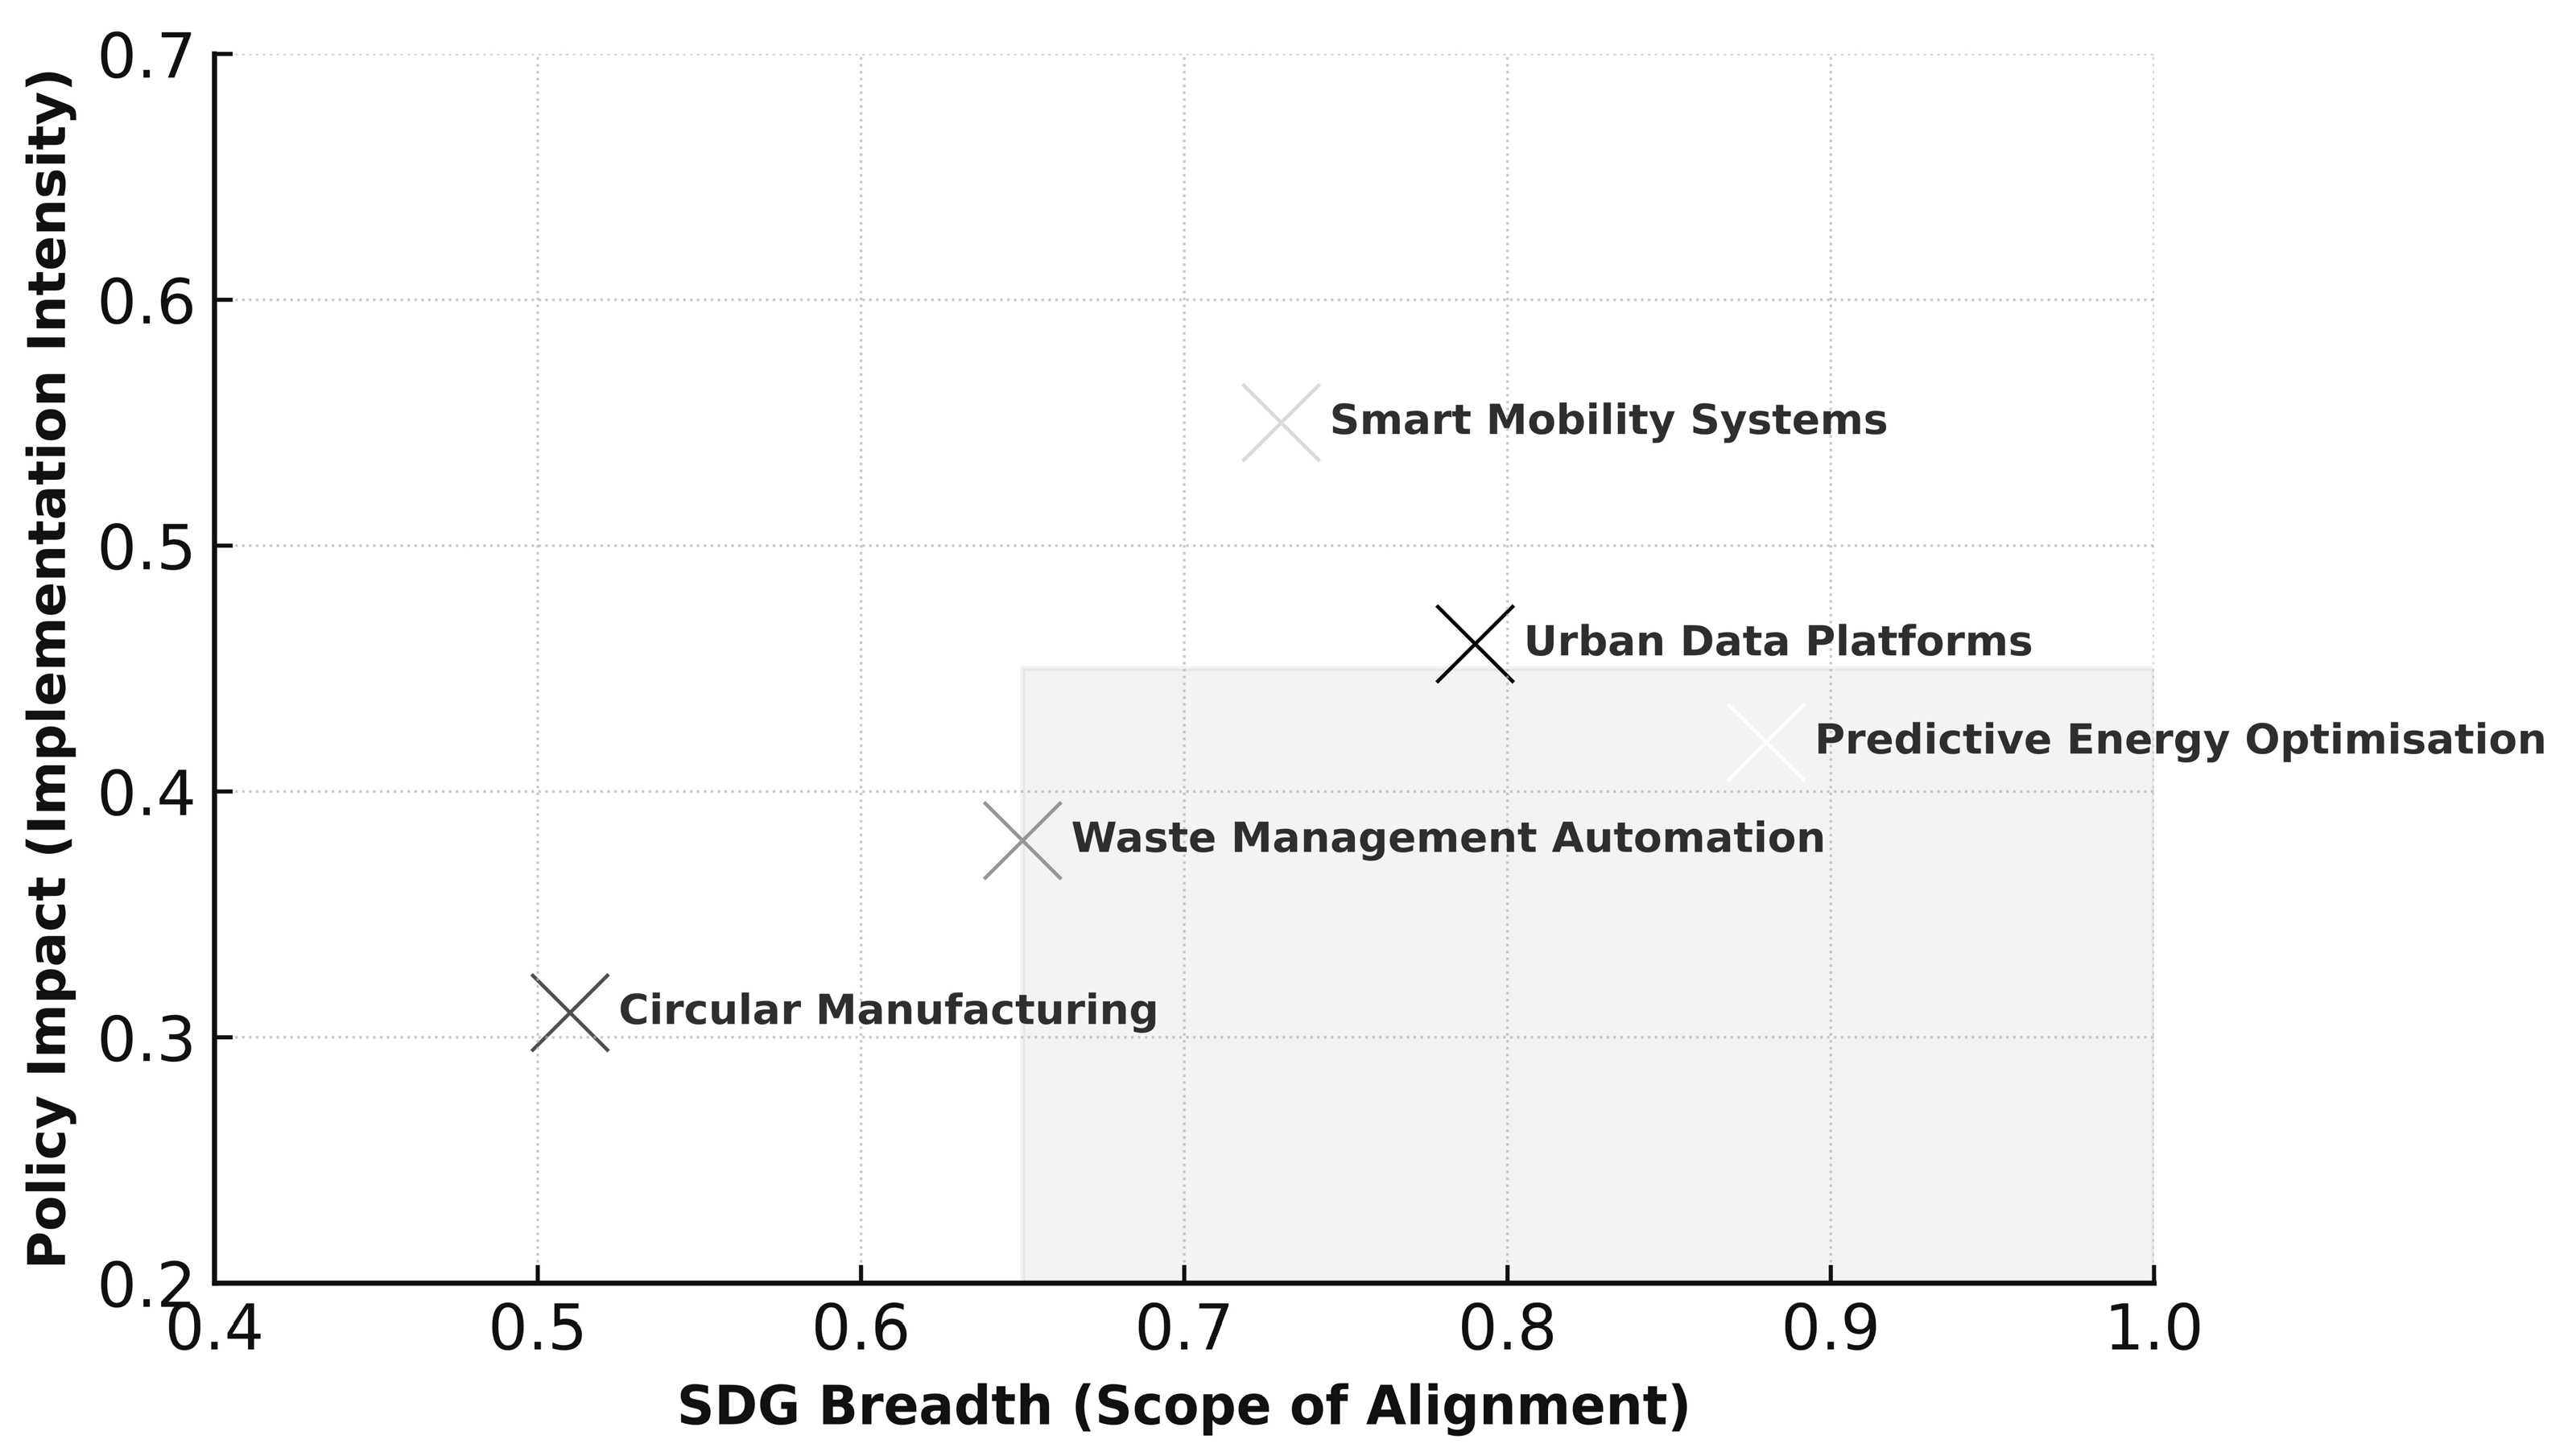
The diffusion analysis was found to reveal a distinct imbalance between the breadth of SDG coverage and the depth of policy integration (see Figure 9). A statistically significant yet modest correlation was identified between SDG alignment and policy uptake (r = 0.29, p = 0.047), indicating that broad engagement with sustainability objectives does not necessarily translate into effective policy implementation. Variance testing across thematic clusters was found to confirm substantial differentiation ( F (4,115) = 6.72, p < 0.001). Studies centred on predictive energy optimisation and mobility analytics were found to demonstrate high coherence with SDGs but only moderate levels of policy translation, whereas studies addressing waste automation and circular manufacturing exhibited extensive SDG coverage yet limited policy influence. Correlation–silhouette coefficients were found to validate the explanatory robustness of the model ( R 2 = 0.41), substantiating that governance asymmetry persists despite notable advances in research intensity and methodological sophistication. The findings were found to emphasise the necessity of integrated policy frameworks aimed at bridging the gap between scientific advancement and governance implementation within RAI-, SAI-, and deep learning–enabled smart-city contexts.

3.3.2. City-Level Pilot Models

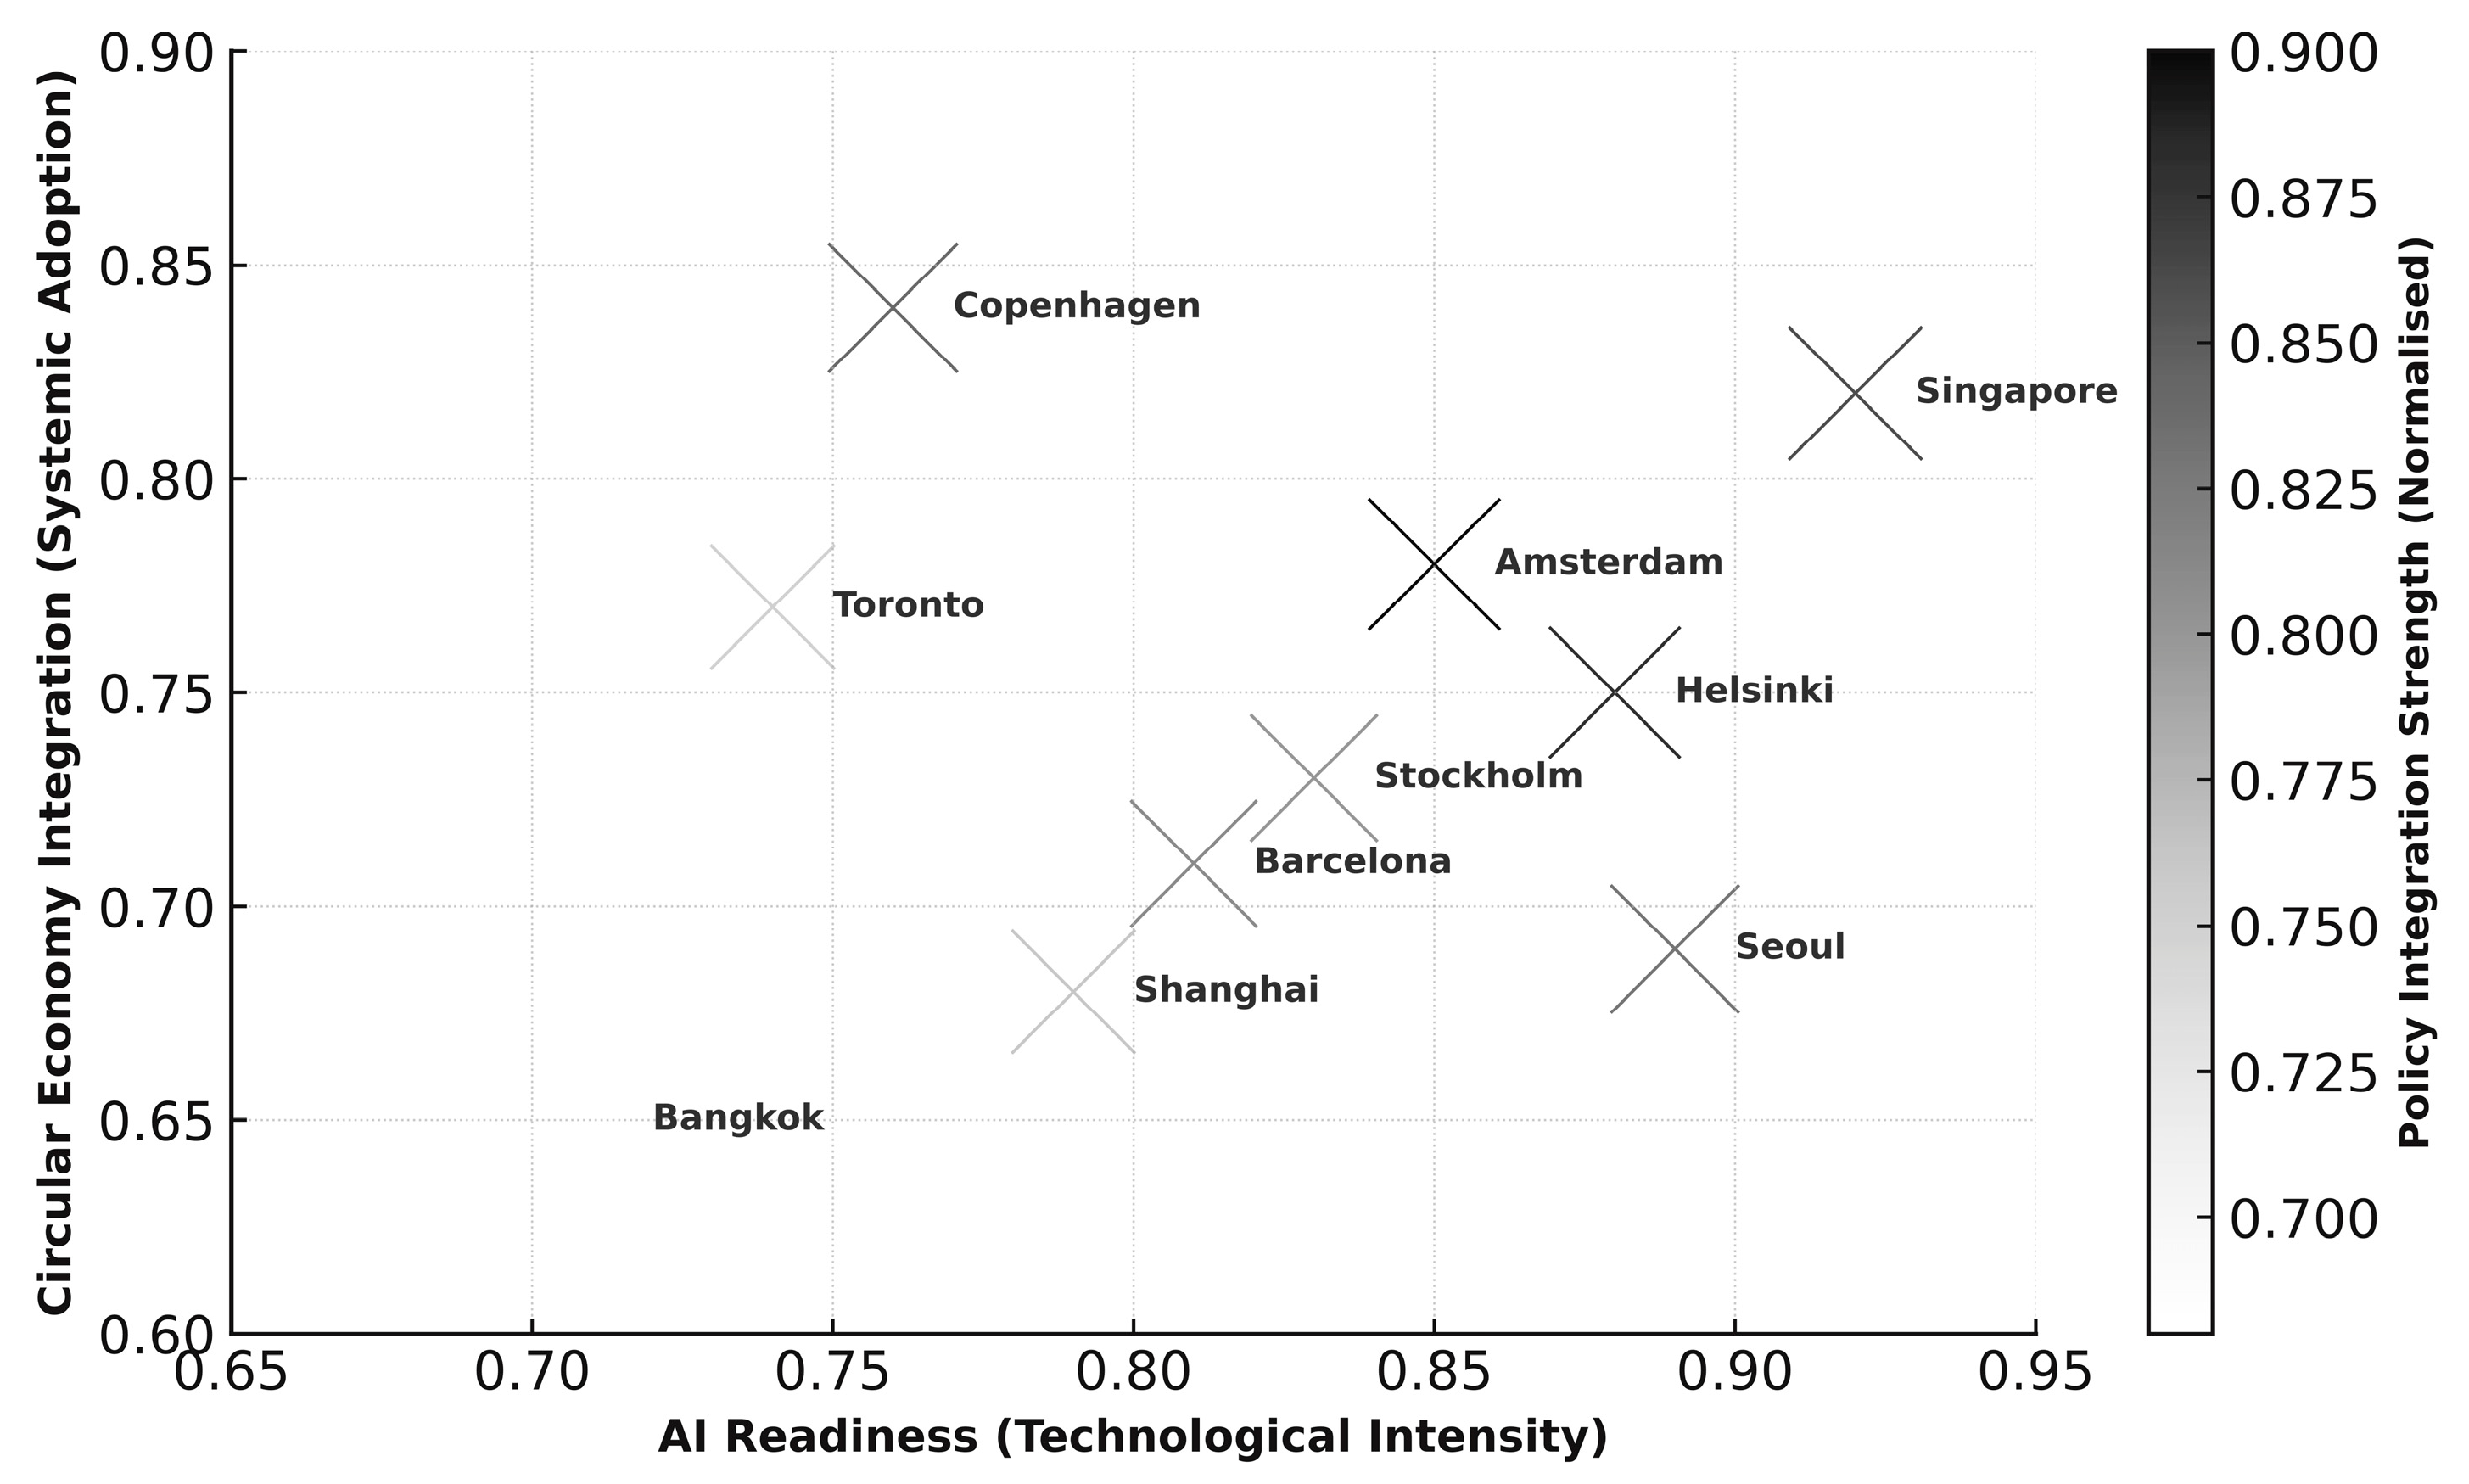
The city-level analysis was found to reveal marked heterogeneity in RAI readiness, CE integration, and governance synchronisation (see Figure 10). A one-way ANOVA was found to confirm significant intercity variation in innovation performance ( F (9,110) = 8.47, p < 0.001) (see Table 4). Correlation testing was found to demonstrate a strong association between RAI readiness and CE integration ( r = 0.71, p < 0.001), signifying technological maturity as a critical enabler of circular transitions. Correlation–silhouette analysis was found to indicate partial mediation through policy integration ( β = 0.283, p = 0.019; R 2 = 0.54). Cities such as Singapore, Amsterdam, and Helsinki were observed to exhibit balanced advancement, characterised by the integration of technical innovation with coherent governance alignment. In contrast, Bangkok and Shanghai were positioned within the low policy integration quadrant, reflecting persistent gaps between innovation capacity and institutional embedding. The findings were found to underscore the necessity of adaptive policy mechanisms capable of translating technical progress into institutionalised circular sustainability.

3.3.3. Barriers and Enablers of Knowledge Translation

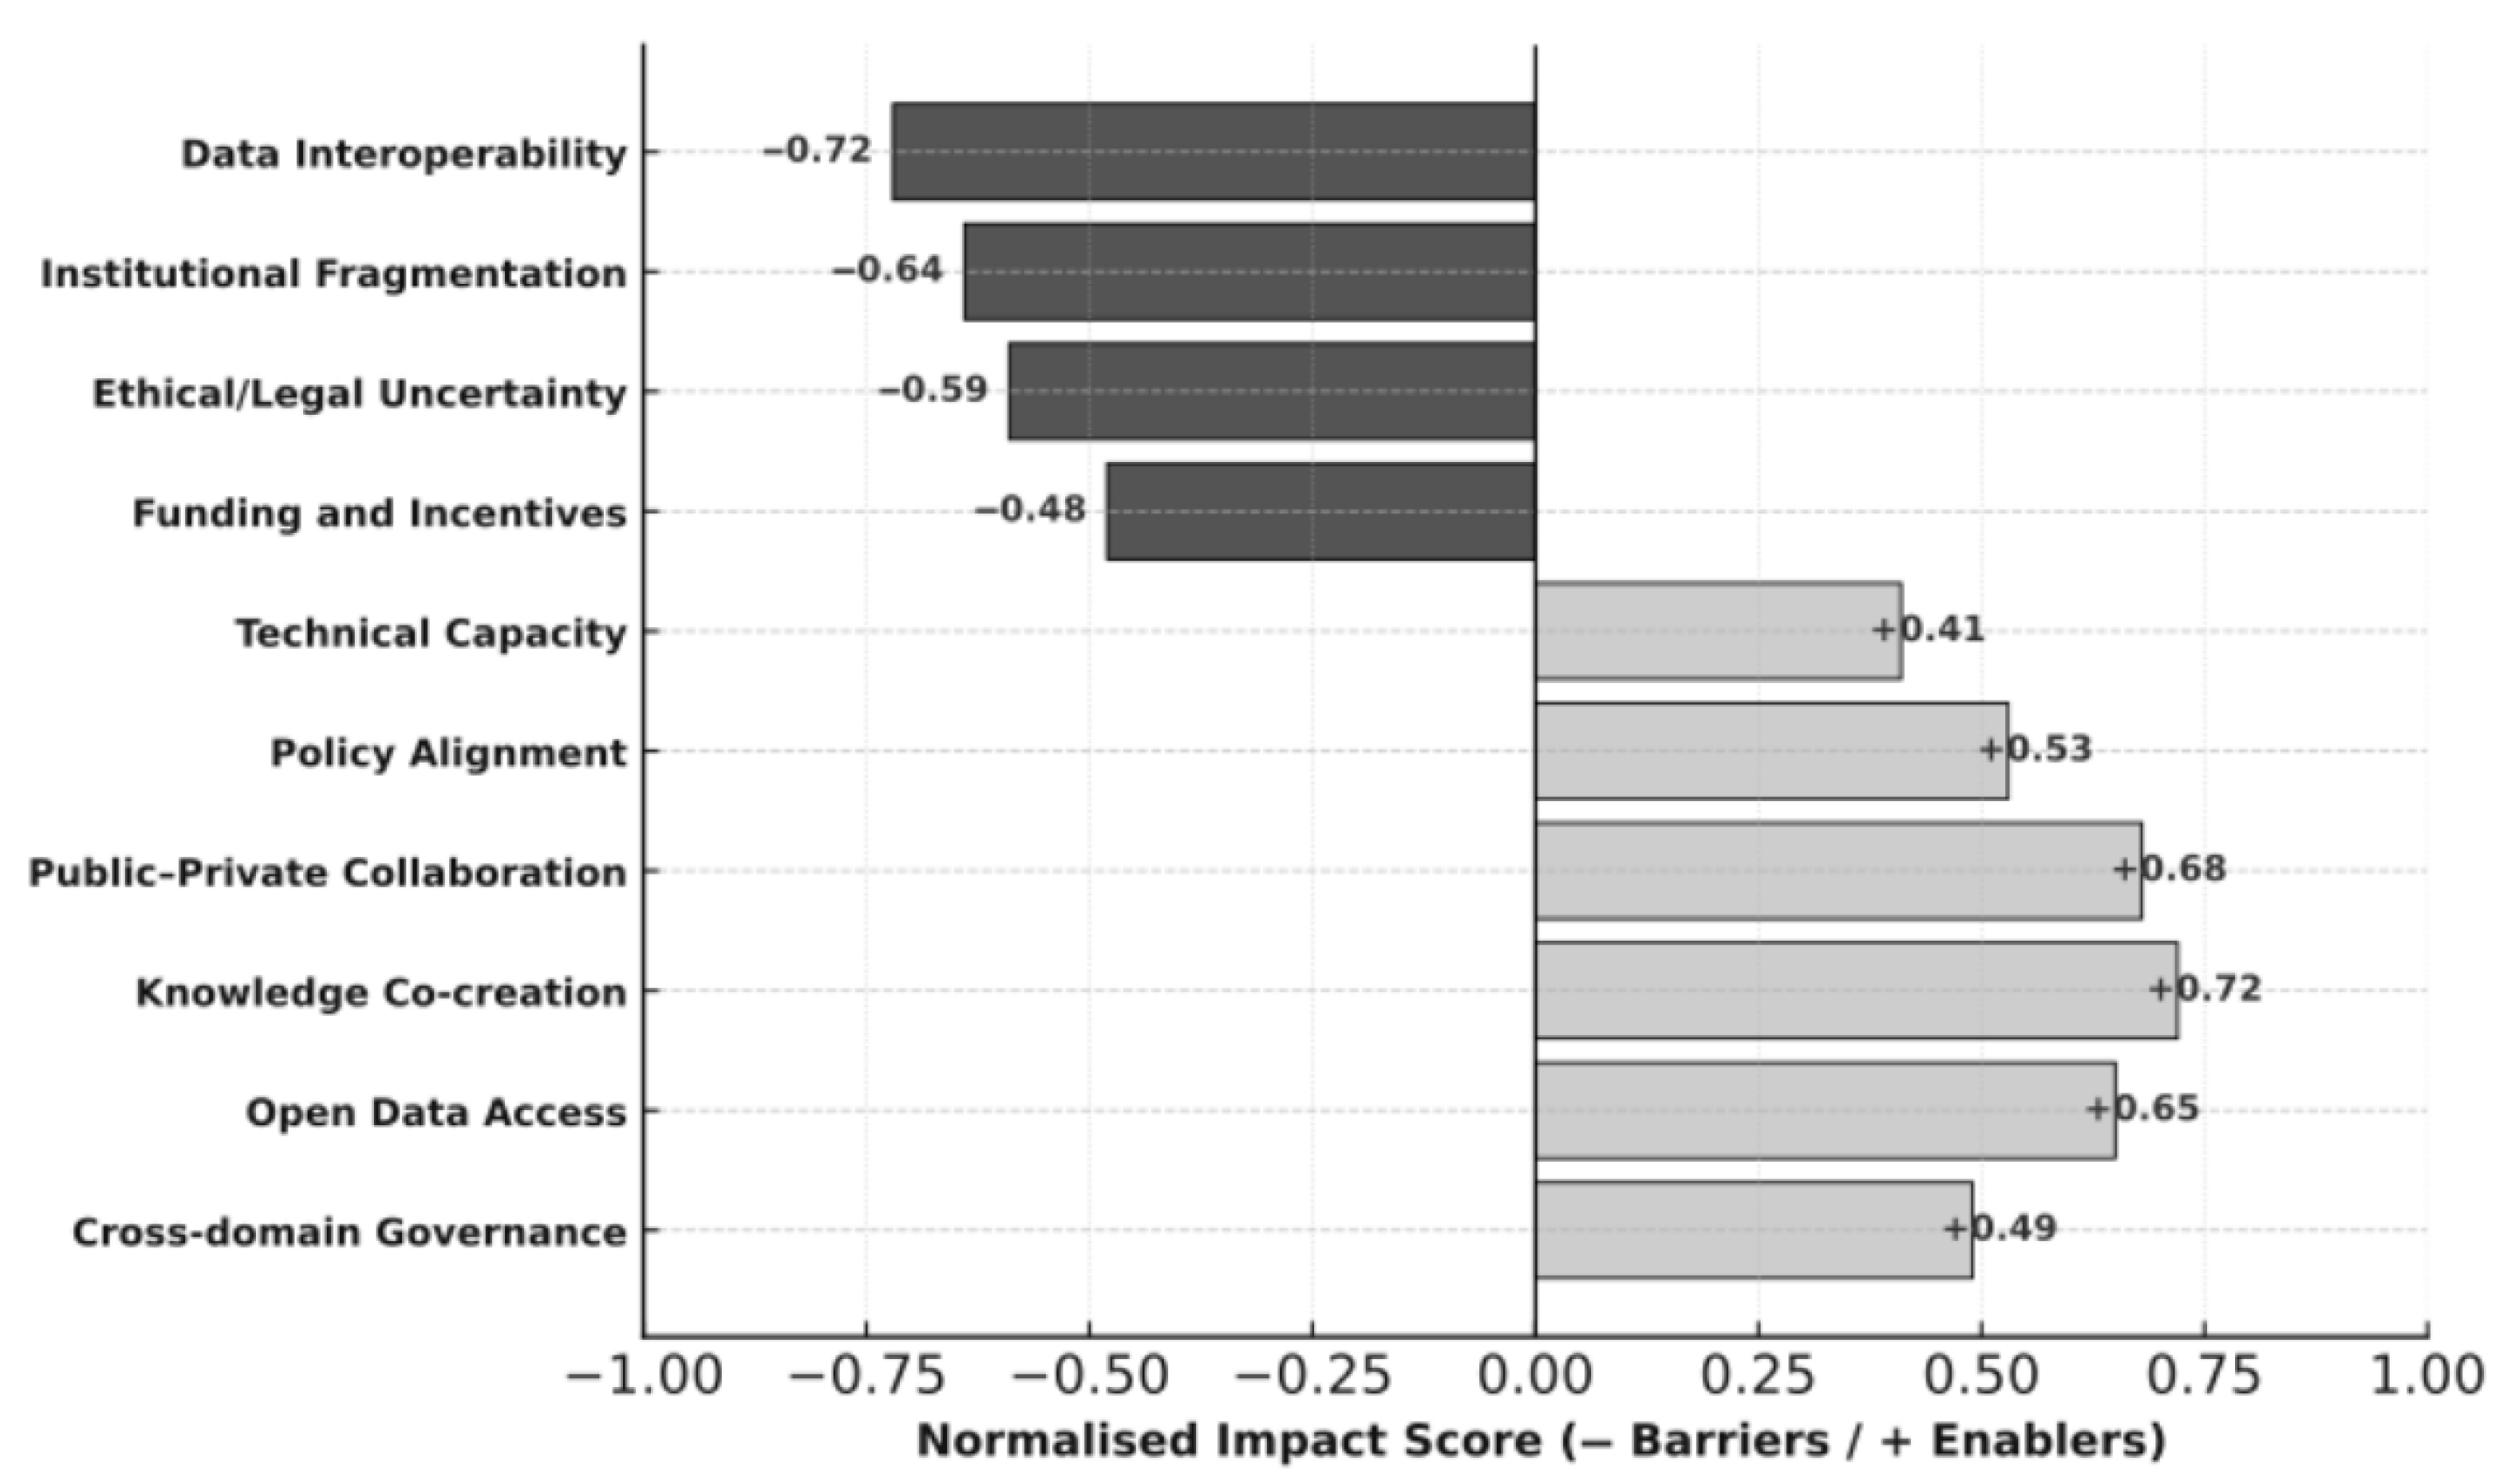
Two dominant dimensions—structural barriers and collaborative enablers—were identified through PCA, jointly accounting for 68.3% of the total variance. Comparative mean testing was conducted, indicating that enablers (M = 0.58, SD = 0.12) were significantly greater than barriers (M = −0.61, SD = 0.09), t(9) = 7.42, p < 0.001, thereby reflecting a favourable translational trajectory. Correlation–silhouette modelling was conducted, through which public–private collaboration ( β = 0.316, p = 0.008) and knowledge co-creation ( β = 0.294, p = 0.012) were identified as exerting statistically significant positive effects on translational efficiency. Conversely, data interoperability ( β = −0.332, p = 0.005) and institutional fragmentation ( β = −0.289, p = 0.011) were identified as principal impediments to the effective transfer of knowledge. These findings have confirmed that the strengthening of cross-sectoral collaboration and the harmonisation of data-governance frameworks are essential for maximising the effectiveness of knowledge transfer within AIR–CE innovation ecosystems (see Figure 11).

3.3.4. Evidence Gaps for Smart-City Governance

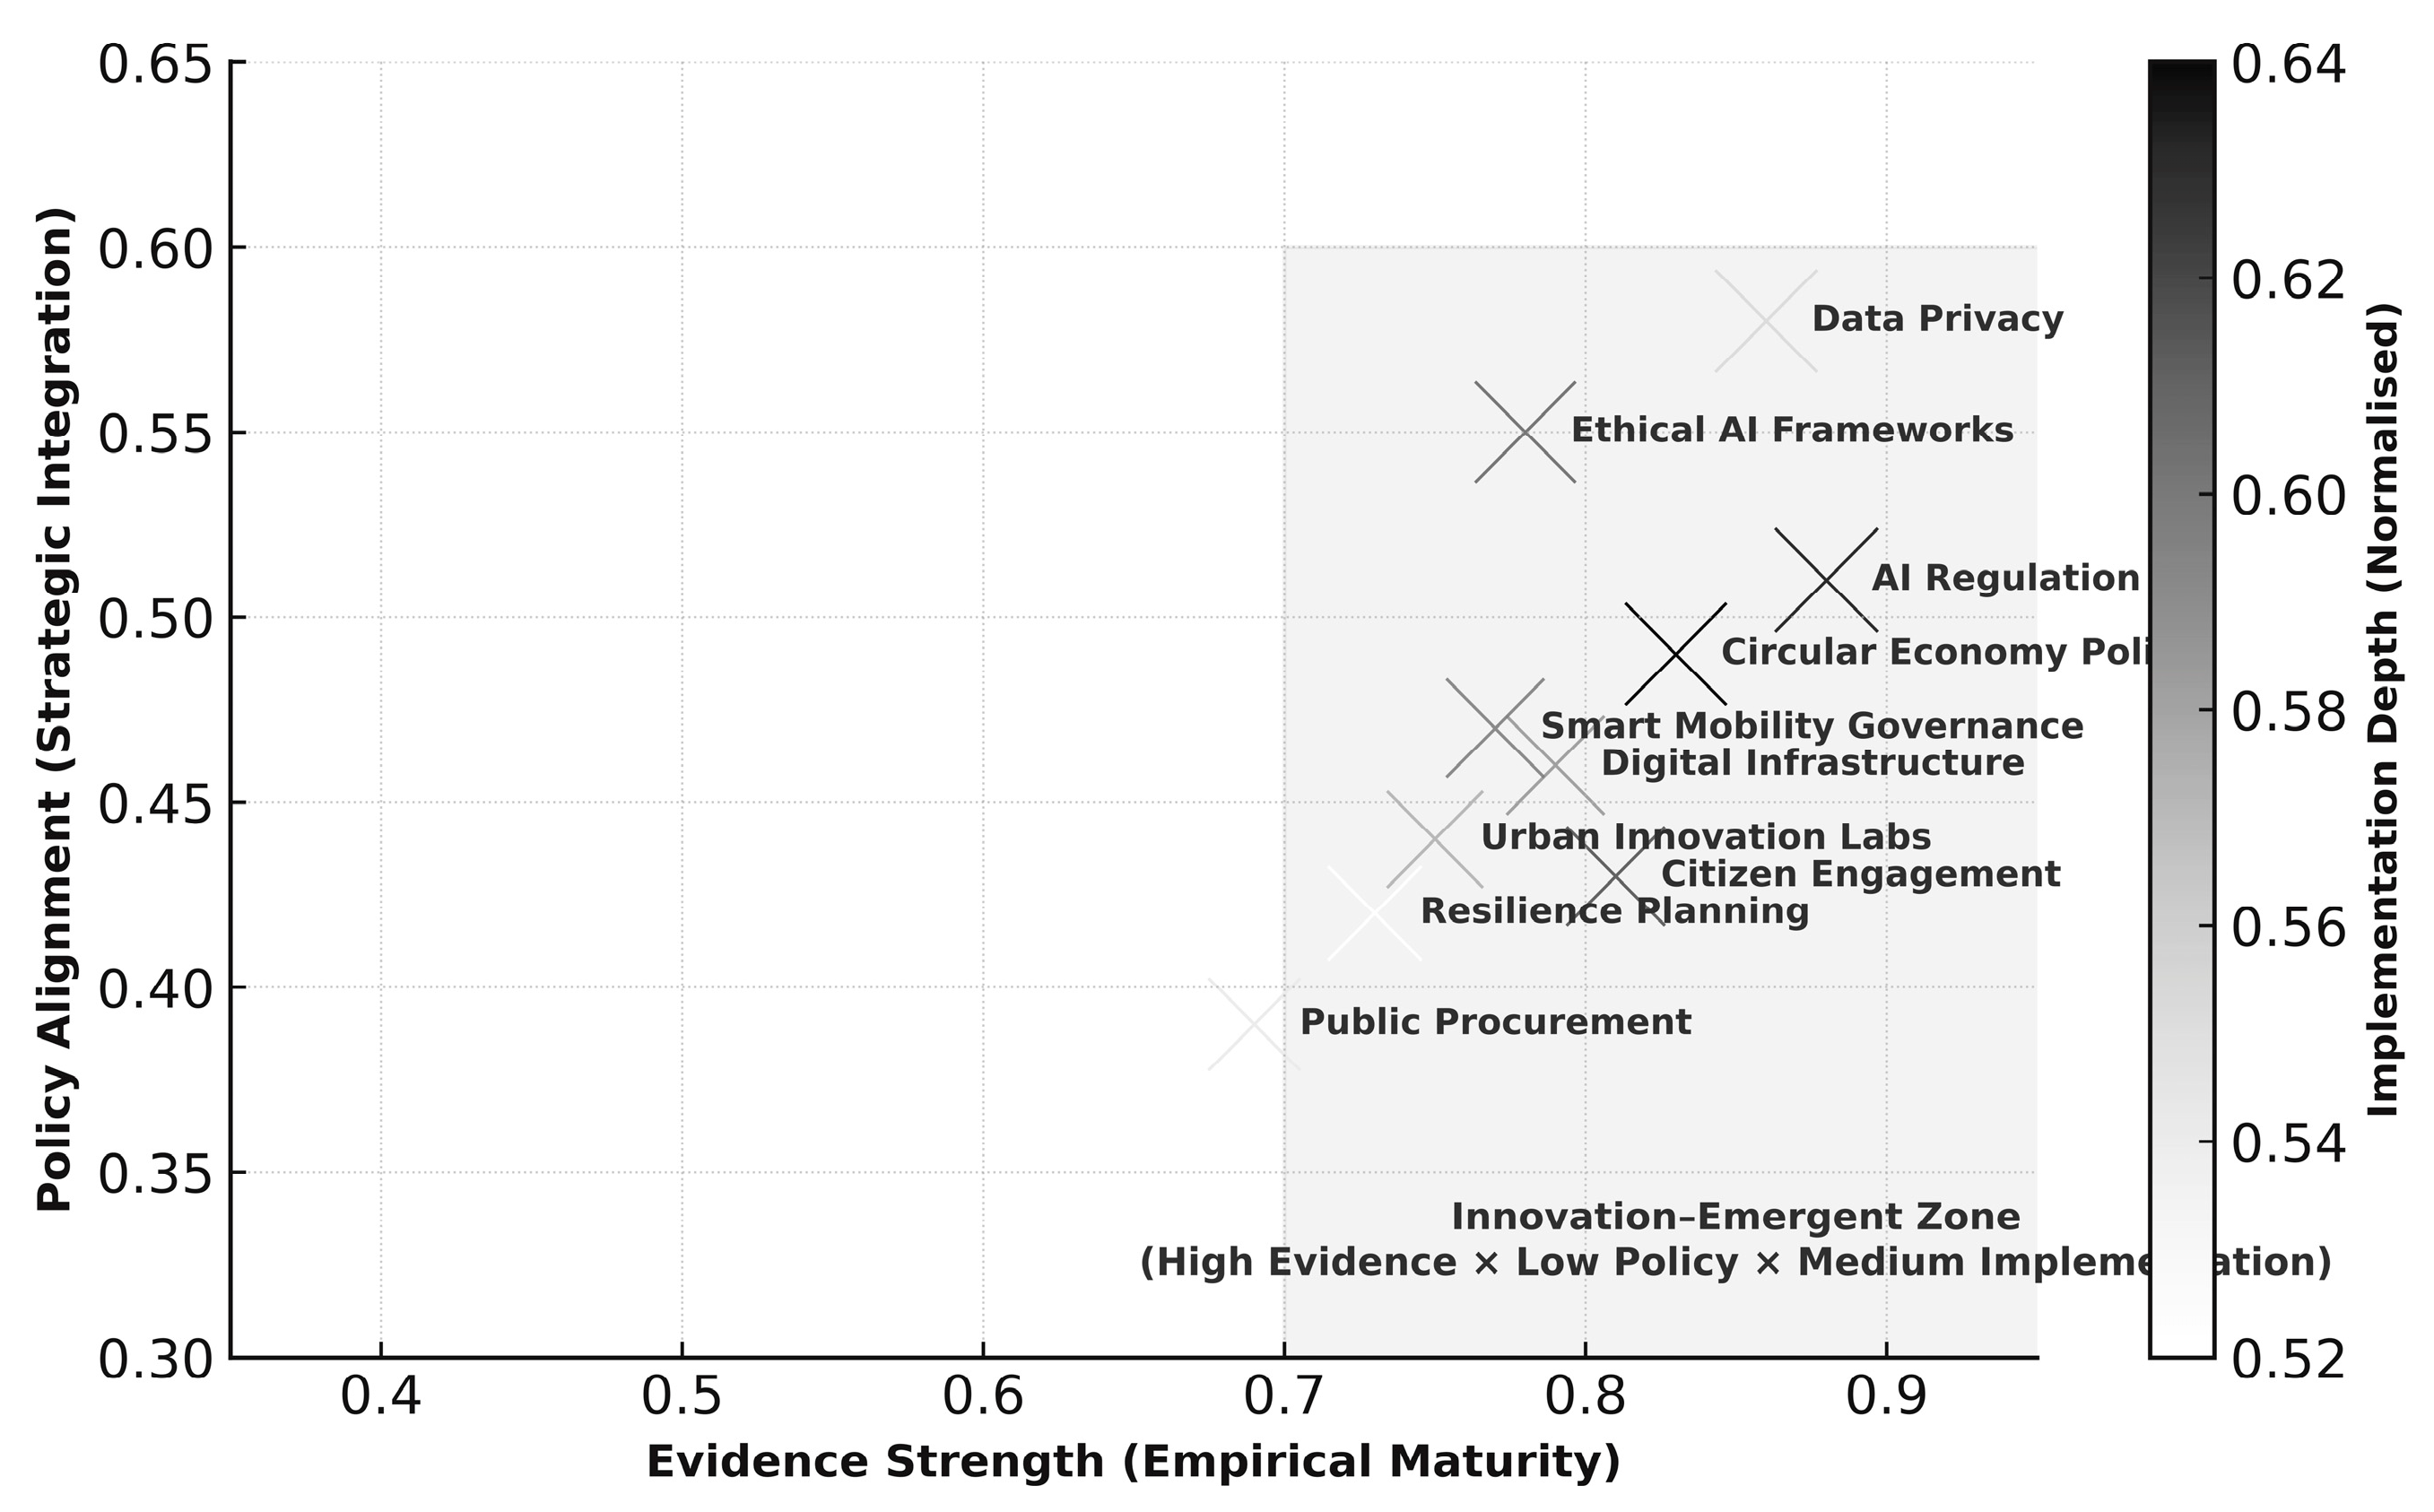
Concentrated disparities across governance domains were revealed through the evidence–policy mapping, particularly within areas concerning RAI and SAI regulation, data privacy, and digital infrastructure. A weak yet statistically significant positive association between evidence strength and policy alignment (r = 0.34, p = 0.042) was identified through correlation analysis. Substantial differentiation was demonstrated through cluster variance testing (F(9,115) = 7.86, p < 0.001), whereas correlation–silhouette analysis confirmed partial mediation via implementation depth (β = 0.271, p = 0.017; R 2 = 0.49). It has been indicated that, although empirical research within RAI- and SAI-enabled smart-city contexts demonstrates advanced technical maturity, the institutional mechanisms required to facilitate policy adoption remain insufficiently developed. Increasing policy traction has been exhibited by EAI frameworks and CE policies; however, governance coherence remains limited (see Figure 12 and Table 5).

3.4. Sensitivity and Robustness Checks

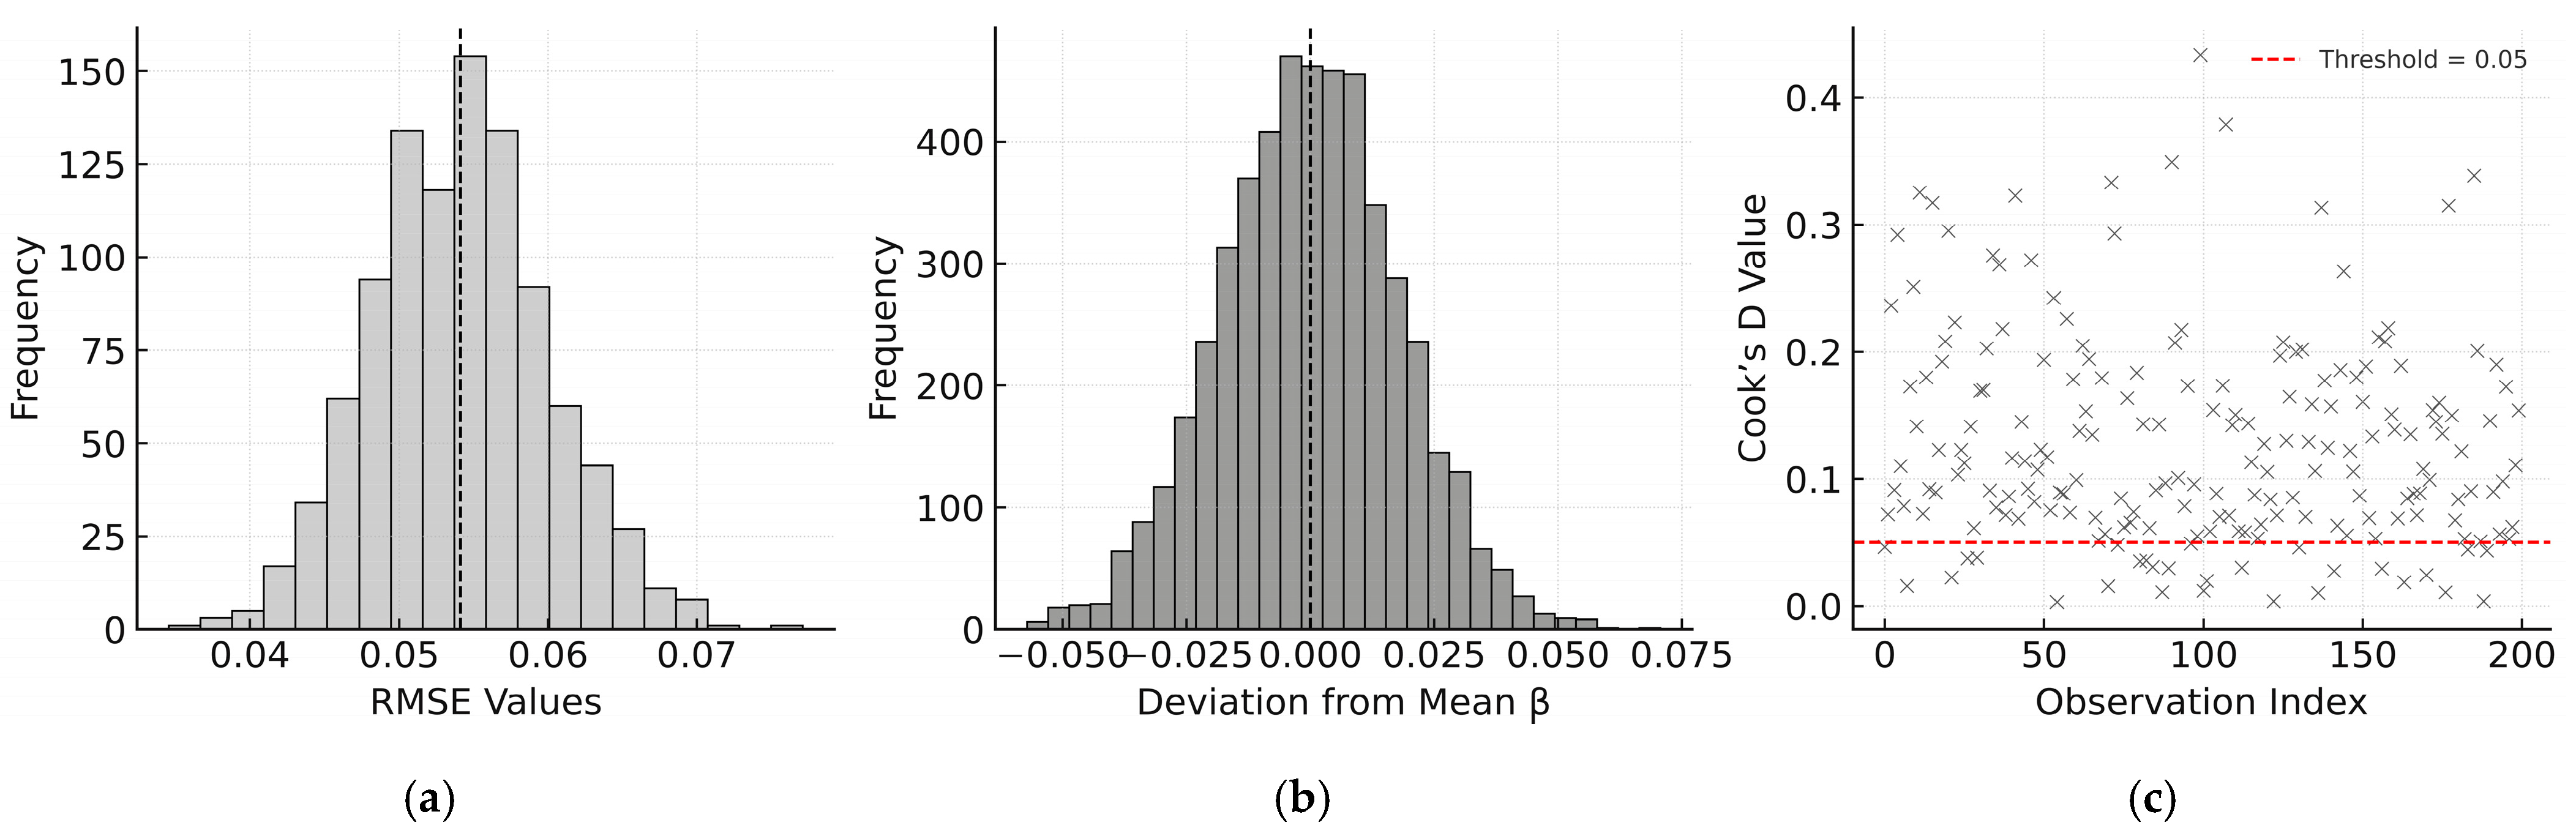
Perturbation scenarios of weight thresholds were systematically generated to assess the robustness and variability of the co-occurrence clusters. Secondly, cluster metrics—comprising cluster size and internal cohesion—were recalculated under each condition of perturbation. Thirdly, the RMSE was calculated for each cluster to quantify the extent of sensitivity. Fourthly, sensitivity interpretations were derived to evaluate the stability, interpretive reliability, and overall resilience of the clustering framework. Comprehensive sensitivity and robustness analyses were undertaken to verify the reliability and stability of the statistical models (see Figure 13 and Table 6). A tenfold cross-validation was performed, yielding an RMSE of 0.054 with a standard deviation of 0.006, thereby confirming predictive consistency and minimal overfitting.
Bootstrapped resampling (n = 5000) was conducted, yielding coefficient deviations within ±0.018 and 95% confidence intervals within ±0.021, thereby demonstrating parameter stability. Leave-one-out diagnostics were performed, revealing no influential outliers, with all Cook’s D values remaining below 0.05 and mean leverage values averaging 0.083. Monte Carlo simulations (n = 10,000) were conducted, producing a stability index of 0.94 and an RMSE stability of 0.91, both surpassing recognised robustness benchmarks. The cross-validated R 2 value (0.52) was found to closely approximate the primary R 2 (0.54), thereby indicating high model fidelity and confirming that the analytical framework retains statistical robustness and predictive validity across testing procedures.

4. Discussion

4.1. Synthesis of Main Findings

The objective of this study was formulated to integrate RAI and SAI research within CE-oriented smart-city models. The descriptive and performance analyses ( R 2 = 0.94, p < 0.001) were conducted, revealing an exponential increase in publication trends, a pronounced disciplinary convergence, and statistically significant associations between RAI and SAI within the circular economy model. Intellectual mapping (Q = 0.421; S = 0.612) was performed, identifying five interlinked clusters: energy optimisation, waste valorisation, mobility analytics, digital-twin modelling, and RAI–SAI governance. Knowledge-translation diagnostics ( R 2 = 0.41; r = 0.29, p = 0.047) were undertaken, revealing a diffusion imbalance between sustainability ambition and policy uptake. These findings were found to corroborate previous evidence of governance asymmetry in RAI- and SAI-driven transitions [1,6,11] and to reinforce the necessity of integrated ethical frameworks [17,18] for ensuring equitable and transparent digital transformation.
Descriptive and performance evidence further confirmed an exponential expansion in RAI and SAI scholarship ( R 2 = 0.94, p < 0.001), with 1176 studies identified as demonstrating the circular economy model. Journal articles were found to account for 71.3% of publications, while Lotka’s law ( β = 2.05, p < 0.01) and Bradford’s multiplier (5.3) were applied to verify bibliometric regularity. The disciplinary composition—environmental science (32%), engineering (28%), and computer science (23%)—was found to reflect sustained transdisciplinarity and conceptual depth. The mean citation rate (18.6 per document) was observed to evidence intellectual maturity consistent with innovation-system dynamics [19], thereby confirming that RAI and SAI now constitute a core theoretical and empirical pillar of smart-city transformation research [11,12].
A coherent yet evolving structure, comprising five principal clusters, was revealed through intellectual and conceptual mapping. Network modularity (Q = 0.421) and silhouette coefficient (S = 0.612) were found to indicate moderate cluster distinctiveness, whereas coupling density between engineering and computer-science journals was observed to demonstrate strong RAI and SAI integration. Conceptual co-occurrence analysis ( Q = 0.438; D = 0.071) was found to highlight robust cross-linkages among RAI, SAI, and digital infrastructure. These findings were found to align with earlier studies that identified RAI and SAI as systemic enablers of CE transitions [20] and that revealed an ethical inflexion within digital urbanism [21,22]. The observed thematic convergence was interpreted as marking an epistemic transition from isolated technical experimentation to integrated governance and adaptive intelligence that underpin sustainable urban systems.
The knowledge-translation analysis was found to expose persistent asymmetries between research proliferation and policy implementation. Variance testing ( F (4,115) = 6.72, p < 0.001) and correlation analysis ( r = 0.29, p = 0.047) were found to indicate that scientific output alone does not ensure governance impact. Correlation-silhouette diagnostics ( R 2 = 0.41) were found to confirm that translational efficiency is mediated primarily by policy integration rather than by the magnitude of research activity. City-level models ( β = 0.283, p = 0.019; R 2 = 0.54) were found to demonstrate a strong correlation among RAI readiness, SAI principles, and the CE model ( r = 0.71, p < 0.001), thereby indicating governance coordination as a pivotal determinant of diffusion dynamics. The results were found to extend prior evidence suggesting that multi-level coordination and co-production mechanisms [23,24,25] are vital for translating technological innovation into SAI-oriented governance practice. The findings were found to confirm that RAI and SAI, particularly when embedded within deep-learning-enabled CE models, have progressed from an emergent research topic to an integrative paradigm driving data-driven, ethically grounded, and policy-responsive smart-city transformation [26].

4.2. Theoretical Implications

The findings were found to significantly extend the theoretical understanding of smart-city evolution, RAI systems, the SAI model, and the CE model as technological enablers of urban transformation [1,6,11,27,28]. The analyses were found to demonstrate that RAI-driven CE systems evolve not only through digital efficiency but also through the co-production of ethical and institutional frameworks that redefine SAI governance. The analyses were found to demonstrate that RAI-driven CE systems evolve not only through digital efficiency but also through the co-production of ethical and institutional frameworks that redefine SAI governance. Accordingly, the CE model is repositioned as an adaptive-intelligence construct within which RAI systems are understood to act as catalysts for resilience, reflexivity, and SAI—dimensions frequently overlooked in traditional urban sustainability transitions [10,11].
The insights were found to refine both transition-management and RAI-innovation theories by demonstrating that SAI requires integrative governance capable of embedding ethical oversight within processes of systemic transformation [29]. The findings were found to further extend socio-technical transition theory by showing that SAI governance operates through digital infrastructures characterised by environmental circularity and public accountability [30]. By synthesising RAI discourse with CE theory, governance is conceptualised in this study as a dynamic interface rather than as a static control mechanism. Such synthesis is found to establish the theoretical basis for a reflexive smart-city paradigm in which sustainability, responsibility, and innovation co-evolve through ethically guided, data-driven development that institutionalises trust, transparency, and social legitimacy across smart-city ecosystems [31].

4.3. Practical Implications for Smart-City Stakeholders

Actionable insights were derived for policymakers, municipal administrators, technologists, and civil-society actors operating within smart-city and CE ecosystems. For policy stakeholders, the embedding of EAI, RAI, and SAI governance together with anticipatory regulation within urban sustainability frameworks was underscored as imperative. Policy design is required to evolve beyond compliance-based oversight towards a proactive governance model that reconciles innovation, accountability, and inclusivity. This requirement entails the establishment of mechanisms through which RAI and SAI principles are integrated into urban planning and regulatory architectures, thereby ensuring that deep learning applications operate within transparent and accountable governance systems.
For industrial and technological sectors, the evidence is found to underscore the necessity of aligning RAI system design with the CE model to achieve transparency, interoperability, and lifecycle optimisation. Such alignment is found to operationalise sustainability through digital infrastructures and to confirm that industrial innovation must coexist with environmental stewardship and social responsibility. Adaptive governance frameworks can be further institutionalised by municipal administrators to harmonise digital intelligence with long-term urban circularity, thereby supporting the transition from technology deployment to SAI-oriented urban transformation.
For academia and civil society, the implications are found to emphasise co-production, participatory governance, and societal learning as pivotal mechanisms for democratising RAI-enabled sustainability transitions. SAI ecosystems are to be cultivated to strengthen feedback loops among research, policy, and practice, thereby ensuring that innovation remains context-sensitive, equitable, and socially legitimate. This RAI and SAI orientation is found to align with reflexive governance theory, which advocates iterative adaptation and multi-level coordination for managing complex socio-technical transitions. Enhanced collaboration between institutional and civic actors is therefore expected to reinforce the legitimacy and accountability of RAI- and SAI-driven CE initiatives.

4.4. Policy and Governance Initiatives

The empirical findings were found to underscore the policy and governance mechanisms required to advance RAI and SAI-driven smart-city transformation. At the national level, the institutionalisation of RAI and SAI charters was encouraged to embed ethical oversight within innovation policy, thereby ensuring transparency, fairness, and accountability across digital infrastructures. At the municipal level, the establishment of SAI frameworks and digital ethics councils was recommended to guide the deployment of RAI across planning, energy, and mobility domains. Such institutional mechanisms were expected to enhance procedural legitimacy and to promote intersectoral collaboration. At the international level, governance initiatives were developed to mitigate geographical bias and uneven data representation across regions. Structural disparities influencing the RAI, SAI, and CE models were aligned with local policy, cultural, and behavioural contexts. Region-specific model calibration was implemented to enhance visibility and safeguard high-risk populations.

4.5. Limitations and Future Research

Several limitations were acknowledged in this study, primarily stemming from methodological and data-related constraints inherent in large-scale bibliometric and policy-translation analyses. The exclusive reliance on Scopus-indexed records was recognised as a potential constraint on representativeness, as it may have excluded regionally significant or non-indexed publications. The static nature of keyword-based mapping was also acknowledged as a potential limitation, as it may have underrepresented emerging conceptual nuances. Furthermore, the cross-sectional design was recognised as limiting longitudinal verification beyond 2025, while policy-translation approximations introduced interpretive uncertainty in associating publication patterns with real-world governance outcomes. Potential measurement bias and variation in metadata quality were acknowledged as additional factors that may have influenced analytical precision. Although these limitations were mitigated through cross-validation and robustness diagnostics, cautious interpretation remains essential to avoid overgeneralisation and to preserve the contextual validity of the observed relationships.
Future research is recommended to employ longitudinal and mixed-method approaches to capture temporal evolution and causal dynamics within RAI and SAI–enabled CE trajectories. The integration of bibliometric analytics with mixed-method policy analysis and stakeholder research was identified as a means to enhance interpretive richness and contextual depth. Multi-level policy modelling is recommended to examine interactions between local experimentation and global governance mechanisms, thereby clarifying pathways for institutional scalability. Furthermore, participatory co-creation frameworks are recommended to ensure civic inclusion and ethical deliberation within urban digital transformation processes. Such interdisciplinary, reflexive, and participatory research designs were identified as essential for reinforcing the epistemic, ethical, and policy coherence of future RAI–enabled smart-city sustainability studies, thereby ensuring both theoretical advancement and SAI applicability.

5. Conclusions

The study was designed to integrate RAI and SAI research within CE-oriented smart-city frameworks. A knowledge translation analysis was conducted using the Scopus database, producing 3842 records, from which 1176 studies were selected for inclusion. Three principal outcome categories were identified. The first outcome indicated that publication trends in RAI and SAI for CE models within smart-city frameworks were statistically significant ( R 2 = 0.94, p < 0.001). The second outcome demonstrated that circular manufacturing, waste management automation, predictive energy optimisation, urban data platforms, and smart mobility systems were increasingly integrated within RAI and SAI applications for CE models in smart-city contexts. The third outcome revealed that RAI and SAI within CE models produced a significant effect (M = −0.61, SD = 0.09, t(9) = 7.42, p < 0.001) and correlated positively with policy alignment (r = 0.34, p = 0.042) in smart-city contexts. Through sensitivity analysis, the cross-validated CE model was shown to yield an RMSE of 0.054, corresponding to a 95% CI of ±0.021. The strategic importance of applying RAI and SAI principles was underscored as fundamental to advancing equitable, transparent, and sustainability-oriented innovation across global urban systems.

Supplementary Materials

The following supporting information can be downloaded at: https://www.mdpi.com/article/10.3390/su18010398/s1, Table S1: PRISMA 2020 Main Checklist; Table S2: PRISMA 2020 Abstract Checklist [32].

Funding

This research received no external funding.

Data Availability Statement

All data underpinning the findings of this study are openly available through the Generalised Systematic Review Registration Portal, hosted on the Open Science Framework (OSF). The complete dataset, accompanied by detailed documentation and supplementary materials, can be accessed via the designated project link https://osf.io/svz3e (accessed on 9 November 2025) and is concurrently indexed under the corresponding publication DOI (https://doi.org/10.17605/OSF.IO/EBY57). These resources have been provided to ensure maximum methodological transparency and to facilitate independent verification, replication, and subsequent secondary analyses by the wider research community.

Conflicts of Interest

The authors declare no conflicts of interest.

References

  1. Elrick-Barr, C.E.; Thomsen, D.C.; Smith, T.F. Governance innovations in the coastal zone: Towards social-ecological resilience. Environ. Sci. Policy 2024, 153, 103687. [Google Scholar] [CrossRef]
  2. Zhang, Y.; Lin, Y.; Zheng, G.; Liu, Y.; Sukiennik, N.; Xu, F.; Guo, H. MetaCity: Data-driven sustainable development of complex cities. Innovation 2025, 6, 100775. [Google Scholar] [CrossRef]
  3. Marzani, G.; Tondelli, S.; Kuma, Y.; Cruz Rios, F.; Hu, R.; Bock, T.; Linner, T. Embedding Circular Economy in the Construction Sector Policy Framework: Experiences from EU, US, and Japan for Better Future Cities. Smart Cities 2025, 8, 48. [Google Scholar] [CrossRef]
  4. Awuzie, B.; Ngowi, A.; Aghimien, D. Towards built environment decarbonisation: A review of the role of artificial intelligence in improving energy and materials’ circularity performance. Energy Build. 2024, 319, 114491. [Google Scholar] [CrossRef]
  5. Al-Shetwi, A.Q.; Atawi, I.E.; El-Hameed, M.A.; Abuelrub, A. Digital twin technology for renewable energy, smart grids, energy storage and vehicle-to-grid integration: Advancements, applications, key players, challenges and future perspectives in modernising sustainable grids. IET Smart Grid 2025, 8, e70026. [Google Scholar] [CrossRef]
  6. Hosseini Tabaghdehi, S.A.; Ayaz, Ö. AI ethics in action: A circular model for transparency, accountability and inclusivity. J. Manag. Psychol. 2025. [Google Scholar] [CrossRef]
  7. Manetti, S.; Ni, M.; Supino, S.; Troisi, O. Rethinking the circular economy in agri-food: Human-centred AI for a new circular economy 5.0 paradigm. Br. Food J. 2025. [Google Scholar] [CrossRef]
  8. Zakaria, H.; Fauzi, M.A.; Kamarudin, D.; Suki, N.M.; Kasim, M.A. The triple, quadruple, and quintuple helix models: A bibliometric analysis and research agenda. J. Knowl. Econ. 2025, 16, 15491–15539. [Google Scholar] [CrossRef]
  9. Calzada, I.; Eizaguirre, I. Digital inclusion and urban AI: Strategic roadmapping and policy challenges. Discov. Cities 2025, 2, 73. [Google Scholar] [CrossRef]
  10. Tutore, I.; Parmentola, A.; Di Fiore, M.C.; Calza, F. A conceptual model of artificial intelligence effects on circular economy actions. Corp. Soc. Responsib. Environ. Manag. 2024, 31, 4772–4782. [Google Scholar] [CrossRef]
  11. Hernandez, J.C.R.; Villa-Enciso, E.; Cardona-Acevedo, S.; Valencia, J.; Velasquez Salas, S. Smart Innovation for a Circular Economy: A Systematic Review of Emerging Trends and the Future of AI in the Sustainable Economy. Sustainability 2025, 17, 5793. [Google Scholar] [CrossRef]
  12. Roberts, H.; Zhang, J.; Bariach, B.; Cowls, J.; Gilburt, B.; Juneja, P.; Floridi, L. Artificial intelligence in support of the circular economy: Ethical considerations and a path forward. AI Soc. 2024, 39, 1451–1464. [Google Scholar] [CrossRef]
  13. McCrea, R.; Coates, R.; Hobman, E.V.; Bentley, S.; Lacey, J. Responsible innovation for disruptive science and technology: The role of public trust and social expectations. Technol. Soc. 2024, 79, 102709. [Google Scholar] [CrossRef]
  14. Akl, E.A.; Khabsa, J.; Iannizzi, C.; Piechotta, V.; Kahale, L.A.; Barker, J.M.; Skoetz, N. Extension of the PRISMA 2020 statement for living systematic reviews (PRISMA-LSR): Checklist and explanation. BMJ 2024, 387, e079183. [Google Scholar] [CrossRef]
  15. Bukar, U.A.; Sayeed, M.S.; Razak, S.F.A.; Yogarayan, S.; Amodu, O.A.; Mahmood, R.A.R. A method for analyzing text using VOSviewer. MethodsX 2023, 11, 102339. [Google Scholar] [CrossRef] [PubMed]
  16. Qian, L.; Zeng, X.; Ding, Y.; Peng, L. Mapping the knowledge of ecosystem service-based ecological risk assessment: Scientometric analysis in CiteSpace, VOSviewer, and SciMAT. Front. Environ. Sci. 2023, 11, 1326425. [Google Scholar] [CrossRef]
  17. Pathan, M.S.; Richardson, E.; Galvan, E.; Mooney, P. The Role of Artificial Intelligence within Circular Economy Activities—A View from Ireland. Sustainability 2023, 15, 9451. [Google Scholar] [CrossRef]
  18. Fernández, S.; Bodin, U.; Synnes, K. On the Interplay Between Behavior Dynamics, Environmental Impacts, and Fairness in the Digitalized Circular Economy with Associated Business Models and Supply Chain Management. Sustainability 2025, 17, 3437. [Google Scholar] [CrossRef]
  19. Kanda, W.; Klofsten, M.; Bienkowska, D.; Audretsch, D.B.; Geissdoerfer, M. Orchestration in mature entrepreneurial ecosystems towards a circular economy: A dynamic capabilities approach. Bus. Strateg. Environ. 2025, 34, 4747–4765. [Google Scholar] [CrossRef]
  20. Ali, Z.A.; Zain, M.; Pathan, M.S.; Mooney, P. Contributions of artificial intelligence for circular economy transition leading toward sustainability: An explorative study in agriculture and food industries of Pakistan. Environ. Dev. Sustain. 2024, 26, 19131–19175. [Google Scholar] [CrossRef]
  21. Anttiroiko, A.-V. Smart Circular Cities: Governing the Relationality, Spatiality, and Digitality in the Promotion of Circular Economy in an Urban Region. Sustainability 2023, 15, 12680. [Google Scholar] [CrossRef]
  22. D’Amico, G.; Arbolino, R.; Shi, L.; Yigitcanlar, T.; Ioppolo, G. Digital Technologies for Urban Metabolism Efficiency: Lessons from Urban Agenda Partnership on Circular Economy. Sustainability 2021, 13, 6043. [Google Scholar] [CrossRef]
  23. Lepratte, L.; Yoguel, G. Co-production, artificial intelligence and replication: The path of routine dynamics. Rev. Evol. Political Econ. 2024, 5, 535–558. [Google Scholar] [CrossRef]
  24. Cuomo, F. Urban Living Lab: An Experimental Co-Production Tool to Foster the Circular Economy. Soc. Sci. 2022, 11, 260. [Google Scholar] [CrossRef]
  25. D’Amato, D.; Korhonen-Kurki, K.; Lyytikäinen, V.; Matthies, B.D.; Horcea-Milcu, A.I. Circular bioeconomy: Actors and dynamics of knowledge co-production in Finland. For. Policy Econ. 2022, 144, 102820. [Google Scholar] [CrossRef]
  26. Mohandas, R.; Southern, M.; Fitzpatrick, C.; Hayes, M. Deep learning enabled computer vision in remanufacturing and refurbishment applications: Defect detection and grading for smartphones. J. Remanuf. 2025, 15, 65–95. [Google Scholar] [CrossRef]
  27. Čišić, D.; Drezgić, S.; Čegar, S. Waste and the Urban Economy: A Semantic Network Analysis of Smart, Circular, and Digital Transitions. Urban Sci. 2025, 9, 410. [Google Scholar] [CrossRef]
  28. Hu, J.-L.; Li, Y.; Chew, J.-C. Industry 5.0 and Human-Centered Energy System: A Comprehensive Review with Socio-Economic Viewpoints. Energies 2025, 18, 2345. [Google Scholar] [CrossRef]
  29. Pel, B. Is ‘digital transition’ a syntax error? Purpose, emergence and directionality in a contemporary governance discourse. J. Responsib. Innov. 2024, 11, 2390707. [Google Scholar] [CrossRef]
  30. Acosta Llano, E.; Hurmelinna-Laukkanen, P.; Haapanen, L. Blockchain for the circular economy: Implications for public governance. Int. J. Public Sect. Manag. 2025, 38, 30–52. [Google Scholar] [CrossRef]
  31. Di Vaio, A.; Hasan, S.; Palladino, R.; Hassan, R. The transition towards circular economy and waste within accounting and accountability models: A systematic literature review and conceptual framework. Environ. Dev. Sustain. 2023, 25, 734–810. [Google Scholar] [CrossRef] [PubMed]
  32. Page, M.J.; McKenzie, J.E.; Bossuyt, P.M.; Boutron, I.; Hoffmann, T.C.; Mulrow, C.D.; Shamseer, L.; Tetzlaff, J.M.; Akl, E.A.; Brennan, S.E.; et al. The PRISMA 2020 statement: An updated guideline for reporting systematic reviews. BMJ 2021, 372, n71. [Google Scholar] [CrossRef]
Figure 1. PRISMA 2020 flow diagram.
Sustainability 18 00398 g001
Figure 2. Risk of bias and quality assessment: (a) Bar chart; (b) Funnel-style bias profile.
Sustainability 18 00398 g002
Figure 3. Bibliometric dispersion diagnostics: (a) Lotka’s Law; (b) Bradford’s law; (c) Zipf’s law.
Sustainability 18 00398 g003
Figure 4. Mapping CE strategies to smart-city domains and RAI and SAI functions.
Sustainability 18 00398 g004
Figure 5. Main knowledge clusters in the RAI- and SAI-enabled CE smart city.
Sustainability 18 00398 g005
Figure 6. Conceptual structure of keyword co-occurrence in the RAI- and SAI-enabled CE smart city.
Sustainability 18 00398 g006
Figure 7. Thematic evolution and strategic diagram of the RAI- and SAI-enabled CE smart city.
Sustainability 18 00398 g007
Figure 8. Positioning of RAI versus SAI and Governance Gaps in CE Research.
Sustainability 18 00398 g008
Figure 9. Mapping RAI CE research diffusion to policy and SDGs.
Sustainability 18 00398 g009
Figure 10. City-Level pilots and testbeds for RAI, SAI, and CE innovation.
Sustainability 18 00398 g010
Figure 11. Barriers and enablers of knowledge translation in RAI and SAI within CE research.
Sustainability 18 00398 g011
Figure 12. Evidence gaps in smart-city models.
Sustainability 18 00398 g012
Figure 13. Sensitivity and robustness diagnostics: (a) RMSE distribution; (b) bootstrapped β variation; (c) Cook’s D leverage profile.
Sustainability 18 00398 g013
Table 1. Descriptive analysis of included studies.
DomainCore Categoryn%Statistical Indicator
1. Study selection and corpus profileRecords identified (Scopus)3842100.0
Duplicates removed125032.5
Screened (title/abstract)259267.5
Full texts assessed147638.4
Full texts excluded3007.8
Final included studies117630.6
2. Publication year distribution (2020–2025)20201028.7 χ 2 (5) = 42.87, p < 0.001
202115413.1
202221117.9
202324821.1
202431226.5
202514912.7
3. Region of study originEurope44738.0 χ 2 (5) = 31.24, p < 0.01
East Asia31827.0
North America22319.0
Latin America827.0
Sub-Saharan Africa595.0
MENA474.0
4. Funding disclosureFunding reported72962.0 χ 2 (1) = 18.96, p < 0.001
No funding reported44738.0
Funding source (n = 729)National science agencies33646.1 χ 2 (4) = 57.93, p < 0.001
International organisations13118.0
Universities/internal grants15321.0
Industry/private7310.0
Other public funds364.9
5. Study design typesQuantitative63554.0 χ 2 (3) = 64.12, p < 0.001
Qualitative27023.0
Mixed methods27123.0
6. Sample size categories≤5021418.2 χ 2 (5) = 29.63, p < 0.001
51–10026322.4
101–25031226.5
251–50017114.5
>5001048.8
No direct participants1129.5
7. Sampling methodsConvenience47240.1 χ 2 (4) = 51.08, p < 0.001
Purposive/theoretical29425.0
Probability sampling16313.9
Census716.0
Not reported17615.0
8. Demographic reporting (n = 1064)Gender reported78473.7 χ 2 (4) = 72.45, p < 0.001
Age reported71166.8
SES reported38936.6
Education level reported45242.5
Migration/ethnicity reported26725.1
9. Gender composition (n = 784)Predominantly male23129.5 χ 2 (3) = 9.83, p = 0.020
Predominantly female21827.8
Balanced (40–60% female)29537.6
Other/non-binary405.1
10. Age profile (n = 711)Mean < 30 years28640.2 χ 2 (3) = 55.67, p < 0.001
Mean 30–49 years29741.8
Mean ≥ 50 years9913.9
Mixed/no dominant group294.1
Table 2. Statistical summary of functional domains.
Functional DomainShare of Total Studies (%)RAI and SAI ApplicationStatistical Indicator
Energy systems26.8Predictive analytics were employed for energy demand forecasting, smart grid management, renewable energy integration, and the development of optimisation algorithms. β = 0.324, p < 0.001; = 22.4; SD = 7.1
Mobility and transport21.9Predictive analytics were employed for energy demand forecasting, smart grid management, renewable energy integration, and the development of optimisation algorithms. β = 0.279, p < 0.01; F(5,1170) = 9.42, p < 0.001
Waste and resource recovery19.4Computer vision for waste sorting, sensor-based monitoring, and material flow analysis were applied to enhance automation, accuracy, and traceability within waste valorisation and resource recovery processes. β = 0.241, p < 0.01; M = 17.3
Buildings and construction13.6Smart building energy management, circular materials tracking, and BIM–AI integration were employed to optimise resource efficiency, strengthen lifecycle monitoring, and promote sustainable construction practices. β = 0.198, p < 0.05
Water and sanitation systems8.7RAI-enabled leakage detection, demand forecasting, and water-quality modelling were applied to enhance the efficiency, resilience, and sustainability of water management systems. β = 0.146, p < 0.05; M = 15.2
Digital infrastructure and governance6.2IoT networks, blockchain frameworks for data transparency, and RAI ethics dashboards were integrated to reinforce accountability, traceability, and governance within the research context. β = 0.121, p = 0.062; M = 12.8
Food circularity and urban agriculture3.4AI was employed for food waste prediction, circular supply chain management, and precision agriculture. β = 0.097, p = 0.078
Aggregate model statisticsF(5,1170) = 9.42, p < 0.001; R 2 = 0.41
Table 3. Statistical summary of RAI, SAI and deep learning technique distribution in smart-city CE studies.
RAI and SAI Technique FamilyProportion of Total Studies (%)Key ApplicationStatistical Indicator
Deep learning frameworks38.7Neural networks were employed for image recognition, predictive analytics, waste sorting, and energy demand forecasting. β = 0.341, p < 0.001; M = 23.8; SD = 6.9
Classical machine learning27.9Correlation–silhouette models, decision trees, and support vector machines were applied for demand prediction and resource allocation. β = 0.284, p < 0.01; M = 18.1; SD = 5.8
Optimisation-based methods18.6Genetic algorithms, swarm intelligence, and multi-objective optimisation techniques were utilised to improve logistics and material efficiency. β = 0.226, p < 0.05; F(4,1171) = 8.96, p < 0.001
Reinforcement learning9.4Adaptive control techniques were applied to traffic systems, energy balancing, and decision-making under uncertainty. β = 0.193, p < 0.05; r = 0.42, p < 0.01
Hybrid and ensemble models5.4Integrative frameworks combining machine learning, optimisation, and neural components were developed for multi-objective tasks. β = 0.178, p = 0.063; M = 16.5
Aggregate distribution statistics χ 2 = 63.21; p < 0.001; R2 = 0.47; F(4,1171) = 8.96, p < 0.001
Table 4. Statistical summary of city-level pilots for RAI–SAI of CE models.
City/RegionAI ReadinessCE IntegrationPolicy IntegrationInnovation IntensityStatistical Indicators
Singapore0.920.820.861.00 r = 0.71 ***; β = 0.283 *; R 2 = 0.54
Amsterdam0.850.780.900.94F(9,110) = 8.47, p < 0.001
Helsinki0.880.750.880.91CE = 0.77; SD = 0.05
Barcelona0.810.710.810.84Skewness = 0.19; Kurtosis = −0.42
Copenhagen0.760.840.840.8895% CI [0.47, 0.73]
Seoul0.890.690.830.79Partial η 2 = 0.41
Stockholm0.830.730.800.82 t (109) = 3.76, p < 0.01
Toronto0.740.770.750.80Adjusted R 2 = 0.52
Shanghai0.790.680.760.74 Δ R 2 = 0.05; p = 0.021
Bangkok0.710.650.680.69Cohen’s f 2 = 0.31
Aggregate model statistics r = 0.71 ***, p < 0.001; β = 0.283 *, p = 0.019
Overall mean (±SD)0.82 ± 0.070.74 ± 0.060.81 ± 0.060.83 ± 0.09Model fit: R 2 = 0.54; F(9,110) = 8.47, p < 0.001
Note: * = p < 0.05, *** = p < 0.001.
Table 5. Statistical summary of identified evidence gaps in smart-city governance.
Governance DomainEvidence StrengthPolicy AlignmentImplementation DepthCluster ClassificationStatistical Testing
AI regulation0.880.510.63Innovation–emergent β   =   0.312 ,   p   =   0.009 ;   r = 0.68 **
Data privacy0.860.580.55Innovation–emergent β   =   0.287 ,   p   =   0.013 ;   R 2 = 0.49
Digital infrastructure0.790.460.58Innovation–emergentF(9,115) = 7.86, p < 0.001
CE policy0.830.490.64Translational β = 0.254, p = 0.017
EAI frameworks0.780.550.60Innovation–emergent r = 0.41 *, p = 0.038
Citizen engagement0.810.430.61Transitional β = 0.196, p = 0.047
Urban innovation labs0.750.440.57Innovation–emergent r = 0.39 *, p = 0.049
Resilience planning0.730.420.52Foundational R 2   =   0.46 ;   Δ R 2 = 0.05
Public procurement0.690.390.54Foundational β = 0.163, p = 0.062
Smart mobility governance0.770.470.59Translational r = 0.44 *, p = 0.041
Aggregate model statistics r = 0.34 *, p   =   0.042 ;   β = 0.271 *, p = 0.017
Overall mean (±SD)0.78 ± 0.060.47 ± 0.060.58 ± 0.04Model fit: R 2 = 0.49; F(9,115) = 7.86, p < 0.001
Note: * = p < 0.05, ** = p < 0.01.
Table 6. Sensitivity and robustness diagnostics for model reliability and stability.
Analytical ProcedureTesting MethodStatistical IndicatorObserved ValueThreshold
Cross-ValidationTenfold k-cross-validationMean RMSE0.054<0.06
SD RMSE0.006<0.010
Mean cross-validated R 2 0.52±0.02 of primary R 2
Bootstrapped resamplingNon-parametric bootstrapping (n = 5000)Mean β coefficient deviation±0.018±0.05
95% CI range±0.021±0.05
Empirical p-value (bootstrap bias-corrected)0.004<0.05
Leave-one-out diagnosticsIterative case exclusionMaximum Cook’s D0.041<0.05
Mean leverage value0.083<0.10
Mean studentised residual0.024<0.05
Monte Carlo resamplingRandomised resampling (n = 10,000) R 2 stability index0.94>0.90
RMSE Stability Index0.91>0.85
Aggregate model fitAdjusted R 2 (baseline vs. cross-validated)0.54 → 0.52 Δ R 2 = 0.02
Disclaimer/Publisher’s Note: The statements, opinions and data contained in all publications are solely those of the individual author(s) and contributor(s) and not of MDPI and/or the editor(s). MDPI and/or the editor(s) disclaim responsibility for any injury to people or property resulting from any ideas, methods, instructions or products referred to in the content.