Abstract
Coastal cities face escalating flood risk under sea-level rise, yet landscape-based adaptation strategies often remain speculative and weakly connected to the accessibility and economic constraints that shape sustainable urban development. This study developed a modeling-to-design framework that translates coupled climate and land-use projections into implementable landscape interventions, through planning-level spatial allocation, using Dalian, China as a case study under “middle of the road” (SSP2-4.5) climate conditions. The framework integrates the Land-use Evolution and Assessment Model (LEAM) with connected-bathtub flood modeling to evaluate whether strategic landscape design can redirect development away from flood-prone zones while accommodating projected growth and maintaining accessibility to employment and services. Interventions—protective wetland restoration (810 km2) and blue–green corridors (8 km2)—derived from a meta-synthesis of implemented coastal projects were operationalized as LEAM spatial constraints. Our results show that residential development can be redirected away from coastal risk with 100% demand satisfaction and elimination of moderate-risk allocations. Cropland demand was fully accommodated. In contrast, commercial development experienced 99.8% reduction under strict coastal protection, reflecting locational dependence on port-adjacent sites. This modeling-to-design framework offers a transferable approach to quantifying where landscape interventions succeed, where they face barriers, and where complementary measures are required, supporting decision-making that balances environmental protection, economic function, and social accessibility in sustainable coastal development.
1. Introduction
Coastal cities face escalating flood risk from sea-level rise, land subsidence, and intensifying storms, with projected losses concentrated in major port cities and deltaic systems worldwide [1,2]. The Intergovernmental Panel on Climate Change projects that even under moderate emission scenarios (0.75–1.4 m of rise by 2100) [3], population exposure to centennial coastal floods will increase substantially without systematic adaptation [2]. The impacts threaten not only infrastructure and housing security but also long-term development trajectories, particularly in rapidly urbanizing coastal regions of Asia where development pressure, land scarcity, and institutional fragmentation intersect with accelerating climate hazards [4,5,6]. This implies, as Nicholls and Cazenave [4] argue, that societies must commit to long-term adaptation because sea-level rise will continue for centuries regardless of near-term mitigation. Flood exposure is unevenly distributed, with lower-income communities often occupying higher-risk zones, raising socio-spatial equity concerns that adaptation planning must address [7].
Nature-based solutions and landscape interventions including coastal wetlands [8], hybrid gray–green structures [9], and multifunctional green corridors [10], have emerged as adaptation alternatives to conventional hard infrastructure solutions [11,12,13]. Recent research shows that vegetated coastal systems can attenuate wave energy [14], stabilize sediments [15], and maintain dynamic profiles that adjust to sea-level change [16]. The economic justification for these types of solutions is also documented [17,18,19]. Narayan et al. [20], for example, calculate that coastal wetlands prevented 625 million USD in damages during Hurricane Sandy and reduced average annual flood losses by 16% in specific U.S. coastal areas. Despite these notable benefits, and growing recognition that nature-based solutions can address multiple climate hazards while supporting biodiversity and social well-being [21,22], the systematic integration of nature-based solutions in coastal areas remains somewhat limited. A recent meta-synthesis ( = 123) of implemented coastal landscape interventions reveals some critical gaps in actual implementation. Although 95% of the projects reviewed referenced climate hazards and the potential for sea-level rise, only 4% explicitly integrated these types of projections into design parameters, and fewer than 2% employed integrated monitoring frameworks (Pang and Deal [5]). Most projects reported performance qualitatively, lacking the quantitative scaffolding needed to inform territorial spatial planning and adaptation.
This disconnect between environmental modeling and landscape practice reflects broader challenges at the science–design interface [23,24,25]. Coastal flood models, for example, excel at characterizing physical exposure but typically treat the built environment as static. They typically project risk without accounting for future growth or planning interventions that could redirect development [26,27]. Conversely, urban land-use models used to decipher urban dynamics typically project urban expansion but rarely incorporate climate hazards as dynamic constraints or evaluate landscape interventions as drivers of urban form [28,29]. One such urban land-use model, Land-use Evolution and Impact Assessment Model (LEAM), which was developed at the University of Illinois, exemplifies both the capabilities and limitations of the current approaches.
The LEAM employs a three-stage spatially explicit framework at a 30 m resolution. The model generates attraction surfaces that capture spatial drivers like transportation accessibility, estimates land-use probability surfaces through statistical analysis, and allocates projected demand using competitive bidding algorithms that respect constraints and policy boundaries. The LEAM’s modular approach enables integration with a variety of assessment models and frameworks, including regional economic models and sociohydrological modeling processes [30].
For this paper, we developed and tested an integrated modeling-to-design framework that couples LEAM urban growth simulation with sea-level rise and flood modeling for Dalian, China. Dalian is a rapidly urbanizing port city with extensive low-lying coastal plains and growing flood exposure. We derived landscape intervention strategies from our meta-synthesis of regional projects and operationalized these as LEAM spatial constraints and attractiveness modifications. Semi-structured interviews with planners and administrators were used to assess scenario institutional feasibility and identify implementation pathways aligned with existing governance structures. We used the IPCC Shared Socioeconomic Pathways (SSPs) project “middle of the road” scenario (SSP2-4.5) as our climate projection and sea-level rise parametrization.
China’s territorial spatial planning system presents a distinctive institutional context for integrating land-use modeling with climate adaptation that differs markedly from the North American planning frameworks. The “three zones, three lines” framework used extensively in China [31] establishes hierarchical spatial controls that designate ecological protection zones, permanent agricultural land, and urban development boundaries, with legally binding redlines that constrain development in areas deemed critical for ecological function, food security, or resource protection [32]. Ecological protection redlines encompass sensitive ecosystems including wetlands, forests, and coastal zones; permanent basic farmland redlines safeguard agricultural productivity; and urban development boundaries delineate areas where urbanization is permitted, creating a nested system of spatial governance that operates across national, provincial, and municipal scales [33,34].
Our proposed framework addresses four main objectives: (1) couple the LEAM with flood modeling to establish baseline development trajectories and exposure to flood risk; (2) translate evidence-based landscape typologies into quantitative and modeled spatial rules implementable within the LEAM; (3) test whether interventions measurably redirect residential, commercial, and agricultural development from vulnerable zones; and (4) evaluate institutional conditions for implementation. We hypothesize that protective wetland restoration and blue–green corridors can help eliminate moderate-risk exposure to residential properties while satisfying the projected demand for housing.
This research contributes to integration of climate science with landscape practice by moving from conceptual proposals toward quantifiable, scenario-tested interventions. Our modular framework—evidence synthesis, typology derivation, spatial rule encoding, simulation, and evaluation—offers a transferable methodology for coastal cities seeking to connect environmental models with actionable planning guidance. This integration supports socially sustainable landscape architecture by linking physical design interventions to their effects on community accessibility and spatial equity. By explicitly quantifying intervention effectiveness under policy-relevant pathways and identifying implementation constraints through practitioner interviews, we bridge critical gaps between scientific projection, design imagination, and institutional feasibility.
Following this Introduction, Section 2 details the study area, data, and integrated LEAM–flood modeling methodology. Section 3 presents the baseline and intervention scenario results, quantifying spatial redistribution and differential land-use responses. Section 4 discusses implications for landscape-based adaptation and territorial spatial planning practice. Section 5 concludes with synthesis and future research directions.
2. Materials and Methods
This research developed and tested an integrated modeling-to-design framework that couples LEAM land-use simulations (Land-use Evolution and Assessment Model (LEAM; University of Illinois at Urbana-Champaign, Urbana, IL, USA) with sea-level rise and coastal flood projections for 2050 under IPCC climate scenarios. Using the Dalian Metropolitan Region as a case study, the research translated model outputs into spatially explicit landscape interventions—protective coastal wetlands, blue–green corridors, and adjusted urban growth zones—drawn from the typological repertoire identified in recent meta-analyses of implemented projects. Importantly, these interventions were encoded as rule sets within the land-use model itself, allowing quantitative evaluation of how different landscape strategies redirect urban development, alter future flood exposure, and interact with China’s territorial spatial planning constraints.
Our methodology operated at 30 m spatial resolution across the approximately 13,400 km2 Dalian Metropolitan Region. We employed a three-stage analytical workflow (Figure 1): (1) baseline characterization of existing urban growth patterns and flood exposure under mid-century sea-level rise projections (SSP2-4.5); (2) evidence-based design of three landscape intervention typologies (derived from our systematic meta-synthesis of implemented coastal adaptation projects); and (3) comparative scenario modeling to assess intervention effectiveness in altering spatial allocation of projected residential, commercial, and agricultural development. All spatial analyses were conducted in R version 4.5.0 (R Foundation for Statistical Computing, Vienna, Austria).
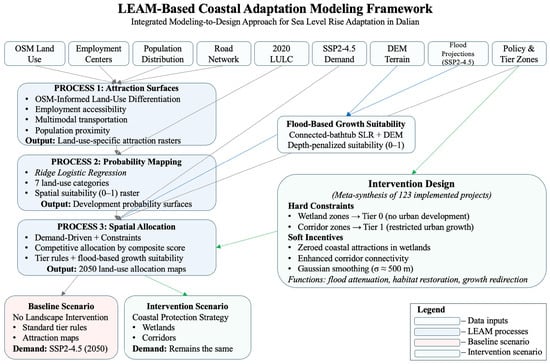
Figure 1.
LEAM-based coastal adaptation modeling framework. The integrated approach couples three LEAM processes (attraction surface generation, probability mapping, spatial allocation) with connected-bathtub flood modeling and evidence-based landscape intervention design derived from meta-synthesis of 123 implemented projects. The framework generates two comparative scenarios—baseline (no intervention) and intervention—under SSP2-4.5 mid-century demand projections, enabling quantitative assessment of intervention effectiveness in redirecting urban growth away from flood-vulnerable coastal zones.
2.1. Study Area and Data Foundation
The Dalian Metropolitan Region is located on the Liaodong Peninsula in northeastern China (Figure 2). The study area encompasses approximately 13,400 km2 corresponding to Dalian’s administrative metropolitan boundary. This spatial extent captures regional development pressures while providing adequate buffer zones for accessibility-driven urban growth simulation and coastal hazard assessment.
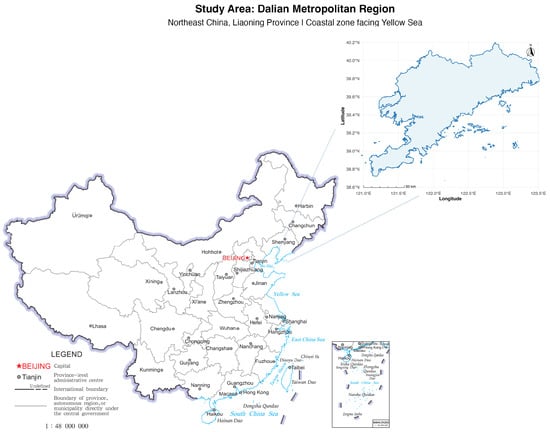
Figure 2.
Study area location. The Dalian Metropolitan Region in Liaoning Province, Northeast China, encompasses approximately 13,400 km2 of coastal territory facing the Yellow Sea. The region includes urban cores, peri-urban development zones, and rural hinterlands subject to sea-level rise and coastal flood hazards.
Dalian is a rapidly urbanizing port city with extensive low-lying coastal plains and steady economic growth tied to maritime logistics. The city faces increasing exposure to sea-level rise and compound coastal flooding. These conditions make it representative of broader coastal adaptation challenges in East Asia. Dalian was selected for proof-of-concept framework development based on three characteristics. First, steep geomorphic constraints imposed by the Liaodong Peninsula concentrate developable land along vulnerable coastal corridors. Second, sustained urbanization pressures drive continued coastal expansion despite known hazard exposure. Third, a port-dependent economic structure generates tension between coastal protection imperatives and commercial development requirements. This combination produces a constrained setting in which intervention trade-offs become analytically visible.
Baseline land-use classification derived from the China Multi-Period Land-Use Remote Sensing Monitoring Dataset (2020; Institute of Geographic Sciences and Natural Resources Research, Chinese Academy of Sciences, Beijing, China) identified twenty-one distinct categories following Chinese national standards, including urban residential (codes 21–22), urban commercial (code 23), industrial (code 24), and various agricultural and natural land covers. Digital elevation data at 30 m resolution (SRTM; NASA Jet Propulsion Laboratory, Pasadena, CA, USA) provided the terrain characteristics required for flood modeling and accessibility analysis. Road network data with speed classifications (OpenStreetMap; OpenStreetMap Foundation, UK) enabled network-based accessibility calculations. Age-stratified population data from the ASPECT population estimates (Accurate and Spatially Explicit Continental-scale Estimates of Total population, 100 m resolution; Nanjing University, Nanjing, China) at 100 m resolution, aggregated to study area resolution, provided total population distribution for attraction surface generation. OpenStreetMap polygon data (OpenStreetMap; OpenStreetMap Foundation, UK) covering the study area provided a basis for differentiating urban land-use subtypes within LEAM simulation categories.
2.2. Sea-Level Rise and Flood Modeling
Sea-level rise projections under SSP2-4.5 derived from IPCC AR6 (Intergovernmental Panel on Climate Change Sixth Assessment Report; IPCC, Geneva, Switzerland) regional assessments for the Northwest Pacific incorporate global mean sea-level rise, regional oceanographic adjustments, and glacial isostatic adjustment. SSP2-4.5 was selected as the reference climate pathway for this analysis. This intermediate scenario represents a “middle-of-the-road” trajectory and provides a practical anchor for mid-century planning applications. SSP2-4.5 is widely used in adaptation planning studies because it reflects a plausible future under moderate mitigation efforts. The choice aligns with planning horizons typically adopted in territorial spatial planning instruments. Results should be interpreted as conditional on this reference scenario rather than as projections across the full range of climate uncertainty.
A connected-bathtub approach was used to model coastal inundation. This method identifies all cells with elevations below the projected total water level that maintain hydrologic connectivity to the ocean. The total water level combines sea-level rise, tidal variations, and storm surge components. The approach accounts for coastal barriers and topographic protection. The connected-bathtub model produces a static hazard surface rather than dynamic flood simulation. It does not simulate storm surge dynamics, wave run-up, or the physical attenuation effects of landscape features. Consequently, the framework evaluates avoidance effectiveness rather than physical hydrodynamic mitigation. Avoidance effectiveness refers to the capacity of landscape interventions to redirect development away from flood-prone areas through spatial allocation rules. Wetland and corridor zones function as development exclusion or restriction areas within the land-use allocation framework. They do not modify flood depths or extents in the underlying hazard layer. Projected inundation depths were translated into a growth suitability surface through depth-based penalty functions. Areas with projected flood depths exceeding 50 cm received growth suitability values approaching zero; areas with depths between 20 and 50 cm received intermediate penalties (growth suitability 0.3–0.7); and areas with minimal or no projected flooding maintained high suitability values approaching one. This continuous penalty function reflected the practical reality that development feasibility declines progressively as flood depths increase while avoiding abrupt suitability discontinuities. The resulting growth suitability raster served as a key constraint layer in the LEAM, ensuring that accessibility-driven development probabilities incorporated hydrological risk at every spatial location (Figure 3).
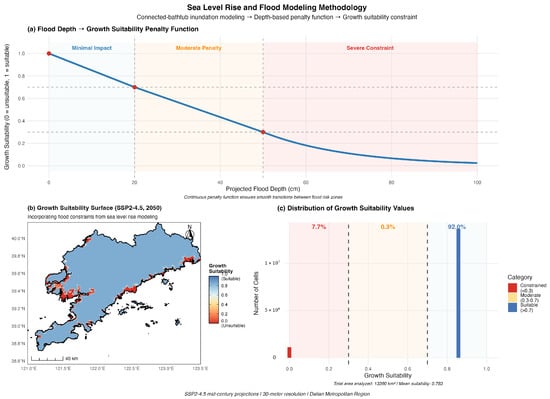
Figure 3.
Sea-level rise-driven flood modeling and growth suitability constraint for the Dalian Metropolitan Region: (a) Depth-penalty function used to convert projected inundation depth under SSP2-4.5 (2050) into continuous growth suitability values (0–1). Suitability declines gently for shallow flooding (0–20 cm), more steeply for intermediate depths (20–50 cm), and approaches zero beyond 50 cm, defining three risk bands—minimal impact, moderate penalty, and severe constraint. (b) Resulting growth suitability surface at 30 m resolution, showing how sea-level rise and coastal connectivity restrict developable land across the metropolitan area. (c) Histogram of suitability values, summarizing the proportion of land in constrained (<0.3), moderately constrained (0.3–0.7), and suitable (>0.7) categories. This growth suitability raster is used as a core constraint layer in the LEAM allocation process, ensuring that all simulated development probabilities incorporate sea-level rise and flood risk.
2.3. Landscape Intervention Typology Derivation and Operationalization
Our landscape intervention strategies were derived from a previous study of implemented coastal landscape projects worldwide (see Pang and Deal [5]). The meta-synthesis identified three recurrent typologies that are suitable for Dalian’s geomorphic and planning context: (1) protective coastal wetland restoration in moderate-risk inundation zones, (2) blue–green corridor establishment in upland drainage pathways, and (3) strategic growth redirection (modified attraction surfaces and tier classifications that steer development toward safer inland locations).
Our first intervention strategy, protective coastal wetland zones (810 km2), encompasses all moderate-risk coastal areas (growth suitability 0.2–0.7) within 500 m of existing wetland patches in the region. This reflects potential wetland restoration areas based on hydrologic connectivity and soil conditions. Our second strategy, the creation of blue–green corridor zones (8 km2) incorporated into drainage pathways, connects coastal protection zones to inland safe areas. They are identified through topographic analysis and existing green infrastructure network locations. Our third strategy is operationalized within the LEAM through two mechanisms: tier reclassification to Tier 0 (prohibited for urban development) for wetland core areas, and attraction surface modifications. This strategy reduces coastal attraction while enhancing corridor attractiveness through Gaussian smoothing operations (). This strategy represents blue/green infrastructure investments and accessibility improvements. Our overall approach (intervention strategies 1, 2, and 3 together) allows intervention scenarios to enhance ecological effectiveness and redirect development through both hard constraints (tier prohibitions) and soft incentives (attraction modifications), reflecting realistic policy implementation options.
Site-Specific Intervention Rationale. The systematic review identified seven primary intervention typologies from global practice. The Dalian application prioritized protective wetlands and blue–green corridors based on geomorphological and climatic considerations. Dalian’s mountainous peninsula configuration concentrates developable land along narrow coastal corridors between upland terrain and the waterfront. This setting tends to favor linear wetland belts and corridor interventions over extensive retreat strategies. Retreat approaches may be more appropriate for deltaic or barrier island settings. Wetland restoration and corridor systems are well-documented in the global evidence base, providing established precedent for their application. The selection of wetland restoration and corridor reservation reflected Dalian’s temperate climate (approximately 39° N latitude) and rocky coastline characteristics. Alternatives such as mangrove restoration or beach nourishment have limited applicability, given these conditions. Mangroves require tropical or subtropical climates, and beach nourishment is suited to sandy coasts. Hard engineering solutions such as seawalls and levees were not tested. The research question focused specifically on landscape-based interventions and their capacity to redirect development through spatial planning mechanisms. Hard infrastructure can reduce flood hazard but does not alter development allocation patterns through the accessibility and suitability pathways that the LEAM models. Hybrid solutions combining landscape interventions with selective hard infrastructure represent a direction for future scenario development. Such approaches may be particularly relevant for protecting critical port infrastructure where landscape-only strategies prove insufficient. The intervention typologies tested are, therefore, both evidence-based and context-appropriate. They derive from global synthesis and are compatible with Dalian’s biophysical setting.
2.4. LEAM Process 1: Land-Use-Specific Attraction Surface Generation
The LEAM modeling process generates land-use-specific attraction surfaces that capture differentiated spatial logic across development types. This approach recognizes that different development types (e.g., residential, commercial, or industrial) exhibit distinct locational preferences driven by different combinations of accessibility factors, including employment accessibility, transportation connectivity (e.g., walking, biking, driving, and mass transit), population proximity, and various points of interest (POIs).
Land-use/landcover 30 m raster maps and OpenStreetMap (OSM) polygon data provided an empirical basis for urban land-use location and differentiation. A rule-based classification algorithm evaluated multiple tag hierarchies (land-use, building, amenity, industrial) to assign OSM features to LEAM-compatible categories. Residential features included polygons tagged as residential land-use or residential building types. Commercial features comprised retail/commercial land-use tags and commercial building classifications. Industrial features incorporated industrial land-use designations and factory/warehouse building types. This classification process helped validate urban land-use data, although commercial classification features revealed a limited coverage in the Dalian context, while industrial features demonstrated a more comprehensive spatial representation.
For each land-use category, three attraction components were constructed: employment attraction through network-based accessibility to employment concentrations using gdistance package (version 1.6.4; Jacob van Etten and Robert J. Hijmans, Bioversity International, Rome, Italy) calculations with road speed classifications; transportation attraction through inverse distance weighting to major road intersections and transit nodes; and population attraction through focal smoothing operations on gridded population data. Land-use-specific combination weights derived from ridge logistic regression (alpha = 0) using the glmnet package (version 4.1.10; Jerome Friedman, Trevor Hastie, and Rob Tibshirani, Stanford University, Stanford, CA, USA), relating observed land-use patterns to the three attraction components, with class balancing to address prevalence disparities. Empirically derived weights were blended with OSM-informed priors to ensure spatial differentiation even for categories with limited training data. The resulting combined attraction surfaces reflected land-use-specific spatial logic while remaining consistent with observed development patterns throughout the study region (Figure 4 and Figure 5).
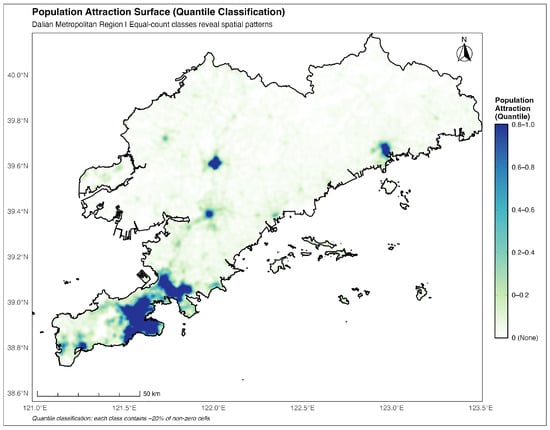
Figure 4.
Polycentric population distribution pattern. Population attraction surface for the Dalian Metropolitan Region using a continuous color scale with quintile classification, which divides non-zero values into five equal-count classes (each containing 20% of cells) to reveal spatial patterns in skewed distributions. This classification method enhances visualization of gradients that would otherwise be compressed by a few high values. The main urban core in the south and a secondary center around Jinzhou (39.6° N) exhibited the highest attraction values.
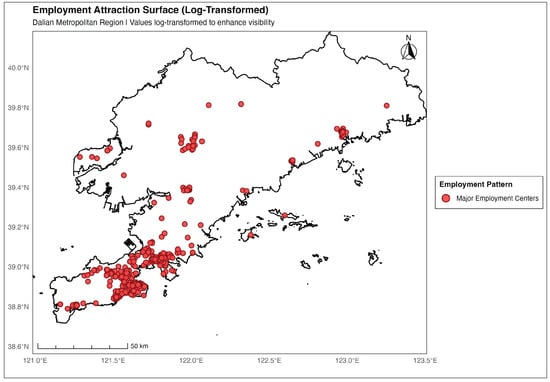
Figure 5.
Concentratedemployment attraction pattern in Dalian. Employment attraction exhibits a highly concentrated point pattern. Red dots indicate major employment centers (manufacturing zones, port facilities, and commercial districts). This reflects Dalian’s economic geography as a port–industrial city, where employment opportunities are clustered at specific locations, with minimal spatial diffusion beyond these centers.
2.5. LEAM Process 2: Probability Surface Generation
The second modeling process created land-use-specific probability surfaces through ridge logistic regression. The process related 2020 baseline land-use patterns to predictor sets encompassing combined attractions from Process 1, terrain characteristics (elevation, slope), and growth suitability constraints. Separate models were fitted for seven simulation categories: urban residential, urban commercial, cropland, forest, grassland, water, and unused land.
Model training employed stratified random sampling with prevalence-based weights to address class imbalance, particularly for urban categories constituting small fractions of the total study area. Ridge regularization (alpha = 0) with cross-validated lambda selection balanced predictive performance against overfitting for sparse urban categories. Predictor standardization ensured comparable coefficient interpretability across variables with different measurement scales.
Model performance evaluation employed an “area under the receiver operating characteristic curve” (AUC) calculated on independent spatially stratified validation samples () using different random seeds from training to ensure independence. Optimal classification thresholds were determined using Youden’s J statistic. Urban residential models achieved excellent discrimination () reflecting clear spatial signatures in population-proximate locations with very high sensitivity (1.000) for detecting residential areas. Urban commercial models similarly achieved excellent performance () despite limited OSM training data and very low spatial prevalence (2.56%), benefiting from strong employment and transportation predictor signals. Cropland models showed good performance () adequate for regional-scale simulation. Forest models achieved excellent discrimination (), reflecting strong remoteness patterns. Grassland models exhibited weaker performance () due to heterogeneous spatial patterns, limited training data, and very low prevalence (0.91%), though sensitivity remained acceptable (0.856). Water and unused land categories demonstrated good discrimination ( and 0.726, respectively) sufficient for simulation purposes.
Probability surface generation for the full spatial domain applied fitted models through raster algebra operations, computing the logistic transformation of the linear predictor for each cell. The linear predictor combined the intercept term with predictor-specific coefficients multiplied by standardized predictor values. This vectorized approach maintained computational efficiency for large spatial domains (43+ million cells) while ensuring numerical stability.
2.6. LEAM Process 3: Demand-Driven Spatial Allocation
The third modeling process allocated projected land-use change through demand-driven competitive allocation matching economic sector growth projections to spatially suitable locations. Economic demand projections derived from input–output analysis linking sectoral employment growth under SSP2-4.5 to spatial land requirements. Sector-to-land-use translation rules mapped employment sectors to compatible spatial categories: residential land accommodated education, healthcare, recreation, and government sectors; commercial land accommodated manufacturing, utilities, construction, wholesale, transportation, and professional services; cropland accommodated agriculture, forestry, and fishing. Employment-to-land conversion factors specified 30 jobs per hectare for residential fabric, 120 jobs per hectare for commercial/industrial uses, and 3 jobs per hectare for cropland, reflecting Chinese urban planning standards and local development patterns. Multiplying employment changes by land-use-specific density factors yielded cell-level demand.
Composite scores for allocation combined probability surfaces from Process 2, growth suitability constraints from flood modeling, and tier classifications defining developable zones. The composite score for each cell equaled the product of probability, growth suitability, and a binary developable mask (1 for Tier 1–2, 0 for Tier 0). This multiplicative formulation ensured that flood constraints and planning prohibitions functionally eliminated cells from consideration regardless of accessibility-driven probability.
Allocation proceeded iteratively through highest-score-wins logic. For each land-use type, the algorithm identified all non-urban cells with positive composite scores, ranked them in descending order, and selected the top N cells matching projected demand. The allocated cells were removed from consideration for other categories, creating competition for high-suitability locations. The process continued until all land-use demands were satisfied or available supply was exhausted, producing spatially explicit maps of 2050 projected land-use under baseline and intervention scenarios.
2.7. Baseline and Intervention Scenario Implementation
The baseline scenarios employed unmodified attraction surfaces, original tier classifications, and flood-constrained growth suitability to establish reference development trajectories. The intervention scenarios modified attraction surfaces by zeroing coastal components within wetland zones and enhancing corridor attractiveness, reclassified wetland zones to Tier 0 (development prohibited), and maintained identical economic demand projections to isolate intervention effects. This experimental design enabled direct attribution of spatial redistribution to landscape interventions rather than altered growth assumptions.
The key parameters governing the coupled workflow are summarized in Table 1.

Table 1.
Summary of key model parameters for the LEAM-based coastal adaptation framework.
3. Results
The integrated LEAM framework generated spatially explicit projections of 2050 urban and agricultural development under SSP2-4.5 climate forcing, quantifying both baseline growth patterns and intervention scenario outcomes across the approximately 13,400 km2 Dalian coastal study area. The probability models achieved adequate performance for spatial allocation (mean AUC = 0.822). The baseline and intervention scenarios were evaluated for demand satisfaction, flood risk exposure, and spatial redistribution. Differential land-use responses emerged: residential and agricultural development accommodated landscape-based constraints with minimal disruption, while commercial allocations declined substantially due to spatial incompatibility between wetland protection and port-dependent location requirements.
3.1. Probability Model Performance and Validation
The ridge logistic regression models demonstrated variable performance across the land-use categories adequate for regional-scale spatial allocation. The urban residential models showed high discriminative ability, with area under the receiver operating characteristic curve (AUC) values of 0.977, reflecting clear spatial signatures in population-proximate locations with perfect sensitivity (1.000) for detecting residential areas in validation samples. The urban commercial models showed high performance () despite limited OSM training data and very low spatial prevalence (2.56%), benefiting from strong employment and transportation predictor signals. The cropland models showed good performance () adequate for regional-scale land-use change simulation, though indicating moderate classification uncertainty characteristic of spatially diffuse agricultural patterns. The forest models showed high discrimination () reflecting strong remoteness patterns. The grassland models exhibited weaker performance () due to heterogeneous spatial patterns, limited training data, and very low prevalence (0.91%), though sensitivity remained acceptable (0.856). The water and unused land categories demonstrated good discrimination ( and 0.726, respectively) sufficient for our simulation purposes (Figure 6; Table 2).
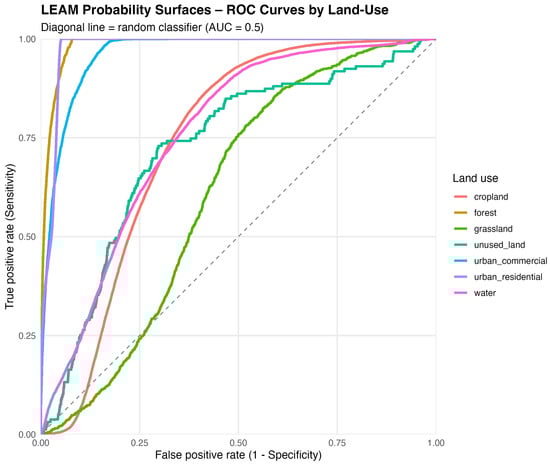
Figure 6.
ROC curves for LEAM probability surfaces across seven land-use categories. Urban residential (), forest (0.984), and urban commercial (0.962) demonstrated excellent discrimination; cropland (0.740), water (0.759), and unused land (0.726) showed good performance; grassland (0.608) exhibited moderate discrimination. Mean AUC = 0.822. The diagonal line indicates random classifier performance.
Table 2.
Ridge logistic regression model performance across seven land-use categories. Validation performed on an independent test set () using a different random seed from training.
The mean AUC across all seven land-use categories equaled 0.822, exceeding the 0.70 threshold for acceptable model performance in land-use change applications. Our model discrimination analysis confirmed strong probability separation between presence and absence locations, with urban residential achieving mean predicted probabilities of 0.44 where present versus 0.06 where absent, forest achieving 0.61 versus 0.14, and urban commercial achieving 0.18 versus 0.02. Cropland exhibited adequate separation (0.42 versus 0.29), consistent with its distributed spatial pattern across homogeneous agricultural plains.
At the optimal classification thresholds determined by Youden’s J statistic, the urban models achieved high sensitivity (residential 1.000, commercial 0.981), indicating their capacity to detect actual development locations. Precision varied from 0.139 to 0.673, due to class imbalance in our validation samples, with rare land-use types (urban commercial prevalence 2.56%) exhibiting lower precision despite high AUC values—an expected outcome reflecting spatial scarcity rather than model failure. These validation metrics confirm that probability surfaces provide adequate spatial suitability inputs for demand-driven allocation in Process 3, with the urban categories demonstrating the excellent performance required for reliable residential and commercial development projection.
3.2. Baseline Scenario Allocation Patterns and Demand Satisfaction
The Process 3 baseline allocation distributed 17,054 cells (1535 hectares) of projected urban and agricultural growth across the study area under SSP2-4.5 mid-century demand projections (Figure 7). Economic input–output analysis translated sectoral employment growth into spatial land requirements, yielding demand for 4567 residential cells (411 hectares), 3687 commercial cells (332 hectares), and 8946 cropland cells (805 hectares). The allocation algorithm achieved 99.2% overall demand satisfaction, with residential satisfaction at 100% (4567 of 4567 cells allocated), commercial at 96.0% (3541 of 3687 cells allocated), and cropland at 100% (8946 of 8946 cells allocated).
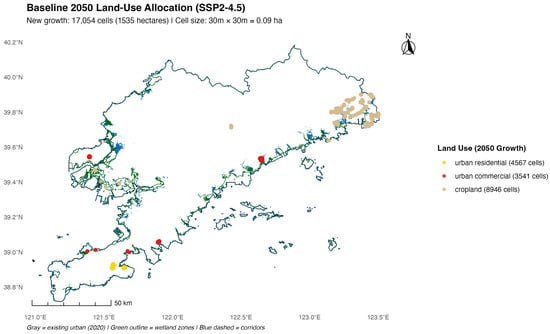
Figure 7.
Baseline scenario allocation pattern (2050 SSP2-4.5). Spatial allocation of projected 2050 urban and agricultural growth under the baseline scenario (no landscape intervention). Total allocation: 17,054 cells (1535 hectares), including 4567 residential cells (411 ha), 3541 commercial cells (319 ha), and 8946 cropland cells (805 ha). Urban development concentrated in existing urban cores with 97.7% of allocations in low-risk zones (GS ) and 2.3% in moderate-risk zones (GS 0.3–0.7). No greenfield expansion occurred, despite abundant peripheral suitable land, reflecting path dependency where probability surfaces favored the established infrastructure and accessibility. Commercial unmet demand = 146 cells (13.1 ha) due to limited coastal suitable sites. Cell size = 30 m × 30 m.
The demand satisfaction patterns revealed asymmetric capacity across the land-use types despite abundant technically suitable land throughout the study area. The residential allocations encountered 157-fold oversupply with 716,813 available cells exhibiting positive composite scores compared to the 4567 cells demanded. The cropland demonstrated 699-fold oversupply with 6,247,240 available cells against 8946 cell demand. The commercial development exhibited only 3541 available cells against 3687 cell demand, producing 146-cell (13.1 hectares) unmet demand due to the spatial concentration of suitable sites near coastal employment centers and transportation nodes.
The allocated cells exhibited mean composite suitability scores of 0.849 for residential, 0.403 for commercial, and 0.581 for cropland development. The lower commercial composite scores reflected commercial development’s more complex locational requirements where employment accessibility, transportation connectivity, and infrastructure availability must align simultaneously, producing fewer high-suitability locations despite extensive areas with moderate individual predictor values (Table 3).
Table 3.
Spatial allocation outcomes for projected 2050 urban and agricultural development under baseline conditions (no landscape intervention). Demand derived from SSP2-4.5 sectoral employment projections.
Flood risk exposure in the baseline allocations remained minimal under the mid-century SSP2-4.5 projections, with 7923 cells (97.7%) of the total urban allocations occurring in the low-risk zones (growth suitability ). The moderate-risk zones (growth suitability 0.3–0.7) received 185 cells (2.3% of urban allocations, 16.7 hectares), while the high-risk zones (growth suitability ) received zero allocations.
The spatial distribution patterns demonstrated strong path dependency, with 100% of allocations occurring within or immediately adjacent to existing urban development footprints. No greenfield development occurred, despite the availability of Tier 2 (urbanizable) land with high growth suitability in the peripheral zones. Probability surfaces derived from accessibility metrics and existing land-use patterns produced composite scores systematically favoring locations with established infrastructure, employment concentrations, and transportation connectivity, resulting in compact infill patterns that maintained the existing urban form while avoiding spatial expansion into technically suitable but less accessible areas.
3.3. Landscape Intervention Scenario Outcomes
Implementation of landscape intervention constraints through modified attraction surfaces and tier-based growth restrictions produced notable spatial redistribution that varied systematically by land-use category. The protective wetland zones (810 km2) received zero urban development in the intervention scenario, achieving 100% exclusion effectiveness for the designated coastal restoration areas. The blue–green corridor zones (8 km2) experienced 80% reduction in development pressure compared to the baseline patterns, with allocations limited to compatible cropland uses consistent with corridor design objectives emphasizing permeable surfaces and stormwater management functions (Figure 8; Table 4).
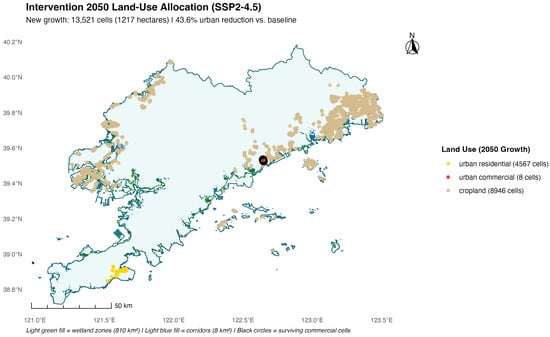
Figure 8.
Intervention scenario allocation pattern (2050 SSP2-4.5). Spatial allocation under the intervention scenario implementing protective wetland zones (810 km2) and blue–green corridors (8 km2). Total allocation: 13,521 cells (1217 hectares), including 4567 residential cells (411 ha, unchanged from baseline), 8 commercial cells (0.7 ha, 99.8% reduction), and 8946 cropland cells (805 ha, spatially redistributed). Black circles indicate the few surviving commercial cells that remained viable despite intervention constraints. The intervention achieved 100% elimination of moderate-risk urban allocations through combined tier reclassification (Tier 0 prohibition in wetland zones) and attraction surface modification (zeroed coastal attractions, enhanced corridor connectivity). Residential development was successfully redirected to alternative inland locations with comparable accessibility (mean composite score 0.850 vs. 0.849 baseline). Commercial development collapse reflected the spatial incompatibility between the wetland protection zones and the port-dependent industrial location requirements. Cell size = 30 m × 30 m.
Table 4.
Landscape intervention design specifications. Design specifications for landscape interventions, including spatial extent, implementation mechanisms, and functional objectives for coastal adaptation in Dalian.
Residential Development. The residential allocations were successfully redistributed away from the intervention zones, with all 4567 demanded cells allocated to alternative locations exhibiting comparable accessibility characteristics. The available residential capacity in the intervention scenario reached 340,666 cells (30,660 hectares), representing the removal of 52.5% of the baseline residential supply while maintaining a 75-fold oversupply relative to demand. The mean composite suitability scores for the allocated residential cells remained virtually unchanged at 0.850 in the intervention scenario compared to 0.849 in the baseline.
Cropland. The cropland allocations achieved full demand satisfaction in the intervention scenario, with all 8946 required cells allocated despite corridor zone constraints. The available cropland capacity reached 6,625,429 cells (596,289 hectares), representing a 741-fold oversupply and demonstrating that the corridor zone restrictions removed only modest fractions of the baseline cropland supply while maintaining massive surplus capacity. The mean composite scores for the allocated cropland cells declined from 0.581 in the baseline to 0.357 in the intervention scenario, representing a 38.6% reduction reflecting spatial redistribution to slightly less optimal but still adequate agricultural areas. The intervention scenario prevented approximately 200 hectares of cropland expansion within the blue–green corridor zones, redistributing this development to peripheral agricultural areas with equivalent soil quality and water access characteristics.
Commercial Development. The commercial development allocations declined dramatically from 3541 cells (319 hectares) in the baseline to 8 cells (0.7 hectares) in the intervention scenario, representing a 99.8% reduction in allocated commercial development. The available commercial capacity declined from 3541 cells in the baseline to 8 cells in the intervention scenario, producing a 3679-cell shortfall (331 hectares) between commercial demand (3687 cells) and available supply. This outcome reflected commercial development’s strong coastal clustering tendency, where employment concentrations, port access, and transportation infrastructure concentrate in precisely those coastal areas designated for wetland protection. All eight allocated commercial cells in the intervention scenario occurred in inland locations outside the designated wetland and corridor protection zones, representing residual suitable sites with adequate employment accessibility but lacking optimal coastal proximity. The intervention design effectively precluded commercial development through the combined effects of zeroed coastal attraction surfaces and Tier 0 reclassification of wetland zones, revealing implementation feasibility constraints when landscape interventions conflicted with established economic geography patterns requiring coastal access (Table 5). Overall demand satisfaction declined from 99.2% (baseline) to 78.6% (intervention), reflecting the trade-off between coastal protection and commercial development accommodation.
Table 5.
Spatial allocation outcomes under landscape intervention constraints implementing the protective wetland zones (810 km2, Tier 0) and the blue–green corridors (8 km2, Tier 1). The demand projections were identical to the baseline.
The commercial allocation outcome reflects a structural constraint rather than model failure. Commercial activities in port cities tend to concentrate near waterfront infrastructure, due to operational requirements. The model captures this pattern through accessibility predictors. In intervention scenarios, these coastal locations become unavailable. However, the model cannot generate functionally equivalent alternatives. Port-dependent commercial uses may not be able to relocate inland without losing their operational rationale. Residential and cropland allocations are not location-constrained in this manner. These land-uses achieved full demand satisfaction under identical intervention conditions. This outcome suggests that the allocation mechanism functions appropriately for land-uses with spatial flexibility.
3.4. Comparative Analysis of Baseline and Intervention Scenarios
A systematic comparison quantified the differential effectiveness across the land-use categories. The total urban development declined from 8108 cells (730 hectares) to 4575 cells (412 hectares), a 43.6% reduction derived entirely from the commercial allocation collapse, as the residential allocations totaled 4567 cells in both scenarios. The cropland maintained identical cell counts despite corridor-induced spatial redistribution (Figure 9; Table 6).
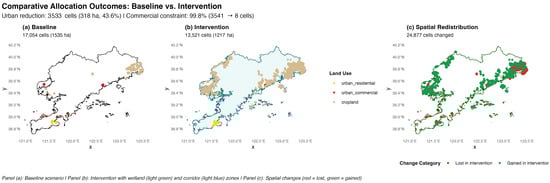
Figure 9.
Comparative allocation outcomes (baseline vs. intervention). Side-by-side comparison of spatial allocation patterns under baseline (a) and intervention (b) scenarios, with spatial redistribution shown in (c). The baseline allocated 8108 urban cells (730 ha) with 185 cells (16.7 ha) in moderate-risk zones. The intervention reduced the total urban allocation to 4575 cells (412 ha) while eliminating all moderate-risk development (100% protection effectiveness). The spatial redistribution varied by land-use: residential maintained an identical allocation quantity (4567 cells) through inland relocation; cropland redistributed from corridor zones to peripheral agricultural areas; and commercial development collapsed from 3541 to 8 cells, due to coastal protection constraints. Panel (a): Baseline scenario showing 17,054 cells (1535 ha). Panel (b): Intervention scenario with wetland (light green) and corridor (light blue) zones, showing 13,521 cells (1217 ha). Panel (c): Spatial changes showing 24,877 cells changed (red = lost in intervention, green = gained in intervention). Yellow = residential; red = commercial; light yellow = cropland. Study area boundary shown in black.
Table 6.
Quantitative comparison of allocation outcomes between baseline and intervention scenarios, showing changes in total urban development, land-use-specific allocations, flood risk exposure, and mean composite suitability scores.
The urban allocations in the moderate flood risk zones declined from 185 cells (16.7 hectares) in the baseline to zero in the intervention scenario, achieving 100% elimination of moderate-risk development. No allocations occurred in the high-risk zones in either scenario, indicating that the baseline constraints had already prevented highly vulnerable coastal development. All residential and cropland allocations in both scenarios occurred within the existing transportation network buffers, maintaining accessibility despite intervention-induced shifts. This differential response demonstrates that landscape-based coastal adaptation effectively redirects flexible residential and agricultural uses but encounters significant constraints with coastal-dependent commercial activities absent complementary policy measures (Table 7).
Table 7.
Distribution of urban allocations across flood risk zones defined by growth suitability thresholds derived from projected flood depths under SSP2-4.5 mid-century sea-level rise.
4. Discussion
This study demonstrates that coupled LEAM–flood modeling can translate climate projections into spatially explicit landscape interventions that measurably redirect urban development away from coastal flood risk. Our results could help operationalize protective wetland restoration (810 km2) and blue–green corridor (8 km2) typologies, producing quantifiable spatial outcomes evaluated against explicit performance criteria—residential demand satisfaction, commercial feasibility, and flood exposure reduction. This approach delivers what territorial spatial planning demands: mappable intervention zones with quantified effectiveness metrics and identified implementation constraints.
4.1. Differential Land-Use Responses and Implementation Feasibility
The results reveal a spatial flexibility gradient. Residential and agricultural uses accommodate landscape-based constraints, while commercial development proves highly sensitive to coastal protection measures. This mismatch exposes a key limitation of landscape-only adaptation strategies that effectively redirect flexible land-uses but cannot resolve the locational requirements of coastal-dependent economies. Commercial constraints also carry social implications, as reduced development capacity near employment centers may limit job accessibility for nearby residents.
The differential sensitivity of land-use types to intervention constraints observed here aligns with findings from broader coastal adaptation scholarship. Wu et al. [35] reported that wetland protection reduced newly added urban flood exposure by approximately 17% under the 1000-year flood scenario in China’s coastal zones, though their analysis aggregated land-uses rather than distinguishing residential from commercial functions. Sanchez et al. [36] demonstrated that spatially interactive land change models accounting for human migration reduced projected flood exposure by 5–24%, supporting the feasibility of development redirection through spatial constraints. Our finding that commercial allocations declined by 99.8% (from 319 to 0.7 hectares) while residential allocations remained unchanged (411 hectares in both scenarios) reveals a land-use-specific sensitivity that aggregated urban exposure metrics would obscure. The near-complete commercial allocation collapse under intervention scenarios contrasts with studies in deltaic settings such as Sun et al. [37], who reported that Shanghai’s eco-constraint scenario continued to accommodate aggregated urban growth while reducing flood exposure.
The divergent outcomes across land-use types—successful residential redirection versus commercial allocation collapse—reflected differential sensitivity to intervention constraints rather than model unreliability. Commercial location behavior in port cities is constrained by infrastructure dependencies that residential development does not face. This finding reveals the limits of landscape-based adaptation for port-dependent economies. Strict coastal protection appears feasible for residential development but creates significant spatial conflicts for port-linked commercial functions.
Addressing this tension may require hybrid strategies that extend beyond the current framework’s scope. Such strategies could combine landscape protection with port infrastructure adaptation, commercial function disaggregation, or compensatory inland commercial intensification.
Exploratory interviews with Dalian planners corroborated this tension, with respondents noting that implementation feasibility depends on alignment with existing funding mechanisms (e.g., Sponge City initiatives) and demonstration of co-benefits beyond flood mitigation alone.
For implementation, this gradient implies that adaptation portfolios must be differentiated by land-use type. Wetlands and corridors can redirect residential and agricultural uses away from risk, while commercial and industrial activities require hybrid solutions: engineered protection for critical nodes, elevated or flood-resilient development forms, and targeted inland infrastructure investment to create viable alternatives. The framework thus generates design and policy guidance by identifying which activities can be shifted through landscape interventions alone and where complementary economic and infrastructural strategies are necessary.
The 99.8% decline in commercial allocation in intervention scenarios quantifies a tension between coastal protection and port-dependent economic functions. Dalian is a major international port. Its commercial infrastructure—container terminals, warehousing, logistics facilities, and associated services—is physically and operationally tied to the waterfront. The near-complete elimination of commercial allocation should be interpreted as a diagnostic indicator of spatial conflict rather than a feasible planning outcome.
Realistic implementation would likely require hybrid approaches not tested here. These may include elevated commercial platforms, hardened critical infrastructure, phased relocation of non-essential functions, or managed intensification at inland nodes. The modeling results identified approximately 320 hectares of unaccommodated commercial demand. This figure indicates the scale of compensatory capacity that may be needed for viable adaptation.
Decision-makers would need to distinguish genuinely port-dependent functions from those amenable to relocation. They would also need to identify infrastructure investments that enable continued port operations within a more constrained coastal footprint.
4.2. From Coincidental Safety to Strategic Adaptation Timing
Our baseline simulations reveal that Dalian’s projected 2050 developments are already predominantly located in low-risk zones, not due to explicit adaptation policy but because of coincidental topography and historical urbanization patterns. The existing urban core occupies relatively elevated terrain that remains above projected inundation levels, and the LEAM’s accessibility-based logic reinforces this pattern through infill and near-core expansion.
However, this coincidental safety is fragile—as infill opportunities diminish, expansion edges press into moderate-risk coastal lands. The intervention scenario demonstrates how landscape-based constraints convert coincidental safety into intentional strategy by codifying wetland restoration and corridors as binding spatial rules. For coastal cities currently appearing safe under SSP2-4.5 projections, this finding identifies a time-limited window. Once speculative coastal development becomes entrenched, similar interventions face much higher political and economic resistance. Our framework was able to diagnose this path dependency and support early-stage intervention design before future exposure becomes locked in.
4.3. From Modeling Outputs to Design Specifications
The modeling outputs translate into actionable design specifications through three operational pathways. First, wetland intervention zones (Tier 0 exclusion areas totaling 810 km2) delineate boundaries where detailed wetland restoration design can proceed; flood depth rasters provide grading requirements and hydrological targets, while existing vegetation mapping informs species selection for tidal wetland establishment. Second, corridor zones (Tier 1 restricted areas spanning 8 km2) identify linear design opportunities where stormwater management infrastructure, recreational greenways, and ecological connectivity features can be co-designed within growth-restricted buffers; the corridor boundaries and connectivity analysis specify alignment and width parameters for detailed landscape design. Third, spatial redistribution analysis identifies receiving areas for redirected development, informing infrastructure planning, open space allocation, and site design for new development nodes; accessibility metrics guide service provision requirements to maintain quality of life in redirected growth areas. These outputs provide the spatial parameters that landscape architects require to advance from regional strategy to site-scale implementation—defining where to intervene, what hydrological and ecological performance targets to achieve, and how redirected development patterns reshape infrastructure and amenity requirements. The framework thus occupies an intermediate position between climate-hazard modeling and detailed design development, generating the evidence base and spatial specifications that enable design teams to proceed with implementation-ready proposals.
4.4. Methodological Contributions and Framework Transferability
Beyond the Dalian case, this work offers methodological contributions relevant to coastal regions seeking to connect climate models with implementable design and adaptation strategies. The framework’s modular architecture—evidence synthesis, typology derivation, spatial rule encoding, simulation, and comparative evaluation—enables transferability across contexts. Other coastal cities can substitute region-specific land-use models, climate projections, flood scenarios, and intervention typologies while maintaining the same analytical logic, allowing systematic testing of landscape-based adaptation strategies within diverse planning and institutional contexts.
Methodologically, this framework extends the growing body of coupled land-use and flood modeling applications. Alam [38] integrated space syntax analysis with bathtub flood modeling to assess accessibility impacts of sea-level rise in Copenhagen, demonstrating how static inundation models can inform urban planning decisions when coupled with spatial accessibility metrics. Our approach similarly employs a connected-bathtub flood representation but extends the coupling by translating hazard surfaces into development suitability constraints within an accessibility-driven land-use allocation model. Unlike Sun et al. [37], who coupled FLUS with LISFLOOD-FP for hydrodynamic assessment, our framework enables direct comparison between scenario outcomes rather than post hoc exposure assessment. This design improves scenario comparability but does not replace event-based hydrodynamic simulation where flow routing dynamics are required. The continuous penalty function approach employed here—assigning growth suitability values below 0.3 to high-risk zones, 0.3–0.7 to moderate-risk zones, and above 0.7 to low-risk zones based on projected flood depths—contrasts with the binary exclusion zones commonly used in prior studies. Zwirglmaier et al. [39] show that a common linking method is to overlay projected urban growth maps with existing flood maps, indicating that flood hazard is often treated as a static spatial layer rather than being embedded as a dynamic component of the allocation process.
Three specific innovations warrant attention: (1) deriving intervention typologies from implemented projects grounds modeled strategies in real-world practice; (2) the protocol for translating qualitative landscape designs into quantitative model inputs—encoding interventions as tiered constraints and attraction surface modifications—bridges design practice with modeling; and (3) holding sectoral demand constant while modifying only spatial suitability provides a clear experimental design where allocation differences can be attributed directly to interventions.
The framework’s capacity to distinguish between exposure reduction (redirecting development) and hazard attenuation (modifying hydrology) supports clearer communication about what landscape strategies can accomplish. Wetlands may function as complementary measures for routine events rather than substitutes for engineered defenses under extreme compound scenarios.
Beyond the Dalian application, framework transferability derives from generalizable workflow components rather than empirical replication of place-specific outcomes. These components include flood-penalty integration procedures, intervention-as-constraint translation logic, and standardized comparative evaluation metrics. Application of this framework across diverse geomorphological contexts represents a priority direction for future research. Testing in deltaic and barrier-coast configurations would help establish broader empirical generalizability.
4.5. Policy Implications and Limitations
Our findings are consistent with territorial spatial planning efforts in China and similar coastal governance contexts. Wetland and corridor zones align conceptually with ecological protection redlines and can be justified not only on ecological grounds but also as explicit flood adaptation instruments. The modeling evidence that residential and agricultural growth can be accommodated within safer inland zones supports strong protection of coastal wetlands without undermining overall development targets—a key political threshold. Future applications should examine whether redirected development disproportionately affects lower-income populations who may have fewer housing alternatives.
The significant constraints on commercial development, however, point to necessary policy modifications. Inland industrial parks, relocation incentives, or exception zones with elevated infrastructure are needed to accommodate new and existing commercial developments. The framework provides planning agencies with a decision-support tool that maps where interventions might be most effective and where additional measures may be required.
Residential development redirection to interior upland areas incurs modest aggregate accessibility penalties (a 4.8% increase in mean distance to CBD) but raises equity questions warranting consideration. While system-wide accessibility metrics remain favorable, spatial redistribution may affect housing affordability differently across income groups, particularly if redirected development concentrates in areas with higher land costs or reduced service provision. Lower-income households, which often face constrained location choices, may experience disproportionate accessibility burdens if affordable housing options concentrate in less accessible locations. Additionally, existing communities in flood-vulnerable coastal areas—who may already face elevated environmental burdens—could experience different exposure trajectories than residents in new development. These distributional concerns cannot be quantified with available data but represent important considerations for equitable implementation.
The framework’s design-oriented origin introduces potential bias toward landscape-based interventions. Because the workflow translates typologies derived from implemented landscape projects into spatial constraints, it necessarily privileges adaptation options that can be spatially encoded while under-representing approaches that are difficult to represent in land-allocation space (e.g., insurance, early-warning systems, or behavioral interventions). In addition, the accessibility-driven allocation logic emphasizes market-access processes and may under-represent non-market determinants of location choice, including cultural attachment, informal economies, and community networks that shape relocation feasibility.
We position the framework as a landscape intervention effectiveness testing tool, not a comprehensive adaptation assessment platform, and we interpret results within this scope. These limitations reflect scope-related representational bias rather than numerical uncertainty in the allocation outputs. Comprehensive adaptation planning would require complementary approaches (e.g., cost–benefit analysis, social vulnerability mapping, institutional feasibility assessment, and evaluation of non-spatial interventions) to address governance, equity, and behavioral dimensions beyond spatial allocation.
Several limitations shaped our interpretation of our simulation results. First, our reliance on a single mid-century climate scenario. A range of scenarios is needed to manage policy levers effectively. Second, we used simplified accessibility representations and incomplete considerations of potential social equity dimensions. These need analysis and evaluation. Third, commercial allocations were uncertain in our modeling exercise, due to limited business location behavior data to train our models.
This study employed a single climate scenario (SSP2-4.5) and did not quantify uncertainty across alternative emission pathways. While SSP2-4.5 provides a policy-relevant reference condition, intervention effectiveness may differ under lower-emission (SSP1-2.6) or higher-emission (SSP5-8.5) trajectories producing different inundation extents and depths. Future work should conduct scenario ensemble analysis and sensitivity testing on key parameters—including flood depth thresholds, suitability penalty functions, and tier classification boundaries—to evaluate robustness across plausible climate futures.
Commercial land allocation carries considerable uncertainty due to data constraints. Our model employs accessibility-based predictors as proxies for commercial location preferences. It does not incorporate firm location choice models, port-economic linkage data, or sectoral disaggregation of commercial subtypes. The commercial probability surfaces achieved strong discriminatory performance (AUC = 0.962). However, this result reflected correlation between commercial locations and accessibility predictors rather than direct modeling of firm location choice behavior. Training data derived from OpenStreetMap capture observed spatial patterns but do not incorporate establishment-level decision factors. These factors include port throughput dependencies, supply chain linkages, and sector-specific locational requirements. The substantial reduction in commercial allocation under intervention scenarios should, therefore, be interpreted as a diagnostic indicator rather than a predictive forecast. It reveals the spatial extent of conflict between strict coastal protection and port-dependent requirements. Future refinements could integrate establishment-level location choice models or scenario-based assumptions regarding commercial decentralization potential.
Social equity dimensions remain insufficiently integrated due to data constraints. Spatially explicit socioeconomic data—including income distributions, poverty indicators, and housing affordability metrics—are not publicly available at resolutions compatible with 30 m land-use modeling in Chinese urban contexts. Consequently, this study could not quantitatively assess whether intervention-driven development redirection disproportionately affects lower-income populations. Future research should prioritize integration of neighborhood-scale socioeconomic data to enable distributional impact analysis.
Historical validation was limited to probability surface performance metrics rather than hindcast simulation of observed land-use change. Compatible multi-temporal land-use datasets at 30 m resolution were unavailable for the Dalian region. Future work will conduct hindcast validation using standard land-change metrics (quantity versus allocation disagreement; Figure of Merit) when historical datasets become available.
Validation focused on probability surface performance rather than full historical hindcast simulation. The AUC metrics assessed the model’s capacity to discriminate between converted and unconverted locations, indicating that probability surfaces captured meaningful spatial development patterns. A complete hindcast—simulating land-use change over a historical period and comparing simulated versus observed outcomes—was not conducted because historical land-use layers matching the study’s resolution and classification scheme were unavailable. This paper’s contribution lies in translating evidence-based intervention typologies into operational spatial rules within a land-use modeling workflow, rather than in advancing land-use model calibration methods.
The connected-bathtub flood model is a static inundation representation that does not capture wave run-up, storm surge dynamics, or process-based attenuation by landscape features. The reported intervention effectiveness reflects development avoidance through spatial allocation constraints (tier reclassification, attraction surface modification), not physical flood reduction. Wetlands in this framework operate as Tier 0 exclusion zones preventing development allocation rather than as features attenuating wave energy or reducing flood depths. Coupling the allocation framework with dynamic hydrodynamic modeling (e.g., ADCIRC, MIKE21, SWAN) would enable evaluation of both avoidance effectiveness and physical mitigation benefits.
4.6. Theoretical Contributions
This study advances three theoretical contributions to coastal adaptation and land-use planning scholarship.
First, the framework demonstrates that evidence-based landscape intervention typologies can be operationalized as quantitative constraints within urban growth simulation. These typologies derive from systematic synthesis of implemented projects. This approach bridges two literatures that have developed largely in parallel: design-focused documentation of coastal adaptation precedents and modeling-focused simulation of urban land-use change. By translating intervention typologies into tier reclassifications, attraction surface modifications, and allocation constraints, the framework embeds design knowledge within planning support systems. This addresses the “science–practice gap” identified in the coastal adaptation literature.
Second, the framework extends accessibility-driven urban growth models to incorporate climate hazard constraints as continuous penalty surfaces rather than binary exclusion zones. Conventional approaches often treat flood risk as a static “no-build” constraint that removes hazardous areas entirely. The growth suitability integration employed here allows graduated responses: development remains possible in moderate-risk areas but faces reduced probability. This approach may better reflect how markets and planners negotiate hazard exposure. The continuous representation also enables analysis of intervention scenarios that shift development suitability gradients rather than simply expanding prohibited areas.
Third, the comparative scenario methodology provides a template for quantifying intervention trade-offs across multiple dimensions. The framework measures flood exposure reduction alongside accessibility penalties, development capacity constraints, and land-use-specific allocation outcomes. This moves landscape intervention evaluation from single-objective assessment toward multi-criteria analysis. The finding that residential and commercial land-uses exhibit markedly different responses to identical interventions illustrates this approach’s value. It reveals trade-off structures that single-metric evaluation would obscure, supporting decision-making that balances environmental protection, economic function, and social accessibility.
5. Conclusions
This research demonstrates the value of a closely coupled spatial modeling framework. The framework represented here suggests that operationalizing protective wetland restoration and blue–green corridor typologies can measurably redirect development away from flood-prone zones while accommodating growth pressures and mitigating the effects of sea-level rise.
Our Dalian case reveals differential land-use responses that shape implementation feasibility. Residential development was successfully redirected with maintained demand satisfaction, while commercial allocations declined sharply due to tensions between coastal protection and port-dependent economic geography. These results clarify where landscape interventions are most effective, where they encounter barriers, and where complementary measures are necessary.
This work advances the capacity to translate climate science into actionable landscape architectural practice for coastal adaptation. It describes a transferable, modular methodology for testing landscape interventions within a coupled climate–land-use model. The framework enables other coastal cities to substitute their own baseline models and context-specific interventions while maintaining methodological consistency. It provides spatial planners a decision-support methodology that can quantify intervention effectiveness, highlighting trade-offs across land-uses and the institutional realities of implementation.
Future work could extend the framework through multi-temporal implementation, multi-objective optimization incorporating equity considerations, agent-based modeling of developer responses, and cross-city comparison to clarify boundary conditions for landscape-based adaptation strategies.
Author Contributions
Conceptualization: B.D. and B.P.; methodology: B.D. and B.P.; software: B.P.; validation: B.P.; formal analysis: B.P.; investigation: B.P.; resources: B.P.; data curation: B.P.; writing—original draft preparation: B.P.; writing—review and editing: B.D. and B.P.; visualization: B.P.; supervision: B.D.; project administration: B.D.; funding acquisition: B.D. All authors have read and agreed to the published version of the manuscript.
Funding
This research received no external funding.
Institutional Review Board Statement
Not applicable.
Informed Consent Statement
Not applicable.
Data Availability Statement
The data presented in this study are available upon request from the corresponding author.
Conflicts of Interest
The authors declare no conflicts of interest.
References
- Hallegatte, S.; Green, C.; Nicholls, R.J.; Corfee-Morlot, J. Future flood losses in major coastal cities. Nat. Clim. Change 2013, 3, 802–806. [Google Scholar] [CrossRef]
- Kulp, S.A.; Strauss, B.H. New elevation data triple estimates of global vulnerability to sea-level rise and coastal flooding. Nat. Commun. 2019, 10, 4844. [Google Scholar] [CrossRef]
- Oppenheimer, M.; Glavovic, B.; Hinkel, J.; Van de Wal, R.; Magnan, A.K.; Abd-Elgawad, A.; Cai, R.; Cifuentes-Jara, M.; Deconto, R.M.; Ghosh, T.; et al. Sea Level Rise and Implications for Low Lying Islands, Coasts and Communities; IPCC: Geneva, Switzerland, 2019. [Google Scholar]
- Nicholls, R.J. Impacts of and responses to sea-level rise. Underst.-Sea-Level Rise Var. 2010, 24, 17–51. [Google Scholar]
- Pang, B.; Deal, B. Bridging Design and Climate Realities: A Meta-Synthesis of Coastal Landscape Interventions and Climate Integration. Land 2025, 14, 1709. [Google Scholar] [CrossRef]
- Glavovic, B.; Dawson, R.; Chow, W.T.; Garschagen, M.; Singh, C.; Thomas, A. Cities and Settlements by the Sea; Cambridge University Press: Cambridge, UK, 2022. [Google Scholar]
- Cano Pecharroman, L.; Hahn, C. Exposing disparities in flood adaptation for equitable future interventions in the USA. Nat. Commun. 2024, 15, 8333. [Google Scholar] [CrossRef] [PubMed]
- Gedan, K.B.; Kirwan, M.L.; Wolanski, E.; Barbier, E.B.; Silliman, B.R. The present and future role of coastal wetland vegetation in protecting shorelines: Answering recent challenges to the paradigm. Clim. Change 2011, 106, 7–29. [Google Scholar] [CrossRef]
- Sutton-Grier, A.E.; Wowk, K.; Bamford, H. Future of our coasts: The potential for natural and hybrid infrastructure to enhance the resilience of our coastal communities, economies and ecosystems. Environ. Sci. Policy 2015, 51, 137–148. [Google Scholar] [CrossRef]
- Ahern, J. Urban landscape sustainability and resilience: The promise and challenges of integrating ecology with urban planning and design. Landsc. Ecol. 2013, 28, 1203–1212. [Google Scholar] [CrossRef]
- Temmerman, S.; Meire, P.; Bouma, T.J.; Herman, P.M.; Ysebaert, T.; De Vriend, H.J. Ecosystem-based coastal defence in the face of global change. Nature 2013, 504, 79–83. [Google Scholar] [CrossRef]
- Frantzeskaki, N.; McPhearson, T.; Collier, M.J.; Kendal, D.; Bulkeley, H.; Dumitru, A.; Walsh, C.; Noble, K.; Van Wyk, E.; Ordóñez, C.; et al. Nature-based solutions for urban climate change adaptation: Linking science, policy, and practice communities for evidence-based decision-making. BioScience 2019, 69, 455–466. [Google Scholar] [CrossRef]
- McPhearson, T.; Andersson, E.; Elmqvist, T.; Frantzeskaki, N. Resilience of and through urban ecosystem services. Ecosyst. Serv. 2015, 12, 152–156. [Google Scholar] [CrossRef]
- Möller, I.; Kudella, M.; Rupprecht, F.; Spencer, T.; Paul, M.; Van Wesenbeeck, B.K.; Wolters, G.; Jensen, K.; Bouma, T.J.; Miranda-Lange, M.; et al. Wave attenuation over coastal salt marshes under storm surge conditions. Nat. Geosci. 2014, 7, 727–731. [Google Scholar] [CrossRef]
- Kirwan, M.L.; Megonigal, J.P. Tidal wetland stability in the face of human impacts and sea-level rise. Nature 2013, 504, 53–60. [Google Scholar] [CrossRef]
- Spalding, M.D.; Ruffo, S.; Lacambra, C.; Meliane, I.; Hale, L.Z.; Shepard, C.C.; Beck, M.W. The role of ecosystems in coastal protection: Adapting to climate change and coastal hazards. Ocean Coast. Manag. 2014, 90, 50–57. [Google Scholar] [CrossRef]
- Reguero, B.G.; Beck, M.W.; Bresch, D.N.; Calil, J.; Meliane, I. Comparing the cost effectiveness of nature-based and coastal adaptation: A case study from the Gulf Coast of the United States. PLoS ONE 2018, 13, e0192132. [Google Scholar] [CrossRef]
- Narayan, S.; Beck, M.W.; Reguero, B.G.; Losada, I.J.; Van Wesenbeeck, B.; Pontee, N.; Sanchirico, J.N.; Ingram, J.C.; Lange, G.M.; Burks-Copes, K.A. The effectiveness, costs and coastal protection benefits of natural and nature-based defences. PLoS ONE 2016, 11, e0154735. [Google Scholar] [CrossRef]
- Beck, M.W.; Losada, I.J.; Menéndez, P.; Reguero, B.G.; Díaz-Simal, P.; Fernández, F. The global flood protection savings provided by coral reefs. Nat. Commun. 2018, 9, 2186. [Google Scholar] [CrossRef] [PubMed]
- Narayan, S.; Beck, M.W.; Wilson, P.; Thomas, C.J.; Guerrero, A.; Shepard, C.C.; Reguero, B.G.; Franco, G.; Ingram, J.C.; Trespalacios, D. The value of coastal wetlands for flood damage reduction in the northeastern USA. Sci. Rep. 2017, 7, 9463. [Google Scholar] [CrossRef] [PubMed]
- Kabisch, N.; Korn, H.; Stadler, J.; Bonn, A. Nature-Based Solutions to Climate Change Adaptation in Urban Areas: Linkages Between Science, Policy and Practice; Springer Nature: Cham, Switzerland, 2017. [Google Scholar]
- Hobbie, S.E.; Grimm, N.B. Nature-based approaches to managing climate change impacts in cities. Philos. Trans. R. Soc. B 2020, 375, 20190124. [Google Scholar] [CrossRef]
- Nassauer, J.I.; Opdam, P. Design in science: Extending the landscape ecology paradigm. Landsc. Ecol. 2008, 23, 633–644. [Google Scholar] [CrossRef]
- Kirchhoff, C.J.; Carmen Lemos, M.; Dessai, S. Actionable knowledge for environmental decision making: Broadening the usability of climate science. Annu. Rev. Environ. Resour. 2013, 38, 393–414. [Google Scholar] [CrossRef]
- Wyborn, C.; Datta, A.; Montana, J.; Ryan, M.; Leith, P.; Chaffin, B.; Miller, C.; Van Kerkhoff, L. Co-producing sustainability: Reordering the governance of science, policy, and practice. Annu. Rev. Environ. Resour. 2019, 44, 319–346. [Google Scholar] [CrossRef]
- Vousdoukas, M.I.; Bouziotas, D.; Giardino, A.; Bouwer, L.M.; Mentaschi, L.; Voukouvalas, E.; Feyen, L. Understanding epistemic uncertainty in large-scale coastal flood risk assessment for present and future climates. Nat. Hazards Earth Syst. Sci. 2018, 18, 2127–2142. [Google Scholar] [CrossRef]
- Kim, Y.; Newman, G. Advancing scenario planning through integrating urban growth prediction with future flood risk models. Comput. Environ. Urban Syst. 2020, 82, 101498. [Google Scholar] [CrossRef]
- Hinkel, J.; Lincke, D.; Vafeidis, A.T.; Perrette, M.; Nicholls, R.J.; Tol, R.S.; Marzeion, B.; Fettweis, X.; Ionescu, C.; Levermann, A. Coastal flood damage and adaptation costs under 21st century sea-level rise. Proc. Natl. Acad. Sci. USA 2014, 111, 3292–3297. [Google Scholar] [CrossRef]
- Pang, B.; Deal, B. A Review on the Use of Geodesign Processes in Managing Flood Vulnerability. Land 2024, 13, 723. [Google Scholar] [CrossRef]
- Deal, B.; Schunk, D. Spatial dynamic modeling and urban land use transformation: A simulation approach to assessing the costs of urban sprawl. Ecol. Econ. 2004, 51, 79–95. [Google Scholar] [CrossRef]
- Tang, L.; Yang, Y.; Wang, D.; Wei, Q. Optimizing county-level land-use structure method: Case study of W county, China. Int. J. Environ. Res. Public Health 2022, 19, 5281. [Google Scholar] [CrossRef]
- Qianwen, C.; Penghui, J.; Lingyan, C.; Jinxia, S.; Yunqian, Z.; Liyan, W.; Manchun, L.; Feixue, L.; Axing, Z.; Dong, C. Delineation of a permanent basic farmland protection area around a city centre: Case study of Changzhou City, China. Land Use Policy 2017, 60, 73–89. [Google Scholar] [CrossRef]
- Xin, S.; Qian, H. From Urban Planning to Territorial Spatial Planning: The Evolution of China’s Planning System and the Persistent Barriers to Urban–Rural Integration. Land 2025, 14, 1520. [Google Scholar] [CrossRef]
- Liu, J.; Zhou, J.; He, Q. Impact of China’s Permanent Basic Farmland Protection Redline and Ecological Protection Redline on Water Conservation in the Loess Gully Region. Land 2024, 13, 1424. [Google Scholar] [CrossRef]
- Wu, Y.; Li, J.; Wu, H.; Duan, Y.; Shen, H.; Du, S. Sustainable urban planning to control flood exposure in the coastal zones of China. Landsc. Ecol. 2024, 39, 141. [Google Scholar] [CrossRef]
- Sanchez, G.M.; Petrasova, A.; Skrip, M.M.; Collins, E.L.; Lawrimore, M.A.; Vogler, J.B.; Terando, A.; Vukomanovic, J.; Mitasova, H.; Meentemeyer, R.K. Spatially interactive modeling of land change identifies location-specific adaptations most likely to lower future flood risk. Sci. Rep. 2023, 13, 18869. [Google Scholar] [CrossRef] [PubMed]
- Sun, Q.; Fang, J.; Dang, X.; Xu, K.; Fang, Y.; Li, X.; Liu, M. Multi-scenario urban flood risk assessment by integrating future land use change models and hydrodynamic models. Nat. Hazards Earth Syst. Sci. 2022, 22, 3815–3829. [Google Scholar] [CrossRef]
- Alam, T. Integrating space syntax and bathtub flood modelling to assess accessibility impacts of sea-level rise in Copenhagen’s historic core. J. Environ. Manag. 2026, 397, 128314. [Google Scholar] [CrossRef]
- Zwirglmaier, V.; Reimuth, A.; Garschagen, M. How suitable are current approaches to simulate flood risk under future urbanization trends? Environ. Res. Lett. 2024, 19, 073003. [Google Scholar] [CrossRef]
Disclaimer/Publisher’s Note: The statements, opinions and data contained in all publications are solely those of the individual author(s) and contributor(s) and not of MDPI and/or the editor(s). MDPI and/or the editor(s) disclaim responsibility for any injury to people or property resulting from any ideas, methods, instructions or products referred to in the content. |
© 2025 by the authors. Licensee MDPI, Basel, Switzerland. This article is an open access article distributed under the terms and conditions of the Creative Commons Attribution (CC BY) license.