Abstract
In the context of sustainable development and the growing emphasis on decent work and productivity, understanding the human factors that shape employee performance has become a central concern for organizations and policymakers. While intelligence has long been linked to work outcomes, existing research remains fragmented and predominantly focused on single dimensions, offering limited insight into how different forms of intelligence interact across employees’ career life cycles. Addressing this gap, the present study advances a multi-dimensional perspective on intelligence and examines its relevance for sustainable employee productivity, thereby contributing to the human resource management literature and to the achievement of Sustainable Development Goal 8 (Decent Work and Economic Growth). The study assesses the impact of five types of intelligence (cognitive—IQ, emotional—EQ, physical—PQ, vitality—VQ, and social—SQ) on employee productivity across distinct career life cycle stages. The research was conducted in two phases: (1) measurement of intelligence dimensions and employee productivity using standardized psychometric instruments, including MSCEIT V2.0, the Guilford–O’Sullivan test, the Eysenck test, the Chekhov vitality method, and biological age indicators; (2) statistical analysis of the relationships between intelligence, productivity, and career stages using open-source Python tools. Empirical data were collected from enterprises in the Ukrainian construction industry. The findings demonstrate that the influence of intelligence on productivity varies across career stages. Emotional intelligence emerges as a consistently significant factor throughout the employee life cycle, while other intelligence dimensions exhibit stage-specific effects. These results confirm the dynamic and non-uniform nature of intelligence–productivity relationships. The study provides practical insights for sustainable human resource management by highlighting the need for stage-sensitive development strategies that align intelligence profiles with career phases. Implementing such targeted approaches can enhance employee productivity, organizational effectiveness, and long-term economic sustainability, thereby supporting progress toward SDG 8.
1. Introduction
In today’s economy, people (specifically their intellectual potential) are the leading resource that ensures the development of the economy and supports its sustainability goals. Employee knowledge, skills, and competencies are crucial to the success of any organization. Employees with high professional and social skills effectively adapt to changes, implement innovations, and enhance the company’s productivity and sustainable development [1].
Unlike material resources, which can be limited, human capital is constantly evolving through learning and experience. Investments in human resource development (e.g., education, training, and health care) contribute to the sustainable development of enterprises and the economy. Modern companies prioritizing their employees’ development create a motivational environment that serves as the foundation for high productivity and competitiveness in the market [2].
Employee productivity is a key element of SDG 8, “Decent Work and Economic Growth,” and primarily targets 8.2—achieving higher levels of productivity of economies through diversification, technological upgrading, and innovation, including through a focus on high-value-adding and labor-intensive sectors, among the leading indicators is the growth rate of labor productivity (indicator 8.2.2) [3].
Decent work entails creating jobs with fair pay, development opportunities, safe working conditions, and social protection. This helps to increase employee motivation and engagement, which in turn increases their productivity. Employee productivity is influenced by many factors (external and internal): working conditions, motivation, level of professional training, organizational culture, work environment, etc. [4]. However, it is worth noting the negative impact of the pandemic, the economic and energy crisis, and the war in Ukraine in recent years. Instead, artificial intelligence and the transition to a green economy enable productivity growth [5].
Despite the negative impact of external factors on productivity dynamics in OECD countries, the indicator generally increased by 1.4% in 2023. Specifically, it rose by 1.5% in Europe, and in Asia, it grew by 1.8%. The United States recorded a significant increase in productivity, from −1.6% in 2022 to 1.5% in 2023 [6].
Managing labor productivity within an enterprise is a complex and challenging task crucial for any organization seeking economic growth, efficiency, and sustainable development. Realizing this task depends on effective human resources management strategies that focus on employee development and staff quality improvement. In addition, realizing this task will enable achieving higher levels of economic productivity, which will contribute to achieving SDG 8.
Different types of employee intelligence play a crucial role in managing productivity, as they are the main competencies. In recent decades, there has been a growing interest in studying the impact of different types of intelligence on human performance and productivity. For example, scientists [7,8] have proposed theories on how and to what extent a particular kind of intelligence affects human performance.
Both concepts (intelligence and intellect) originate from the same Latin root intelligere, meaning “to understand.” However, there is a notable distinction in terminology: intelligence refers to the ability to learn, understand, analyze, apply logic, and solve problems, while intellect pertains to mental activity or the act of thinking [9]. However, in the context of our study, the concept of «intelligence» is applied.
Employee intelligence in a scientific context is typically defined as the combination of cognitive, emotional, social, and professional abilities that an employee utilizes to effectively perform their duties, make decisions, interact within a team, and adapt to changes in the work environment [10,11].
Building on prior research [12,13,14], the multi-dimensional nature of workplace intelligence was analyzed in the context of its impact on productivity. At the same time, the levels and significance of the influence of different types of intelligence on varying stages of the employee’s life cycle remain insufficiently studied.
Despite the growing recognition that employee productivity is a cornerstone of sustainable economic growth and decent work, empirical evidence on how different dimensions of intelligence contribute to productivity across the career life cycle remains fragmented. Most existing studies focus on isolated intelligence constructs or treat workforce productivity as a static outcome, overlooking the dynamic nature of employee development and the possibility that distinct intelligence dimensions may become influential at different stages of professional life. This gap limits the ability of organizations to design evidence-based, sustainable human resource management strategies that account for employee heterogeneity and long-term performance.
To address this limitation, the present study adopts a multi-dimensional perspective on intelligence and explicitly incorporates the career life cycle framework. By examining cognitive (IQ), emotional (EQ), social (SQ), physical (PQ), and vitality (VQ) intelligence simultaneously, the study seeks to identify both general and stage-specific determinants of sustainable employee productivity. Accordingly, the analysis is guided by two research questions. RQ1 asks which dimensions of multi-dimensional intelligence are most strongly associated with sustainable employee productivity in the pooled workforce and across different career life cycle stages. RQ2 explores how stage-specific patterns of intelligence–productivity relationships can inform the design of differentiated and sustainable human resource management strategies that support long-term employee effectiveness and organizational sustainability.
The study contributes to sustainable human resource management by revealing stage-varying intelligence profiles that inform targeted development interventions that support long-term employee effectiveness and organizational sustainability.
2. Literature Review
2.1. Employee Productivity, Its Management, and Sustainable Development
Ensuring sustainable socio-economic development involves managing the state of three systems: the biological nature of humans, the biosphere, and the socio-economic system. In the context of our study, we focus on the interaction between the first and third systems. Ensuring the biological component of a human involves maintaining an adequate level of physical health as the foundation of human functioning (as a biological species) and fostering the development of personal and social qualities. The socio-economic system serves as the means for human existence. It feeds, clothes, and shelters people, creating conditions necessary for their life and activity [15].
Employee productivity depends on many factors and determinants [16,17,18,19]. There are several mechanisms for influencing employee productivity, among which the system of social and psychological management and motivation of employees plays a special role. It is an effective tool for improving the quality of personnel, productivity, and overall performance. It is also important to formulate an employee management strategy focused on an individual approach to each employee, considering their personal characteristics and competencies [20].
The success of individual socio-psychological management is determined by the competencies that socio-psychological methods aim at. Therefore, an essential task of the management system is to determine an individual’s basic competencies, which significantly impact the success of their activity and the social success of both the team and the individual employee. Competence is a key trait of a person that creates a direct connection to effective and high-quality work performance [21,22,23].
Many scientific papers have studied the relationship between economic growth, decent work, and productivity within the Sustainable Development Goals (SDG 8) [3,22,23,24,25,26]. The authors [3] note that productivity can contribute to increased competitiveness while also being an indicator of progress in achieving the Sustainable Development Goals (SDG 8). Rozlan & Subramaniam describe the impact of emotional well-being, because of work-life balance, on employee productivity in the context of SDG 8 [27]. The research [28] investigates the impact of physical health, namely eye health, on workplace productivity to achieve SDG 8. Hrinchenko et al. [29] investigated the effect of the COVID-19 pandemic on productivity and the importance of decent work for achieving the SDGs.
The articles [30,31] examine the relationship between personality traits and work addiction among private sector employees. The studies emphasize the importance of considering dark personality traits to better understand the nature of work addiction.
2.2. Types of Intelligence and Stages of the Employee Life Cycle
The relationship between intelligence and employees’ success in various fields of activity is researched in [32,33,34]. Nowadays, the concept of intelligence has long gone beyond cognitive analysis and is studied as a set of different abilities. For example, Turner et al. [35], describing intelligence as a set of abilities, divided its indicators into action-logic (the brain’s left hemisphere) and emotional-figurative (the right hemisphere).
G. Gardner was one of the first to study human intelligence using the holistic method and proposed the concept of “multiple intelligences”. In his work “The Structure of the Mind” [36], he proposes to study an individual as a system of interdependent spheres, noting that the existing definition of intelligence by the IQ coefficient is too narrow. Gardner, based on his knowledge of the neuroscience of human behavior, hypothesized the existence of seven types of intelligence (verbal-linguistic, musical, logical-mathematical, spatial, bodily-kinetic, intrapersonal, and interpersonal), and later added the eighth one—natural, which forms the structure of human intelligence.
Many scientists in this field base their research on the ideas of G. Gardner, supplementing and making their own adjustments [36]. Thus, the main elements of the structure of intelligence also include cognitive intelligence (IQ), which differs from the proposed theory of multiple intelligences. Researchers [37,38,39] propose to combine Gardner’s types of intelligence into four main ones: cognitive intelligence (measured by the Intelligence Quotient)—the ability to process information and make informed decisions; emotional intelligence (Emotional Quotient)—the ability to realize and manage one’s own emotions and the emotions of other people; physical intelligence (Physical Quotient)—physical health and ability to perform assigned tasks; spiritual intelligence (Spiritual Quotient)—spiritual skills that help to understand the values and meanings of a person.
In [39], the proposed types of intelligence are arranged in a hierarchical order: physical intelligence is the basic one, cognitive intelligence (IQ) and emotional intelligence (EQ) are at the next levels, and spiritual intelligence (SpQ) is at the highest level.
Among the main types of intelligence, it is also worth highlighting VQ (Vitality Quotient) (proposed by the French psychologist P. Cass [40]), which determines a person’s ability to energize themselves and other people. Some scientists also distinguish social intelligence (SQ) (Social Quotient), which determines the ability of a person to get along well, communicate, and interact socially with other people, involving them in cooperation [41]. Gage & Smith [38] distinguish the following types of intelligence: cognitive (IQ), emotional (EQ), spiritual (SpQ), and physical (PQ). Moreover, some scientists study the importance of the following types of intelligence in different areas of an individual’s activity: leadership intelligence (LQ) [37,38], adversity intelligence (AQ) [39,40], creative intelligence (CQ) [41], moral intelligence (MQ) [41,42], and financial intelligence (FQ) [42,43,44].
Over the past decades, the number of studies on the impact of different types of intelligence on human activity has been growing. For example, D. Goleman [7], based on the results of empirical studies, determined that the success of an employee’s activity depends on the level of IQ by 15% and on the level of emotional literacy by 85%. The American agency Talent Smart found that 58% of success and productivity at work depends on emotional intelligence, the key among the 33 most essential competencies [8].
An important aspect of the study of this topic is the periodization of labor activity, because at each stage of the employee’s life cycle, the key types of intelligence may differ.
In the scientific literature, several terms describe the periodization of an employee’s work activity in a cyclical form. For example, the concept of the “employee work-life cycle” is described as (1) a single cycle from initial hiring to final departure (or retirement), which authors divide into corresponding stages; and (2) the production process in an employee’s activity, from preparation to product realization, i.e., as an element of the employee’s life cycle [45,46,47,48,49,50]. In our research, we refer to the term “employee life cycle”, which is interpreted as the sequence of main stages of an employee’s work activity. Based on the analysis of literature sources, we propose a refined definition of the employee life cycle: it is a sequence of interconnected stages of an employee’s work activity that form a complete development cycle over a certain period at a specific workplace and/or position and/or profession [13].
Scientists offer different approaches to periodizing an employee’s labor activity. L. Smither [51] identifies the following stages of the employee’s life cycle: introduction, growth, maturity, and decline; Shyam & Ramachandra Gowda [52] propose introduction, development, promotion, and mid-career crisis/retirement; Verive & DeLay [53] identify attract, join, engage, and leave; and M. Saltmarsh [54] proposes recruitment, education, motivation, evaluation, and celebration.
Despite several existing studies, the impact of different types of intelligence on employee productivity, considering the life cycle stages, remains insufficiently studied. In addition, forming an effective management system requires an individual approach to employees, which makes it possible to increase their productivity by developing the key types of intelligence at each stage of their life cycle.
Accordingly, the primary purpose of our study is to assess the impact of types of intelligence (according to the proposed five-factor model) on employee productivity at each of the proposed six stages of its life cycle and to identify the key types.
2.3. Five-Factor Model of Employee Intelligence and the Six Stages of the Life Cycle
The research methodology is based on our five-factor model of employee intelligence developed in [12] and the proposed six stages of its life cycle [13,14].
When selecting the key types of intelligence for the five-factor model (IQ, EQ, PQ, VQ, and SQ), we were guided by the fact that it is the indicators of physical and psychological health that have a critical impact on the productivity and efficiency of an employee’s activities [50,51,52,53,54], since the state of health affects the mood and attitude to various activities. The preamble to the Constitution of the World Health Organization (WHO) provides the following concept of health: “a state of complete physical, mental, and social well-being and not merely the absence of disease or infirmity” [55]. Therefore, having studied the main types of well-being [56,57,58,59,60,61,62,63], we determined that the term health is not limited to the physical level, i.e., the absence of disorders in the activity of organs and systems and injuries or diseases; it also includes the following: satisfaction with social status and the ability to communicate effectively; the level of energy and the ability to energize oneself and others; the ability to manage one’s emotions and the emotions of others; the ability to memorize information and think logically and critically.
As a result, it was found that the types of well-being that determine the level of employee health are most appropriately assessed by five main types of intelligence: psychological well-being via cognitive (IQ) and emotional intelligence (EQ); physical well-being via physical intelligence (PQ) and the vital energy coefficient (VQ), and social well-being via social intelligence (SQ). Based on this conclusion and the concept of multiple intelligences proposed by H. Gardner [36], as well as using a holistic approach, the corresponding types of intelligence became the basis of the proposed five-factor model [12,13,14].
As for the six stages of the life cycle (recruitment, socialization, work, training and evaluation, professional realization and growth, and dismissal/retirement) identified by us [13,64,65,66,67,68,69,70,71] based on the frequency of references in scientific works, the following are true:
- (1)
- At the stage of recruitment, the suitability of the professional qualities of the future employee to the chosen position is determined. An investigation is conducted of the employee’s prior work experience, reasons for leaving, dissatisfaction at the former workplace, and motivation for changing jobs, as well as their professional competencies and psychological traits. The interaction between an employee and an enterprise is based on both psychological and economic interdependence, which includes key expectations from both sides. Crucial factors are the socio-psychological, organizational, cultural, technological, and economic characteristics of the profession, as well as the alignment of the chosen field with the employee’s abilities, skills, and motivation.
- (2)
- At the stage of socialization, the employee is familiarized with the team, goals, and rules of the company. Socialization involves understanding one’s social role within the team and the ability to work collaboratively while maintaining individuality.
- (3)
- At the stage of working, employees directly perform their tasks. Work activity is a structured sequence of goal-oriented operations/functions in time and space performed by individuals united within a labor organization. From an economic perspective, it is a process aimed at achieving both employee and organizational objectives.
- (4)
- At the stage of training and evaluation, the professional development, training, and certification of employees take place. Staff development is a critical prerequisite for enterprise success, as the obsolescence of employees’ knowledge and skills negatively affects its performance.
- (5)
- At the stage of professional realization and growth, the employee moves to the next stage of career development. At this stage, the concept of career advancement becomes essential. The career opportunities motivate employees to increase their productivity and engage in self-development. Employees are more likely to remain within an organization when their career goals align with the company’s management strategies.
- (6)
- At the last stage of the life cycle, the employee either moves to another place of work or ends his/her employment, i.e., retires. Depending on the reason for ending the employment—forced dismissal, desire to change the career or workplace, taking a career break, or starting a business—the root causes may include unmet needs or reaching a new stage of personal and professional development. At this stage, it is essential to analyze the motives behind this decision, as the loss of a valuable employee may cost much more than investments in their retention and motivation. It is also necessary to ensure all conditions are in place to comply with confidentiality agreements.
The analysis of employees’ intelligence and productivity across different life cycle stages was conducted in the following phases: (1) collect and transform data from unified surveys and perform visualization analysis; (2) apply correlation and regression analysis to define the relationship between productivity (number of projects) and each type of employee intelligence based on the elements of the five-factor model and life cycle stages; (3) conduct principal component analysis for dimensionality reduction of intelligence components and define the dominant intelligence profile throughout the life cycle.
3. Materials and Methods
3.1. Preparing the Data and Performing Visualization Analysis
The assessment was conducted in the design departments of five construction companies and two design organizations in the construction industry of Ukraine in October-November 2024. The surveyed sample of employees of Bodex LLC [72] consisted of 14 people, Spetsbudservice LLC [73]—12 people, Eco House Holding Company PJSC [74]—9 people, Teton Development LLC [75]—19 people, Thermobud Kyiv PE [76]—14 people, Galgazotherm PJSC [77]—17 people, and More Form LLC [78]—20 people. In total, the sample amounted to 105 employees. For confidentiality and convenience, each employee of the seven studied enterprises was coded as follows: Ai—the i-th employee of the enterprise A (Bodex LLC); Bi—the i-th employee of the enterprise B (Spetsbudservice LLC); Ci—the i-th employee of the enterprise C (Eco House Holding Company PJSC); Di—the i-th employee of the enterprise D (Teton Development LLC); Ei—the i-th employee of the enterprise E (Galgazotherm PJSC); Fi—the i-th employee of the enterprise F (Thermobud Kyiv PE); Gi—the i-th employee of the enterprise G (More Form LLC).
In the first phase, the assessment of the levels of each type of intelligence of the five-factor model was carried out using the following tests [67,68,69,70]:
- Emotional intelligence (EQ)—The adapted MSCEIT V2.0 test;
- Social intelligence (SQ)—The test of Guilford & O’Sullivan;
- Vital Energy Quotient or Vital Quotient (VQ)—The method of O. Chekhova;
- Physical intelligence (PQ)—The method of calculating biological age;
- Cognitive intelligence (IQ)—The classic Eysenck Personality Test.
Each element of the five-factor model affects an employee’s performance and productivity. Physical intelligence (PQ) determines immunity and susceptibility to disease, the ability to perform tasks that require physical activity, physical endurance, and the ability to recover quickly from stressful situations. Vitality Quotient (VQ) determines the intensity and amount of work performed; affects the speed of learning and development; and helps to motivate others to be productive. Cognitive intelligence (IQ) determines the ability to analyze and memorize information, make predictions, think logically and critically, and make informed decisions. Social intelligence (SQ) plays an important role in establishing friendships, communicating, conducting business negotiations, effective teamwork, understanding others, and communicating your point of view. Emotional intelligence (EQ) determines the ability to manage one’s emotions and those of others, think critically, and remain productive in stressful situations [13,14,69].
The five types of intelligence were assessed over five consecutive days, with one test administered daily to minimize respondents’ cognitive load.
The method proposed in [69] was used to assess vitality. It includes a series of questions to evaluate life energy, a mini-case task whose solution characterizes the respondent’s energy level, and a subjective questionnaire in which employees rate their life energy on a 10-point scale [69].
The subjective part of the method consists of 28 questions. The final value of the health self-assessment index quantitatively reflects health, ranging from 0 for “ideal” to 28 for “very poor” well-being. Using specific formulas (for men and women), the actual biological age (ABA) and the proper biological age (PBA) are calculated and compared accordingly.
The Eysenck test was used to determine IQ level, consisting of 40 questions, each with a numerical, letter, or word answer [71].
The social intelligence assessment through the Guilford & O’Sullivan methodology includes four subtests: Subtest 1 “Cartoon Stories,” Subtest 2 “Group Expression,” Subtest 3 “Verbal Expression,” and Subtest 4 “Missing Information.” Three subtests are based on verbal incentives, and one is entirely verbal. Each subtest contains 12–15 tasks [68].
Emotional intelligence was assessed using the MSCIT test based on the four-branch model, corresponding to eight sections (A–H). Two combined sections assess each component of the model. For example, the component “perception, appraisal, and identification of emotions” is evaluated through recognition of facial expressions (Section A) and pictures (Section E). The component “using emotions to enhance thinking” is assessed via tasks involving descriptions of feelings and comparisons with other sensory modalities (Section F), and the assimilation of a pre-set mood in decision-making regarding a fictional character (Section B). The component “understanding and analyzing emotions” is evaluated by the ability to explain how emotions combine (Section C) and to distinguish mixed and complex feelings (Section G). The component “managing emotions for personal growth and improved relationships” is assessed through tasks that illustrate emotional regulation of self (Section D) and others (Section H) using visual scenarios with “correct” emotional responses.
The respective enterprises’ HR department heads conducted the assessments at the research sites with a defined staff or matrix–staff organizational management structure, and the executives conducted the research directly in companies with a defined matrix management structure. A system of dynamic walls from 1 to 9 was used to unify the test results (Table A1). The indicator of employee productivity was calculated as the average number of projects completed by an individual employee over the three months before the study. The nature of the projects and the scope of work matched typical activities of SMEs in the construction industry. Additionally, the company’s management provided information on each employee’s stage in their life cycle. The resulting data (Table A2) was used for evaluation results and modeling purposes.
The exploratory step comprised an analysis and visualization block implemented to provide an interpretable empirical baseline before inferential modeling. The visualization toolkit included stage-wise profile plots of standardized intelligence structure and boxplot comparisons of productivity distributions across stages. These graphics were used solely as descriptive evidence and were intended to motivate subsequent correlation, regression, and PCA analyses.
3.2. Correlation and Regression Analysis of Productivity–Intelligence Relationships
Correlation analysis was used to identify intelligence variables strongly associated with productivity across all stages and by stage-related scores. All correlation coefficients were estimated with the corresponding p-values to further assess the effect of small choices.
The regression equation for the entire model is [79]
where denotes productivity (project count) for employee ; represents the intercept; and quantify n = (1…6) intelligence variable effects on productivity (for full and staged-related samples); and denotes a normally distributed residual error.
The fixed stage-effects equation was applied to provide a specification for full, simple fitted models. The equation is [79]
where denotes productivity for employee ; is the baseline intercept representing expected productivity for employees in Stage 1 (reference category); are stage-specific intercept adjustment parameters for stages , capturing the additive effect on productivity of being in stage s relative to Stage 1; is an indicator function that equals 1 if employee i belongs to stage s and is 0 otherwise; and are regression coefficients for the intelligence components.
All Ordinary Least Squares (OLSs) models were estimated via the Python statsmodels v0.14.4 [79] and a minimal AIC optimization circle. Subsequently, all statistically insignificant regressors (p-value > 0.05) were excluded (pruned), and the resulting models were compared. Model fit was evaluated through an adjusted , which penalizes additional parameters to prevent overfitting (especially for many regressors on small data). Comparisons of nested models employed F-tests to determine whether increased complexity significantly improved [79].
3.3. Principal Component Analysis of Intelligence-Dominated Profiles
In the third phase, principal component analysis (PCA) was implemented to reduce dimensions while retaining the initial variance [79,80]. PCA transforms correlated predictors into orthogonal (uncorrelated) components that capture collective variance, addressing multicollinearity concerns while facilitating interpretable regression models. Two parallel PCA strategies were executed: global PCA across all employees, and stage-specific PCA for each life cycle stage. Intelligence scores were standardized using StandardScaler (mean = 0, standard deviation = 1) before PCA extraction [79,80].
The statistical adequacy of PCA application was evaluated using the Kaiser–Meyer–Olkin (KMO) measure of sampling adequacy and Bartlett’s test of sphericity [80]. PCA results were considered admissible when Bartlett’s test was statistically significant (p < 0.05), and the KMO value indicated at least marginal adequacy (0.5 or higher), with cautious interpretation applied in borderline cases (KMO = 0.47–0.48) due to limited stage-specific sample sizes.
Variable–component correlations were used as the primary interpretive tool, as they represent direct correlations between original intelligence indicators and component scores, enabling more precise substantive interpretation in terms of economic and behavioral meaning [80]. A dominant profile was defined as a coherent combination of intelligence dimensions that loaded strongly and consistently on the leading components within a given stage.
Full sample or global PCA was performed on the complete dataset (n = 105) to identify common variance patterns across all career stages. A stage-specific PCA was conducted for each life cycle stage. For each stage subset (n = 10–25), the five intelligence measures were independently standardized and subjected to PCA [79,80]. While the small, stage-specific samples limit statistical rigor, the constraints reflect the natural distribution of employees across life cycle stages within participating organizations. To mitigate small-sample concerns, component extraction was limited to two components rather than all five possible, and findings were interpreted based on directional patterns rather than exact parameter estimates.
All statistical analyses were conducted using Python programming language tools, following established practices for reproducible economic data analysis. Data manipulation was performed using Pandas v2.3.3 for tabular structures and NumPy v1.26.4 for numerical array operations. PCA was implemented using scikit-learn v1.7.2 (StandardScaler for preprocessing, and PCA for dimensionality reduction). OLS regression was performed using statsmodels v0.14.4 and SciPy v1.16.1 to compute Pearson correlation coefficients and p-values. Visualizations were created using Matplotlib v3.10.6 and seaborn v0.13.2 [79].
4. Results
In the first phase of the study, the analytical and visualization methods described in the methodology were applied to evaluate each intelligence dimension within the five-factor model. Raw assessment results were converted into standardized scores using the sten-based normalization procedure (Table A1), which ensured comparability and stability of intelligence measures across employees and firms. The transformed data from the unified survey results for modeling purposes are presented in Table A2. The aggregated, stage-specific intelligence profiles are visualized in Figure 1, which presents the mean standardized values.
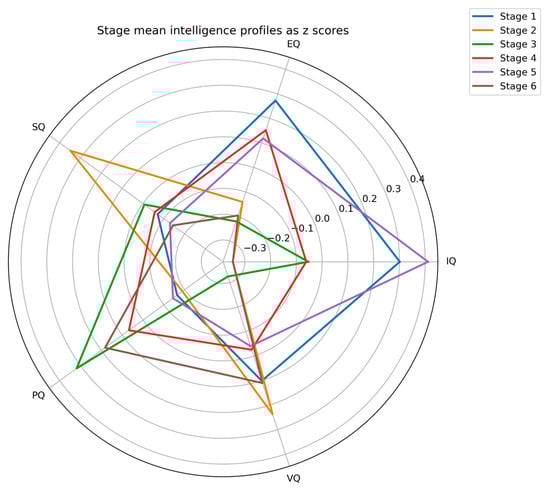
Figure 1.
Stage-specific mean intelligence profiles expressed as standardized z-scores.
As Figure 1 shows, at Stage 1 (Recruitment), the intelligence profile is relatively balanced, with a moderate predominance of emotional intelligence (EQ), cognitive intelligence (IQ), and Vitality Quotient (VQ), indicating the importance of emotional regulation, cognitive capacity, and personal energy for successful entry and initial adaptation to the organization. At Stages 2 and 3, the intelligence structure becomes more differentiated and clearly dominant, with separate elements. Stage 2 (Socialization) is characterized by a noticeable increase in social intelligence (SQ) and Vitality Quotient (VQ), reflecting the growing roles of interpersonal interaction and communication, as well as sustained energy, in team integration and early performance. In Stage 3 (Operational maturity), physical intelligence (PQ) becomes the most prominent element, underscoring the importance of physical endurance, health, and resilience for maintaining stable productivity during sustained work. Stage 4 (Training and evaluation) displays a comparatively more even distribution of intelligence dimensions, with a slight relative predominance of emotional intelligence (EQ). This pattern suggests that emotional self-regulation and stress management become particularly relevant during periods of intensive learning, assessment, and professional recalibration, when performance pressures are elevated. At Stage 5 (Professional growth and realization), the profile shows a marked increase in the role of cognitive intelligence (IQ). This may indicate that advanced problem-solving ability, analytical thinking, and decision-making capacity are critical for higher-level responsibilities, leadership functions, and strategic tasks characteristic of this stage. Finally, at Stage 6 (Transition or late career), physical intelligence (PQ) again becomes the dominant component of the profile. This reflects the growing influence of physical condition and health on the ability to sustain productivity in later career phases, where cognitive and social engagement may gradually decline. Still, physical resilience remains a key limiting factor.
Overall, Figure 1 confirms that employee intelligence structure is not static but evolves systematically across the life cycle, with different intelligence dimensions assuming leading roles at various stages. These descriptive results provide the empirical foundation for subsequent regression and principal component analyses, in which the identified stage-specific patterns are examined in relation to productivity outcomes.
A summarizing visualization of employee productivity levels (measured as the number of completed projects) across life cycle stages is presented as a boxplot (Figure 2), which facilitates comparison of the intelligence structure and observed productivity dynamics.
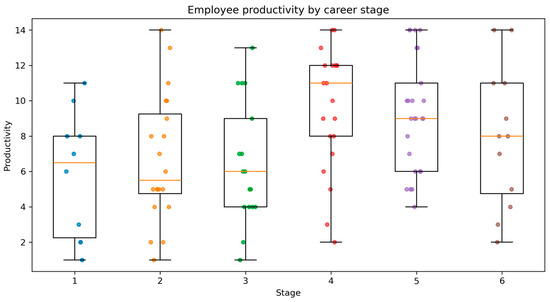
Figure 2.
Distribution of employee productivity across career life cycle stages.
Figure 2 indicates that median productivity levels and interquartile ranges across the six stages do not differ substantially, suggesting that overall productivity remains relatively stable throughout the employee life cycle. At the same time, a moderate upward trend in median productivity is observed from Stage 1 to Stage 4, followed by a slight decline at Stages 5 and 6. Although these differences are minor in quantity, they reveal a subtle life cycle pattern.
Furthermore, in the early stages (Stages 1–3), productivity exhibits greater dispersion, reflecting heterogeneous adaptation speeds and learning trajectories among new and recently integrated employees. During the middle stages, particularly Stage 4 (Training and evaluation), productivity reaches its highest median value. It exhibits a relatively narrow interquartile range, indicating more consistent performance among employees undergoing professional consolidation and formal assessment.
Importantly, the observed productivity differences across stages are modest, supporting the interpretation that productivity outcomes are shaped less by the career stage itself and more by stage-specific configurations of intelligence, which will be examined in the subsequent regression and PCA analyses.
In the second phase, the survey results were analyzed using correlation analysis to identify relationships among productivity levels and the component-based evaluation of different types of intelligence. The results are presented in Table 1.

Table 1.
Results of the correlation analysis based on the overall research sample and stage-specific related data (Pearson correlation for productivity).
The correlation analysis conducted on the full sample demonstrated moderate statistically significant relationships between employee productivity and several components of the five-factor intelligence model. The strongest positive association was identified between productivity and emotional intelligence (EQ) (r = 0.689, p < 0.001). This suggests that, on average, employees with greater emotional awareness and self-regulation tend to perform better. A lower, but moderately level, correlation with significant p-values was observed for the Vitality Quotient (VQ) (r = 0.537, p < 0.001).
The stage-specific analysis offers a more detailed understanding of the influence of various intelligence changes across the employee life cycle.
At the first stage (recruitment), the correlations with IQ (r = 0.958, p < 0.001) and EQ (r = 0.924, p < 0.001) were exceptionally strong, while SQ also showed a substantial relationship (r = 0.734, p < 0.05). These results can be softly understood as follows: at the start of a professional career, productivity mainly relies on learning quickly, understanding tasks, and emotionally and socially adapting to a new environment. Given n = 10, these high coefficients may be unstable and are therefore also checked through subsequent modeling steps.
At the second stage (socialization), productivity correlated most closely with VQ (r = 0.828, p < 0.001), EQ (r = 0.780, p < 0.001), and SQ (r = 0.780, p < 0.001). This stage pattern is consistent with an adjustment mechanism in which energy mobilization, emotional stability, and interpersonal competence may jointly support integration into team routines. The low negative correlation between IQ and productivity (r = −0.446, p < 0.05) suggests that excessive emphasis on analysis, without social engagement, may temporarily limit adaptability during this adjustment stage.
At the third stage (active work), the most pronounced correlations were observed with PQ (r = 0.778, p < 0.001) and EQ (r = 0.655, p < 0.01). This demonstrates that under sustained workload conditions, physical resilience and emotional self-regulation become leading factors of stable performance.
At the fourth stage (training and evaluation), the analysis revealed high and statistically significant correlations only for EQ (r = 0.812, p < 0.001) and IQ (r = 0.716, p < 0.001). This illustrates how emotional maturity and cognitive processing together impact learning effectiveness and professional growth. The near-zero coefficients for PQ and SQ at this stage may indicate that productivity variation is primarily associated with learning-related cognitive processing and emotional regulation, rather than with physical capacity.
At the fifth stage (professional realization and growth), the strongest correlations were found with VQ (r = 0.818, p < 0.001), IQ (r = 0.797, p < 0.001), and EQ (r = 0.784, p < 0.001). The simultaneous significance of these three coefficients indicates a unidirectional pattern in cognitive, emotional, and energetic resources. In substantive terms, this stage entails greater responsibility and complexity, in which productivity requires sustained vitality, analytical performance, and emotionally stable decision-making.
At the sixth stage (transition or retirement), productivity was most strongly correlated with PQ (r = 0.951, p < 0.001) and VQ (r = 0.952, p < 0.001). The exceptionally high correlations and corresponding p-values confirm that physical condition and life energy dominate performance outcomes in the final professional phase. The other coefficients are insignificant.
However, the analysis also revealed certain methodological constraints. In smaller subgroups, particularly at the initial and concluding stages, the observed p-values were accompanied by unstable correlation magnitudes, although the p-values were statistically significant. Such volatility may stem from the limited number of observations and the multi-dimensional character of the intelligence indicators. Consequently, direct pairwise correlations may not fully capture the latent structure of relationships among variables.
To further assess the relationships, the OLS results specifications in Table 2 are estimated using two complementary strategies: AIC-optimized (the best AIC models) subset selection and a pruned refit that removes predictors with p ≥ 0.05.
Table 2.
Ordinary least squares linear multiple regression estimates of employee productivity by intelligence components for the full sample and stage subsamples.
The pooled full-sample results indicate that productivity is most consistently associated with emotional intelligence and vitality. In the AIC-optimized pooled model, EQ and VQ remain strongly significant, while IQ and PQ enter with smaller coefficients and weaker statistical support. The pruned pooled model retains only EQ and VQ, with a negligible loss of explanatory power, supporting a parsimonious managerial interpretation. In practice, this means that across the entire workforce, productivity improvements are most reliably associated with strengthening emotional self-regulation and sustaining employee energy levels. In contrast, the incremental contribution of cognitive and physical intelligence is more context-dependent.
Additionally, the fixed-effects regression was estimated using the best-performing intelligence components and stage indicators:
This model shows strong overall explanatory power (Adjusted R2 = 0.729) and confirms the cross-stage relevance of EQ and VQ, while also indicating marginal relevance of IQ and PQ (p-values of < 0.05 for all predictors except the p-values for IQ and PQ, which are 0.06 and 0.053). The positive and significant stage effects indicate that, relative to Stage 1, baseline productivity is higher in Stages 2–6, with the most significant increase at Stage 4. In practice, this means that a combination of stage context and a stable core of emotional and vitality resources may define the level of productivity. In contrast, additional intelligence dimensions become decisive only under specific stage conditions.
Stage-specific regressions confirm that the productivity drivers shift across the life cycle and that the pruning models become substantially simpler to interpret.
In Stage 1, the AIC-optimized specification produces a very high adjusted R2. Still, pruning reduces the model to IQ alone, indicating that early-stage productivity is primarily explained by learning capacity and task comprehension.
In Stage 2, the AIC-optimized and pruned specifications coincide, retaining EQ and VQ, implying a stable mechanism in which emotional stability and vitality jointly support integration and early performance in teams. This aligns with the correlation structure, in which socialization is associated with interpersonal and motivational capacities; however, the regression indicates that SQ does not provide additional independent predictive value when EQ and VQ are controlled.
In Stage 3, the pruned model identifies PQ as the key predictor, implying that, during operational maturity and sustained workload, the dominant constraint on productivity is physical resilience and recovery capacity. This is consistent with the high correlation between PQ and productivity at this stage and yields a direct practical implication: operational performance can be supported through health-protective scheduling, fatigue management, and ergonomic interventions.
In Stage 4, the identical AIC and pruned models retain IQ and EQ, indicating a stable learning-and-evaluation mechanism where productivity depends on cognitive processing combined with emotional regulation under pressure.
In Stage 5, pruning reduces the model to IQ and VQ, suggesting that, at professional growth and realization, productivity is most strongly associated with analytical decision-making capacity and sustained energy.
In Stage 6, the pruned model retains only PQ, indicating that in late-career transitions, productivity is primarily constrained by physical condition.
The divergence between AIC and pruned results in Stages 1 and 6 is consistent with the overfitting risk inherent in small subsamples. It supports treating the pruned models as the primary basis for interpretation.
Across all stages, SQ is not a significant predictor. It does not contradict the correlations but indicates that the productivity-relevant component of social adaptability is captured primarily by EQ and VQ when predictors are jointly evaluated. In practice, this implies that interventions framed as social skills training are likely to be more productive when integrated with emotional self-regulation and vitality-building measures, rather than implemented as standalone initiatives.
In the third stage, PCA was applied to identify composite latent factors that summarize the joint influence of multiple intelligences. At the start of the analysis, PCA was performed on the full dataset of 105 employees, representing all six stages of the professional life cycle, and on the five standardized intelligence components. The results are summarized in Table 3.
Table 3.
Full-sample PCA results: explained variance and variable–component correlations *.
The data (Table 3) confirms that the first three components cover about 75% of the total variance. However, at least four principal components are needed to surpass the typical 80% explained variance threshold. The global PCA shows that no single latent component adequately summarizes the data. In practical terms, this means the workforce in the presented sample does not exhibit a single universal intelligence structure that a single standardized HR development program could address. Instead, multiple partially independent competence bundles coexist within the pooled sample. In addition, a KMO of 0.48 suggests weak overall PCA adequacy, but Bartlett’s test p < 0.001 confirms sufficient intercorrelations to justify PCA, so interpretation should be cautious.
Consequently, the following analytical step focuses on stage-specific PCA models, which yield clearer, more statistically significant relationships among intelligence factors within the dominant pattern. Additionally, these models are consistent with the assumption that the structure of employee intelligence changes across the career life cycle.
The summarized results of the stage-based PCA are presented in Table 4, and the corresponding two-dimensional diagrams for all six stages are shown in Figure 3.
Table 4.
Stage-specific PCA results for the first two components (PC1–PC2): explained variance and variable–component correlations.
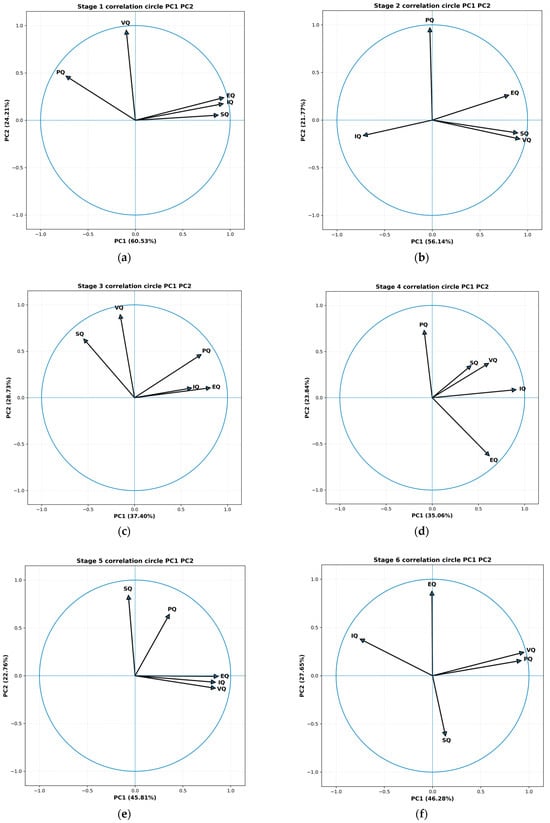
Figure 3.
Stage-specific PCA correlation circles in the PC1–PC2 plane for the life cycle stages: (a) Stage 1—Recruitment and early adaptation; (b) Stage 2—Socialization and initial performance; (c) Stage 3—Operational maturity; (d) Stage 4—Training and evaluation; (e) Stage 5—Professional consolidation; (f) Stage 6—Transition or pre-retirement.
The stage-based PCA confirms that employee intelligence composition is dynamic and evolves throughout the life cycle. Only Stages 1, 2, and 5 provide statistically acceptable PCA adequacy, with KMO ≥ 0.59 and Bartlett’s test p-value ≤ 0.01, so dominant profiles may be defined for these stages. In contrast, Stages 3, 4, and 6 are interpreted cautiously due to weak adequacy, and the profiles for those stages are only for orientation.
PC1 at Stage 1 is defined by positive EQ, IQ, and SQ variable–component correlations and SQ variables and a negative correlation with PQ, indicating a unified socio-cognitive–emotional pattern in which higher emotional regulation, cognitive readiness, and social adaptation co-occur, whereas physical capacity moves in the opposite direction along the central axis. PC2 is defined by VQ and PQ, indicating a separate vitality–physical axis that complements PC1.
At Stage 2, PC1 is dominated by VQ, SQ, and EQ, with IQ negatively correlated, indicating that energy mobilization and interpersonal-emotional functioning constitute the primary integrated resource in socialization. In contrast, cognitive orientation is positioned in the opposite direction on the same axis. PC2 is dominated by PQ, indicating that physical capacity forms an autonomous second dimension. This yields a Stage 2 profile dominated by socio-emotional vitality based on VQ, SQ, and EQ, with PQ acting as a distinct secondary resource axis.
At Stage 3, Bartlett’s test statistic (p-value = 0.27) indicates that the PCA structure is not statistically supported, and the component interpretation is exploratory only. The apparent PC1 grouping of EQ, PQ, and IQ, and the PC2 grouping of VQ and SQ, may reflect a partial separation between performance capacity and motivational-social resources. Still, no reliable dominant profile is stated for Stage 3.
Stage 4 has the weakest adequacy (KMO = 0.35 and Bartlett’s test p-value = 0.16), so the extracted PC1–PC2 configuration should not be used for substantive inference. The opposite signs of PQ and EQ on PC2 suggest a potential tension between physical engagement and emotional regulation. Still, this pattern is reported only descriptively and without claims of a dominant profile.
At Stage 5, PC1 is defined by EQ, IQ, and VQ in the same direction, indicating an integrated cognitive–emotional–vital resource bundle, while PC2 is dominated by SQ and PQ, indicating a complementary social–physical support axis. This yields a Stage 5 dominant profile of integrated cognitive–emotional vitality based on EQ, IQ, and VQ, with SQ and PQ forming a secondary supporting profile.
At the 6th stage, KMO = 0.47 is at the borderline threshold of adequacy, although Bartlett’s test (p-value = 0.02) indicates non-random correlations; therefore, the interpretation remains cautious. PC1 is defined by VQ and PQ, with a negative IQ correlation, marking a shift toward vitality–physical dominance and an inverse alignment with cognitive orientation along the central axis. PC2 contrasts EQ positively with SQ negatively, suggesting emotional stability alongside reduced social orientation. Given the subthreshold KMO and the small sample size, no dominant profile is formally identified for Stage 6, and the results are interpreted as indicative.
Across the entire life cycle, the PCA indicates that the interdependence of intelligence components is dynamic rather than fixed. In the early stages, the structure becomes statistically weak in this sample, and in the later stage, with adequate diagnostics (Stage 5), the system re-integrates into a stable profile. In contrast, Stage 6 suggests a vitality–physical shift but is insufficiently supported to warrant a definitive profile claim. In practice, this implies that HR diagnostics and development tools should be stage-sensitive, with Stage 1 emphasizing socio-cognitive onboarding capacity, Stage 2 emphasizing socio-emotional energy for integration, and Stage 5 emphasizing integrated cognitive–emotional vitality for consolidation. In contrast, Stages 3, 4, and 6 require additional data before profile-based decisions are operationalized.
These results have clear implications for sustainable human resource management consistent with the goals of SDG 8. The evidence shows that productivity depends on changing patterns of intelligence interaction, not on static traits. Uniform talent development strategies are therefore ineffective across all stages of the career life cycle. However, practical recommendations should rely primarily on stages with acceptable PCA diagnostics, and the remaining stages require additional data before profile-based decisions are operationalized.
At recruitment, success depends on a balanced assessment of cognitive, emotional, and social abilities supported by vitality and physical readiness. During socialization, emphasis should shift toward social engagement and energy management. For the active work and training–evaluation stages, the current PCA diagnostics are weak; therefore, stage-specific profile prescriptions should be treated as exploratory and confirmed with larger subsamples. In leadership, mature integration of emotional, cognitive, and vitality dimensions supports sustained effectiveness. For the transition stage, the pattern points to stronger reliance on vitality and physical resources, but this inference is cautious due to subthreshold KMO.
Across all stages, emotional intelligence (EQ) remains the most consistent factor, whereas vitality (VQ) appears to recur across multiple stages rather than increasing monotonically from mid-career onward. Across the stages with acceptable PCA adequacy, EQ and VQ recur in the dominant profiles, supporting practical prioritization of emotional regulation and vitality-related capacity building. In the transition stage, the PCA structure suggests a strong vitality–physical axis alongside an inverse cognitive orientation, whereas EQ appears on a separate component; however, this interpretation should be interpreted cautiously because Stage 6 has a subthreshold KMO. Accordingly, claims about the compensatory role of EQ for later-year performance are not supported by PCA alone and should be avoided or framed as indicative only.
These findings suggest that targeted investment in programs for emotional competence, vitality, and energy management yields the most significant long-term benefit. Aligning employee development policies with these dynamic intelligence patterns strengthens individual performance and organizational sustainability, contributing to decent work and inclusive economic growth throughout the professional life cycle.
5. Discussion
The findings of this study reinforce and extend existing research on the relationship between intelligence and employee productivity by demonstrating that productivity is shaped by a dynamic configuration of intelligence dimensions rather than by a single dominant trait. In line with earlier studies emphasizing the importance of emotional intelligence in workplace performance, the results show that emotional intelligence (EQ) remains a consistently significant predictor of productivity in the pooled workforce [16,17,18]. This confirms that the ability to regulate emotions, cope with stress, and manage interpersonal demands is a core competence underpinning sustainable performance across diverse organizational contexts.
At the same time, the present study advances the literature by showing that the influence of intelligence dimensions is strongly contingent on the employee’s career life cycle stage [25,27,34]. While prior research has often treated intelligence–performance relationships as static, the stage-specific regression results demonstrate systematic shifts in dominant productivity drivers. For example, the prominence of cognitive intelligence (IQ) during early career stages aligns with human capital and learning-based models, which emphasize rapid skill acquisition and problem-solving capacity as key determinants of early productivity. Conversely, the increasing relevance of physical intelligence (PQ) during periods of intensive operational work supports findings from occupational health and ergonomics research, which highlight physical resilience and health as critical enablers of sustained work output.
The observed dominance of vitality (VQ) and emotional intelligence (EQ) during socialization and professional growth stages adds nuance to existing frameworks of employee engagement and motivation. These results are consistent with studies that link energy, motivation, and emotional stability to adaptive performance and leadership effectiveness, particularly in environments characterized by high workload and uncertainty. Importantly, the diminishing independent role of social intelligence (SQ) in multivariate models suggests that its productivity-related effects may be mediated through emotional regulation and vitality rather than operating as a standalone determinant. This finding complements recent empirical work indicating that interpersonal effectiveness contributes to performance primarily when embedded within broader emotional and motivational capacities.
The principal component analysis further supports the view that intelligence structures evolve across the career life cycle. Coherent intelligence configurations emerged only at specific stages, which is consistent with developmental theories of careers that emphasize non-linear and context-dependent competence formation. The absence of stable configurations at some stages may reflect transitional or heterogeneous competence demands rather than methodological shortcomings alone. From a theoretical perspective, this challenges universalistic models of talent management and supports contingency-based approaches that align employee development interventions with career-stage requirements.
Overall, the discussion positions the study within the broader literature on sustainable human resource management by demonstrating that productivity-enhancing competencies are neither fixed nor uniform across time. Instead, sustainable productivity depends on the alignment between intelligence development, career stage, and organizational context. By integrating multi-dimensional intelligence theory with life cycle analysis, this study contributes empirical evidence that supports more differentiated, evidence-based HR strategies aimed at long-term employee effectiveness and the achievement of decent work and economic growth.
6. Limitations and Future Research Directions
Despite the theoretical and empirical contributions of this study, several limitations should be acknowledged, which also point to promising avenues for future research:
- PCA adequacy depends on the strength and structure of intercorrelations; therefore, stage-specific solutions may be statistically weak when KMO values are low, and Bartlett’s test is not significant, which limits the reliability of dominant profile interpretation.
- The stability of stage-specific PCA results is sensitive to small-stage subsample sizes, so profiles derived for some stages should be treated as exploratory and validated with larger samples.
- The main limitations of the regression models are sensitivity to multicollinearity among intelligence predictors, potential instability of coefficients in small-stage subsamples, and the risk that omitted contextual factors at the firm or job level may bias estimated associations if not explicitly controlled.
- The study’s main limitations also include the use of the proposed methodology only at Ukrainian construction companies and a limited sample of employees.
Taken together, these limitations do not undermine the validity of the present findings but rather delineate their scope of interpretation. Addressing them through larger samples, longitudinal designs, and cross-cultural validation would substantially strengthen the empirical foundation of multi-dimensional intelligence research and further clarify how health-related and psychological capacities contribute to sustainable employee productivity over the career life cycle.
In further research, it is also essential to investigate the correlation between changes in the values of emotional intelligence, a key type of intelligence in the stages with adequate PCA diagnostics, and employee productivity, which will further confirm the significance of the research results.
7. Conclusions
Long-term employee development and training, employee welfare, and profitability are among the key principles of enterprises’ sustainable development strategies. Employee productivity directly affects the achievement of the UN SDG 8—“Decent work and economic growth”, especially in the context of achieving higher levels of economic productivity (target 8.2) and labor productivity growth rates (indicator 8.2.2).
The article tests a methodology for assessing the association between intelligence types within the five-factor model and employee productivity across six life cycle stages. Based on correlation diagnostics, OLS regression models, and principal component analysis (PCA) implemented in Python, the study identifies stage-related patterns in productivity determinants and extracts stage-specific dominant intelligence profiles.
The regression results indicate that SQ is not a stable independent predictor of productivity level when intelligence dimensions are evaluated jointly. In contrast, EQ and VQ dominate the pooled full-sample specification, with IQ and PQ providing marginal incremental contributions. The results also support the conclusion that productivity increases from Stage 1 to Stage 4 of the life cycle and decreases somewhat in Stages 5 and 6. Stage-specific regressions indicate that the dominant predictors of productivity increases shift across the life cycle, with IQ prevailing at Stage 1, EQ and VQ at Stage 2, PQ at Stage 3, IQ and EQ at Stage 4, IQ and VQ at Stage 5, and PQ at Stage 6.
The PCA profiling results are statistically interpretable mainly for Stages 1, 2, and 5, where KMO values are acceptable, and Bartlett’s test is significant. At Stage 1, the dominant profile is socio-cognitive adaptation combining EQ, IQ, and SQ, complemented by an independent vitality–physical axis. At Stage 2, the dominant profile is socio-emotional vitality combining VQ, SQ, and EQ, while PQ forms a distinct second axis. At Stage 5, the dominant profile is integrated as EQ–IQ–VQ, with SQ and PQ forming a complementary support profile. For Stages 3 and 4, non-significant Bartlett tests indicate that profile statements are exploratory only, and for Stage 6, the subthreshold KMO warrants cautious interpretation despite the indicated vitality–physical axis. Accordingly, it is not entirely correct to claim that EQ is a key factor at all stages without reservation; rather, it is a recurrent component of dominant profiles across stages, as supported by adequate PCA diagnostics, and it remains central in the pooled regression results.
Investments in developing employee competencies contribute to long-term growth and increased enterprise profitability. Therefore, the identification of key types of intelligence according to the stages of the life cycle will allow improving the quality of management activities, individual productivity, and the overall performance of the enterprise, which corresponds to the concept of sustainable development and contributes to the achievement of one of the main goals of sustainable development—SDG 8.
The results obtained can be used to develop human resource management strategies aimed at increasing productivity by fostering the development of different types of intelligence in employees at various stages of their life cycle. Investing in a company’s human capital development increases its profitability, innovation, and competitiveness, thereby contributing to higher economic productivity by enhancing the growth rate of labor productivity (indicator 8.2.2, target 8.2 under SDG 8).
Author Contributions
Conceptualization, L.C., Y.S., D.Z. and N.H.; methodology, L.C., Y.S., D.Z. and S.B.; software, L.C., O.D. and S.B.; validation, L.C., Y.S. and D.Z.; formal analysis, L.C., Y.S. and O.D.; investigation, L.C., Y.S., O.D., D.Z. and S.B.; resources, L.C., Y.S. and O.D.; data curation, L.C., D.Z. and Y.S.; writing—original draft preparation, N.H., Y.S. and D.Z.; writing—review and editing, L.C., O.D. and S.B.; visualization, L.C., Y.S. and N.H.; supervision, D.Z., O.D. and S.B.; project administration D.Z. and O.D. All authors have read and agreed to the published version of the manuscript.
Funding
This research received no external funding.
Institutional Review Board Statement
The study was conducted in accordance with the Declaration of Helsinki and approved by the Ethics Committee of the Academie Council of the Institute of Economies and Management of the Lviv Polytechnic National University (protocol code: Minutes No. 2 dated 16.10.2024 and date of approval: 1 October 2025).
Informed Consent Statement
Informed consent was obtained from all subjects involved in the study.
Data Availability Statement
The data were obtained through assessing the intelligence levels of 105 employees of seven organizations within Ukraine’s construction sector from October to November 2024.
Acknowledgments
During the preparation of this manuscript, the authors used Grammarly Desktop 1.144.1 (Superhuman) and ChatGPT (OpenAI, GPT-5.1 Thinking model) for language polishing and minor text editing, as well as Google Colab (Google, Gemini 2.5 Flash) for Python code debugging and technical refinement. The authors reviewed and edited all AI-assisted outputs and take full responsibility for the final content of this publication.
Conflicts of Interest
The authors declare no conflicts of interest.
Appendix A
Table A1.
Conversion of the five-factor model intelligence scores into stens.
Table A1.
Conversion of the five-factor model intelligence scores into stens.
| Stens | 1 | 2 | 3 | 4 | 5 | 6 | 7 | 8 | 9 |
| IQ | |||||||||
| Range | 0–17 | 18–34 | 35–52 | 53–70 | 71–88 | 89–106 | 107–124 | 125–142 | 143–160 |
| EQ | |||||||||
| Range | 0.00–0.110 | 0.111–0.220 | 0.221–0.330 | 0.331–0.440 | 0.441–0.550 | 0.551–0.660 | 0.661–0.770 | 0.771–0.880 | 0.881–0.990 |
| SQ | |||||||||
| Range | 0–6 | 7–12 | 13–18 | 19–25 | 26–31 | 32–37 | 38–43 | 44–49 | 50–55 |
| PQ | |||||||||
| Range | 2.00–1.78 | 1.77–1.56 | 1.55–1.34 | 1.33–1.12 | 1.11–0.9 | 0.89–0.68 | 0.67–0.46 | 0.45–0.23 | 0.22–0.00 |
| VQ | |||||||||
| Range | 0.0–0.10 | 0.11–0.20 | 0.21–0.30 | 0.31–0.40 | 0.41–0.50 | 0.51–0.60 | 0.61–0.70 | 0.71–0.80 | 0.81–0.90 |
Table A2.
The unified survey’s resulting data for modeling purposes.
Table A2.
The unified survey’s resulting data for modeling purposes.
| Enterprise | Employee * | Productivity (Number of Projects) | IQ (Stens) | EQ (Stens) | SQ (Stens) | PQ (Stens) | VQ (Stens) |
|---|---|---|---|---|---|---|---|
| Stage 1 | |||||||
| A (Bodex LLC) | A6 | 2 | 4 | 4 | 4 | 7 | 8 |
| B (Spetsbudservice LLC) | B5 | 10 | 9 | 8 | 5 | 3 | 7 |
| B (Spetsbudservice LLC) | B6 | 1 | 4 | 4 | 4 | 5 | 4 |
| C (Eco House Holding Company PJSC) | C4 | 3 | 5 | 5 | 5 | 7 | 7 |
| D (Teton Development LLC) | D2 | 6 | 6 | 6 | 6 | 4 | 5 |
| D (Teton Development LLC) | D9 | 11 | 8 | 9 | 6 | 6 | 8 |
| E (Galgazotherm PJSC) | E7 | 8 | 7 | 9 | 7 | 6 | 7 |
| F (Thermobud Kyiv PE) | F10 | 2 | 5 | 4 | 4 | 8 | 5 |
| G (More Form LLC) | G3 | 8 | 8 | 8 | 7 | 3 | 4 |
| G (More Form LLC) | G18 | 7 | 7 | 9 | 6 | 5 | 4 |
| Stage 2 | |||||||
| A (Bodex LLC) | A4 | 5 | 7 | 2 | 8 | 4 | 6 |
| A (Bodex LLC) | A7 | 4 | 6 | 6 | 4 | 7 | 2 |
| B (Spetsbudservice LLC) | B4 | 2 | 5 | 5 | 5 | 4 | 4 |
| B (Spetsbudservice LLC) | B11 | 9 | 6 | 7 | 8 | 8 | 8 |
| C (Eco House Holding Company PJSC) | C9 | 5 | 5 | 4 | 6 | 4 | 6 |
| D (Teton Development LLC) | D7 | 4 | 8 | 4 | 3 | 3 | 3 |
| D (Teton Development LLC) | D8 | 14 | 6 | 8 | 9 | 6 | 8 |
| D (Teton Development LLC) | D11 | 8 | 3 | 7 | 9 | 5 | 9 |
| D (Teton Development LLC) | D12 | 10 | 3 | 9 | 8 | 8 | 8 |
| D (Teton Development LLC) | D18 | 5 | 4 | 6 | 6 | 7 | 6 |
| E (Galgazotherm PJSC) | E1 | 6 | 8 | 6 | 5 | 7 | 6 |
| E (Galgazotherm PJSC) | E6 | 5 | 6 | 4 | 5 | 5 | 5 |
| E (Galgazotherm PJSC) | E8 | 13 | 2 | 8 | 7 | 3 | 8 |
| E (Galgazotherm PJSC) | E16 | 11 | 1 | 8 | 9 | 4 | 9 |
| E (Galgazotherm PJSC) | E17 | 10 | 6 | 7 | 7 | 1 | 9 |
| F (Thermobud Kyiv PE) | F4 | 1 | 6 | 4 | 3 | 9 | 3 |
| F (Thermobud Kyiv PE) | F7 | 7 | 3 | 6 | 5 | 8 | 6 |
| F (Thermobud Kyiv PE) | F13 | 2 | 5 | 2 | 4 | 4 | 5 |
| F (Thermobud Kyiv PE) | F14 | 5 | 6 | 7 | 6 | 3 | 5 |
| G (More Form LLC) | G14 | 8 | 4 | 7 | 8 | 7 | 7 |
| Stage 3 | |||||||
| A (Bodex LLC) | A1 | 5 | 7 | 5 | 6 | 4 | 2 |
| A (Bodex LLC) | A2 | 4 | 9 | 6 | 6 | 8 | 4 |
| A (Bodex LLC) | A12 | 11 | 6 | 4 | 7 | 9 | 8 |
| B (Spetsbudservice LLC) | B1 | 6 | 7 | 5 | 7 | 7 | 6 |
| C (Eco House Holding Company PJSC) | C1 | 6 | 8 | 7 | 6 | 6 | 6 |
| D (Teton Development LLC) | D1 | 7 | 4 | 7 | 4 | 6 | 6 |
| D (Teton Development LLC) | D10 | 11 | 3 | 8 | 8 | 8 | 7 |
| D (Teton Development LLC) | D16 | 11 | 7 | 9 | 3 | 9 | 3 |
| E (Galgazotherm PJSC) | E9 | 1 | 5 | 4 | 5 | 3 | 4 |
| E (Galgazotherm PJSC) | E13 | 4 | 5 | 3 | 9 | 5 | 8 |
| F (Thermobud Kyiv PE) | F9 | 4 | 3 | 4 | 2 | 7 | 3 |
| G (More Form LLC) | G2 | 13 | 7 | 7 | 1 | 8 | 5 |
| G (More Form LLC) | G4 | 5 | 5 | 6 | 3 | 4 | 3 |
| G (More Form LLC) | G6 | 7 | 6 | 8 | 8 | 6 | 7 |
| G (More Form LLC) | G7 | 4 | 4 | 4 | 6 | 6 | 9 |
| G (More Form LLC) | G15 | 9 | 6 | 7 | 5 | 8 | 4 |
| G (More Form LLC) | G16 | 2 | 3 | 3 | 8 | 4 | 2 |
| Stage 4 | |||||||
| A (Bodex LLC) | A5 | 11 | 3 | 9 | 2 | 5 | 5 |
| A (Bodex LLC) | A10 | 9 | 6 | 3 | 7 | 7 | 8 |
| A (Bodex LLC) | A11 | 6 | 3 | 3 | 7 | 6 | 4 |
| B (Spetsbudservice LLC) | B3 | 12 | 7 | 7 | 6 | 5 | 6 |
| B (Spetsbudservice LLC) | B8 | 13 | 7 | 8 | 6 | 6 | 4 |
| B (Spetsbudservice LLC) | B12 | 12 | 8 | 7 | 7 | 8 | 7 |
| C (Eco House Holding Company PJSC) | C5 | 14 | 6 | 9 | 5 | 3 | 5 |
| C (Eco House Holding Company PJSC) | C6 | 12 | 5 | 8 | 3 | 2 | 7 |
| D (Teton Development LLC) | D3 | 12 | 9 | 8 | 6 | 4 | 6 |
| D (Teton Development LLC) | D4 | 8 | 6 | 5 | 7 | 4 | 5 |
| D (Teton Development LLC) | D15 | 10 | 5 | 5 | 4 | 9 | 6 |
| E (Galgazotherm PJSC) | E2 | 11 | 5 | 7 | 8 | 8 | 5 |
| E (Galgazotherm PJSC) | E3 | 9 | 4 | 8 | 8 | 5 | 5 |
| E (Galgazotherm PJSC) | E14 | 2 | 4 | 4 | 4 | 7 | 4 |
| F (Thermobud Kyiv PE) | F1 | 5 | 3 | 4 | 3 | 6 | 4 |
| F (Thermobud Kyiv PE) | F2 | 7 | 5 | 5 | 7 | 3 | 7 |
| F (Thermobud Kyiv PE) | F6 | 12 | 8 | 8 | 6 | 6 | 5 |
| G (More Form LLC) | G8 | 8 | 6 | 6 | 4 | 7 | 8 |
| G (More Form LLC) | G12 | 14 | 8 | 8 | 9 | 7 | 7 |
| G (More Form LLC) | G17 | 12 | 7 | 8 | 1 | 9 | 6 |
| G (More Form LLC) | G20 | 3 | 2 | 4 | 4 | 6 | 5 |
| Stage 5 | |||||||
| A (Bodex LLC) | A3 | 10 | 7 | 6 | 7 | 7 | 7 |
| A (Bodex LLC) | A9 | 14 | 9 | 7 | 3 | 8 | 9 |
| A (Bodex LLC) | A13 | 5 | 1 | 5 | 3 | 6 | 6 |
| A (Bodex LLC) | A14 | 9 | 4 | 6 | 5 | 3 | 6 |
| B (Spetsbudservice LLC) | B2 | 10 | 9 | 7 | 8 | 8 | 5 |
| B (Spetsbudservice LLC) | B9 | 9 | 6 | 7 | 6 | 7 | 5 |
| C (Eco House Holding Company PJSC) | C2 | 8 | 4 | 8 | 8 | 5 | 6 |
| C (Eco House Holding Company PJSC) | C3 | 5 | 6 | 5 | 2 | 3 | 3 |
| C (Eco House Holding Company PJSC) | C8 | 10 | 8 | 7 | 3 | 7 | 5 |
| D (Teton Development LLC) | D6 | 14 | 8 | 8 | 5 | 7 | 7 |
| D (Teton Development LLC) | D13 | 13 | 8 | 8 | 7 | 4 | 7 |
| D (Teton Development LLC) | D14 | 9 | 8 | 6 | 5 | 2 | 8 |
| E (Galgazotherm PJSC) | E4 | 6 | 6 | 5 | 7 | 6 | 4 |
| E (Galgazotherm PJSC) | E5 | 4 | 4 | 4 | 7 | 5 | 3 |
| E (Galgazotherm PJSC) | E11 | 9 | 7 | 5 | 4 | 3 | 6 |
| E (Galgazotherm PJSC) | E12 | 14 | 9 | 8 | 9 | 8 | 8 |
| F (Thermobud Kyiv PE) | F3 | 5 | 4 | 5 | 7 | 9 | 3 |
| F (Thermobud Kyiv PE) | F8 | 10 | 8 | 8 | 5 | 5 | 7 |
| F (Thermobud Kyiv PE) | F11 | 11 | 8 | 9 | 5 | 3 | 6 |
| G (More Form LLC) | G1 | 9 | 7 | 7 | 4 | 2 | 5 |
| G (More Form LLC) | G5 | 14 | 8 | 7 | 2 | 8 | 8 |
| G (More Form LLC) | G10 | 13 | 9 | 8 | 4 | 7 | 6 |
| G (More Form LLC) | G11 | 7 | 6 | 5 | 2 | 5 | 4 |
| G (More Form LLC) | G13 | 6 | 4 | 4 | 7 | 3 | 3 |
| G (More Form LLC) | G19 | 6 | 5 | 3 | 7 | 5 | 4 |
| Stage 6 | |||||||
| A (Bodex LLC) | A8 | 7 | 6 | 5 | 3 | 6 | 4 |
| B (Spetsbudservice LLC) | B7 | 3 | 6 | 5 | 7 | 4 | 3 |
| B (Spetsbudservice LLC) | B10 | 11 | 6 | 7 | 6 | 8 | 7 |
| C (Eco House Holding Company PJSC) | C7 | 8 | 4 | 6 | 8 | 6 | 6 |
| D (Teton Development LLC) | D5 | 11 | 6 | 7 | 3 | 7 | 8 |
| D (Teton development LLC) | D17 | 14 | 1 | 7 | 6 | 8 | 9 |
| D (Teton Development LLC) | D19 | 5 | 5 | 4 | 9 | 6 | 5 |
| E (Galgazotherm PJSC) | E10 | 4 | 4 | 4 | 5 | 4 | 5 |
| E (Galgazotherm PJSC) | E15 | 9 | 7 | 6 | 4 | 6 | 6 |
| F (Thermobud Kyiv PE) | F5 | 2 | 9 | 8 | 4 | 3 | 3 |
| F (Thermobud Kyiv PE) | F12 | 14 | 4 | 5 | 6 | 9 | 9 |
| G (More Form LLC) | G9 | 8 | 2 | 5 | 2 | 6 | 6 |
* Ai—the i-th employee of enterprise A (Bodex LLC); Bi—the i-th employee of enterprise B (Spetsbudservice LLC); Ci—the i-th employee of enterprise C (Eco House Holding Company PJSC); Di—the i-th employee of enterprise D (Teton Development LLC); Ei—the i-th employee of enterprise E (Galgazotherm PJSC); Fi—the i-th employee of enterprise F (Thermobud Kyiv PE); Gi—the i-th employee of enterprise G (More Form LLC).
References
- Pujianto, S. Effectiveness of Employee Training and Development in Increasing Productivity and Innovation in Multinational Companies. Glob. Int. J. Innov. Res. 2024, 2, 2245–2256. [Google Scholar] [CrossRef]
- Noe, R.A. Employee Training and Development. McGraw-Hill. 2010. Available online: https://www.academia.edu/111032460/Employee_Training_and_Development (accessed on 9 January 2025).
- Utami, F.N.; Lubis, F.R.A.; Rahman, H.Y. Determinants of Manufacturing Industry Labor Productivity in Indonesia (Case Study of 2018–2022). In An Integrated Social Science, Technology, and Innovation for Empowering Society 5.0, Proceedings of International Conference on Management and Business Innovation for Empowering Society, Online, September 2024; Universitas Ahmad Dahlan: Yogyakarta, Indonesia, 2024; Volume 1, Available online: https://seminar.uad.ac.id/index.php/ICOMBIES/article/view/14457/5401 (accessed on 9 January 2025).
- Barasa, L. An Empirical Study on the Influence of Internal and External Factors on Port Enterprise Employee Performance: A Case Study in Indonesia. J. ETA Marit. Sci. 2023, 11, 290–303. [Google Scholar] [CrossRef]
- OECD. OECD Compendium of Productivity Indicators 2023; OECD Publishing: Paris, France, 2023. [Google Scholar] [CrossRef]
- OECD. OECD Compendium of Productivity Indicators 2024; OECD Publishing: Paris, France, 2024. [Google Scholar] [CrossRef]
- Goleman, D. Emotional Intelligence: Why It Can Matter More than IQ; Bantam Books: New York, NY, USA, 1995; Available online: https://learnsteer.sasnaka.org/wp-content/uploads/2022/07/Emotional%20Intelligence%20Why%20it%20Can%20Matter%20More%20Than%20IQ%20%28Daniel%20Goleman%29%20%28z-lib.org%29.pdf (accessed on 9 January 2025).
- Bradberry, T.; Greaves, J. Emotional Intelligence 2.0. TalentSmart. 2009. Available online: https://www.academia.edu/45269018/Travis_Bradberry_Jean_Greaves_Emotional_Intelligence_2_0_TalentSmart_2009_1 (accessed on 9 January 2025).
- Roback, A.A. Intelligence and Intellect. J. Philos. 1922, 19, 325–330. [Google Scholar] [CrossRef]
- Sternberg, R.J. Beyond IQ: A Triarchic Theory of Human Intelligence; Cambridge University Press: Cambridge, UK, 1985; Available online: https://psycnet.apa.org/record/1985-97046-000 (accessed on 9 January 2025).
- Nonaka, I.; Takeuchi, H. The Knowledge-Creating Company: How Japanese Companies Create the Dynamics of Innovation; Oxford University Press: New York, NY, USA, 1995; 284p. [Google Scholar]
- Chernobai, L.I.; Shiron, Y.O.; Basiy, I.T. Theoretical Aspects of Forming an Individual Five-Factor Model of Employee Intelligence. In Behavioral Economics: From Theory to Practice; 2022; Volume 6, pp. 251–264. Available online: https://financial.lnu.edu.ua/wp-content/uploads/2022/11/PovedinkovaEKONOMIKA-2022-1.pdf (accessed on 9 January 2025).
- Shiron, Y.O. Socio-Psychological Management of an Enterprise. Ph.D. Thesis, Lviv Polytechnic National University, Lviv, Ukraine, 2024. Available online: https://lpnu.ua/sites/default/files/2024/radaphd/27005/disert-shiron.pdf (accessed on 9 January 2025).
- Chernobai, L.I.; Shiron, Y.O. Systematization of Socio-Psychological Management Methods Based on the Employee Life Cycle. Int. Sci. J. “Internauka” Ser. Econ. Sci. 2021, 7, 18–29. [Google Scholar] [CrossRef]
- Melnyk, M.; Ivaniuk, U.; Leshchukh, I.; Halkiv, L. The sustainable development and resilience of socio-economic system: Conceptualization and diagnostics of problems in conditions of global challenges and shocks. Int. J. Sustain. Dev. Plan. 2023, 18, 1035–1043. [Google Scholar] [CrossRef]
- Naveed, A.; Wang, C. Innovation and Labour Productivity Growth Moderated by Structural Change: Analysis in a Global Perspective. Technovation 2022, 119, 102554. [Google Scholar] [CrossRef]
- Zhu, M.; Liang, C.; Yeung, A.C.L.; Zhou, H. The Impact of Intelligent Manufacturing on Labor Productivity: An Empirical Analysis of Chinese Listed Manufacturing Companies. Int. J. Prod. Econ. 2024, 267, 109070. [Google Scholar] [CrossRef]
- Aziri, J. Employee Motivation Incentives and Their Impact on the Organization’s Productivity. Texila Int. J. Manag. 2019, 5, 1–6. [Google Scholar] [CrossRef]
- Kuswati, Y. The Effect of Motivation on Employee Performance. Bp. Int. Res. Crit. Inst. 2020, 3, 995–1002. [Google Scholar] [CrossRef]
- Ptashchenko, O.; Chernobay, L.; Malykhina, S.; Verezomska, I.; Yaremchuk, S. Problems and Prospects of Application of Strategies of Personnel Management of International Companies in Ukrainian Business Practice. Financ. Credit. Act. Probl. Theory Pract. 2022, 1, 406–414. [Google Scholar]
- Slivinski, L.; Donoghue, E.; Chadwick, M.; Ducharme, F.A.; Gavin, D.W.; Lorimer, A.; McSheffrey, R.; Miles, J.; Morry, G. The Wholistic Competency Profile: A Model; Staffing Policy and Program Development Directorate, Public Service Commission of Canada: Ottawa, ON, Canada, 1996; Available online: https://www.researchgate.net/publication/305379157_The_Wholistic_Competency_Profile_A_Model_LW_Slivinski_Jennifer_Miles_1997_6_parts (accessed on 9 January 2025).
- Wijayanto, B.K.; Riani, A.L. The Influence of Work Competency and Motivation on Employee Performance. Society 2021, 9, 83–93. [Google Scholar] [CrossRef]
- Kim, J.; Jung, H.-S. The Effect of Employee Competency and Organizational Culture on Employees’ Perceived Stress for Better Workplace. Int. J. Environ. Res. Public Health 2022, 19, 4428. [Google Scholar] [CrossRef] [PubMed]
- Kim, Y.E.; Loayza, N.V.; Meza Cuadra Balcazar, C.M. Productivity as the Key to Economic Growth and Development; Research & Policy Briefs 2016, 3; World Bank Group: Washington, DC, USA, 2016; Available online: http://documents.worldbank.org/curated/en/314741472533203058 (accessed on 9 January 2025).
- Foláyan, M.O.; Amalia, R.; Kemoli, A.; Ayouni, I.; Nguweneza, A.; Duangthip, D.; Sun, I.G.; Virtanen, J.I.; Masumo, R.M.; Vukovic, A.; et al. Scoping Review on the Link between Economic Growth, Decent Work, and Early Childhood Caries. BMC Oral Health 2024, 24, 77. [Google Scholar] [CrossRef] [PubMed]
- Beltozar-Clemente, S.; Iparraguirre-Villanueva, O.; Pucuhuayla-Revatta, F.; Sierra-Liñan, F.; Zapata-Paulini, J.; Cabanillas-Carbonell, M. Contributions of the 5G Network with Respect to Decent Work and Economic Growth (Sustainable Development Goal 8): A Systematic Review of the Literature. Sustainability 2023, 15, 15776. [Google Scholar] [CrossRef]
- Rozlan, N.Z.; Subramaniam, G.A. The Impact of Flexible Working Arrangements on Millennials: A Conceptual Analysis. Int. J. Acad. Res. Bus. Soc. Sci. 2020, 7, 938–948. [Google Scholar] [CrossRef]
- Zhang, J.H.; Ramke, J.; Jan, C.; Bascaran, C.; Mwangi, N.; Furtado, J.M.; Yasmin, S.; Ogundo, C.; Yoshizaki, M.; Marques, A.P.; et al. Advancing the Sustainable Development Goals Through Improving Eye Health: A Scoping Review. Lancet Planet. Health 2022, 6, e270–e280. [Google Scholar] [CrossRef]
- Hrinchenko, H.S.; Nehodov, S.S.; Mazorchuk, K.K.; Hrinchenko, V.V.; Trishch, Y.V. Qualimetric Assessment of Sustainable Development Indicators: Goal 8. Decent Work and Economic Growth. Metrol. Inf.-Meas. Technol. 2024, 32, 14–28. [Google Scholar] [CrossRef]
- Kiziloglu, M.; Dluhopolskyi, O.; Koziuk, V.; Vitvitskyi, S.; Kozlovskyi, S. Dark personality traits and job performance of employees: The mediating role of perfectionism, stress, and social media addiction. Probl. Perspect. Manag. 2021, 19, 533–544. [Google Scholar] [CrossRef]
- Kızıloğlu, M.; Kircaburun, K.; Özsoy, E.; Griffiths, M.D. Work addiction and its relation with dark personality traits: A cross-sectional study with private sector employees. Int. J. Ment. Health Addict. 2024, 22, 2056–2072. [Google Scholar] [CrossRef]
- Lubis, A.Y.; Tjahjono, H.K.; Wahyuningsih, R.S.H. Literature Review of the Connection between Emotional Intelligence and Employee Performance in Organizations. Multidiscip. Rev. 2023, 6, e2023048. [Google Scholar] [CrossRef]
- Parra-Martinez, F.A.; Desmet, O.A.; Wai, J. The Evolution of Intelligence: Analysis of the Journal of Intelligence and Intelligence. J. Intell. 2023, 11, 35. [Google Scholar] [CrossRef]
- Mate, C. Influence of Leadership, Intellectual Ability, and Work Environment on Employee Performance. J. Bus. Manag. Econ. Dev. 2023, 1, 17–25. [Google Scholar] [CrossRef]
- Turner, B.O.; Marinsek, N.; Ryhal, E.; Miller, M.B. Hemispheric Lateralization in Reasoning. Ann. N. Y. Acad. Sci. 2015, 1359, 47–64. [Google Scholar] [CrossRef]
- Gardner, H. Frames of Mind: The Theory of Multiple Intelligences; Basic Books: New York, NY, USA, 1983; Available online: https://dspace.sxcjpr.edu.in/jspui/bitstream/123456789/720/1/Howard%20Gardner%20-%20Frames%20of%20Mind_%20The%20Theory%20of%20Multiple%20Intelligences-Basic%20Books%20%282011%29%20%281%29.pdf (accessed on 9 January 2025).
- Soebyakto, B.B.; Ming, C.W. An Empirical Testing of Intelligence, Emotional and Spiritual Quotients Quality of Managers Using Structural Equation Modeling. Int. J. Indep. Res. Stud. 2012, 1, 1–12. [Google Scholar]
- Gage, T.; Smith, C. Leadership Intelligence: Unlocking the Potential for School Leadership Effectiveness. South Afr. J. Educ. 2016, 36, 9. [Google Scholar] [CrossRef]
- Effendi, M. Correlation between Adversity Quotient (AQ) with IQ, EQ, and SQ among Polytechnic Students Using Rasch Model. Indian J. Sci. Technol. 2016, 9, 1–8. [Google Scholar] [CrossRef]
- Cass, P. The Key Quality of a Leader Is Energy, Not Intelligence. 2010. Available online: https://www.management.com.ua/notes/vq_management.html?print (accessed on 9 January 2025).
- Albrecht, K. Social Intelligence: The New Science of Success; John Wiley & Sons: Hoboken, NJ, USA, 2009; Available online: https://www.asecib.ase.ro/mps/Social%20Intelligence_The%20New%20Science%20of%20Success%20%5b2006%5d.pdf (accessed on 9 January 2025).
- Green, W.M.; Leonard, E. Leadership and Leadership Intelligence. J. Sch. Leadersh. 2019, 29, 14–45. [Google Scholar] [CrossRef]
- Biswas, R. Adversity Quotient (A.Q): A Review of Related Literature Along with Literature Matrix. Int. J. Res. Anal. Rev. 2018, 5, 936–958. Available online: https://www.researchgate.net/publication/342241355_Adversity_Quotient_AQ_A_Review_of_Related_Literature_along_with_Literature_Matrix (accessed on 9 January 2025).
- Baharun, H.; Adhimah, S. Adversity Quotient: Complementary Intelligence in Establishing Mental Endurance Santri in Pesantren. J. Ilm. Islam Futur. 2019, 19, 128. [Google Scholar] [CrossRef]
- Snyder, A.; Mitchell, J.; Bossomaier, T.; Gerry, P. The Creativity Quotient: An Objective Scoring of Ideational Fluency. Creat. Res. J. 2004, 16, 415–420. [Google Scholar] [CrossRef]
- Siphai, S. Influences of Moral, Emotional and Adversity Quotient on Good Citizenship of Rajabhat University’s Students in the Northeast of Thailand. Acad. J. 2015, 10, 2413–2421. [Google Scholar] [CrossRef]
- Thiengkamol, N. Model of IQ, MQ and Environmental Education Affecting Environmental Behavior. Silpakorn Univ. J. Soc. Sci. Humanit. Arts 2015, 17, 215–238. [Google Scholar] [CrossRef]
- Kamil, N.S.S.N.; Musa, R.; Sahak, S.Z. Examining the Role of Financial Intelligence Quotient (FiQ) in Explaining Credit Card Usage Behavior: A Conceptual Framework. Procedia-Soc. Behav. Sci. 2014, 130, 568–576. [Google Scholar] [CrossRef]
- Gladka, O.; Fedorova, V.; Dohadailo, Y. Development of conceptual bases of the employee life cycle within an organization. Bus. Theory Pract. 2022, 23, 39–52. [Google Scholar] [CrossRef]
- Marinković, D.; Stojadinović, Z.; Ivanišević, N. Work cycle-based scheduling. Građevinar 2013, 65, 993–1002. [Google Scholar] [CrossRef]
- Smither, L. Managing Employee Life Cycles to Improve Labour Retention. Leadersh. Manag. Eng. 2003, 3, 19–23. [Google Scholar] [CrossRef]
- Shyam, B.R.; Ramachandra Gowda, N.A. Comparative Study of Dynamic Nature of Product Life Cycle Stimulating Employee Life Cycle. Adarsh J. Manag. Res. 2015, 8, 21–24. [Google Scholar] [CrossRef]
- Verive, J.M.; DeLay, N. Measuring Telework ROI: Metrics Based on the Employee Life Cycle. World Work. J. 2006, 15, 6–15. Available online: http://www.telecommutingadvantage.com/pdfs/news_and_research/Measuring_Telework_ROI___Metrics_Based_on_the_Employee_Life_Cycle[1].pdf (accessed on 9 January 2025).
- Tuomi, A.; Ascenção, M.P. Algorithmic Control Across the Employee Lifecycle. In Information and Communication Technologies in Tourism 2024, Proceedings of the ENTER 2024 International eTourism Conference, Izmir, Türkiye, 17–19 January 2024; Berezina, K., Nixon, L., Tuomi, A., Eds.; Springer Proceedings in Business and Economics; Springer: Cham, Switzerland, 2024. [Google Scholar] [CrossRef]
- World Health Organization. Constitution of the World Health Organization 1948. Available online: https://www.who.int/about/governance/constitution (accessed on 9 January 2025).
- Mehmood, A.; Siddique, H.M.A.; Ali, A. Impact of Health on Worker Productivity: Evidence from South Asia. Bull. Bus. Econ. 2022, 11, 1–8. Available online: https://bbejournal.com/index.php/BBE/article/view/365/1267 (accessed on 9 January 2025).
- Tompa, E. The Impact of Health on Productivity: Empirical Evidence and Policy Implications. In The Review of Economic Performance and Social Progress 2002: Towards a Social Understanding of Productivity; McGill-Queen’s University Press: Montreal, QC, Canada, 2002; Volume 22, pp. 181–202. Available online: http://www.csls.ca/repsp/2/emiletompa.pdf (accessed on 9 January 2025).
- Dormont, B.; Martins, J.O.; Pelgrin, F.; Suhrcke, M. The Impact of Health on Productivity and Growth. In Ageing, Health, and Productivity: The Economics of Increased Life Expectancy; Oxford University Press: Oxford, UK, 2010; pp. 73–94. [Google Scholar] [CrossRef]
- Capio, C.M.; Sit, C.H.P.; Abernethy, B. Physical Well-Being. In Encyclopedia of Quality of Life and Well-Being Research; Michalos, A.C., Ed.; Springer: Dordrecht, The Netherlands, 2014. [Google Scholar] [CrossRef]
- Serdyuk, L.Z. Structure and Function of Psychological Well-Being of an Individual. Current Issues of Psychology. Collection of Scientific Papers of the H.S. Kostiuk Institute of Psychology of the National Academy of Pedagogical Sciences of Ukraine. 2017, 17, 124–133. Available online: https://lib.iitta.gov.ua/id/eprint/709129/1/%D0%A1%D0%B5%D1%80%D0%B4%D1%8E%D0%BA%201.pdf (accessed on 9 January 2025).
- Danylchenko, T. Subjective Social Well-Being as a Psychological Phenomenon. Psychol. Prospect. J. 2016, 28, 93–107. [Google Scholar] [CrossRef]
- Beci, E.L.; Ryan, R.M. Self-determination theory: A macrotheory of human motivation, development, and health. Can. Psychol./Psychol. Can. 2008, 49, 182–185. [Google Scholar] [CrossRef]
- Nix, G.A.; Ryan, R.M.; Manly, J.B.; Deci, E.L. Revitalization through Self-Regulation: The Effects of Autonomous and Controlled Motivation on Happiness and Vitality. J. Exp. Soc. Psychol. 1999, 35, 266–284. [Google Scholar] [CrossRef]
- Chernobay, L.; Shyron, Y. The Essence of Labor Activity Motivation and Types of Motives. Current State and Prospects for the Development of Economics, Finance, Accounting, Management, and Law: Collection of Abstracts from the International Scientific and Practical Conference (May 11, 2019, Poltava); CFEND: Poltava, Ukraine, 2019; pp. 46–48. Available online: https://www.economics.in.ua/2019/05/7.html (accessed on 9 January 2025).
- Japor, E.J. Organizational career growth: Literature review and future agenda. Int. J. Bus. Adm. Stud. 2021, 7, 12–24. [Google Scholar] [CrossRef]
- Chernobay, L.; Karska, E.; Shiron, Y. Employees’ Types of Intelligence Assessment Method in Accordance with the Elements of the Five-Factor Model Considering Life Cycle Stage. Econ. Entrep. Manag. 2022, 9, 26–33. [Google Scholar] [CrossRef]
- Shiron, Y.O. MSCEIT Emotional Intelligence Test: Description, Validation, and Adaptation. Halytskyi Econ. Bull. 2022, 74, 141–151. [Google Scholar] [CrossRef]
- O’Sullivan, M.; Guilford, J. Six Factors of Behavioral Cognition: Understanding Other People. J. Educ. Meas. 1975, 12, 255–271. [Google Scholar] [CrossRef]
- Yoon, S.I.; Park, H.Y.; Chung, S.Y.; Kim, J.W. Development and validation of the Integrative Vitality Scale. Front. Public Health 2024, 12, 1452068. [Google Scholar] [CrossRef]
- Mykhaliuk, Y.L.; Cherepok, O.O.; Malakhova, S.M. Biological Age and Quantitative Assessment of Human Physical Health Levels: Textbook. ZDMU. 2013. Available online: http://dspace.zsmu.edu.ua/bitstream/123456789/2842/1/MyhaljukJeL13_Biolog_vtkorfi_zdlj.pdf (accessed on 9 January 2025).
- Zelinskyi, S.E. Theoretical and Methodological Foundations of Comprehensive Assessment of Civil Servants: Monograph; NAPA: Kyiv, Ukraine, 2016. Available online: https://center.kr-admin.gov.ua/monog.pdf (accessed on 9 January 2025).
- YouControl. LLC PTP “Bodeks”. Available online: https://youcontrol.com.ua/catalog/company_details/36248962/ (accessed on 23 March 2025).
- YouControl. LLC Spetsbudservice. Available online: https://youcontrol.com.ua/catalog/company_details/31704427/ (accessed on 23 March 2025).
- YouControl. PJSC “Holding Company ‘EKO DIM’”. Available online: https://youcontrol.com.ua/catalog/company_details/05393518/ (accessed on 23 March 2025).
- YouControl. LLC “Teton Development”. Available online: https://youcontrol.com.ua/catalog/company_details/41856489/ (accessed on 23 March 2025).
- YouControl. PE “Termobud Kyiv”. Available online: https://youcontrol.com.ua/catalog/company_details/33699440/ (accessed on 23 March 2025).
- YouControl. PJSC “Halgazoterm”. Available online: https://youcontrol.com.ua/ru/catalog/company_details/30336068/ (accessed on 23 March 2025).
- YouControl. LLC “More Form”. Available online: https://youcontrol.com.ua/catalog/company_details/43118238/ (accessed on 23 March 2025).
- Zherlitsyn, D. Financial Data Analysis Using Python; Mercury Learning and Information: Berlin, Germany, 2024. [Google Scholar] [CrossRef]
- Tabachnick, B.G.; Fidell, L.S. Using Multivariate Statistics, 7th ed.; Pearson: London, UK, 2019. [Google Scholar]
Disclaimer/Publisher’s Note: The statements, opinions and data contained in all publications are solely those of the individual author(s) and contributor(s) and not of MDPI and/or the editor(s). MDPI and/or the editor(s) disclaim responsibility for any injury to people or property resulting from any ideas, methods, instructions or products referred to in the content. |
© 2025 by the authors. Licensee MDPI, Basel, Switzerland. This article is an open access article distributed under the terms and conditions of the Creative Commons Attribution (CC BY) license.