Abstract
Integrating connected and autonomous vehicle dedicated lanes (CAVDLs) into existing road networks under mixed traffic conditions presents a complex challenge, often requiring a balance of multiple conflicting objectives. This study develops a dynamic multi-objective optimization framework, formulated as a mixed-integer nonlinear programming problem, to determine the optimal network-wide deployment of CAVDLs. The framework integrates three core components: an endogenous demand model capturing connected and autonomous vehicle (CAV)/human-driven vehicle (HDV) mode choice, a multi-class dynamic traffic assignment model that adjusts lane capacity based on CAV-HDV interactions, and an NSGA-III algorithm that minimizes total system travel time, total emissions, and construction costs. Results of a case study indicate the following: (i) sensitivity analysis confirms that user value of time is the most critical factor affecting CAV adoption; the model’s endogenous consideration of this variable ensures alignment between CAVDL layouts and actual demand; (ii) the proposed Pareto-optimal solution reduces total travel time and emissions by approximately 31% compared to a no-CAVDL scenario, while cutting construction costs by 23.5% against a single-objective optimization; (iii) CAVDLs alleviate congestion by reducing bottleneck duration and peak density by 36.4% and 16.3%, respectively. The developed framework provides a novel and practical decision-support tool that explicitly quantifies the trade-offs among traffic efficiency, environmental impact, and infrastructure cost for sustainable transportation planning.
1. Introduction
The integration of connected and autonomous vehicles (CAVs) into existing transportation networks promises a new era of mobility, with the potential to significantly enhance road capacity, improve traffic flow stability, and reduce accidents through precise, coordinated driving behaviors [1,2,3]. However, the transition to a fully autonomous fleet will be prolonged, during which mixed traffic flows comprising both CAVs and human-driven vehicles (HDVs) will become the norm [4]. In such mixed environments, the benefits of CAVs are often diluted by the unpredictable and heterogeneous nature of HDV driving behaviors [5].
Connected and autonomous vehicle dedicated lanes (CAVDLs) have been proposed as a critical infrastructure-based strategy to mitigate this issue. By physically segregating CAVs from HDVs, CAVDLs provide a protected environment for CAVs to operate at their optimal performance, thereby increasing overall network capacity and stability [6]. Nevertheless, the implementation of CAVDLs is not inherently beneficial. It presents a complex network design problem that requires navigating critical trade-offs among multiple, often conflicting, objectives: improving traffic efficiency, minimizing environmental impact, and controlling infrastructure construction costs.
While existing studies have explored various technological and policy initiatives for CAVDL deployment [7,8,9], several key limitations remain prevalent. The planning of CAVDLs falls within the broader domain of discrete network design problems. Early studies in this field predominantly rely on static traffic assignment frameworks, which model user route choices under steady-state conditions [10,11,12]. For instance, Liu and Song [10] formulate a user equilibrium problem as a variational inequality to develop a robust optimization model for CAVDL deployment. While valuable, STA frameworks inherently fail to capture complex dynamic traffic phenomena such as queue formation and time-dependent flow propagation [13]. This limitation restricts their ability to accurately reflect real-world traffic dynamics in mixed CAV and HDV environments.
In response to the limitations of static models, researchers have turned to dynamic traffic assignment (DTA) models [14,15,16]. Chakraborty et al. [14], for example, propose a system optimal DTA framework to determine the optimal design of CAVDLs in highway networks, integrating time-dependent flow dynamics. Ngoduy et al. [15] further advance this line of research with a multi-class DTA framework that considers time- and space-varying routing behaviors. Despite these advancements, key limitations persist. Some studies adopt simplified capacity models for CAVDLs that do not fully capture dynamic adjustments caused by vehicle interactions [14]. Moreover, a common practice is to model the CAV penetration rate as an exogenous input [15], thereby omitting the critical feedback loop in which travel time savings from CAVDLs endogenously influence travelers’ mode choice and subsequent network demand.
Recent advances in multi-objective evolutionary algorithms have provided powerful tools for solving complex network design problems. Hybrid genetic algorithms, such as MA-HCAGA, CBHPSO, and PSO-GWO, have demonstrated improved convergence and diversity in related infrastructure optimization studies [17,18]. While these methods offer computational advantages in certain contexts, NSGA-III is selected in this study for its proven ability to maintain a well-distributed Pareto front in problems with three or more objectives, which is essential for evaluating the trade-offs among travel time, emissions, and cost in CAVDL deployment.
Beyond the limitations in traffic modeling, a substantial part of the existing CAVDL literature focuses on single-objective optimization. Numerous studies prioritize a single performance metric, such as minimizing total vehicle emissions [19] or system-wide travel time [14,20]. Illustrative examples include the bi-level model by Seilabi et al. [19] that minimizes emissions under CAV demand uncertainty and the work of Kumar et al. [20] focusing solely on travel time minimization. While these studies offer valuable insights into specific dimensions of network performance, their singular focus provides limited practical guidance for infrastructure planners, who must navigate complex trade-offs among traffic performance, economic viability, and environmental sustainability.
To bridge these critical gaps, this study develops an integrated dynamic modeling and optimization framework that formulates the network-wide design of CAVDLs as a multi-objective mixed-integer nonlinear programming (MO-MINLP) problem. The framework’s contribution is threefold: it incorporates an endogenous demand model to capture the feedback between CAVDL benefits and traveler mode choice, a multi-class dynamic traffic assignment model that reflects time-varying lane capacity governed by CAV-HDV interactions, and a multi-objective optimization scheme that generates Pareto-optimal solutions. This integrated approach explicitly quantifies the trade-offs among system travel time, vehicle emissions, and construction costs, thereby simultaneously addressing the key limitations of static demand, exogenous mode choice, and single-objective optimization.
The remainder of this paper is structured as follows: The Section 3 details the fundamental diagram for mixed traffic flow and the formulation of the proposed optimization model. The Section 4 presents numerical experiments on the Sioux Falls network, analyzing model performance, parameter sensitivity, and congestion dynamics. The Section 5 summarizes the findings and proposes directions for future research.
2. Preliminary
Figure 1 depicts the integrated modeling and optimization framework of this study. The framework consists of two main components: a multi-objective optimization process for determining CAVDL layouts and a dynamic traffic simulation model that captures traveler behavior and network dynamics. These components form a closed-loop system, where the optimization uses the simulation’s output (travel time, emissions, and cost) to evaluate and improve its solutions.
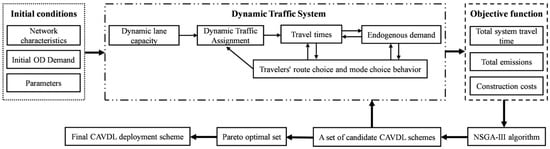
Figure 1.
Modeling framework with endogenous feedback for network-wide CAVDL design.
2.1. Notation
A transportation network is commonly represented as a directed graph, consisting of a set of nodes interconnected through a set of directed links. To depict the traffic network, we defined the following notations in Table 1.

Table 1.
List of notations for the main formulation.
2.2. Problem Definition
This section defines the network design problem for a mixed traffic stream comprising CAVs and HDVs. CAVs are equipped with connectivity and automation functionalities (e.g., cooperative adaptive cruise control), whereas HDVs are conventional vehicles operated by human drivers without vehicle-to-vehicle communication.
Owing to their shorter and safer time headways, CAVs are anticipated to enhance traffic flow and alleviate bottleneck congestion [21,22]. Consequently, the mixed traffic system in this study assumes that CAVs can access a set of CAVDLs when available during specific periods. The network incorporates two lane types: (1) CAVDLs, reserved exclusively for CAVs, and (2) regular lanes (RLs), which accommodate mixed CAV and HDV traffic. Under this operational strategy, some CAVs use CAVDLs, while the remaining CAVs share RLs with HDVs. This setup leads to distinct car-following behaviors between CAVs and HDVs on RLs, a key characteristic of mixed traffic streams that has been extensively modeled [23].
Definition 1 (Network Design Problem). Given a multi-OD, multi-lane urban network with two vehicle classes (CAVs and HDVs), determine the optimal location and quantity of CAVDLs under varying traffic conditions to simultaneously optimize a set of conflicting objectives [24], including total system travel time, vehicle emissions, and construction costs.
The ensuing sections present the mathematical formulation to model the proposed network design problem.
2.3. Fundamental Diagram for Mixed Traffic Flow
The fundamental diagram of traffic flow describes the functional relationship between flow (q), density (ρ), and speed (v). This study adopts the triangular fundamental diagram (Figure 2) [25] for its computational efficiency and widespread use in dynamic network modeling. The diagram is defined by free-flow speed (), jam density (), and capacity (), providing a balance between physical realism and analytical tractability, and forms the basis of the Link Transmission Model (LTM) [26]:
where the critical density () denotes the transition from free-flow to congested conditions.
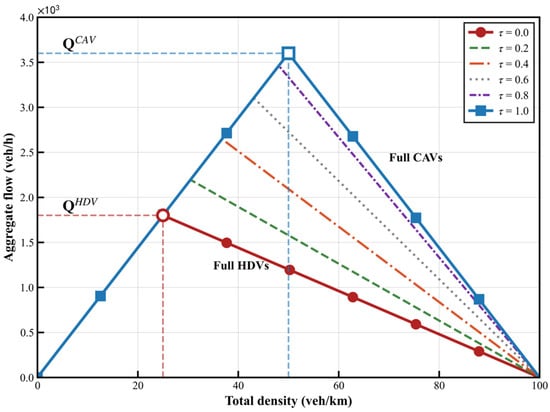
Figure 2.
Triangular fundamental diagram of mixed traffic flow.
In mixed traffic environments, the diagram parameters vary with CAV penetration rates. Shorter CAV reaction times reduce car-following headways, increasing lane capacity and backward wave speed (w). Let denote the proportion of CAVs on lane l of link a. As shown in Figure 3, there are four car-following types in mixed traffic flow. Under the assumption of random vehicle mixing, the probability of each car-following type is the product of the proportions of the leader and follower types.
- CAV following CAV (): ;
- CAV following HDV (): ;
- HDV following HDV () and HDV following CAV (): .

Figure 3.
Schematic diagram of car-following types.
Since HDVs are unable to communicate with the leading vehicle, we can assume that . Conversely, connected and automated vehicles (CAVs) can coordinate, leading to shorter headways, with because CAV-HDV interaction lacks full coordination. The average headway of mixed traffic flow is therefore given by the following weighted sum:
This nonlinear relationship (Figure 4a) shows decreasing headways with increasing CAV penetration. The corresponding backward wave speed and lane capacities are derived as follows:
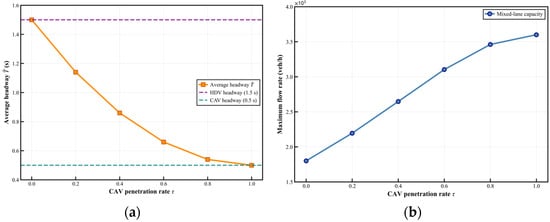
Figure 4.
Relationships between CAV penetration rate, average headway, and lane capacity. (a) Nonlinear decrease of time headway with increasing CAV penetration; (b) Monotonic increase in lane capacity as a function of CAV penetration rate.
The capacity of a CAVDL (where , and ) is as follows:
The capacity of a general lane (mixed traffic) is as follows:
Equations (4)–(6) form the core of the dynamic capacity model, capturing the nonlinear impact of CAV penetration on traffic flow fundamentals. The monotonic increase in lane capacity with CAV penetration (Figure 4b) demonstrates the operational benefits of CAVs in mixed traffic environments.
3. Methodology
The proposed dynamic multi-objective optimization framework is built upon a macroscopic traffic flow model detailed in Section 2.3. This model choice provides an optimal balance between computational efficiency for network-wide analysis and the physical realism required to capture dynamic traffic phenomena. The framework is established under the following core assumptions to ensure tractability: (a) lane-changing occurs only at nodes [26,27,28]; (b) CAVs are assumed to possess connectivity and automation capabilities that enable shorter and more stable time headways compared to HDVs, as reflected in the capacity model (Equations (3)–(6)) and supported by studies on CAV impacts on traffic flow [21,22]; (c) the traffic stream consists exclusively of CAVs and HDVs, with CAVs producing zero tailpipe emissions; (d) route choices follow the Dynamic System Optimum principle; and (e) total OD demand is fixed, with endogenous mode choice as the only source of demand elasticity. The subsequent subsections detail the model components within this framework. Furthermore, the optimization of CAVDL locations is applied to basic roadway segments within the network; complex interchange areas are excluded from the lane conversion decision. The model does not predefine whether a CAVDL occupies an inner or outer lane position; the binary variable can represent the conversion of any existing lane on a link.
3.1. Endogenous Demand Model
This section models the travelers’ mode choice between CAVs and HDVs using a binary logit model [29] based on random utility theory. For each OD pair (o, d) at time t, the total demand splits into mode-specific demands based on the proportion of travelers choosing CAVs:
The utility of choosing vehicle type mm is a linear function of the average travel time (obtained from the LTM):
where is the value of time, quantifying willingness to pay to reduce travel time, and is a Gumbel-distributed random error term. This linear utility specification follows the standard Multinomial Logit model [29] and is consistent with related work on endogenous CAV demand modeling for network design [14].
The probability of choosing a CAV is governed by the utility difference between modes:
A fixed-point algorithm solves for the equilibrium between mode choice and network conditions, iteratively updating and until convergence. This captures the core endogenous feedback mechanism, where CAVDL deployment influences travel times, which in turn shapes mode choice.
3.2. Dynamic Network Model
The dynamic network flow is characterized using a multi-class LTM, built upon the fundamental diagrams for mixed traffic flow defined in the Section 2.3 and extended to accommodate CAVDLs [14]
A binary decision variable, , indicates whether lane l on link a is designated as a CAVDL () or an RL () at time step t. These variables are the outputs of the optimization model, determining the optimal number, location, and timing of CAVDLs. The dynamic lane-specific capacity is simplified as follows:
To prevent HDVs from using CAVDLs, the following constraint is imposed:
The vehicle numbers and proportions are governed by conservation laws. The class-specific vehicle number on lane l of link aa for an OD pair is given by the following:
Consequently, the aggregate proportion of vehicle type mm on the lane, which governs lane capacity, is as follows:
Conversely, the OD-specific proportion of vehicle type m, which governs flow conservation per OD pair, is defined as follows:
with the constraints
The class- and lane-specific vehicle numbers are bounded to account for vehicles that have traversed the entire link:
To maintain model tractability, we adopt a common simplification from macroscopic DTA models: lane-changing is restricted to nodes [27]. This assumption enables the use of linear node constraints for flow propagation, which significantly reduces computational complexity while preserving the primary network dynamics.
Constraints (22) and (23) govern the flow of vehicles at nodes: the former determines the inflow from all upstream links for a given OD pair, while the latter calculates the outflow to all downstream links. Constraint (24) enforces the non-negativity of all link flows. The actual inflow capacity of a lane, , depends on its traffic capacity and the accumulated flow. Conversely, represents the available vehicle stock on the lane that is ready to exit. Constraint (25) ensures the total inflow does not exceed , and Constraint (26) ensures the total outflow does not exceed .
Constraints (29) and (30) are source and sink node constraints, which aim to load traffic into the network at the origins and release traffic at the destinations.
3.3. Objective Function and Integrated Formulation
The proposed framework aims to simultaneously optimize three conflicting objectives: total system travel time (TSTT, ), total emissions (), and CAVDL construction costs ().
The average travel time on each link is estimated by averaging the time steps spent by each vehicle of a specific type on that link over the total number of vehicles of that type passing through it.
Given the known path set for each OD pair, the average travel time for each OD pair is calculated as follows:
These OD-level travel times () are directly used in the endogenous demand model (Equations ((10)–(12))) to determine mode choice utility.
The TSTT aggregates the travel time for all vehicles across the network, formulated as follows:
CAVs are assumed to be electric vehicles, producing zero tailpipe emissions. This assumption aligns with the anticipated convergence of vehicle automation and electrification, motivated by superior energy efficiency, expanding charging infrastructure, and urban air quality policies. Several major manufacturers (e.g., General Motors (Detroit, MI, USA), Waymo (Mountain View, CA, USA)) have also announced plans for electric CAVs. Consequently, total vehicle emissions are calculated solely for HDVs. Following established practice [30,31], carbon monoxide is used as a surrogate pollutant, with link-specific HDV emissions (in g/veh) modeled by the widely adopted function of Wallace et al. [31]:
where is the average travel time of HDVs on link aa. Total network emissions are then aggregated across all links:
The total construction cost accounts for the incremental investment of upgrading an RL to a CAVDL, excluding sunk civil costs. It is calculated as follows:
The unit cost is set to , a conservative estimate for the intelligent infrastructure, such as roadside units, perception systems, and communication networks, required to ensure reliable CAV operations [32].
The complete CAVDL design problem is formulated as the following multi-objective mixed-integer nonlinear programming (MO-MINLP) model:
3.4. Solution Algorithm: NSGA-III Implementation
The proposed model integrates dynamic traffic processes with endogenous demand, introducing nonlinearity through two components: the exponential term in the logit model governing CAV-HDV mode choice probabilities and the exponential function in HDV emission calculations linking travel time to pollutant output. These nonlinearities, combined with the binary lane allocation variables , realistically represent spatiotemporal interactions between vehicle classes but also increase computational complexity.
To efficiently solve this multi-objective mixed-integer nonlinear programming (MO-MINLP) problem, a two-layer solution strategy was adopted. The outer layer used the NSGA-III algorithm to optimize the binary lane allocation variables generating Pareto-optimal CAVDL layouts; this algorithm was selected for its ability to handle multiple objectives and maintain diversity in high-dimensional objective spaces. The inner layer employed a fixed-point algorithm to solve for the equilibrium CAV penetration rate by iteratively updating the logit-based mode choice model until convergence, and this step ensured consistency between travel demand and network performance.
The two layers operate in a nested manner. Figure 5 illustrates the flowchart of this integrated two-layer optimization algorithm. The process begins with the outer layer where NSGA-III initializes a population of candidate CAVDL layouts (). For each candidate layout, the inner layer (fixed-point algorithm) is executed: it initializes the CAV penetration rate, runs the multi-class DTA model to compute travel times, and updates the mode choice probability via the logit model. This inner loop iterates until the CAV penetration rate converges. The converged traffic state is then used to calculate the three objective function values (TSTT, total emissions, and CAVDL construction costs), which are returned as the fitness evaluation for that candidate layout to the outer layer. Subsequently, NSGA-III performs fast non-dominated sorting, reference point association, and niche-preserving selection to maintain population diversity, followed by genetic operations (crossover and mutation) to produce a new offspring population. This outer loop continues until the termination criterion is met, finally outputting the Pareto-optimal set of CAVDL deployment plans.
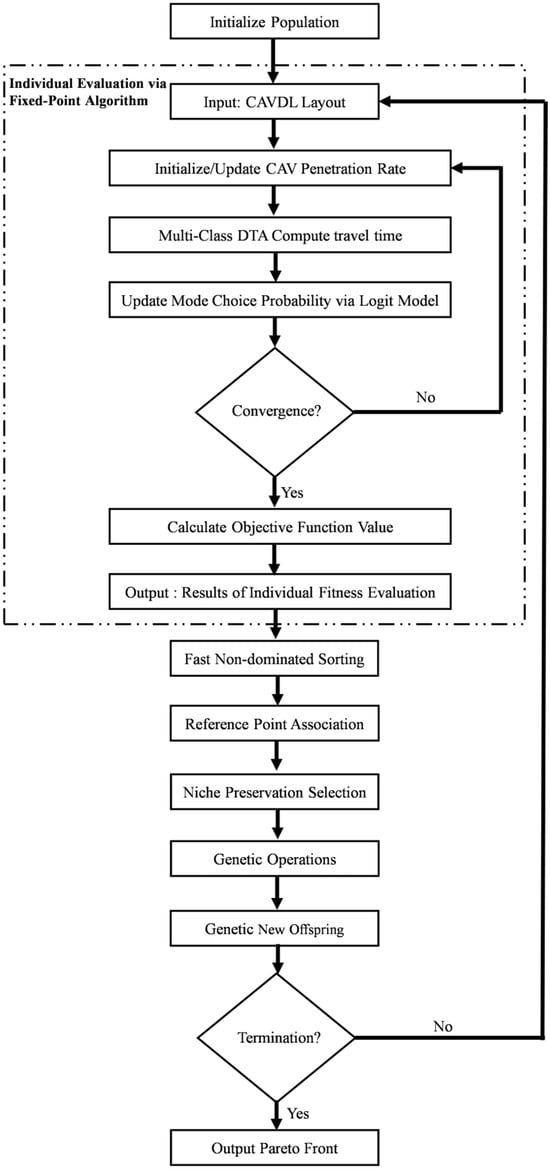
Figure 5.
Flowchart of the integrated two-layer optimization algorithm.
Based on this framework, key implementation details included a population size of 100 and a maximum of 200 generations for NSGA-III; a convergence tolerance of for the fixed-point iteration; and parallel computation to evaluate multiple lane configurations simultaneously.
In terms of computational performance for the Sioux Falls case study, the inner fixed-point algorithm demonstrated efficient convergence, requiring an average of 12.3 ± 2.7 iterations. The complete NSGA-III optimization required approximately 37.31 h on a standard workstation. While the computational cost scales with network size due to the combinatorial lane allocation problem, the framework remains tractable for metropolitan-scale strategic planning. For very large networks, heuristic pre-screening of candidate links or parallel computing could be employed to maintain efficiency.
This nested structure effectively balanced model fidelity and solution efficiency, enabling the generation of a diverse set of non-dominated solutions for practical decision-making.
4. Results and Discussion
4.1. Experimental Setup
Numerical experiments were conducted on the Sioux Falls network, as shown in Figure 6, to validate the proposed CAVDL optimization framework. The network topology included multiple origin–destination (OD) pairs and multi-lane links, accommodating two vehicle classes: CAVs and HDVs.
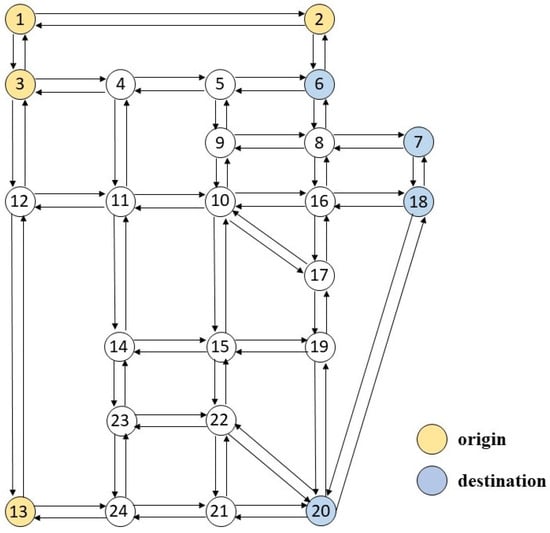
Figure 6.
Sioux Falls network with 4 OD pairs.
Behavioral parameters governing traveler choices were calibrated based on established empirical research. Following Wong et al. [33], the value of time (VOT) for CAV users () was set to 6.5 USD/h, while for HDV users (), it was set to 10 USD/h. This differential reflects the empirically observed reduction in the generalized cost of travel time for CAV users, attributable to their ability to engage in productive activities while in-vehicle, which lowers the disutility of travel. The complete set of network and traffic flow parameters is summarized in Table 2.
Table 2.
Simulation parameters.
4.2. Endogenous Demand Model Sensitivity Analysis
This section evaluated the sensitivity of the endogenous demand model to three key parameters: total travel demand, the value-of-time coefficient for CAV users (), and CAVDL capacity (). Numerical experiments on the Sioux Falls network quantified how perturbations in these parameters influenced the equilibrium CAV penetration rate () across 12 representative OD pairs. The results, summarized in Figure 7, demonstrated a clear hierarchy of parameter influence. The upper part of Figure 7 presents violin plots illustrating the distribution of optimal CAV proportions across the 12 OD pairs under different sensitivity scenarios. The lower part uses heatmaps to detail the numerical distributions for each OD pair.
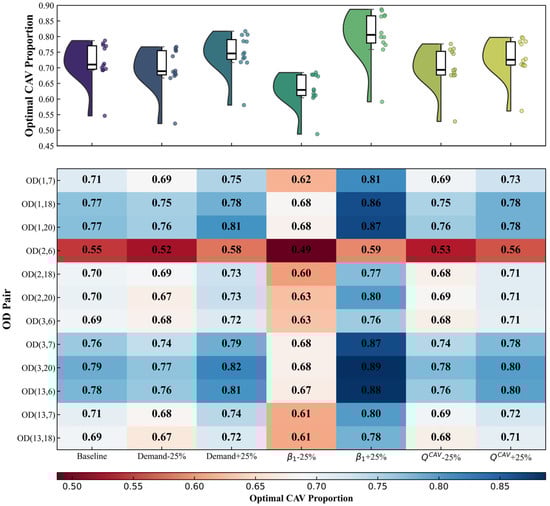
Figure 7.
Sensitivity analysis of optimal CAV proportions for 12 OD pairs. Violin plots (upper) show distributions under different scenarios: baseline, demand ±25%, ±25%, and ±25%. Colors distinguish scenarios and carry no quantitative meaning. Heatmaps (lower) detail numerical distributions per OD pair.
The analysis identified β1 as the dominant factor governing mode choice. A 25% variation in altered the average CAV share by approximately ±8.8%. This sensitivity substantially exceeded the effects of equivalent changes in total demand (±2–3%) or dedicated lane capacity (±1–2%). The magnitude of this difference established that behavioral parameters outweighed physical factors in determining CAV adoption.
This dominance stemmed from the structure of the random utility model. In Equation (11), directly scaled the perceived cost of travel time. When decreased, it amplified the disutility of travel time, reducing CAVs’ relative advantage. Conversely, an increase in enhanced the perceived value of time savings, making CAVs more attractive. This mechanism confirmed that subjective valuation of travel time, rather than objective time savings alone, drove mode choice decisions.
The limited impact of supply-side factors further supported this interpretation. Changes in affected mode choice indirectly through travel time adjustments in the network model. However, under the studied conditions, these adjustments produced only minor changes to CAV travel times (). Consequently, the utility difference () remained stable, resulting in minimal effects on the final choice probability. This demonstrated that infrastructure effects were mediated through behavioral parameters in the utility function.
These results validated the endogenous modeling approach adopted in this study. The significant influence of behavioral parameters revealed that assuming fixed CAV penetration rates, a common simplification in the existing literature, overlooks crucial dynamics in traveler decision-making. The critical role of β1 in forecasting CAV adoption aligns with established findings in transportation technology adoption research [34]. The findings demonstrate that the feedback between network performance and mode choice must be captured to accurately represent system behavior. This analysis confirms that endogenous demand modeling provides a necessary foundation for effective CAVDL planning.
4.3. Multi—Scenario Comparative Analysis
This section evaluated the performance of different CAVDL deployment strategies by comparing three distinct scenarios: Scenario 1 (no dedicated lanes): a mixed-traffic baseline where CAVs and HDVs shared all lanes; Scenario 2 (single-objective): a CAVDL layout optimized solely for minimizing TSTT; Scenario 3 (multi-objective): the proposed framework optimizing CAVDL layout for TSTT, total emissions, and construction cost simultaneously.
Figure 8 compared the key performance indicators across these scenarios. For Scenario 3, a single compromise solution was selected from the Pareto front for comparative analysis.
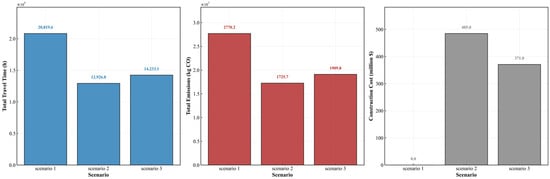
Figure 8.
Comparison of objective values across three scenarios.
Scenario 1 established the baseline performance without intervention. Scenario 2, representing a class of single-objective models prevalent in the literature, demonstrated the potential upper limits for traffic efficiency gains. Compared to Scenario 1, it achieved substantial reductions in TSTT (37.9%) and total emissions (37.7%). However, this approach also resulted in a construction cost of USD 485 million, which was 30.7% higher than that of Scenario 3. This outcome illustrates a known characteristic of single-objective optimization: its solutions may prioritize the primary objective at the expense of secondary but critical planning considerations, such as budgetary constraints.
Scenario 3, the proposed multi-objective framework, was designed to address this limitation explicitly. It achieved significant improvements over the baseline, reducing TSTT and total emissions by 31.6% and 31.0%, respectively, while maintaining a construction cost of USD 371 million. The primary contribution of Scenario 3 is thus not necessarily outperforming Scenario 2 in every metric but in providing a balanced solution that maintains a high level of traffic efficiency and environmental benefit at a 23.5% lower cost. This offers planners a spectrum of options with different trade-offs rather than a single, potentially cost-prohibitive solution.
To further elucidate these trade-offs, Figure 9 presents the Pareto front of nine non-dominated solutions from Scenario 3. The analysis confirmed the expected conflict between economic and performance objectives, while also revealing a strong positive correlation between TSTT and total emissions. A cost-threshold analysis indicated that performance gains were most pronounced with budgets below USD 380 million, with a plateau effect observed within the USD 370–390 million range.
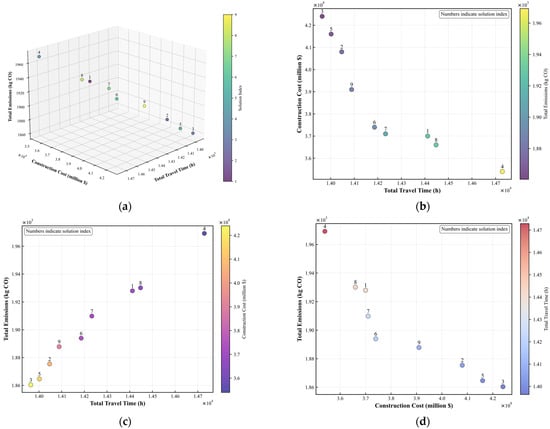
Figure 9.
Pareto front of CAVDL multi-objective optimization. (a) Three-dimensional Pareto front across all objectives; (b) Two-dimensional projection: construction cost vs. total travel time; (c) Two-dimensional projection: total emissions vs. total travel time; (d) Two-dimensional projection: total emissions vs. construction cost.
In summary, this comparative analysis demonstrates that the proposed multi-objective framework provides a complementary approach to existing single-objective models. It does not replace them but offers a structured methodology to explicitly quantify and navigate the inherent trade-offs among efficiency, environmental impact, and cost in CAVDL planning, thereby supporting more informed and balanced infrastructure decisions [35].
4.4. Impact on Dynamic Routing Flows and Congestion Propagation
To assess the operational impact of CAVDLs, traffic was simulated under time-varying demand with intensified flow between time steps 20 and 40, replicating peak-hour conditions. This setup enabled examination of how CAVDL strategies differentially influenced CAV and HDV routing behaviors under congestion. The analysis focused on link (4,5), a recurrent bottleneck selected for its representative network dynamics.
4.4.1. Dynamic Routing Responses to CAVDL Implementation
Cumulative inflow–outflow patterns on link (4, 5) revealed fundamentally different vehicle behaviors under mixed traffic (Scenario 1, Figure 10) and CAVDL (Scenario 3, Figure 11) conditions.
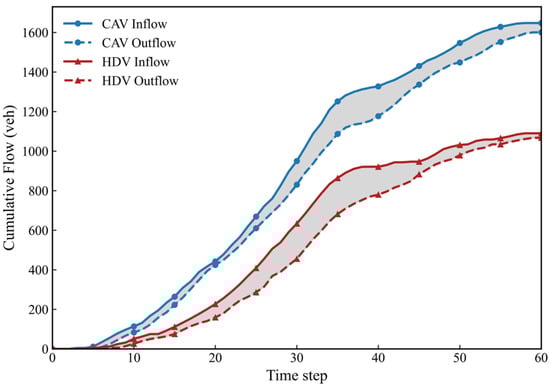
Figure 10.
Time-varying cumulative inflow–outflow of link (4, 5) in Scenario 1.
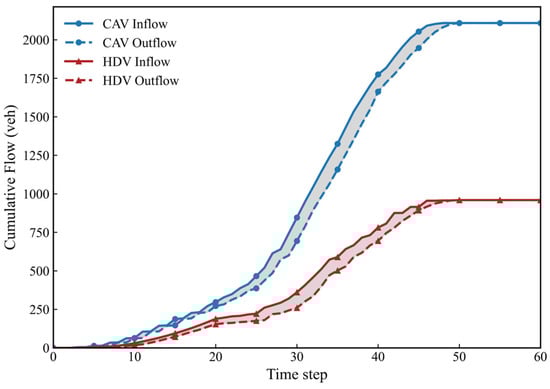
Figure 11.
Time varying Cumulative inflow–outflow of link (4, 5) in Scenario 3.
In Scenario 1, CAV and HDV inflows increased synchronously during peak hours. Outflow rates initially rose but soon declined, indicating capacity saturation that prolonged vehicle dwell time and exacerbated delays. The comparable delay levels between CAVs and HDVs highlighted that CAVs could not realize their theoretical advantages under mixed traffic conditions due to interference from heterogeneous HDV behavior.
In Scenario 3, with Lanes 1 and 2 designated as CAVDLs, the inflow–outflow patterns diverged sharply. The CAV inflow slope increased markedly, indicating that CAVs preferentially utilized the dedicated lanes. This behavior stemmed from the ability of CAVs to form platoons and sustain higher flow rates under homogeneous operating conditions [5]. Correspondingly, the CAV outflow slope rose substantially, confirming enhanced discharge rates resulting from stabilized traffic flow in the CAVDL [36].
Conversely, the HDV inflow slope increased only marginally, suggesting that some HDVs diverted to alternative routes. HDV outflow improved modestly but remained constrained by the lower capacity of the RL. The significantly smaller shaded area for CAVs indicated minimal delays in the dedicated lanes, attributable to elevated throughput and dampened disturbance propagation. Although HDVs experienced larger delays due to concentrated use of fewer lanes, the absolute delay magnitude was partially offset by reduced HDV volumes on the link—a consequence of rerouting behavior.
4.4.2. Congestion Propagation Mechanisms
Spatiotemporal density analysis further elucidated how CAVDLs suppressed congestion. In Scenario 1 (Figure 12), high-density regions appeared consistently across all three lanes during peak hours, with congestion spreading upstream to form large-scale contiguous congested areas. Owing to the limited capacity of RLs, congestion dissipated slowly, and high-density conditions persisted beyond time step 55.
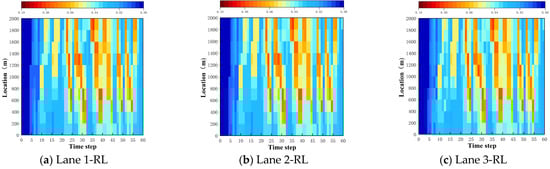
Figure 12.
Time-space density diagram for link (4, 5) in Scenario 1 with time-varying demand.
In Scenario 3 (Figure 13), congested regions were concentrated during peak hours and primarily confined to the RL (Lane 3). The CAVDLs exhibited only transient congestion during the early peak period, with conditions rapidly reverting to free-flow after time step 40. Statistical analysis revealed a 36.4% reduction in congestion duration and a 16.3% decrease in peak density compared to Scenario 1. This improvement is attributed to the spatial segregation effect of CAVDLs: by diverting most CAVs to dedicated lanes, the CAV-HDV mixing ratio in Lane 3 was significantly reduced. Consequently, Lane 3 experienced lower traffic density and shorter congestion duration, returning to free flow by time step 50—approximately 10 time steps earlier than in Scenario 1.
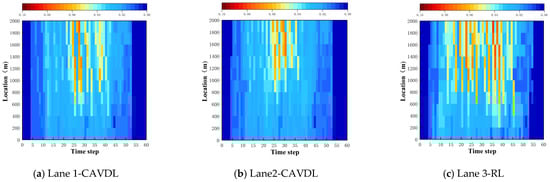
Figure 13.
Time-space density diagram for link (4, 5) in Scenario 3 with time-varying demand.
4.4.3. Synthesis of System-Level Impacts
The combined analysis demonstrates that CAVDLs amplify dissymmetry in route choice between vehicle types: CAVs exploit dedicated lanes for efficient movement, while HDVs adapt through rerouting. This segregation enhances total link capacity and reduces cross-class interference, corroborating established theories that physical separation improves network-level performance in mixed autonomy settings [5,36].
A direct comparison of the congestion patterns confirms that CAVDLs, through physical segregation, reduce CAV-HDV interaction conflicts, thereby constraining congestion spatially and blocking its temporal accumulation. In summary, the implementation of CAVDLs achieves synergistic spatiotemporal suppression of traffic congestion by containing its spatial propagation and disrupting its temporal accumulation.
It should be noted that the derived time-varying CAVDL layouts represent a theoretical benchmark of dynamic management. In practice, transitioning toward this benchmark could be initiated with fixed time-of-day plans (e.g., peak-period CAVDLs), informed by the persistent spatiotemporal patterns identified in this analysis.
5. Conclusions
This study demonstrated that the optimal design of CAVDLs requires accounting for the endogenous nature of travel demand, where mode choice and network conditions interact in a critical feedback loop. Numerical experiments on the Sioux Falls network revealed that a traveler’s subjective value of time was the dominant factor governing CAV adoption, exerting an influence that outweighed changes to physical infrastructure.
The key contribution of this work is a novel integrated framework that advances CAVDL planning by addressing three critical limitations of prior studies: (1) it incorporates endogenous demand feedback between lane design and traveler mode choice; (2) it models dynamic lane capacity adjusted by real-time CAV-HDV interactions; and (3) it explicitly optimizes the trade-offs among system travel time, emissions, and construction cost. This framework generates a Pareto-optimal solution set, providing planners with a decision-support tool that quantifies trade-offs and avoids the cost-ineffectiveness of single-objective optimization. The case study demonstrates its practical benefit, achieving a 31% travel time reduction and a 36.4% decrease in congestion duration while maintaining a 23.5% lower cost than a single-objective benchmark.
While this study simplified lane-changing behavior and CAV emissions, these limitations define a clear path for future work. Integrating more complex intersection management [37] and conducting full lifecycle assessments [38] represent the logical next steps. Additionally, future research should address the safety implications of mixed CAV-HDV traffic, which were not explicitly considered in the current optimization framework. Incorporating quantitative safety metrics could further enhance the holistic evaluation of CAVDL deployment strategies. Furthermore, to bridge the gap between theoretical optimality and operational practicality, subsequent studies could incorporate temporal stability constraints (e.g., minimum-duration requirements for CAVDL activation) into the optimization model. Finally, the framework could be extended to evaluate scenarios where CAVs utilize conventional or hybrid powertrains, relaxing the current all-electric assumption to assess its impact on emission trade-offs. Ultimately, this research provides a foundational step toward a more holistic and behaviorally realistic planning paradigm for the transition to connected and autonomous vehicles.
Author Contributions
Conceptualization, L.L. and Y.W.; methodology, Y.W.; software, Y.W.; validation, Y.W. and X.W.; formal Analysis, L.L. and Y.W.; investigation, Y.W. and X.W.; resources, L.L.; data curation, Y.W. and X.W.; writing—original draft preparation, Y.W. and X.W.; writing—review and editing, L.L., Y.W. and X.W.; visualization, Y.W.; supervision, L.L.; project administration, L.L. All authors have read and agreed to the published version of the manuscript.
Funding
This research was supported by the Zhejiang Provincial Natural Science Foundation of China under Grant No. LY24E080003.
Institutional Review Board Statement
Not applicable.
Informed Consent Statement
Not applicable.
Data Availability Statement
The datasets used and/or analyzed during the current study are available from the corresponding author on reasonable request.
Acknowledgments
The authors gratefully acknowledge the support from the School of Maritime and Transportation, Ningbo University.
Conflicts of Interest
The authors declare no conflicts of interest.
Abbreviations
The following abbreviations are used in this manuscript:
| CAV | Connected and autonomous vehicle |
| HDV | Human-driven vehicle |
| CAVDL | Connected and autonomous vehicle dedicated lane |
| RL | Regular lane |
| MINLP | Mixed-integer nonlinear programming |
| MO-MINLP | Multi-objective mixed-integer nonlinear programming |
| DTA | Dynamic traffic assignment |
| LTM | Link Transmission Model |
| NSGA-III | Non-dominated Sorting Genetic Algorithm III |
| TSTT | Total system travel time |
| VOT | Value of time |
| OD | Origin–destination |
References
- Hu, J.; Kong, L.; Shu, W.; Wu, M.Y. Scheduling of connected autonomous vehicles on highway lanes. In Proceedings of the 2012 IEEE Global Communications Conference (GLOBECOM), Anaheim, CA, USA, 3–7 December 2012; IEEE: New York, NY, USA, 2012; pp. 5556–5561. [Google Scholar]
- Mahmassani, H.S. 50th anniversary invited article—Autonomous vehicles and connected vehicle systems: Flow and operations considerations. Transp. Sci. 2016, 50, 1140–1162. [Google Scholar] [CrossRef]
- Tian, D.; Zhou, J.; Han, X.; Lang, P. Robust platoon control of mixed autonomous and human-driven vehicles for obstacle collision avoidance: A cooperative sensing-based adaptive model predictive control approach. Engineering 2024, 42, 244–266. [Google Scholar] [CrossRef]
- Zheng, F.; Liu, C.; Liu, X.; Jabari, S.E.; Lu, L. Analyzing the impact of automated vehicles on uncertainty and stability of the mixed traffic flow. Transp. Res. Part C Emerg. Technol. 2020, 112, 203–219. [Google Scholar] [CrossRef]
- Talebpour, A.; Mahmassani, H.S. Influence of connected and autonomous vehicles on traffic flow stability and throughput. Transp. Res. Part C Emerg. Technol. 2016, 71, 143–163. [Google Scholar] [CrossRef]
- Wang, Z.; Xing, C.; Zhu, W.; Ma, X. Modeling dedicated lanes for connected autonomous vehicles with poly-information uncertainties and electronic throttle dynamics. Phys. A Stat. Mech. Appl. 2024, 638, 129644. [Google Scholar] [CrossRef]
- Zhang, X.; Liu, W.; Levin, M.; Waller, S.T. Equilibrium analysis of morning commuting and parking under spatial capacity allocation in the autonomous vehicle environment. Transp. Res. Part E Logist. Transp. Rev. 2023, 172, 103071. [Google Scholar] [CrossRef]
- Roy, K.; Hoang, N.H.; Vu, H.L. Modeling autonomous vehicles deployment in a multilane AV zone with mixed traffic. IEEE Trans. Intell. Transp. Syst. 2022, 23, 23708–23720. [Google Scholar] [CrossRef]
- Rad, S.R.; Farah, H.; Taale, H.; van Arem, B.; Hoogendoorn, S.P. Design and operation of dedicated lanes for connected and automated vehicles on motorways: A conceptual framework and research agenda. Transp. Res. Part C Emerg. Technol. 2020, 117, 102664. [Google Scholar]
- Liu, Z.; Song, Z. Strategic planning of dedicated autonomous vehicle lanes and autonomous vehicle/toll lanes in transportation networks. Transp. Res. Part C Emerg. Technol. 2019, 106, 381–403. [Google Scholar] [CrossRef]
- Madadi, B.; van Nes, R.; Snelder, M.; Van Arem, B. A bi-level model to optimize road networks for a mixture of manual and automated driving: An evolutionary local search algorithm. Comput. Aided Civ. Infrastruct. Eng. 2020, 35, 80–96. [Google Scholar] [CrossRef]
- Wang, T.; Li, Y.; Jia, B.; Long, J. An autonomous vehicle exclusive lane design problem under the mixed autonomy traffic environment: Model formulation and large-scale algorithm design. Transp. Res. Part E Logist. Transp. Rev. 2024, 188, 103534. [Google Scholar] [CrossRef]
- Szeto, W.Y.; Lo, H.K. Dynamic traffic assignment: Properties and extensions. Transportmetrica 2006, 2, 31–52. [Google Scholar] [CrossRef]
- Chakraborty, S.; Rey, D.; Levin, M.W.; Waller, S.T. Freeway network design with exclusive lanes for automated vehicles under endogenous mobility demand. Transp. Res. Part C Emerg. Technol. 2021, 133, 103440. [Google Scholar] [CrossRef]
- Ngoduy, D.; Nguyen, C.H.; Lee, S.; Zheng, Z.; Lo, H.K. A dynamic system optimal dedicated lane design for connected and autonomous vehicles in a heterogeneous urban transport network. Transp. Res. Part E Logist. Transp. Rev. 2024, 186, 103562. [Google Scholar] [CrossRef]
- Di, Y.; Zhang, W.; Ding, H.; Zheng, X.; Ran, B. Cooperative control of dynamic CAV dedicated lanes and vehicle active lane changing in expressway bottleneck areas. Phys. A Stat. Mech. Appl. 2024, 638, 129623. [Google Scholar] [CrossRef]
- Akopov, A.S.; Beklaryan, L.A. Evolutionary Synthesis of High-Capacity Reconfigurable Multilayer Road Networks Using a Multiagent Hybrid Clustering-Assisted Genetic Algorithm. IEEE Access 2025, 13, 53448–53474. [Google Scholar] [CrossRef]
- Nguyen, T.L.; Nguyen, Q.A. A Multi-Objective PSO-GWO Approach for Smart Grid Reconfiguration with Renewable Energy and Electric Vehicles. Energies 2025, 18, 2020. [Google Scholar] [CrossRef]
- Seilabi, S.E.; Pourgholamali, M.; de Almeida Correia, G.H.; Labi, S. Robust design of CAV-dedicated lanes considering CAV demand uncertainty and lane reallocation policy. Transp. Res. Part D Transp. Environ. 2023, 121, 103827. [Google Scholar] [CrossRef]
- Kumar, A.; Guhathakurta, S.; Venkatachalam, S. When and where should there be dedicated lanes under mixed traffic of automated and human-driven vehicles for system-level benefits? Res. Transp. Bus. Manag. 2020, 36, 100527. [Google Scholar] [CrossRef]
- Hou, G. Evaluating efficiency and safety of mixed traffic with connected and autonomous vehicles in adverse weather. Sustainability 2023, 15, 3138. [Google Scholar] [CrossRef]
- Chen, B.; Chen, Y.; Wu, Y.; Xiu, Y.; Fu, X.; Zhang, K. The effects of autonomous vehicles on traffic efficiency and energy consumption. Systems 2023, 11, 347. [Google Scholar] [CrossRef]
- Levin, M.W.; Boyles, S.D. A multiclass cell transmission model for shared human and autonomous vehicle roads. Transp. Res. Part C Emerg. Technol. 2016, 62, 103–116. [Google Scholar] [CrossRef]
- Pourgholamali, M.; Miralinaghi, M.; Seilabi, S.E.; Labi, S. Sustainable deployment of autonomous vehicles dedicated lanes in urban traffic networks. Sustain. Cities Soc. 2023, 99, 104969. [Google Scholar] [CrossRef]
- Newell, G.F. A simplified theory of kinematic waves in highway traffic, part I: General theory. Transp. Res. Part B Methodol. 1993, 27, 281–287. [Google Scholar] [CrossRef]
- Yperman, I.; Logghe, S.; Immers, B. The link transmission model: An efficient implementation of the kinematic wave theory in traffic networks. In Proceedings of the 10th Meeting of the EURO Working Group on Transportation, Poznan, Poland, 13–16 September 2005; Volume 24, pp. 122–127. [Google Scholar]
- Jin, W.L. A multi-commodity Lighthill–Whitham–Richards model of lane-changing traffic flow. Transp. Res. Part B Methodol. 2013, 57, 361–377. [Google Scholar] [CrossRef]
- Lioris, J.; Pedarsani, R.; Tascikaraoglu, F.Y.; Varaiya, P. Platoons of connected vehicles can double throughput in urban roads. Transp. Res. Part C Emerg. Technol. 2017, 77, 292–305. [Google Scholar] [CrossRef]
- Ben-Akiva, M.E.; Lerman, S.R. Discrete Choice Analysis: Theory and Application to Travel Demand; MIT Press: Cambridge, MA, USA, 1985; Volume 9. [Google Scholar]
- Xu, X.; Chen, A.; Cheng, L. Reformulating environmentally constrained traffic equilibrium via a smooth gap function. Int. J. Sustain. Transp. 2015, 9, 419–430. [Google Scholar] [CrossRef]
- Wallace, C.E.; Courage, K.G.; Hadi, M.A.; Gan, A.G. TRANSYT-7F User’s Manual; University of Florida: Gainesville, FL, USA, 1998. [Google Scholar]
- Heo, J.; Kang, B.; Yang, J.M.; Paek, J.; Bahk, S. Performance-cost tradeoff of using mobile roadside units for V2X communication. IEEE Trans. Veh. Technol. 2019, 68, 9049–9059. [Google Scholar] [CrossRef]
- Wong, T.W.; Saxena, N.; Dixit, V.V. A study of route choice behavior of drivers in autonomous vehicles. In Proceedings of the Transportation Research Board 97th Annual Meeting, Washington, DC, USA, 7–11 January 2018; Transportation Research Board (No. 18-02686): Washington, DC, USA, 2018. [Google Scholar]
- Krueger, R.; Rashidi, T.H.; Rose, J.M. Preferences for shared autonomous vehicles. Transp. Res. Part C Emerg. Technol. 2016, 69, 343–355. [Google Scholar] [CrossRef]
- Miandoabchi, E.; Daneshzand, F.; Szeto, W.Y.; Farahani, R.Z. Multi-objective discrete urban road network design. Comput. Oper. Res. 2013, 40, 2429–2449. [Google Scholar] [CrossRef]
- Ghiasi, A.; Hussain, O.; Qian, Z.S.; Li, X. A mixed traffic capacity analysis and lane management model for connected automated vehicles: A Markov chain method. Transp. Res. Part B Methodol. 2017, 106, 266–292. [Google Scholar] [CrossRef]
- Li, T.; Qian, Z.; Fan, B.; Xu, M.; Sun, H.; Chen, Y. Integrated optimal planning of multi-type lanes and intersections in a transportation network with mixed HVs and CAVs. Transp. Res. Part E Logist. Transp. Rev. 2024, 192, 103814. [Google Scholar] [CrossRef]
- Gawron, J.H.; Keoleian, G.A.; De Kleine, R.D.; Wallington, T.J.; Kim, H.C. Life cycle assessment of connected and automated vehicles: Sensing and computing subsystem and vehicle level effects. Environ. Sci. Technol. 2018, 52, 3249–3256. [Google Scholar] [CrossRef]
Disclaimer/Publisher’s Note: The statements, opinions and data contained in all publications are solely those of the individual author(s) and contributor(s) and not of MDPI and/or the editor(s). MDPI and/or the editor(s) disclaim responsibility for any injury to people or property resulting from any ideas, methods, instructions or products referred to in the content. |
© 2025 by the authors. Licensee MDPI, Basel, Switzerland. This article is an open access article distributed under the terms and conditions of the Creative Commons Attribution (CC BY) license.