Abstract
The quality of human capital is pivotal to the promotion of economic growth and development. In this regard, the quality of education and of academic, practice-based research systems plays a crucial role. The authors conducted an analysis of the systemic framework for financing higher education and science in Poland, with a particular focus on the economic and financial situation of the 21 largest Polish universities from 2019 to 2024. In order to assess whether the current financial basis of these entities facilitates conducting research, bridges the gap between academia and industry, and thus supports their sustainable development, a taxonomic composite indicator and cluster analysis were employed. The results obtained indicated unfavourable trends in the domain of higher education and research and development (R&D) activity among Polish universities. These include, in particular, the exceeding of operating costs over operating revenues, the deterioration of financial results, insufficient funding from the state budget in relation to the scale of operations, and relatively high volatility of the economic and financial situation in subsequent years.
1. Introduction
The quality of human capital is a pivotal factor in the promotion of economic growth and development, as well as university–industry co-operation. The efficacy of this approach is contingent upon the prevailing educational system, which in turn is influenced by the availability of human and financial resources within educational institutions. It is widely acknowledged that higher education institutions (HEIs) have a distinctive function in this respect. The innovations that emerge from these institutions have been shown to enhance economic resilience to market fluctuations, reduce unemployment, and boost productivity. HEIs have been identified as playing a pivotal role in the production of knowledge and innovation, which in turn leads to technological spillover effects across the economy [1]. This phenomenon occurs through the establishment of partnerships and the contribution of skilled graduates [2]. But mixed policy instruments are necessary to promote university–industry innovation transfer to achieve sustainable economic growth [3]. It is evident that both HE attainment and science have a pivotal role in stimulating the growth of high-technology-exporting firms [4].
The multiplier effect of higher education (HE) is defined as the extensive benefits that are accrued from it. These include the immediate expenditure of universities, the establishment of new industries and products, as well as the creation of a skilled workforce and high-value jobs for knowledge-based industries. However, when interpreting the relationship between scientific research results and economic growth, it is important to remember that this relationship is primarily long-term. As Bhuiyan [5] demonstrates, investment in the education sector also has a significant impact on reductions in the crime rate. The aforementioned investment can also encourage the development of new urban areas [6].
It should also be noted that some models that, according to their authors, confirm that the degree to which HE is popularised improves economic growth are characterised by a very low degree of fit with the data. Therefore, they cannot be considered reliable [7]. The significant impact of the internationalisation of education on the economy is also highlighted. Chowdhury [8] utilised a cointegration and error correction model, employing quarterly data from 1974 to 2019, to ascertain a long-run positive relationship and a short-run dynamic effect of international education on the economic growth and employment of Australia.
The significance of HE for economic growth, and more specifically, for the socio-economic development of nations, is irrefutable. The question that arises is whether adequate financial resources are allocated for this purpose, especially during periods of economic downturn, and whether universities, by managing these resources effectively, in conjunction with the investment levels of these institutions, enable the assessment of their capacity to finance and undertake scientific research, including that which is conducted in collaboration with the broader community. The long-term implications of this analysis are that it provides a foundation for the sustainable development of these entities, extending beyond the realm of research to encompass educational initiatives.
In the context of Polish universities, several negative phenomena are evident. Firstly, due to increased budget expenditure on other areas, primarily infrastructure, defence, and social welfare, as well as inflation, there is diminishing public financial support in real terms, which results in a decline in the teaching and research potential of these institutions. Secondly, inadequate financial resources have resulted in increasing diversity and a deteriorating financial situation of Polish universities. Thirdly, the diminishing prospects for research funding have resulted in limited co-operation between academia and industry.
The extant literature on the financial situation of universities, particularly with regard to their development potential, is relatively limited. The study presented herein, which pertains to the sustainable development of universities in the context of their financial support and financial condition, is poised to contribute to the reduction in the research gap in this area. In this case, sustainable development is defined as favourable and growing values of the Taxonomic Measure of Development (TMD), which is used to assess the financial situation of universities.
The results of the study will allow for verification of the hypothesis regarding the insufficient funding of Polish universities in relation to their costs and the significant heterogeneity of these entities due to their financial situation.
The primary objective of the present study is to assess the level and changes in the development potential of Polish public universities based on a proposed taxonomic measure of their financial situation in 2019–2024. The dynamic version of this measure will be used to determine whether the distance between individual universities and the benchmark university is decreasing, which would indicate effective optimisation of the use of financial resources in the context of declining real funding for Polish universities.
The classification of these entities into homogeneous groups in terms of their financial situation will be undertaken using the k-means method. In order to ascertain the optimal number of clusters, two indices will be employed: the Caliński–Harabasz index and an index proposed by the authors. The degree of consistency of the ranking positions of individual universities in subsequent years will be assessed using the Rand index.
The novelty of the presented study lies firstly in the use of unique financial data characterising the 21 largest Polish universities, taken from report [9], prepared by the University Financial Commission of the Conference of Rectors of Polish Universities. Another original contribution of the study is the use of multidimensional analysis methods to assess the sustainable development of Polish public universities.
The second part of the paper presents a review of the literature on higher education financing systems in selected countries, with particular emphasis on the system currently in force in Poland. The third section details the research methods employed, while the fourth section presents the results and their subsequent interpretations. The text concludes with a discussion of the conclusions and suggestions for future research directions.
2. Literature Review—Higher Education Meaning and Financing
Examining 65 countries over a period of 36 years using a Generalised Method of Moments (GMM) estimator for panel data, Pinto and Teixeira [10] showed that research results have a positive and significant impact on economic growth. Sattara et al. [11] employed data for the period of 2010–2019 and used pooled ordinary least squares to show that China’s education has a positive and significant impact on economic growth and trade in 56 Belt and Road countries. In their 2018 study, Pastor et al. [12] analysed the contribution of universities to the technological capital of European Union countries from 2000 to 2015. Employing techniques of growth accounting, the researchers indicated that HEIs are a significant source of economic growth and contribute to mitigating the negative effects of crises. However, the estimates demonstrate significant international heterogeneity in their contributions. Such differences across regions and institutions, observed mainly in developing countries, can constrain HE from serving the industrial economy [13]. Caglayan-Akay et al. [14] also demonstrated the heterogeneity of the relationship between expenditures on HE and economic growth using the provincial data covering the period of 2009–2021 for Turkey. They underlined the crucial role of such diversity in designing public policies to reduce regional inequalities between leading and lagging regions.
Furthermore, many authors have highlighted significant discrepancies in the impact of HE on economic performance across varying levels of economic development (e.g., [15,16], and due to the spatial agglomeration processes of universities and economic activity [17,18]. For instance, based on a sample of 101 countries with varying levels of development covering the period 2000–2020, Minviel and Ben Bouheni [19] proved that the relationship between HE expenditure and economic growth takes the form of an inverted U, i.e., it is strongest at medium-high levels of development. They also found empirical evidence that government spending on HE can generate knowledge and invent technology only in high-development countries.
As indicated by Adamakou et al. [20], divergent trends in the performance of EU universities persist despite the unification of Europe’s educational space, and their disparate impact on the formation of spatial disparities. This assertion is substantiated by data from the University Ranking by Academic Performance, encompassing the period from 2014 to 2021.
Lendel et al. [21] found that American metropolitan regions with a higher level of university science, technology, engineering, and mathematics (STEM) graduates were more resilient to the economic recession in 2007–2009. In their 2019 study, Valero and Reenen [22] sought to estimate econometric models based on evidence from 15,000 universities in almost 80 countries during the period 1950–2010. Their findings demonstrated that a 10% increase in a region’s number of universities per capita was associated with a 0.4% higher gross domestic product per capita in the long run. The aforementioned results were replicated by Agasisti and Bertoletti [23] for European regions during the period of 2000–2017, as well as by Dominguez [24] for Spain. De Ridder et al. [25] demonstrated that educational expenditure in the United States exerts significant short-term effects on local income. The authors further proposed that this could serve to stabilise the economic situation, particularly during periods of recession.
A crucial impact on society and economy has been especially well-funded and resourced universities [26]. This is confirmed by the results obtained for 2016, when the European Research Universities generated an estimated 2.7% of the total gross value added and 2.2% of all jobs in the European economy through their core activities, graduates, research, and commercialisation [27]. The utilisation of the entropy method, in conjunction with data pertaining to 30 Chinese provinces from 2012 to 2020 [28], has demonstrated that the level of HE exhibits a positive correlation with regional economic development and the growth of new companies through digital innovation. This phenomenon is predominantly attributable to the accomplishments of HEIs in this domain. Li and Kang [29], in their analysis of 31 Chinese provinces from 2014 to 2023, found that higher levels of urbanisation and marketisation led to a more significant positive effect of HE on economic sustainability. They also noted that the disciplines and settings of higher education should be adjusted according to the economic development level and industrial characteristics of different regions.
Concurrently, the inverse nature of this relationship is accentuated. For instance, Busemeyer [30] demonstrated that there was a positive correlation between GDP per capita and public education expenditures in 21 OECD countries during the 1980–2001 period.
It is also worthy of note that certain authors have obtained results which indicate that research universities may be conducive to a slowing of regional economic development [31]. This hypothesis was corroborated by [32], who, in their study of 266 NUTS in two European regions, obtained results that were consistent with this view. As Holmes [33] asserted, when evaluating the significance of the HE sector, it is imperative to acknowledge the influence of several factors on the outcomes. These include the configuration and magnitude of the sample, the variables employed, and the designated time period for analysis. The definitions of the analysed concepts, the choice of research methods, and the assumptions made are also important. He emphasised that mass HE does not necessarily imply higher economic growth, because this depends on the skills produced and their utilisation. His examination of OECD and worldwide data demonstrated that there is no statistically significant relationship between GDP growth rates and either the increase or the initial level of HE.
Li et al. [34] examined 61 countries from 2000 to 2022. Utilising the entropy weighting method, coupled coordination model, and double-fixed spatial Durbin model, they showed that the rise in HE in Europe is not significantly improving the sustainable development of countries, but rather enhancing that of neighbouring countries. By contrast, in Asia, the increase significantly improves the level of sustainable development in the region by pooling talent, funds, and technologies from neighbouring regions. They also demonstrated that the influence of HE on regional sustainable development converges to be non-significant. Karaçor et al. [35] obtained similar results for 19 OECD countries between 1998 and 2012. An overview of selected results illustrating both the impact and absence of expenditure on HE on economic growth and productivity is presented, among others, in [36].
In order to support economic growth and development, as well as enhance the transfer of innovations to industry, the HE system necessitates substantial financial investment. It is vital that the allocation of financial resources to higher education (HE) is in alignment with the development priorities stipulated within a nation’s overarching development strategies [37]. The manner in which HE is financed cannot be viewed exclusively from an economic and labour market perspective [38]. In addition, several authors have emphasised the importance of selecting the appropriate branches of higher education (HE) based on national economic competitive advantage in order to ensure that the impact of education and research is maximised in terms of economic growth [36].
It is imperative that funds allocated to higher education and scientific research are not regarded exclusively as a cost in the state budget, but rather as a strategic investment. In the absence of such a framework, there is a risk of a constant tendency to minimise them, especially during economic downturns and disturbances such as the global Coronavirus pandemic [39,40].
In the majority of countries, public funding of HE is predominant, with only a few countries witnessing private funding assuming a more substantial role (e.g., Chile, Korea, the United States, Australia, Japan, and the United Kingdom). Whilst a combination of public and private funding can be regarded as a viable option, it is the efficient utilisation of public funding that can effectively guarantee access to higher education and contribute towards the achievement of Sustainable Development Goal 4 (SDG4): ensuring inclusive and equitable quality education and promoting lifelong learning opportunities for all [41].
Countries and economies adopt divergent approaches to cost-sharing in HE, a phenomenon that is reflective of the prevailing societal factors, fiscal constraints, and policy choices. The proportion of private expenditure in tertiary education is also influenced by factors such as ageing populations, increasing demands for healthcare, and defence spending. This has led to the adoption of varied cost-sharing approaches [2]. As is evident from the case studies of Norway, the United Kingdom, and Chile, there is a divergence in the levels of public financing and private funding utilised by their respective systems. The former, as evidenced by the Norwegian case, maintain high levels of public financing, while the latter, as demonstrated by the United Kingdom and Chile, rely more on private funding from households, private entities, and foreign organisations. The findings of a considerable number of studies unequivocally demonstrate that the financial sustainability of HE is progressively contingent on the mobilisation of private contributions [2], particularly in countries experiencing heightened competition between the tertiary education sector and other areas of public expenditure [42].
2.1. European Financing Models for HE
Currently, a diverse range of models is used in European countries to finance HEIs. The predominant models of budget funding by universities are as follows: formula-based funding, performance-based funding, goal-based funding (through negotiation or competition), project funding, or funding based on historical data. European practice demonstrates that these methods of allocating public funds are employed in conjunction. Presently, in the majority of EU countries, universities receive fundamental financial support in the form of a block grant, which is determined by a calculation formula.
In certain countries, such as Austria, Germany, and Spain, the allocation of funding is determined through negotiation, while in others, it is based on the university’s financial history [43]. France utilises the NICE model, which serves as the foundation for contracts and negotiations in determining the level of university funding. The assessment encompasses three distinct domains: education (65%), research (35%), and management, infrastructure, and student life. Each of these areas is divided into two aspects: activity and performance [44].
Over the course of several years, Europe has observed a tendency towards making university funding less dependent on actual expenditure and more dependent on performance, although the schemes of this funding differ considerably [45]. In order to evaluate the overall investment in the education and science sector, it is crucial to understand the financing of HE activities through, for example, competitive research funding and other targeted, project-based grants from public bodies [2]. In this context, in order to achieve optimal efficiency in financing HEIs, it is essential to consider the relevant indicators for evaluating effectiveness [46], because financial mismanagement in the educational system as a whole is a major issue [47].
2.2. Polish Framework
The Law on Higher Education and Science was implemented in Poland on 1 October 2018, thereby effecting a radical transformation in the regulations that govern the financing of HEIs. In the initial phase of the process, the proportion of the state budget earmarked for scientific research was consolidated with the segment designated for HE. Secondly, in place of the previous subsidy, a grant was established as the principal source of funding, which is awarded to universities based on a bespoke algorithm.
The budget allocated to higher education and science is determined on an annual basis in the Budget Act, with the stipulation that the planned financial resources must not be lower than in the previous year. Concurrently, these resources are indexed by a sum equivalent to the product of the projected real growth in gross domestic product and the indexation rate. In 2025, this rate was 1.85, increasing by 0.1 each year until 2028. Furthermore, it is indexed by the projected rate of increase in consumer prices.
The allocation of funds to universities is conducted through a specific algorithm, which comprises a fixed transfer of 0.25 in 2025, in addition to six supplementary components that determine the distribution of the remaining 75% of the allocated funds:
- (1)
- The student component is a multifaceted metric that incorporates several key elements. Firstly, it considers the number of full-time students, alongside the cost-effectiveness ratios of various fields of study. Furthermore, it takes into account the availability of teaching resources, contingent on the number of students and doctoral students per academic teacher. The student component is assigned a weighting of 0.30.
- (2)
- The second component is that of the doctoral component. The weighting of this component is 0.05, and it is contingent upon the number of doctoral students in doctoral schools.
- (3)
- The staff component is contingent upon the number of academic teachers, who are assigned weights according to their position. The component has a weighting of 0.25.
- (4)
- Fourthly, an internationalisation component is to be incorporated into the system. This will be calculated on the basis of the number of students and doctoral students participating in international student exchanges, with a weighting of 0.05.
- (5)
- The fifth point to consider is the research component, which is contingent on the number of disciplines offered by the university. The weighting of these disciplines is determined by their scientific category and cost-effectiveness indicators. The number of employees engaged in scientific activity within a specified discipline is also considered. The component is assigned a weighting of 0.25.
- (6)
- The sixth component is that of research and development, which is given a weighting of 0.10. The definition of this component is as follows: it takes into account expenditure on research and development.
As is evident, the amount of the subsidy obtained (80% of its variable value) is primarily determined by the number of students and university staff, as well as the cost of education and scientific research. In conjunction with the transfer constant, these parameters are responsible for determining 85% of the total subsidy.
In accordance with the prevailing regulatory framework, the magnitude of subsidies for the subsequent year is constrained by the so-named “tunnel,” which delineates the upper and lower limits for the potential augmentation or diminution of subsidies. For public academic institutions covered by the ‘Initiative of Excellence—Research University’ programme, the range is from 100% to 106%; for other public academic and vocational institutions, the range is from 98% to 106%; and for non-public academic institutions and institutes, the range is from 95% to 110%.
In the post-COVID period, this tunnel either has not applied, and the subsidy has increased for all universities by the same percentage, or, as is the case in 2025, it has been set at a different level, guaranteeing universities that the current subsidy cannot be lower than last year’s. For example, in the case of public academic and vocational universities, the percentage ranges from 100% to 105% in 2025.
In addition to grants, which are the primary source of funding for education and scientific research, universities and various research institutions may obtain additional ministerial funds in the form of specific subsidies for financial aid for students and doctoral students, for tasks related to supporting students with disabilities, and for maintaining scientific and research equipment and IT infrastructure.
Significant financial support for Polish universities, particularly in the domain of research and development, is also provided through project grants awarded by the National Centre for Research and Development, the National Science Centre, the Polish National Agency for Academic Exchange, the Regional Initiative of Excellence Programme, and specific programmes administered by the Minister of Science and Higher Education, including the National Program for the Development of Humanities, Science for Society, Implementation Doctorate, Pearls of Science and Scholarships for Outstanding Young Scientists. Programmes financed by the European Union: European Funds for a Modern Economy and the National Plan for Recovery and Resilience, Horizon Europe, ERC grants, and INTERREG, also play an important role in this area.
3. Materials and Methods
A selection of methods employed in the evaluation of the quality and performance of HE have been outlined in the work of [48]. In order to assess the financial situation of Polish universities, which is an indicator of the sustainable development of these institutions, selected methods of multidimensional analysis will be used.
3.1. Linear Ordering
The Taxonomic Measure of Development (TMD) was utilised for the purpose of classification, yielding a classification (ranking) of universities according to selected variables, while the k-means method was employed for the purpose of grouping universities into homogeneous clusters.
The TMD method was proposed by Hellwig [49] and has found many applications in economic research [50,51]. In contrast to the original version, in which variables are subjected to standardisation for the purpose of normalisation, the present study employed Min–Max transformation for the normalisation of variables (see Equation (1). In order to ensure the comparability of the TMD values obtained throughout the entire analysed period, the minimum and maximum values for each variable were identified for all the years under consideration.
where
—number of object, , —number of objects,
—number of variable, , —number of variables,
—value of th variable for th object before normalisation,
—minimum of values of th variable,
—maximum of values of th variable,
—value of th variable for th object after normalisation.
The selection of a suitable normalisation method is not trivial and deserves special attention to scale adjustments, highly skewed indicators, data properties, and the objectives of the composite indicator [52]. As posited by some authors, the employment of particular transformations can result in substantial differentiation in the domains of variability of normalised variables. This phenomenon can lead to the introduction of unintended weights assigned to individual variables that do not accurately reflect their original importance [53].
The prevailing approach to standardisation is widely regarded as the most prevalent form of normalisation. Numerous authors, in addition to a plethora of statistical and econometric software packages [54], have indicated the feasibility of employing an array of alternative normalisation formulas, including the Min–Max function. In both standardisation and the Min–Max formula, indicators with extreme values have been shown to have a greater effect on the composite indicator [52]. However, their primary advantage lies in their capacity to function as variables that can accept both positive and negative values, in addition to the null value.
It is evident that Min–Max normalisation has the capacity to broaden the range of indicators contained within a narrow interval. This phenomenon has the potential to amplify the impact of the composite indicator to a greater extent than that achieved by the z-score transformation. This is particularly evident in cases of extreme values. However, it is noteworthy that certain studies have identified the equal range of variation in variables normalised using the Min–Max function as a beneficial aspect, as it enables the attainment of normalisation results irrespective of the distribution type of the normalised variables [55].
As Milligan and Cooper [56] demonstrated in their seminal study, utilising simulations based on a range of data sets and ordering methods, Min–Max procedures were identified as being among the most effective. Mirkin [57] obtained identical results and demonstrated that normalisation procedures based on range are consistently effective. It is also noteworthy that this technique was employed in the construction of the Human Development Index [55]. A similar solution was employed by Mazziotta and Pareto [58], although they proposed a different reference point instead of the minimum.
The foundation for the calculation of TMD is predicated on the identification of pattern (P) and antipattern (A). The determination of these values is based on the largest and smallest values of the normalised variables, respectively. The value of the TMD for the given object is determined as the ratio of the distance between the object and antipattern and the distance between pattern and antipattern (see Equation (2)).
where:
—value of taxonomic measure of development for th object,
—represents th object characterised by normalised values of analysed variables.
A higher TMD value is indicative of a higher ranking position for an object in question.
3.2. Cluster Analysis
The -means method is a multidimensional analysis technique that facilitates the allocation of objects to clusters, with each object being assigned to the cluster that has the nearest centroid (i.e., the cluster centre). The centroid of a given set of data is defined as the object with values of the variables calculated as means for objects in the given cluster. According to Johnson [59], the following steps are involved in this process:
- The objects are partitioned into k initial clusters.
- The subsequent step involves the progression through the list of objects, with the objective of assigning an object to the cluster whose centroid is nearest. Then all new centroids must be recalculated.
- It is imperative that Step 2 is repeated until no further reassignments are made.
The final assignment of items to clusters is contingent upon the initial partition. The k-means method is predicated on the minimisation of an objective function, which can be defined as the sum of the squared distances of all objects to their centroids, also known as the sum of the squared error (SSE), computed according to Equation (3).
where:
—number of clusters,
—the centroid of th cluster,
—the Euclidean distance between centroid of th cluster and object from this cluster.
The crucial question in case of -means method is determination of the number of classes. For this purpose, the Caliński–Harabasz (CH) index and the clustering quality measure can be used (see Equation (4)). As Milligan and Cooper [60] demonstrated through the analysis of 30 distinct methods (stopping rules), this index is the most effective in indicating the correct number of groups. CH index is defined as the ratio of the between-cluster separation (BCSS) to the within-cluster dispersion (WCSS), normalised by their number of degrees of freedom.
where:
—number of objects,
—number of clusters,
BCSS (Between-Cluster Sum of Squares):
—number of objects in cluster ,
—centroid of cluster ,
—overall centroid of the data,
WCSS (Within-Cluster Sum of Squares):
—element of given cluster.
An alternative to the CH index may be the measure proposed by the authors, which is calculated as the sum of the means of distances between objects and their nearest centroid (Equation (7)).
where:
—clustering quality measure,
—number of clusters,
—number of objects in cluster ,
—centroid of cluster ,
—element of a given cluster.
In contrast to the CH index, a smaller value of this measure is indicative of a superior quality of clustering.
Following the delineation of specific divisions of objects into homogeneous groups in individual years, the degree of similarity between them can be assessed. In such cases, the Rand index (CR) is frequently employed [61]. The CR index is a metric that is employed to determine the consistency of object pairs in terms of their cluster affiliation across two consecutive years. It does so by assessing whether these pairs remain in the same cluster or if there has been a change in their cluster affiliation from one year to the next (see Equation (8)).
where:
—number of objects,
—number of object,
, if objects and belong to the same group in two consecutive years or objects and do not belong to the same group in two consecutive years,
, if objects and belong to the same group in one year and objects and do not belong to the same group in consecutive years.
The CR index assumes values between 0 and 1. A higher CR index value is indicative of greater similarity in clustering results over two consecutive years.
3.3. Cluster Characteristics
It is imperative to identify the characteristics of each cluster to facilitate the analysis of the evolution of objects between groups over time. In this context, the Global Index [62] presented in Equation (9) can serve as a valuable resource.
where:
—Global Index of the cluster ,
—number of cluster,
—number of variables,
—value of the variable for the cluster ,
—position of in the ranking of variables.
The specificity of individual groups was determined on the basis of the results of the k-means method applied to the first year of the study period.
3.4. Individual Indicators
The financial condition of universities is often assessed using indicators such as the basic reserve, profitability, return on net assets, net operating income, and revenue diversification measures [63]. The following four economic and financial indicators will be utilised in the present study:
It was hypothesised that all the individual indicators had an equal impact on the financial situation of the entities under examination. For this reason, and considering that establishing a weighting system always involves a degree of subjectivity, no weights were introduced for individual indicators.
4. Results
The financial situation of HEIs is influenced by a number of factors. Firstly, the amount of funds allocated in the state budget for financing HE and science has a direct impact on the financial resources of HEIs. Secondly, the method of distributing these funds among individual universities and obtaining additional sources of income also has a significant impact. Thirdly, the effectiveness of HEIs’ management of these funds is also a key factor. The aforementioned factors ultimately determine the potential for development of the higher education and science sector, and, in particular, its sustainability.
The analysis of the financial situation of Polish universities will be preceded by a discussion of the level of expenditure on higher education and science incurred by European Union member states and the expenditure allocated to this sector in Poland’s draft budgets.
4.1. European Union Perspective
The analysis of the possibilities for sustainable development of Polish higher education will be preceded by a presentation of the level of funding for this sector of the economy in European Union countries. Figure 1 demonstrates general government expenditure for tertiary education as a percentage of gross domestic product (GDP) for all member states in both 2001 and 2023.
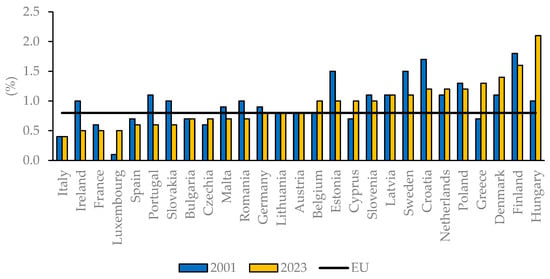
Figure 1.
General government expenditure for tertiary education as a percent of gross domestic product for Member States in 2001 and 2023.
The lowest values of these expenditures, which were lower than the average value for the European Union, were characteristic of Italy, France, Luxembourg, and Spain in both years. A clear delineation between two distinct groups of countries is evident. The first is typified by a diminution in expenditure on higher education as a proportion of GDP. This group includes countries such as Ireland, Portugal, Slovakia, Estonia, and Croatia.
In the case of the second group, which includes Luxembourg, Belgium, Cyprus, Greece, Denmark, and Hungary, an increase in this variable was observed. It is evident from an analysis of the development of the examined expenditures that their level in relation to GDP is comparatively low in the member states. This is a deviation from the level indicated in numerous strategic documents, both domestic and foreign, as the target.
4.2. Poland Overall Perspective
As illustrated in Figure 2, the analysis provides a comprehensive overview of the planned annual budgetary allocations for HE and scientific research in Poland for the period 2016–2026, excluding the budgetary provisions for applied research.
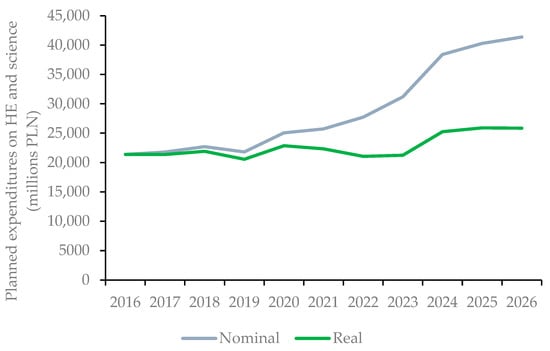
Figure 2.
Planned annual budgetary allocations for HE and scientific research in Poland for the period 2016–2026, excluding the budgetary provisions for applied research (millions PLN).
A substantial increase in these expenditures was planned for 2023 and 2024, primarily due to anticipated significant pay rises in the public sector and an increase in the minimum wage. The planned expenditure on HE and science in nominal terms increased by 93.54% over the 11-year period analysed, while in real terms the increase was only 20.87%.
4.3. Polish Universities Perspective
A comprehensive evaluation of the financial status of Polish higher education and science, to ascertain the prospects for sustainable development, will be conducted. This evaluation will be informed by data from the 21 largest Polish universities that are members of the Conference of Rectors of Polish Universities, covering the period 2019–2024:
- Adam Mickiewicz University in Poznań—UAM
- Cardinal Stefan Wyszyński University in Warsaw—UKSW
- Jagiellonian University in Krakow—UJ
- Jan Kochanowski University in Kielce—UJK
- Kazimierz Wielki University in Bydgoszcz—UKW
- Maria Curie-Skłodowska University in Lublin—UMCS
- Nicolaus Copernicus University in Toruń—UMK
- The John Paul II Catholic University of Lublin—KUL
- The Pontifical University of John Paul II in Krakow—UPJPII
- University of Bialystok—UwB
- University of Gdańsk—UG
- University of Jan Długosz of Częstochowa—UJD
- University of Lodz—UŁ
- University of Opole—UO
- University of Rzeszów—UR
- University of Silesia in Katowice—UŚ
- University of Szczecin—US
- University of Warmia and Mazury in Olsztyn—UWM
- University of Warszawa—UW
- University of Wrocław—UWr
- University of Zielona Góra—UZ
This group of universities received 48.07% of the aggregate subsidy allocated to all Polish universities in 2024 from funds earmarked for the upkeep and advancement of teaching and research potential.
In 2024, the coefficient of variation calculated for the basic subsidy of the 21 examined Polish universities was equal to 75.47%, confirming the occurrence of significant inequality of their revenues. The result is consistent with the findings of Czarnecki and Sauer [64]. An investigation into the financial aspects of 21 European countries during the period 2013–2017 revealed significant cross-country variations in the inequality of revenues among HEIs. These variations can be attributed to the diversity in size, research activity, and subject specialisation.
The capacity to accomplish teaching and research objectives whilst sustaining a balance between income and expenditure constitutes a pivotal factor in evaluating the financial stability of universities [65].
This phenomenon is also evident in the case of the 21 universities analysed, for which operating costs (costs from core operations) exceeded operational revenues (revenues from core operations) for most of the 2019–2024 period (see Figure 3).
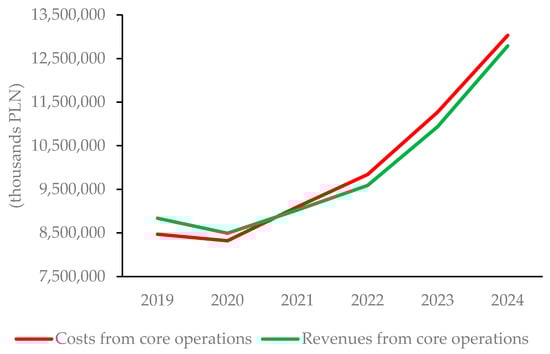
Figure 3.
Revenues and costs from core operations for 21 analysed universities in 2019–2024.
In the years 2019 and 2020, revenues from core operations surpassed costs from core operations. However, in 2021, costs exceeded revenues, and this trend persisted until 2024. In 2024, as many as 15 of the 21 universities grouped in the Conference of Rectors of Public Universities incurred losses on their operating activities. In 2019, the number of such cases was a mere five. The main contributors to this disparity have been salaries, materials, energy, and external services. It is evident that the majority of subsequent years’ increases in subsidies were attributable to statutory increments in university staff salaries, including the minimum wage, which escalated by 91.11% between 2019 and 2024. This has the potential to result in an elevated risk of operating losses, which, in turn, may precipitate adverse financial outcomes.
From 2014 to 2023, there was a marked deterioration in the financial situation of all Polish universities. During this period, the real growth rate of their operational revenues remained substantially below the country’s economic growth rate [66].
The financial results for the examined public universities demonstrated a decline from 2019 to 2023 during the period under review. In 2024, a substantial increase in financial results was observed, reaching approximately fivefold the previous level. This growth can be attributed to the financial support provided by the Ministry of Science and Higher Education, which took the form of bonds allocated to universities.
As demonstrated in Figure 4, the fundamental subsidy is juxtaposed with remuneration (including overheads) in 2019–2024. The data contains only the 20 largest Polish universities due to the fact that the Jan Dlugosz University in Czestochowa was not a member of the Conference of Rectors of Polish Universities between the years 2019 and 2022. It is also noteworthy that, with effect from 1 June 2023, the Piotrków Academy was excluded from the structure of Jan Kochanowski University in Kielce. In this case, the term ‘basic subsidy’ is understood to refer to a subsidy allocated to sustain and enhance the research and teaching capabilities of universities. This concept encompasses a base subsidy, the determination of which is guided by the algorithm outlined in Section 2.2.
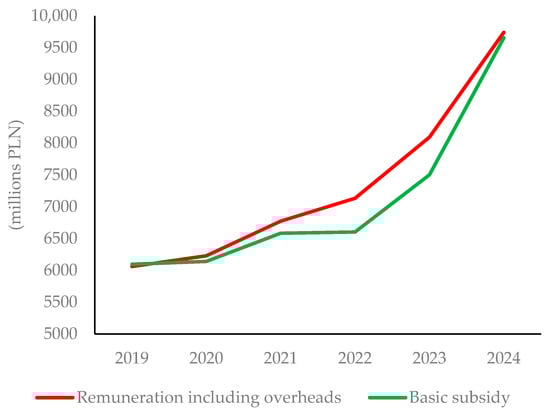
Figure 4.
Basic subsidy and remuneration, including overheads, for the 20 largest Polish universities in 2019–2024.
It is noteworthy that only in 2019 did the universities surveyed experience a surplus in subsidies over salaries and overheads. In 2020, 11 universities were unable to cover salaries and associated costs with the available subsidies. By 2021, this number had increased to 12. In the subsequent biennium, 2022–2023, this proportion was exacerbated further. In 2022, as many as 16 universities were unable to finance salaries with overheads from the subsidy, and in 2023, there were 17. In the most recent year for which data is available, 2024, a substantial enhancement was observed in this regard. A mere six universities have been unable to cover remuneration and overheads with the subsidy granted.
In Figure 5, non-subsidy revenues from research activities by primary funding sources for the 21 largest Polish universities from 2019 to 2024 were presented, with the notable exception of Jan Dlugosz University in Czestochowa from 2019 to 2022.
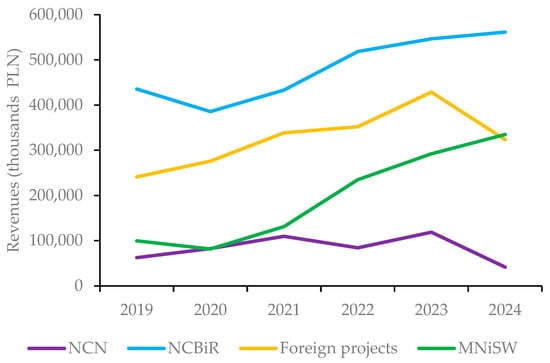
Figure 5.
Non-subsidy revenues from research activities by primary funding sources for the 21 largest Polish universities from 2019 to 2024.
The principal source of funding for scientific research undertaken by the universities under scrutiny was the National Centre for Research and Development, constituting 51.93% of all research revenue in 2019. In the preceding year, funds obtained from foreign projects were the second most significant source of revenue, accounting for 28.75% of the total. In 2024, these revenues amounted to 44.52% and 25.63%, respectively. In the current year, the allocation of funds to research by the Ministry of Science and Higher Education has increased in significance, accounting for 26.56% of research revenues.
Figure 6 represents total revenue derived from research activities, in addition to revenue from commissioned work undertaken for external entities, as a proportion of the ministerial subsidy for the 21 universities under analysis during the period of 2019–2024, excluding Jan Dlugosz University in Czestochowa from 2019 to 2022.

Figure 6.
The shares of total revenue from research activities and revenue from commissioned work performed for external entities in the ministerial subsidy for the 21 analysed universities in 2019–2024.
The ratio of total research revenue exhibited growth during the period of 2021–2023; however, it subsequently experienced a substantial decline of 11.61% in 2024 compared to the previous year, primarily attributable to a considerable decrease in research and development funds obtained from foreign sources. A more pronounced decline was observed in revenue from research work for external entities, which, when analysed in relative terms in relation to subsidies, decreased by as much as 37.36%. It is also noteworthy that the value of this revenue is relatively low, indicating limited cooperation between the university and its environment in the field of research and development.
Table 1 presents the basic descriptive statistics of the used indicators. In the course of calculating their value, as well as in all subsequent analyses, the Jan Dlugosz University in Czestochowa was not included due to the absence of relevant data for the initial four years.

Table 1.
Selected statistical parameters of applied indicators.
For X1, the mean and median increased throughout the entire analysed period, and the differences between them were minimal. For X2, the mean, median, and other descriptive statistics have declined in the last year, and in 2023, the maximum was much higher than in other years, which was the value for the John Paul II Catholic University of Lublin. For X3, the values of all statistics remain consistent throughout the entire period under analysis. The most significant variation in the values of the statistics examined was observed for X4. In 2022, the largest outlier for X4 was identified as the Pontifical University of John Paul II in Krakow.
Table 2 presents values of TMD and rankings for 20 examined universities in 2019–2024.
Table 2.
TMD for 20 analysed universities—positions and values in 2019–2024.
A higher TMD value (ranking position) is indicative of a more favourable assessment of the financial situation of a given university, associated with a higher level of investments. The enhanced financial viability of a given entity facilitates the undertaking of extensive research initiatives and the financing of collaborative projects with entities within its milieu, encompassing the industrial sector. It is evident that, in the long term, this will result in increased revenues from the commercialisation of research. Moreover, within the context of the prevailing algorithm for financing higher education and science in Poland, this will enable a higher level of funding from the state budget. Consequently, this will contribute to the sustainable development of the university.
It was found that in the initial years of the analysis, the correlation between TMD values in consecutive years was moderate (approximately 0.5), and this correlation increased in subsequent years of the analysis, reaching 0.72 and 0.90 in 2022/2023 and 2023/2024, respectively. This suggests that, over time, universities tend to maintain their previous position in accordance with their financial situation.
The Jagiellonian University (UJ) sustained its position as the foremost university in terms of economic and financial standing throughout the vast majority of the period under consideration. The University of Warsaw (UW), the second-largest Polish university, experienced a slight decline in its ranking, yet it maintained its position as the second-best institution in the country. Other universities that also recorded significant advances in the above rankings include the Pontifical University of John Paul II in Krakow (UPJPII), the University of Opole (UO), the University of Rzeszów (UR), and the University of Wrocław (UWr).
Conversely, Kazimierz Wielki University in Bydgoszcz (UKW), University of Silesia (UŚ), University of Łódź (UŁ), and notably University of Zielona Góra (UZ) have documented a substantial deterioration in their economic and financial circumstances, thereby considerably diminishing the prospects for the sustainable development of these institutions.
The findings of this study do not corroborate the conclusions drawn by certain researchers, who hypothesised that large universities situated in major urban centres possess the greatest growth potential. For instance, Tran and Villano’s [67] study highlighted the necessity for the government and policymakers to devise more favourable policies to assist nonmetropolitan universities in supporting their educational environment and enhancing their performance.
Figure 7 compares two rankings of the 20 surveyed universities according to TMD comparable values, obtained for the first and last year of the period under consideration.

Figure 7.
Ranking of 20 surveyed universities according to TMD in 2019 vs. ranking in 2024.
The distribution of points representing individual universities corroborates the findings presented in Table 2, with all data points situated above and below the line denoting an equivalent TMD value in both years under consideration. This indicates an enhancement and deterioration, respectively, in their economic and financial status. It is evident that a greater distance from this line in the vertical direction is indicative of a more significant improvement in the situation for the first group of universities. Conversely, a greater distance for universities below this line is indicative of a greater deterioration in their economic and financial situation.
The subsequent phase of the analysis entailed the classification of the 20 universities under consideration into homogeneous groups based on their economic and financial circumstances. The determination of the optimal number of clusters was facilitated by the implementation of two distinct metrics: the Caliński–Harabasz index and the clustering quality measure proposed by the authors. The values of these measures are shown in Table 3.
Table 3.
Caliński–Harabasz index and the clustering quality measure for 4 and 5 clusters.
The Caliński–Harabasz index and the clustering quality measure indicated different numbers of classes in each year. However, in the majority of cases, the values indicated that the optimal division was into four clusters.
The allocation of individual objects to groups was based on the centres of gravity obtained for the initial year of the analysed period. The variable standardisation procedure was executed in a dynamic way, i.e., the mean and standard deviation were calculated on the basis of data from all the years studied. Table 4 presents the results of clustering results of the universities under scrutiny in subsequent years.
Table 4.
Clustering results in 2019–2024.
Utilising the Global Index, it can be concluded that cluster 1 encompasses universities that demonstrate the best economic and financial situation, while cluster 4 comprises those institutions that exhibit the most deficient economic and financial circumstances. In 2021–2024, two Catholic universities, KUL and UPJPII, attained commendable economic and financial outcomes due to their substantial non-subsidy funding. The universities that struggled in their economic and financial conditions in virtually all years included UwB, US, UWr, and UZ. It is interesting to note that despite being funded under the “Initiative of Excellence—Research University” programme, both UWr and UAM appear in all years in the two groups of universities with the worst economic and financial conditions.
Given the lack of uniformity in the grouping results obtained for individual years, the Rand index was utilised to assess the consistency of the classification obtained. The values are presented in Table 5.
Table 5.
Rand index values for 4 clusters.
It can be posited that the values of the Rand index are subject to a maximum value of 1. This would indicate that, on an annual basis, the outcomes of the clustering process were characterised by a relatively high degree of similarity. This is evidenced by the fact that the values of this measure were above 0.55 in each two-year period.
However, it should be emphasised that the results of the assessment of the universities’ positions and their affiliation to particular clusters obtained in the research sample indicate relatively strong volatility in the economic and financial situation of individual universities over time. This is primarily attributable to fluctuations in non-subsidy funding and capital expenditure funds. The volatility in this area is undoubtedly a factor that limits the effectiveness of fund management and, consequently, reliable planning for the sustainable development of universities.
5. Discussion and Conclusions
The transition of industries from a resource-intensive to an innovation-intensive model necessitates the development of a robust and contemporary educational framework. In the absence of a robust educational and scientific infrastructure, coupled with the absence of adequately trained personnel, economic growth is likely to be constrained, resulting in an economy that remains mired in the middle-income trap. However, the effective functioning of this system requires adequate funding, regardless of whether these funds are public or private, because the level of funding determines the scope of activities and the nature and quality of achievements obtained by universities [68].
A review of the examined Polish universities, which broadly reflects the situation of all Polish HEIs, reveals unfavourable trends in this area in recent years. These include, in particular, operating costs that exceed operating revenues, deteriorating financial results, insufficient funding from the state budget in relation to the scale of operations, and a continuing decline in student numbers. These phenomena have been shown to impose substantial limitations on the sustainable development of Polish universities, whilst concomitantly exerting a negative influence on the intensity of cooperation between science and business.
Despite the allocation of substantial financial resources to Polish universities in 2024–2025 by institutions providing support on a competitive basis, the development of research, the intensification of cooperation with business, and the implementation of national and international projects remain at a low level. This is primarily due to limited opportunities for researchers to finance their own contributions and, above all, the often-required pre-financing of R&D activities. In such cases, it is imperative to explore alternative sources of financing, with private funds being a primary option given the limited state budget allocation. However, it is important to note that despite the limitations indicated above, Poland was positioned 39th among the 139 countries with regard to research cooperation between businesses and the scientific community in accordance with the 2025th World Intellectual Property Organization ranking, despite inadequate financial support for R&D and HE [69].
The paucity of adequate financial resources has the effect of engendering significant problems for universities, which relate to the increasing cost of education, the renewal of physical infrastructure, and technological changes. Moreover, the prevailing indexation mechanism for financing HE and scientific research does not guarantee funds for development and revenue stability, and engenders disparities between planned and real indicators, thereby complicating university governance [66].
When interpreting the current financial conditions of the analysed universities and their relatively high volatility in subsequent years, it should be noted that the research sample does not cover the entire HE and science sector in Poland. The relatively limited timeframe of the research period also imposes constraints on the interpretation of the results obtained. This is attributable to the alterations in the financing of Polish HE in 2019.
In the context of the evaluation of the economic and financial situation of the universities examined, it is imperative to acknowledge that the application of financial metrics in isolation possesses the capacity to obfuscate the authentic picture of the efficiency and efficacy of HEIs. In order to obtain a more comprehensive assessment, it is necessary to apply measures of quality and those measuring the extent of cooperation with the university’s environment [70].
When evaluating the performance of universities, it is also important to bear in mind that, in addition to their education and commercialisation function, these entities are expected to cultivate strong relationships with communities and regional partners to create regional socioeconomic growth [71,72].
Further research is required to examine and evaluate the effects of HE funding and R&D activity. It would be worthwhile to expand the spatial scope of the sample to include other European Union member states. The quantitative analysis itself should be enriched with additional indicators characterising the economic and financial situation of universities and alternative research methods. A potentially fruitful avenue for further research would be to conduct a qualitative analysis of the state of HE and science. This analysis could take the form of in-depth interviews with the most important stakeholders in this sector of the economy.
Author Contributions
Conceptualization, B.B. and J.B.; methodology, B.B. and J.B.; formal analysis, B.B. and J.B.; data curation, B.B. and J.B.; writing—original draft preparation, B.B. and J.B.; writing—review and editing, B.B. and J.B.; visualisation, B.B. and J.B.; funding acquisition, J.B. All authors have read and agreed to the published version of the manuscript.
Funding
This research was funded by the University of Szczecin.
Institutional Review Board Statement
Not applicable.
Informed Consent Statement
Not applicable.
Data Availability Statement
The original data presented in the study and related to the European level and national level are openly available in the Eurostat database https://www.ec.europa.eu/eurostat (accessed on 10 June 2025), https://www.stat.gov.pl (accessed on 11 June 2025), and https://www.gov.pl/web/finanse (accessed on 12 June 2025). Economic and financial data related to the examined entities are available on request from the corresponding author due to the consent to disclosure of the University Financial Commission of the Conference of Rectors of Polish Universities.
Acknowledgments
A selection of the findings from this study was presented as a paper at the 33rd Scientific Conference of the Classification and Data Analysis Section of the Polish Statistical Association, which was held in Krakow from the 5th to the 6th of June 2024.
Conflicts of Interest
The authors declare no conflicts of interest.
Abbreviations
The following abbreviations are used in this manuscript:
| HE | High Education |
| HEIs | High Education Institutions |
| R&D | Research and Development |
| TMD | Taxonomic Measure of Development |
References
- Barwińska-Małajowicz, A. Inseparability of Two Dimensions: Local and Global as the Conditio Sine Qua Non Regarding the Quality of Contemporary Education at a University Level. Folia Oecon. Stetin. 2011, 10, 202–212. [Google Scholar] [CrossRef]
- OECD. Education at a Glance 2025: OECD Indicators; OECD Publishing: Paris, France, 2025. [Google Scholar] [CrossRef]
- Tang, T.C.; Lai, S.L. Government Spending on Tertiary Education, Knowledge, Technology, and Economic Growth. J. Econ. Dev. 2022, 47, 99–122. [Google Scholar]
- Peña-Vinces, J.; Audretsch, D. Tertiary education and science as drivers of high-technology exporting firms growth in developing countries. J. Technol. Transf. 2021, 46, 1734–1757. [Google Scholar] [CrossRef]
- Bhuiyan, A. Financing education: A route to the development of a country. Educația Plus 2020, 1, 56–67. Available online: https://www.ceeol.com/search/article-detail?id=852850 (accessed on 10 July 2025).
- Zhou, G.Y.; Luo, S.M. Higher Education Input, Technological Innovation, and Economic Growth in China. Sustainability 2018, 10, 2615. [Google Scholar] [CrossRef]
- Li, J.; Xue, E.; Wei, Y.; He, Y. How popularising higher education affects economic growth and poverty alleviation: Empirical evidence from 38 countries. Humanit. Soc. Sci. Commun. 2024, 11, 520. [Google Scholar] [CrossRef]
- Chowdhury, M.B. Internationalisation of education and its effect on economic growth and development. World Econ. 2022, 45, 200–219. [Google Scholar] [CrossRef]
- Antonowicz, P.; Bukowski, Z.; Wendt, D. Analiza Ekonomiczna Uniwersytetów Publicznych za Lata 2020–2024; UKF KRUP, Uniwersytet Gdański, UKW w Bydgoszczy, Wydawnictwo Uniwersytetu Gdańskiego: Gdańsk, Poland, 2025. [Google Scholar]
- Pinto, T.; Teixeira, A.A.C. The impact of research output on economic growth by fields of science: A dynamic panel data analysis, 1980–2016. Scientometrics 2020, 123, 945–978. [Google Scholar] [CrossRef]
- Sattara, A.; Hassan, A.; Hussain, M.N.; Sakhi, U.; Hordofa, T.T. Does China’s Education and Cultural Diplomacy Promote Economic Growth in the Belt and Road Countries? Chin. Econ. 2024, 57, 18–32. [Google Scholar] [CrossRef]
- Pastor, J.M.; Peraita, C.; Serrano, L.; Soler, Á. Higher education institutions, economic growth and GDP per capita in European Union countries. Eur. Plan. Stud. 2018, 26, 1616–1637. [Google Scholar] [CrossRef]
- Guo, P.; Chen, H.; Hu, X. Coupling coordination mechanism of higher education and industrial economy: Evidence from higher education institutions in Chongqing, China. Humanit. Soc. Sci. Commun. 2024, 11, 1754. [Google Scholar] [CrossRef]
- Caglayan-Akay, E.C.; Celen, M.; Yilmaz, S. An investigation of causal relationship between public education expenditures and economic growth in Turkiye: Evidence from provincial level analysis. METUSD 2025, 52, 203–237. [Google Scholar]
- Bouchakour, R.; Saad, M.; Guermat, C. Higher education teaching and training system and economic performance: An empirical investigation. J. Educ. Wor. 2019, 32, 500–517. [Google Scholar] [CrossRef]
- Marozau, R.; Guerrero, M.; Urbano, D. Impacts of Universities in Different Stages of Economic Development. J. Knowl. Econ. 2021, 12, 1–21. [Google Scholar] [CrossRef]
- Drucker, J. An evaluation of competitive industrial structure and regional manufacturing employment change. Reg. Stud. 2015, 49, 1481–1496. [Google Scholar] [CrossRef]
- Ma, C.; Wu, H.; Li, X. Spatial spillover of local general higher education expenditures on sustainable regional economic growth: A spatial econometric analysis. PLoS ONE 2023, 18, e0292781. [Google Scholar] [CrossRef]
- Minviel, J.J.; Ben Bouheni, F. The impact of research and development (R&D) on economic growth: New evidence from kernel–based regularized least squares. J. Risk Finance 2022, 23, 583–604. [Google Scholar] [CrossRef]
- Adamakou, M.; Kallioras, D.; Petrakos, G. Detecting Convergence Trends among EU Universities. Economies 2021, 9, 42. [Google Scholar] [CrossRef]
- Lendel, I.; Qian, H. Inside the Great Recession: University Products and Regional Economic Development. Growth Change 2017, 48, 153–173. [Google Scholar] [CrossRef]
- Valero, A.; Van Reenen, J. The economic impact of universities: Evidence from across the globe. Econ. Educ. Rev. 2019, 68, 53–67. [Google Scholar] [CrossRef]
- Agasisti, T.; Bertoletti, A. Higher Education and Economic Growth: A Longitudinal Study of European regions 2000–2017. Socio-Econ. Plan. Sci. 2022, 81, 100940. [Google Scholar] [CrossRef]
- Dominguez, J.F.C. Higher Education, Regional Growth and Cohesion: Insights from the Spanish Case. Reg. Stud. 2021, 55, 1403–1416. [Google Scholar] [CrossRef]
- De Ridder, M.; Hannon, S.M.; Pfajfar, D. The Multiplier Effect of Education Expenditure. In Finance and Economics Discussion Series; Board of Governors of the Federal Reserve System: Washington, DC, USA, 2020; pp. 2020–2058. [Google Scholar] [CrossRef]
- Addie, J.P. From urban universities to university in urban society. Reg. Stud. 2017, 51, 1089–1099. [Google Scholar] [CrossRef]
- BiGGAR Economics. The Economic Contribution of the LERU Universities in 2016. 2017. Available online: https://www.leru.org/files/The-Economic-Contribution-of-the-LERU-Universities-2016-Full-paper.pdf (accessed on 15 June 2025).
- Bing, B. The impact of higher education on high quality economic development in China: A digital perspective. PLoS ONE 2023, 18, e0289817. [Google Scholar] [CrossRef]
- Li, B.; Kang, C. Research on the Contribution of Higher Education to the Sustainable Development of the Economy in China: An Empirical Analysis Based on Provincial Panel Data from 2014 to 2023. Sustainability 2025, 17, 1024. [Google Scholar] [CrossRef]
- Busemeyer, M.R. Determinants of Public Education Spending in 21 OECD Democracies, 1980–2001. J. Eur. Public Policy 2007, 14, 582–610. [Google Scholar] [CrossRef]
- Chu, S.; Kuroki, M.; Liu, X. Do research universities boost regional economic development? -A case study of University of Science and Technology of China. Appl. Econ. 2022, 54, 3392–3411. [Google Scholar] [CrossRef]
- Garcia-Alvarez-Coque, J.-M.; Mas-Verdú, F.; Roig-Tierno, N. Life Below Excellence: Exploring the Links Between Top-Ranked Universities and Regional Competitiveness. Stud. High. Educ. 2021, 46, 369–384. [Google Scholar] [CrossRef]
- Holmes, C. Has the Expansion of Higher Education Led to Greater Economic Growth? Natl. Inst. Econ. Rev. 2013, 224, R29–R47. [Google Scholar] [CrossRef]
- Li, D.; Sun, X.; Li, T. Promoting global sustainable development: Spatial spillover effects of higher education on economic and ecological sustainability. Discov. Sustain. 2025, 6, 266. [Google Scholar] [CrossRef]
- Karaçor, Z.; Güvenek, B.; Ekinci, E.; Konya, S. Relationship with Education Expenditure and Economic Growth in OECD Countries: A Panel Data Analysis. DIEM Dubrov. Int. Econ. Meet. 2017, 3, 255–269. [Google Scholar]
- Cohen, A. The Importance Of Higher Education On Economic Growth. Stud. Univ. Babeş-Bolyai, Stud. Eur. 2023, 1, 321–344. Available online: https://www.ceeol.com/search/article-detail?id=1134316 (accessed on 21 November 2025). [CrossRef]
- Banyś, W. Finansowanie Szkolnictwa Wyższego i Nauki w Polsce z Uwzględnieniem Perspektywy Międzynarodowej. Raport 1; Raporty z Badań—Centrum Studiów nad Polityką Publiczną UAM: Poznań, Poland, 2021. [Google Scholar]
- Teferra, D.; Chacón, E.; Escribens, M.; Johnstone, B.; Malee Bassett, R.; Pedró, F.; Roser, J.; Varghese, N.V. Financing in Higher Education. In Proceedings of the World Higher Education Conference, Barcelona, Spain, 18–20 May 2022. [Google Scholar]
- Woźnicki, J. (Ed.) Prognoza Rozwoju Szkolnictwa Wyższego w Polsce do Roku 2030. Wizja, Misja, Uwarunkowania i Warianty Rozwojowe. Raport Końcowy; FRP, KRASP, Oficyna Wydawnicza SGH: Warszawa, Poland, 2024. [Google Scholar]
- EUA. Public Funding Observatory Report 2017. 2017. Available online: https://eua.eu/downloads/publications/eua-pfo-report-december-2017.pdf (accessed on 20 July 2025).
- Chankseliani, M.; McCowan, T. Higher education and the Sustainable Development Goals. High. Educ. 2021, 81, 1–8. [Google Scholar] [CrossRef]
- Shrestha, S. Financing Higher Education: A Comparative Critical Policy and Trends Analysis in the US, UK, China, and India Through Cost-Sharing and Marxian Theories; Centre for Higher Education, Research and Education, Department of Educational Research, Lancaster University: Lancaster, UK, 2024; Working Paper 7. [Google Scholar]
- Bugaian, L. Reconsideration of Financing Higher Education Institutions at International and National Level. J. Soc. Sci. 2020, 4, 6–16. Available online: https://www.ceeol.com/search/article-detail?id=1224685 (accessed on 25 July 2025).
- Buczek, J. Francuski model finansowania szkolnictwa wyższego—Studium przypadku. e-Mentor 2016, 1, 21–30. [Google Scholar] [CrossRef]
- Zacharewicz, T.; Lepori, B.; Reale, E.; Jonkers, K. Performance-based research funding in EU Member States—A comparative assessment. Sci. Public Policy 2019, 46, 105–115. [Google Scholar] [CrossRef]
- Abuselidze, G. Financing higher education: New challenges, incentives and opportunities. IOP Conf. Ser. Earth Environ. Sci. 2022, 1026, 012066. [Google Scholar] [CrossRef]
- Nie, D.; Panfilova, E.; Samusenkov, V.; Mikhaylov, A. E-Learning Financing Models in Russia for Sustainable Development. Sustainability 2020, 12, 4412. [Google Scholar] [CrossRef]
- Cao, C.; Wei, T.; Xu, S.; Su, F.; Fang, H. Comprehensive evaluation of higher education systems using indicators: PCA and EWM methods. Humanit. Soc. Sci. Commun. 2023, 10, 432. [Google Scholar] [CrossRef]
- Hellwig, Z. Zastosowanie metody taksonomicznej do typologicznego podziału krajów ze względu na poziom ich rozwoju i strukturę wykwalifikowanych kadr. Przegląd Stat. 1968, 15, 307–327. [Google Scholar]
- Pawełek, B. Metody Normalizacji Zmiennych w Badaniach Porównawczych Złożonych Zjawisk Ekonomicznych; Wydawnictwo Uniwersytetu Ekonomicznego w Krakowie: Kraków, Poland, 2008. [Google Scholar]
- Strahl, D. (Ed.) Metody Oceny Rozwoju Regionalnego; Wydawnictwo Akademii Ekonomicznej we Wrocławiu: Wrocław, Poland, 2006. [Google Scholar]
- Handbook on Constructing Composite Indicators. Methodology and User Guide; OECD: Paris, France, 2008.
- Kukuła, K. Metoda Unitaryzacji Zerowanej; Biblioteka ekonometryczna; Wydawnictwo Naukowe PWN: Warszawa, Poland, 2000. [Google Scholar]
- Walesiak, M.; Dudek, A. Symulacyjna optymalizacja wyboru procedury klasyfikacyjnej dla danego typu danych—Oprogramowanie komputerowe i wyniki badań. Pr. Nauk. Akad. Ekon. We Wrocławiu 2006, 1126, 120–129. [Google Scholar]
- Talukder, B.; Hipel, K.W.; van Loon, G.W. Developing composite indicators for agricultural sustainability assessment: Effect of normalization and aggregation techniques. Resources 2017, 6, 66. [Google Scholar] [CrossRef]
- Milligan, G.W.; Cooper, M.C. A study of variable standardization. J. Classif. 1988, 5, 181204. [Google Scholar] [CrossRef]
- Mirkin, B.G. Data driven classification and clustering. In Proceedings of the Classification Society of North America, Montréal, QC, Canada, 8–11 June 2000. [Google Scholar]
- Mazziotta, M.; Pareto, A. Normalization methods for spatio-temporal analysis of environmental performance: Revisiting the Min–Max method. Environmetrics 2022, 33, e2730. [Google Scholar] [CrossRef]
- Johnson, R.A.; Wichern, D.W. Applied Multivariate Statistical Analysis; Pearson Education, Inc.: Upper Saddle River, NJ, USA, 2007. [Google Scholar]
- Milligan, G.W.; Cooper, M.C. An examination of procedures for determining the number of clusters in a data set. Psychometrika 1985, 50, 159–179. [Google Scholar] [CrossRef]
- Rand, W.M. Objective Criteria for the Evaluation of Clustering Methods. J. Am. Stat. Assoc. 1971, 66, 846–850. [Google Scholar] [CrossRef]
- Libório, M.P.; Martinuci, O.d.; Machado, A.M.C.; Lyrio, R.d.; Bernardes, P. Time–Space Analysis of Multidimensional Phenomena: A Composite Indicator of Social Exclusion Through k-Means. Soc. Indic. Res. 2022, 159, 569–591. [Google Scholar] [CrossRef]
- Lee, Y.-H.; Kim, H.-K. Financial Support and University Performance in Korean Universities: A Panel Data Approach. Sustainability 2019, 11, 5871. [Google Scholar] [CrossRef]
- Czarnecki, K.; Sauer, P. The financial dimension of organizational stratification in European higher education. Int. J. Comp. Sociol. 2025, 66, 3–24. [Google Scholar] [CrossRef]
- Bisogno, M.; Citro, F.; Tommasetti, A. The financial distress of public sector entities. Evidence from Italian public universities. Int. J. Account. Audit. Perform. Eval. 2014, 10, 203–227. [Google Scholar] [CrossRef]
- Graca, M. The Level of Financing the Higher Education and Science Sector from Public Funds in Poland. J. Public Govern. 2024, 2, 23–37. [Google Scholar] [CrossRef]
- Tran, C.-D.T.T.; Villano, R.A. Financial Efficiency of Tertiary Education Institutions: A Second-Stage Dynamic Network Data Envelopment Analysis Method. SER Singap. Econ. Rev. 2021, 66, 1421–1442. [Google Scholar] [CrossRef]
- Benito, M.; Gil, P.; Romera, R. Funding, is it key for standing out in the university rankings? Scientometrics 2019, 121, 771–792. [Google Scholar] [CrossRef]
- WIPO 2025. Available online: https://www.globalinnovationindex.org/analysis-indicator (accessed on 15 June 2025).
- Dwórznik, M.; Opolski, K. Higher Education Efficiency and Quality. Studia Mater. 2021, 2, 46–60. Available online: https://www.ceeol.com/search/article-detail?id=1014588 (accessed on 8 August 2025).
- Thomas, E.; Faccin, K.; Asheim, B.T. Universities as orchestrators of the development of regional innovation ecosystems in emerging economies. Growth Change 2020, 52, 770–789. [Google Scholar] [CrossRef]
- Cerver-Romero, E.; Ferreira, J.J.; Fernandes, C.I. The multiple faces of the entrepreneurial university: A review of the prevailing theoretical approaches. J. Technol. Transf. 2021, 46, 1173–1195. [Google Scholar] [CrossRef]
Disclaimer/Publisher’s Note: The statements, opinions and data contained in all publications are solely those of the individual author(s) and contributor(s) and not of MDPI and/or the editor(s). MDPI and/or the editor(s) disclaim responsibility for any injury to people or property resulting from any ideas, methods, instructions or products referred to in the content. |
© 2025 by the authors. Licensee MDPI, Basel, Switzerland. This article is an open access article distributed under the terms and conditions of the Creative Commons Attribution (CC BY) license.