Abstract
The sustainable management of sewage sludge (SS) requires comparative evaluations that capture both environmental impacts and the trade-offs associated with emerging and established treatment routes. This study applies life cycle assessment (LCA) to compare hydrothermal carbonization (HTC), rotary kiln pyrolysis, and incineration using SS from the Salitre WWTP in Bogotá, Colombia, based on a life cycle inventory that integrates experimental characterization, Aspen Plus simulations, and Ecoinvent datasets modeled in EASETECH. Thirteen ILCD midpoint impact categories were assessed, and uncertainty was evaluated through global sensitivity analysis (GSA) and Monte Carlo simulations. The results show that the three technologies distribute their impacts differently across categories, as follows: HTC yields reductions in several categories due to carbon storage and fertilizer substitution but presents toxicity-related impacts linked to heavy metal transfer to soils; pyrolysis produces a pyrochar with metal retention and nutrient recovery potential that influences climate and resource-related categories while remaining sensitive to sludge composition; and incineration influences climate categories without the potential toxic effects of using chars in soils, reduces sludge volume, and facilitates subsequent nutrient recovery processes from ash, with lower uncertainty due to its technological stability. These results support circular economy strategies in low- and middle-income countries by clarifying the environmental conditions under which carbonized materials or ash-derived recovery pathways can be incorporated into sludge treatment systems.
1. Introduction
The increase in water demand has generated larger volumes of wastewater and sewage sludge (SS) [1]. Population growth and urban, industrial, and agricultural activities increase the pressure on sanitation systems [1]. In wastewater treatment plants (WWTPs), sewage sludge (SS) is the main by-product generated throughout several treatment stages. It is generally classified into primary sludge, originating from physical sedimentation processes, and secondary or biological sludge, produced during biological treatment. In advanced systems, tertiary and chemical sludges may also arise from nutrient removal or polishing stages [2]. The composition of SS includes organic matter, nutrients, pathogenic microorganisms, toxic organic and inorganic compounds, heavy metals and micropollutants of different sources [3]. In 2017, global SS production was estimated at 45 Mt (dry basis) [4]. Examples of SS generation are reported in Europe, Asia, and Latin America, including Bogotá’s Salitre WWTP, which produced 90.5 kt (wet basis) in 2024 [5].
SS management strategies depend on technological, regulatory, and social conditions. In the United States, 56% of SS is applied to soils, 27% is landfilled, and 16% is incinerated [6]. In Germany, 74% of SS is incinerated, whereas in Denmark, 82% is applied to soils [7]. In China, disposal routes include land application (29%), material uses (24%), incineration (27%), and landfilling (20%) [8]. In Japan, incineration represents 71% of SS treatment [9]. These heterogeneous strategies highlight the absence of a single global model and the need to evaluate sustainable options beyond traditional disposal. In Colombia, SS is primarily applied as a soil amendment; however, national regulations also enable the energy recovery from these residues [10]. Incineration has been explored at an industrial pilot scale [11], whereas other thermal technologies remain constrained by limited technological maturity and high capital investment requirements. Within this context, the circular economy framework promotes sewage sludge (SS) valorization [12,13]. This approach contrasts with linear waste management models, as the waste hierarchy prioritizes prevention, reuse, recycling, and valorization over final disposal [14]. In its dry fraction, SS contains a high proportion of inorganic material enriched with nutrients such as nitrogen (N), phosphorus (P), and potassium (K), making its recovery relevant for resource optimization. Consequently, SS is regarded as a secondary raw material for the production of bioproducts, fuels, and materials for agricultural and industrial applications.
Thermochemical processes represent promising alternatives for SS valorization [15]. Among these processes, incineration is a mature technology applied in several countries for stabilization, volume reduction and energy recovery [16]. Although it requires significant energy input for drying due to the high moisture content of SS, the subsequent combustion stage is exothermic and allows energy integration to support the drying process, achieving the highest volume reduction and leaving only ashes and flue gases. These ashes can also serve as a potential route for nutrient recovery, particularly phosphorus [17]. Pyrolysis also requires feedstock drying and produces solid product (pyrochar), liquid biofuels, and gaseous streams with energy recovery potential [18]. Depending on operating conditions such as temperature, heating rate, and residence time, pyrolysis can be classified as slow, intermediate, fast, or flash [18,19]. Rotary kiln reactors are commonly applied due to their continuous operation, flexibility in adjusting residence time, and relatively simple maintenance, which makes them suitable for SS treatment [20]. Hydrothermal carbonization (HTC) operates at 180–300 °C and autogenous pressure, directly processing wet sludge without pre-drying [21]. A subsequent dewatering step is required to separate the resulting mixture of solid and liquid products. HTC produces hydrochar, process water, and CO2. Pilot and industrial-scale applications have been reported in Europe and Asia, where most commercial HTC systems operate in semi-continuous high-pressure reactors for sludge conversion [21]. Some projects have developed or demonstrated continuous HTC operation, including the systems reported by Antaco and Ingelia [22,23], indicating that further technological development is still required. Pyrochar and hydrochar have potential applications in soil management and energy recovery [15]. However, comparative environmental assessments of HTC and pyrolysis under normal operating conditions [24,25,26], in relation to the more mature sludge management technology of incineration, remain limited, particularly from a resource valorization and circular economy perspective. Most studies focus predominantly on global warming potential, while neglecting broader life cycle-based assessments, homogeneous system boundaries, and feedstock conditions, as well as other relevant categories such as toxicity and resource recovery [27].
To evaluate technologies oriented to the production of solid products (chars) with higher potential for added value in SS management strategies, environmental assessments are required. Life cycle assessment (LCA) is the standardized methodology for quantifying environmental impacts [28]. In the context of waste management, LCA assesses effects on ecosystems, human health, and resource use [29,30]. It also enables the identification of material and energy flows and the estimation of benefits from resource substitution. Global Sensitivity Analysis (GSA) complements LCA by improving the robustness of results [31]. GSA quantifies the influence of uncertain parameters on system performance, integrating contribution analysis, uncertainty propagation, and discernibility analysis [31].
Although thermochemical valorization has been widely studied, current research presents important limitations. Most studies remain focused on single technologies, lack consistent life cycle-based evaluations, or neglect the role of uncertainty in modeling [32,33,34,35]. Comparative analyses of pyrolysis and HTC under homogeneous feedstock conditions and standardized system boundaries are scarce. This work addresses these gaps by (i) performing a comparative LCA of pyrolysis and HTC, with incineration as a reference technology [29,30]; (ii) integrating process simulation in Aspen Plus® with LCA modeling in EASETECH [30]; and (iii) applying GSA to identify critical parameters and strengthen interpretation of scenarios [31]. These contributions provide robust and reproducible evidence to support decision-making in SS management strategies at local levels.
Accordingly, the objective of this study is to compare LCA between pyrolysis and HTC, with incineration as benchmark. By integrating LCA and GSA, this study provides relevant evidence for SS management. The case of Bogotá is used as an illustrative case study in the context of a large city in low- and middle-income countries.
2. Materials and Methods
The goal of this life cycle assessment (LCA) is to compare the environmental performance of three thermal treatment technologies for sewage sludge (SS) with a moisture content of 77.4% (characterization is detailed in Section 2.2.1): incineration, pyrolysis, and hydrothermal carbonization (HTC). Incineration is considered as the benchmark, with ash managed through landfill disposal, whereas pyrolysis and HTC are assessed as valorization routes producing chars intended for agricultural soil application.
The functional unit (FU) and the reference flow defined in this study is the treatment of 1 t of anaerobically digested sewage sludge (SS), expressed on a dry matter basis, produced at Salitre WWTP.
2.1. Scope and System Boundaries
The system boundaries are illustrated in Figure 1, which defines the processing routes of SS through the three scenarios: incineration (S0), pyrolysis (S1), and HTC (S2).
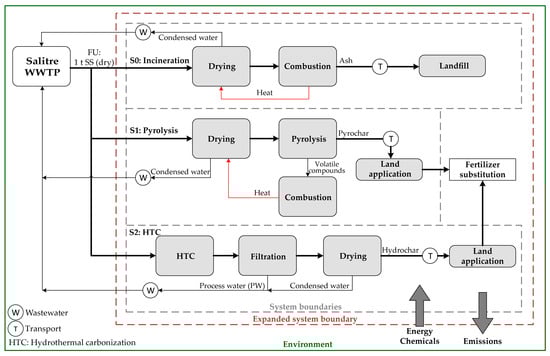
Figure 1.
System boundaries of this LCA.
Multifunctionality is addressed through system expansion, including electricity and chemical production for external processes and the substitution of mineral fertilizers in downstream processes through nutrient recovery from chars. The technological routes of scenarios are described as follows:
- S0—Incineration (reference scenario): SS is dried to 10% moisture, incinerated, and ashes are transported to a sanitary landfill. The heat generated is recovered for sludge drying. Flue gases are cleaned and released to the atmosphere.
- S1—Pyrolysis: SS is dried to 10% moisture and processed in a rotary kiln pyrolysis reactor at 450 °C. Pyrochar is transported for agricultural soil application. Liquid and gaseous pyrolysis products are combusted to provide thermal energy for sludge drying. Condensates from drying are recirculated to the WWTP. Flue gases are cleaned before release.
- S2—Hydrothermal carbonization (HTC): SS undergoes HTC at 200 °C and 30 bar. Process gases produced (only CO2) are released to the atmosphere, while solids and liquids are filtered, yielding hydrochar and process water (PW). Hydrochar is dried to 10% moisture and transported for agricultural use. Condensates and PW are recirculated to the WWTP.
The following assumptions and limitations are considered for the system boundaries: (i) construction of plants, vehicles, and machinery is excluded; (ii) the technological routes are supposed to be co-located at the Salitre WWTP, with a 30 km transport considered for ash disposal (S0) or char application (S1 and S2); (iii) rejected water and PW are recirculated to the WWTP, considering the use of treatment chemicals (polyacrylamide) and electricity already applied in the regular operation of the Salitre WWTP and (iv) CO2 generated from SS carbon is considered biogenic and climate neutral.
2.2. Experimental Treatments and Characterization of Sewage Sludge and Products
To obtain data for the characterization of products derived from HTC and pyrolysis treatments of SS, experiments were carried out using laboratory- and pilot-scale equipment [36]. HTC was carried out in a 250 mL batch reactor at 200 °C with a residence time of 1 h, using a load of 14 g of SS and deionized water to achieve 15.00% total solids. Experiments were performed in triplicate. Pyrolysis was conducted in a rotary kiln reactor operating continuously at 450 °C with a residence time of 30 min, using a single experimental run with a feed rate of 1 kg/h of dried SS. Both processes were carried out at the Heat Transfer Laboratory of the School of Engineering of Universidad Nacional de Colombia.
The mass distribution of products was determined on a dry matter basis. HTC produced 72.3% of char relative to the dry input mass, 25.3% of compounds solubilized or suspended in process water (PW), and 2.4% of gaseous products [37]. In pyrolysis, 60.7% of the initial dry mass was converted into char, 34.1% into bio-oil or tars, and 5.2% into non-condensable gases [37]. Liquid products, including PW in HTC and bio-oil in pyrolysis, were calculated by difference.
For the incineration scenario (S0), a mass balance based on the experimentally determined ash content of the sewage sludge and a stoichiometric complete combustion model enabled the determination of the flue gas compositions.
2.2.1. Characterization of Sewage Sludge, Pyrochar and Hydrochar
The SS, pyrochar, and hydrochar were experimentally characterized through proximate and ultimate analysis [38,39], higher heating value (HHV) determination [40], and quantification of heavy metal elements by inductively coupled plasma atomic emission spectroscopy (ICP-AES) [41]. The elemental composition of ashes and chars was also determined experimentally using X-ray fluorescence (XRF) [42].
- Proximate and ultimate analysis and higher heating value
The proximate and ultimate analyses, together with the heating values of SS, hydrochar and pyrochar, are summarized in Table 1. Compared with the SS, both carbonization routes significantly modified the composition and energy content of the solids. Hydrochar exhibited a notably higher volatile matter content (38.25%) than pyrochar (22.00%), indicating a greater extent of secondary reactions and recondensation of organic compounds within the solid matrix during HTC. This effect is consistent with the moderate operating temperatures and high-pressure aqueous environment, which promote polymerization and condensation of dissolved organics. As a result, hydrochar retained higher levels of C, H, N, S, and O compared to pyrochar, leading to a higher HHV (10.84 MJ/kg vs. 9.52 MJ/kg). In contrast, pyrochar showed lower volatile content and higher fixed carbon, reflecting a more extensive devolatilization process typical of dry thermochemical conditions. These compositional differences are relevant for the LCA, as they influence the potential energy recovery, carbon stability, and elemental mobility of the final products.

Table 1.
Proximate analysis, ultimate analysis and heating value of sewage sludge from Salitre WWTP and the chars obtained by hydrothermal carbonization (HTC) and pyrolysis, on a dry basis.
- Heavy metals content
The heavy metals content of SS and the resulting chars was determined, as reported in Table 2. Arsenic, mercury and selenium were below detection limits in all samples. In hydrochar, cadmium and chromium concentrations decreased relative to SS, indicating a transfer of these elements into the aqueous phase. In pyrochar, higher volatilization of chromium and nickel was observed, reflecting their preferential partitioning into the gaseous fraction during thermal treatment.
Table 2.
Heavy metals content in sewage sludge from Salitre WWTP and in hydrochar and pyrochar on a dry basis.
- Elemental composition of sewage sludge, ash and chars by XRF analysis
The XRF analysis showed that the dominant inorganic elements in both pyrochar and hydrochar were silicon, calcium, iron, and phosphorus, consistent with the composition of SS. These results, summarized in Table 3, provide essential data for assessing the agronomic value and environmental implications of sludge-derived chars.
Table 3.
Elemental composition on a dry basis of sewage sludge from Salitre WWTP and the chars obtained by hydrothermal carbonization (HTC) and pyrolysis, determined by XRF.
2.2.2. Composition of Gaseous Products
The gaseous products were characterized by gas chromatography and showed that the gases generated from HTC consisted exclusively of carbon dioxide (CO2), which was therefore assumed to represent 100% of the gaseous output. In contrast, pyrolysis gases were composed of 80.2% carbon dioxide (CO2), 7.1% methane (CH4), 12.2% carbon monoxide (CO), and 0.5% hydrogen (H2). The lower heating value (LHV) of the gases was calculated using the weighted average of the LHV of each component and its mass fraction. As a result, the HTC gas stream, composed only of CO2, was considered to have no heating value, while the pyrolysis gas presented an LHV of 5.39 MJ/kg.
2.3. Process Simulation in Aspen Plus
The incineration, pyrolysis, and HTC processes of SS were simulated in Aspen Plus® V10. using the product characterization data shown in Section 2.2.1. The simulations were used to establish energy balances to estimate heat and electricity requirements for integration into the life cycle inventory (LCI). Detailed descriptions of the simulation models and underlying assumptions are provided in the Supplementary Material in Section S1.
For incineration, the electricity demand was 0.00177 kWh/kg of wet SS, associated with boiler operation. No external heat input was required, as the combustion gases supplied sufficient energy for sludge drying (2.0437 MJ/kg of wet SS). In the pyrolysis scenario, the heat demand was 1.3081 MJ/kg of wet SS for the sludge dryer and 1.13 MJ/kg of SS (10% of moisture) for steam generation and maintenance of the rotary kiln process temperature. HTC required 1.00 MJ/kg of wet SS to sustain reactor conditions and 0.327 MJ/kg of wet hydrochar for the drying stage.
2.4. Application of Chars to Soil
When applying chars to soil, the transfer of carbon, nitrogen, phosphorus and heavy metals to soil, plants, water or air must be considered. Within the LCA framework. the substitution rates of inorganic fertilizers containing nitrogen (N), potassium (K) and phosphorus (P) were included. For pyrochars, the elemental transfer to soil was based on LCA conducted by Faragó et al. [46], while for hydrochars, no specific LCA data were found in LCA studies [35,47,48,49,50,51,52]; therefore, transfer values were estimated from the experimental data on nutrient availability and element concentrations in extractable fractions, since the sewage sludge used in this study corresponds to the same SS samples characterized in [36] (see Section S2.6 of Supplementary Material).
The substitution of mineral fertilizers was modeled following standard stoichiometric conventions widely used in agronomic and LCA studies. Phosphorus substitution was expressed as P2O5, where 1 kg of P in char acorresponds to 2.29 kg of P2O5 fertilizer. Potassium substitution was expressed as K2O, where 1 kg of K in char replaces 1.2 kg of K2O fertilizer. Nitrogen substitution was expressed on a mass basis, assuming that 1 kg of N in char is equivalent to 1 kg of N fertilizer. Based on experimental data [36,53], this assessment applied a substitution rate of 0% for nitrogen in pyrochar and 3.5% for nitrogen in hydrochar. Substitution percentages for phosphorus were set at 3.5% for pyrochar and 5.0% for hydrochar [46,54,55,56,57], while potassium substitution was set at 10% following reported K availability in sludge-derived chars [57]. To incorporate uncertainty in nutrient availability, all substitution parameters were modeled using a uniform distribution ranging from 0% to 25%, which reflects the broad variability reported in the literature for nutrient release and plant uptake from pyrochar and hydrochar. These distributions were integrated into the uncertainty analysis to examine their influence on the variability of impact category results. In addition, a sensitivity analysis of fertilizer substitution rates is presented in Section 3.2, where substitution levels of 0%, 10%, and 100% are evaluated to assess how this parameter affects the magnitude and direction of environmental outcomes. 100% is selected as an ideal maximal value that cannot be surpassed, and 10% as a mean typical value. Detailed information on the LCI framework and modeling assumptions is provided in the Supplementary Material (Section S2).
The carbon storage in soil resulting from char application was also considered in the assessment. Fixed storage rates of 98.4% for biochar and 88.5% for hydrochar were applied, as reported in Table S5 of the Supplementary Material and based on experimental data from [54].
2.5. Life Cycle Inventory (LCI)
The life cycle inventory (LCI) was constructed by integrating experimental data, process simulations, and background datasets to ensure reliability and representativeness. The system also includes transportation, wastewater treatment, flue gas cleaning, ash disposal in landfills (S0), and land application of chars (S1 and S2), modeled with experimental data [36,53]. Background processes were sourced from the Ecoinvent 3.8 database [58] with allocation at the point of substitution (APOS). These cover energy supply, flue gas cleaning, wastewater treatment, and auxiliary materials (sodium hydroxide, calcium hydroxide, activated carbon, polyacrylamide). Substitution of mineral fertilizers (N. P. K) was included to reflect nutrient recovery from chars.
2.6. Impact Assessment Methodology
Impact assessment followed the ILCD midpoint method recommended by the European Commission [59]. Thirteen midpoint categories were assessed: climate change (CC), ozone depletion (OD), human toxicity cancer (HTc), human toxicity non-cancer (HTnc), particulate matter (PM), ionizing radiation (IR), photochemical ozone formation (POF), acidification (AC), terrestrial eutrophication (EUTt), freshwater eutrophication (EUTfw), marine eutrophication (EUTm), freshwater ecotoxicity (ETfw), and resource depletion (RD). Normalization was performed using EC-JRC Global 2010 factors [60], expressing results in Person Equivalents (PE). This enables interpretation by relating results to the average annual environmental load of a person. All modeling and calculations were performed in EASETECH 3.4.4, a software platform designed for environmental technology assessment and process-oriented LCA.
2.7. Parameter Sensitivity and Uncertainty Analysis
Uncertainty in LCA results due to input parameters was addressed through a two-step approach. First, a perturbation analysis was applied to 78 parameters related to sludge composition, energy demand, fertilizer substitution and gas cleaning (see Table S2 of Supplementary Material). From this analysis, the 22 most influential parameters were identified using normalized sensitivity ratios (SR) [31]. Second, Monte Carlo simulations were performed in EASETECH using probability distributions for the 23 selected parameters (see Appendix B). For each scenario (S0, S1 and S2), 10,000 iterations were carried out across the 13 midpoint categories. Results are reported as distributions, with median values and 5th–95th percentiles to represent uncertainty.
Pairwise scenario comparisons were performed using discernibility analysis [61], which evaluate the probability that one scenario outperforms another across Monte Carlo runs. Finally, a global sensitivity analysis (GSA) integrated the contribution of the 22 most influential parameters into overall uncertainty, linking parameter variability to results sensitivity. This combined framework provides a robust methodological basis to evaluate the reliability of comparative conclusions.
3. Results and Discussion
3.1. LCA Results: Process Contribution to the Impact Categories
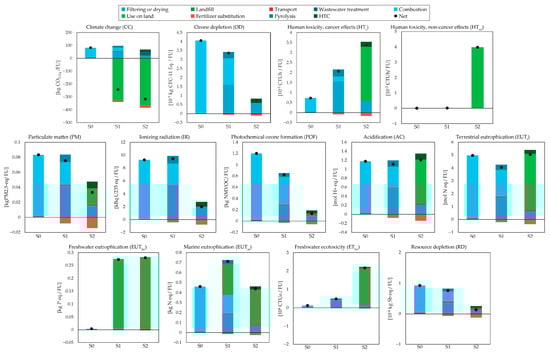
The LCA results for each impact category based on the selected functional unit (FU) of 1 t of SS on a dry matter basis are presented in Figure 2. Numerical results are provided in Table A1, Table A2 and Table A3 of Appendix A. Negative values indicate environmental benefits from avoided impacts due to system expansion, while positive values represent environmental burdens. Net environmental impacts are reported for each scenario and impact category. The contribution analysis considers the following processes: hydrothermal carbonization (HTC), rotary kiln (pyrolysis), fertilizer substitution, use on land, SS combustion in S0 or volatile-phase combustion with gas cleaning in S1 (combustion), wastewater treatment, transport, ash disposal in landfills (landfill) and filtration or drying steps in S1 and S2. In this section, results are described for all impact categories, including the grouped human toxicity and freshwater ecotoxicity indicators and the grouped terrestrial, freshwater and marine eutrophication categories.
3.1.1. Climate Change (CC)
The climate change impact category, expressed in kg CO2 eq/FU, was evaluated for scenarios S0, S1, and S2, together with the contribution analysis of the processes involved. HTC in S2 reports a net impact of −316.3 kg CO2 eq/FU, while pyrolysis in S1 reports −242.0 kg CO2 eq/FU. Incineration in S0 presents a positive impact of 82.3 kg CO2 eq/FU. In S1 and S2, the main reductions are associated with the land application of char, which accounts for −328.0 and −364.3 kg CO2 eq/FU, respectively. A second source of reductions corresponds to the substitution of mineral fertilizers, with −11.2 kg CO2 eq/FU in S1 and −19.8 kg CO2 eq/FU in S2. Several processes introduce positive contributions, including sludge drying, wastewater treatment, transport, and the energy requirements of rotary kiln pyrolysis and HTC reactor. In S0, the largest positive contribution corresponds to the flue gas cleaning process, explained by the use of chemicals required for emission control.
3.1.2. Ozone Depletion (OD)
The ozone depletion (OD) results, expressed in kg CFC-11 eq/FU, show that S2 presents the lowest total value with 7.23 × 10⁻⁶ kg CFC-11 eq/FU, followed by S1 with 3.36 × 10⁻⁵ kg CFC-11 eq/FU and S0 with 4.06 × 10⁻⁵ kg CFC-11 eq/FU. In S0, the OD contribution is dominated by the combustion stage, which accounts for almost the entire total impact according to the process-level results. In S1, the main contributors are sludge drying and reactor operation, while fertilizer substitution generates a small reduction in the overall value. In S2, OD impacts originate mainly from sludge drying and the HTC reactor process, with substitution of mineral fertilizers again providing a minor offset. Differences among scenarios reflect the relative contribution of drying operations, reactor energy requirements, and substitution effects across the treatment chains.
3.1.3. Human Toxicity and Freshwater Ecotoxicity Impacts
Human toxicity and freshwater ecotoxicity categories quantify the potential adverse effects of chemical emissions on human health and aquatic ecosystems, expressed as CTUh/FU for cancer and non-cancer impacts and CTUe/FU for ecotoxicity. These indicators reflect the influence of heavy metal emissions and their redistribution across air, water, and soil pathways.
For human toxicity, in the cancer effects category (HTc), all scenarios show positive values: S0 at 7.29 × 10⁻⁶ CTUh/FU, S1 at 2.07 × 10⁻⁵ CTUh/FU, and S2 at 3.38 × 10⁻⁵ CTUh/FU. In S0, contributions stem from combustion residues and gas-cleaning materials, while in S1, they arise mainly from sludge drying (1.56 × 10⁻⁵ CTUh/FU) and pyrolysis reactor operation (3.46 × 10⁻⁶ CTUh/FU). In S2, HTc is influenced by sludge drying (5.83 × 10⁻⁶ CTUh/FU), HTC reactor emissions (2.45 × 10⁻⁶ CTUh/FU), and land application, where metal transfer to soils plays a relevant role. Small offsets from fertilizer substitution are observed in both S1 (−8.91 × 10⁻⁷ CTUh/FU) and S2 (−1.63 × 10⁻⁶ CTUh/FU), but they do not change the overall positive sign.
In the human toxicity, in the non-cancer effects (HTnc) category, S2 shows the highest contribution at 3.98 × 10⁻² CTUh/FU, clearly above S1 (1.38 × 10⁻⁴ CTUh/FU) and S0 (2.52 × 10⁻⁵ CTUh/FU). The elevated value in S2 is associated with metal transfer during hydrochar land application, while S1 reflects lower exposure potential due to metal retention in pyrochar. These differences highlight the importance of metal immobilization mechanisms, which warrant further experimental validation across a broader range of contaminants [62,63,64].
Regarding freshwater ecotoxicity (ETfw) [65], all scenarios yield positive results: S0 at 1.21 × 10³ CTUe/FU, S1 at 4.84 × 10³ CTUe/FU, and S2 at 2.17 × 10⁴ CTUe/FU. In S2, ETfw is largely driven by metal releases (notably zinc and copper) during land application, whereas in S0, contributions originate mainly from combustion processes. In S1, major contributors include sludge drying (3.80 × 10³ CTUe/FU) and pyrolysis reactor operation (8.32 × 10² CTUe/FU). Fertilizer substitution provides partial offsets in S1 (−2.44 × 10² CTUe/FU) and S2 (−4.44 × 10² CTUe/FU), though the regional nature of the ETfw characterization limits the extent to which these credits influence the total outcome.
Overall, the results show differing toxicity profiles across the scenarios. S1 presents comparatively lower values in HTnc and avoids the elevated ETfw observed in S2, reflecting the relative stability of metals in pyrochar. S2 is influenced by greater mobility of metals during land application, resulting in higher contributions in all toxicity-related categories. S0 shows lower toxicity magnitudes than S2 but remains consistently positive across categories, in line with the controlled emission mechanisms typical of incineration systems.
3.1.4. Particulate Matter (PM)
The particulate matter (PM) results, expressed in kg PM2.5 eq/FU, show that S2 presents the lowest total impact (3.32 × 10⁻²), followed by S1 (7.55 × 10⁻²) and S0 (8.32 × 10⁻²). In S0, PM formation is primarily driven by the combustion stage, which accounts for nearly the entire contribution. For S1, the main sources include sludge drying and volatile combustion from the pyrolysis process, while the credit from fertilizer substitution partially offsets these contributions. In S2, land application is the dominant source of PM formation due to ammonia emissions associated with nitrogen transformations, with additional contributions from HTC reactor operation and hydrochar drying. Because PM represents a local impact category with direct implications for human health, the spatial distribution of these emissions across treatment stages should be considered when assessing potential exposure in surrounding communities.
3.1.5. Ionizing Radiation (IR)
The ionizing radiation (IR) results, expressed in kBq U235 eq/FU, show positive contributions in all three scenarios, with S0 and S1 presenting similar total values (9.27 and 9.45 kBq U235 eq/FU, respectively), while S2 displays a lower magnitude (1.98 kBq U235 eq/FU). In S0, the combustion stage dominates the IR impact. In S1, IR contributions arise primarily from energy-intensive sludge drying and pyrolysis reactor operation, although these are partially offset by fertilizer substitution. In S2, the main contributors include sludge drying, land application, and the HTC reactor, with substitution effects again providing a modest reduction in the total impact. Overall, differences across scenarios reflect variations in electricity and thermal energy requirements, with S2 showing the lowest IR magnitude due to comparatively reduced energy inputs across stages.
3.1.6. Photochemical Ozone Formation (POF)
The photochemical ozone formation (POF) results, expressed in kg NMVOC eq/FU, indicate that S2 shows the lowest total contribution with 1.33 × 10⁻¹ kg NMVOC eq/FU, followed by S1 with 8.20 × 10⁻¹ kg NMVOC eq/FU, and S0 with 1.20 kg NMVOC eq/FU. In S0, nearly all POF impacts originate from the combustion stage. In S1, contributions arise from volatile combustion following the pyrolysis process, sludge drying, and rotary kiln reactor operation, while fertilizer substitution provides a partial offset through avoided emissions. In S2, hydrochar drying, the HTC reactor, and transport processes contribute to the total POF value, with substitution of mineral fertilizers again reducing the overall magnitude through crediting effects. Because POF is a regional impact category linked to ozone formation near emission sources, the spatial relevance of avoided fertilizer production should be considered when interpreting substitution-related reductions. Overall, variations across scenarios are associated with differences in NMVOC emissions from thermal treatment stages and the influence of substitution credits on the net POF outcome.
3.1.7. Acidification (AC)
The acidification (AC) results, expressed in mol H+ eq/FU, show similar magnitudes across scenarios, with presenting 1.11 mol H+ eq/FU, (S1), 1.17 mol H+ eq/FU (S1), and 1.21 mol H+ eq/FU (S2). In S0, nearly all AC impacts originate from sludge combustion. In S1, the main contributors are volatile combustion from the pyrolysis process and sludge drying, while mineral fertilizer substitution provides a partial offset to the total impact. In S2, contributions to AC are associated with land application of hydrochar, hydrochar drying, and HTC reactor operation, with fertilizer substitution again reducing the overall magnitude. Because acidification arises from atmospheric deposition of nitrogen and sulfur species, regional variability in emissions location and avoided fertilizer production is relevant when interpreting differences among scenarios.
3.1.8. Eutrophication Impacts
The eutrophication impact categories quantify the potential nutrient enrichment of terrestrial and aquatic environments. Terrestrial eutrophication (EUTt) is expressed in mol N eq/FU, while freshwater (EUTfw) and marine (EUTm) eutrophication are expressed in kg P eq/FU and kg N eq/FU, respectively. The results show that all scenarios present positive contributions in EUTt, with S0 reporting 4.97 mol N eq/FU, followed by S1 with 4.04 mol N eq/FU and S2 with 5.03 mol N eq/FU. In S0, nearly the entire impact derives from sludge combustion (4.89 mol N eq/FU). In S1, the largest contributors are sludge drying (1.73 mol N eq/FU), the pyrolysis reactor (0.39 mol N eq/FU), and land application (0.04 mol N eq/FU). In S2, EUTt is driven mainly by land application (4.38 mol N eq/FU), together with hydrochar drying (0.65 mol N eq/FU) and the HTC reactor (0.29 mol N eq/FU). Fertilizer substitution produces avoided burdens in both S1 (−0.21 mol N eq/FU) and S2 (−0.36 mol N eq/FU), although these offsets do not reverse the overall positive contribution.
For freshwater eutrophication (EUTfw), impacts remain positive across scenarios. S0 shows a near-zero value (4.06 × 10⁻³ kg P eq/FU), resulting almost entirely from sludge combustion (4.01 × 10⁻³ kg P eq/FU). S1 and S2 present higher values of 0.274 and 0.280 kg eq/FU, respectively, with land application being the dominant contributor in both cases (0.270 kg P eq/FU in S1 and 0.281 kg P eq/FU in S2). Fertilizer substitution offsets a portion of the impact in S1 (−1.36 × 10⁻³ kg P eq/FU) and S2 (−2.16 × 10⁻³ kg P eq/FU), but the overall eutrophication potential remains positive. Additional contributions in S1 and S2 arise from sludge drying, reactor operation, and combustion emissions.
For marine eutrophication (EUTm), the total impact remains positive in all scenarios. S0 reaches 0.462 kg N eq/FU, while S1 and S2 present 0.712 and 0.439 kg N eq/FU, respectively. In S0, the impact originates almost entirely from sludge combustion (0.454 kg N eq/FU). In S1, contributions arise from sludge drying (0.186 kg N eq/FU), land application (0.304 kg N eq/FU), and reactor operation (0.042 kg N eq/FU). In S2, the main contributor is again land application (0.357 kg N eq/FU), followed by hydrochar drying (0.070 kg N eq/FU) and the HTC reactor (0.031 kg N eq/FU). Fertilizer substitution provides partial offsets in S1 (−0.014 kg N eq/FU) and S2 (−0.025 kg N eq/FU), but does not compensate for the contributions from land application and drying processes.
Overall, the three scenarios exhibit positive eutrophication potentials across terrestrial, freshwater, and marine categories, with differences driven primarily by nutrient releases during land application, drying operations, and reactor energy requirements. Although fertilizer substitution consistently offsets part of these burdens, the net impacts remain positive in all cases, particularly in S1 and S2 where land application dominates the total contributions.
3.1.9. Resource Depletion (RD)
The resource depletion (RD) results, expressed in kg Sb eq/FU, show positive values in all scenarios. S2 presents the lowest magnitude with 1.38 × 10⁻⁵ kg Sb eq/FU, followed by S1 with 7.62 × 10⁻⁵ kg Sb eq/FU and S0 with 9.28 × 10⁻⁵ kg Sb eq/FU. In S0, RD is dominated by sludge combustion (8.91 × 10⁻⁵ kg Sb eq/FU). In S1, main contributions arise from sludge drying (3.73 × 10⁻⁵ kg Sb eq/FU) and volatile combustion (3.26 × 10⁻⁵ kg Sb eq/FU), partially offset by fertilizer substitution (−6.37 × 10⁻⁶ kg Sb eq/FU). In S2, lower overall values reflect reduced contributions from reactor operation (5.98 × 10⁻⁶ kg Sb eq/FU), land application (1.38 × 10⁻⁶ kg Sb eq/FU), and drying processes (1.40 × 10⁻⁵ kg Sb eq/FU), together with avoided burdens from fertilizer substitution (−1.21 × 10⁻⁵ kg Sb eq/FU). These differences are mainly driven by the energy and material requirements of combustion, drying, and reactor operation across scenarios.
3.2. Fertilizer Substitution Rate Analysis
The fertilizer substitution rate was previously identified as one of the parameters exerting the strongest influence on the environmental performance of scenarios S1 and S2. To assess the extent of this influence, a sensitivity analysis was performed on the base case presented in Section 3.1., varying the substitution rate at three levels: 0%, assuming no substitution is achieved; a uniform substitution of 10% for nitrogen, phosphorus and potassium, representing a feasible rate to achieve in real applications; and a total substitution rate of 100%, to establish the ideal limit case. The resulting changes across impact categories are presented in Figure 3.
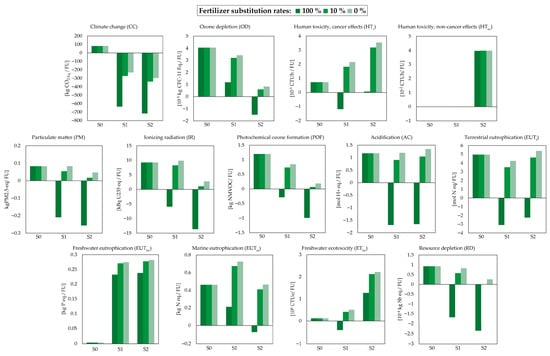
Figure 3.
LCA results for 13 impact categories of scenarios S0, S1, and S2 with fertilizer substitution rates of 100%, 10% and 0%.
Figure 3 shows that the magnitude of avoided impacts in S1 and S2 decreases systematically as substitution rates decline. Under ideal conditions of full substitution, both scenarios yield considerable reductions in multiple impact categories. When substitution is reduced to feasible real rates around 10%, these reductions diminish substantially and several categories move toward neutral values, particularly in S1. Under zero substitution, most avoided burdens disappear, and categories that initially showed environmental benefits shift to net impacts. This is particularly evident in particulate matter, ionizing radiation and marine eutrophication, where the absence of substitution credits generates positive contributions. Toxicity-related impacts also increase when substitution is removed, reflecting the loss of the compensatory effect associated with avoided mineral fertilizer production.
These trends confirm that nutrient substitution is a decisive factor in the environmental performance of sludge-derived chars, as it is capable of transforming net impacts from benefits (in the ideal limit case of 100% substitution rates) to burdens (for actual feasible substitution rates around 10% and for the limit case of the total absence of substitution, 0%). For this reason, LCA studies that include thermochemical sludge recovery should advance in applied research to rely on substitution rates based on experimental evidence of nutrient availability and plant uptake under local soil conditions. These data will improve the robustness of environmental assessments and provide greater support for policy design and project development focused on nutrient recovery from sewage sludge.
3.3. Uncertainty Propagation
The uncertainty of the input parameters in the LCA model is propagated systematically and reflected in the variability of the results for each impact category. This approach consists of propagating parameter uncertainties, defined by their probability distributions, to quantify the robustness of the outcomes. The parameters considered, together with their baseline values, distributions, and standard deviations, are summarized in Table S2 of the Supplementary Material. Monte Carlo simulations were performed in EASETECH, generating 10,000 iterations for each of the 13 midpoint impact categories and for the three scenarios: S0 (incineration), S1 (pyrolysis), and S2 (hydrothermal carbonization). The graphical results are presented in Figure 4.
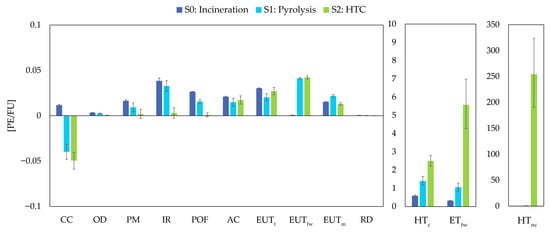
Figure 4.
Normalized environmental impacts and uncertainty generated by Monte Carlo simulations (n = 10,000) for scenarios S0, S1, and S2. The bar height represents the median of the data, the upper limit of the error bar corresponds to the 95th percentile and the lower limit to the 5th percentile.
For S0, the uncertainty ranges remain narrow across all categories, with all median values staying positive. This behavior reflects the maturity of incineration as a treatment pathway and the comparatively greater availability of information for the parameters included in this scenario, resulting in low overall variability. In contrast, S1 and S2 show substantially wider uncertainty intervals across several impact categories. This greater dispersion arises from the variability of parameters associated with thermochemical conversion and from the expansion of the system boundary to include char land application. Because the environmental effects of pyrochar and hydrochar depend on soil interactions, nutrient dynamics, and metal mobility, the resulting uncertainty bands are wider and may encompass both beneficial and adverse outcomes. In S2, the largest uncertainty magnitudes occur in freshwater ecotoxicity (ETfw), with values ranging from 4.27 to 6.99 PE/FU, and in human toxicity non-cancer effects (HTnc), where the interval spans from 190 to 324 PE/FU. These ranges indicate pronounced sensitivity to parameters governing hydrochar behavior during land application. In S1, although uncertainty is lower than in S2, categories such as ionizing radiation (IR), acidification (AC), terrestrial eutrophication (EUTt), and freshwater ecotoxicity (ETfw) also show error bars that cross the zero axis, reflecting the influence of parameter variability on the direction of normalized outcomes. The uncertainty patterns observed in S1 and S2 are consistent with the sensitivity trends reported in Table A4, in which char yield, fertilizer substitution, energy consumption, and zinc content in sewage sludge emerge as the parameters exerting the greatest influence on variability.
3.4. Comparative Assessment Based on Discernibility Analysis
The discernibility analysis integrates the comparative assessment with the uncertainty propagation by evaluating the probability distributions of pairwise differences between scenarios. While uncertainty propagation describes the variability of each scenario independently, discernibility analysis identifies the probability that one scenario results in higher impacts relative to another [66]. This distinction is relevant because a parameter may influence the absolute magnitude of impacts in several scenarios, but not necessarily their relative performance.
Three pairwise comparisons were performed for each impact category: the probability that S0 is greater than S1, p (S0 > S1); the probability that S0 is greater than S2, p (S0 > S2); and the probability that S1 is greater than S2, p (S1 > S2). Table 4 summarizes the discernibility analysis for S0, S1 and S2 across all impact categories. The comparison shows that S2 attains the lowest impacts in a larger number of categories, particularly those associated with climate change, ozone depletion, particulate matter, ionizing radiation, photochemical ozone formation, marine eutrophication and resource depletion. S1 presents lower impacts in acidification and terrestrial eutrophication. S0 shows comparatively lower values in the toxicity related categories, specifically human toxicity for cancer and non-cancer effects and freshwater ecotoxicity. Freshwater eutrophication exhibits only minor differences among scenarios, indicating limited differentiation in this impact mechanism.
Table 4.
Discernibility analysis based on pairwise comparison probabilities of uncertainties in different impact categories.
These findings indicate that environmental performance varies according to the type of impact considered. No scenario performs consistently better across all categories. The interpretation of these results therefore requires attention to the specific environmental mechanisms involved rather than a single aggregated judgment. For public policy and project development, the discernibility analysis provides information that can support decisions aimed at reducing environmental risks or addressing particular policy objectives, such as reducing greenhouse gas emissions, improving nutrient management or limiting toxicity related impacts, without implying that one technology should be uniformly preferred over the others.
3.5. Global Sensitivity Analysis
The global sensitivity analysis (GSA) was conducted to identify the contribution of grouped parameters to the overall uncertainty of environmental impacts [66]. Table 5 summarizes the contribution analysis for each scenario.
Table 5.
Contribution of uncertainty analysis from grouped parameters.
In scenario S0, flue gas cleaning is the dominant source of uncertainty, with contributions above 90% across all impact categories. This behavior is consistent with the low variability reported previously and reflects the strong influence of chemical inputs associated with this process. In scenario S1, fertilizer substitution parameters constitute the main contributor to uncertainty in nearly all categories, reaching values above seventy percent and exceeding 90% in some cases. This outcome is linked to the limited availability of experimental data on nutrient transfer to soils, which requires the inclusion of substitution parameters with broad uncertainty ranges. In scenario S2, fertilizer substitution also emerges as the most influential parameter in most categories, particularly those associated with phosphorus, which exhibits high input uncertainty and strong sensitivity. For freshwater eutrophication, the HTC process becomes the most relevant contributor, while nitrogen substitution shows a comparatively smaller influence on overall variability.
For both S1 and S2, uncertainty in toxicity related categories, including human toxicity for cancer and non-cancer effects and freshwater ecotoxicity, is primarily affected by SS composition, especially zinc content. These results show that a limited set of parameters, namely flue gas cleaning, fertilizer substitution and SS composition, explains most of the propagated uncertainty across scenarios. Their strong influence clarifies how variability in specific inputs is transmitted to environmental outcomes, emphasizing the need to prioritize these parameters in future experimental characterization and process development and optimization efforts.
4. Conclusions
This work evaluated the potential environmental impacts of rotary kiln pyrolysis (S1) and hydrothermal carbonization (S2) for sewage sludge (SS) treatment in comparison with incineration (S0), through the application of life cycle assessment (LCA) combined with global sensitivity analysis (GSA). The sludge used in the analysis originated from the Salitre WWTP in Bogotá, Colombia, which provides relevant context for decision-making and for the development of management strategies under a circular economy approach.
HTC showed reductions in several impact categories, although its application is affected by the transfer of heavy metals into soils, which results in toxicity-related impacts. Pyrolysis produced pyrochar with carbon storage capacity, retention of heavy metals, and potential for nutrient recovery. These characteristics enabled substitution of fossil and mineral resources and contributed to reductions in several environmental impacts. Incineration achieved the highest sludge volume reduction, reported impacts below 1 PE in most categories, and constitutes the technological basis for converting sludge into ashes that can undergo further processing for phosphorus recovery.
The sensitivity and uncertainty analysis identified gas cleaning processes, sludge composition parameters (moisture, ash, volatile solids, and specific heavy metals such as zinc and chromium), fertilizer substitution rates, and thermal energy requirements as parameters with strong influence on the LCA results. Variations in these parameters affected uncertainty propagation across multiple impact categories.
The findings indicate that HTC can contribute to nutrient recovery and carbon storage, that pyrolysis can support stabilization of heavy metals and production of char for potential agricultural use, and that incineration can reduce sludge volume and enable further nutrient recovery from ashes under regulatory conditions. The results also point to the need for future work that defines substitution rates associated with the different uses of char materials and that incorporates comparative assessments including downstream processing of incineration ashes for nutrient extraction. Such analyses would allow a more complete comparison between carbonized products and nutrient recovery pathways based on ash processing.
These results highlight the relevance of uncertainty analysis in LCA studies of sludge management systems and support the consideration of thermochemical conversion technologies within circular economy strategies. The selection of a treatment option should reflect local management priorities and operational objectives.
Supplementary Materials
The following supporting information can be downloaded at: https://www.mdpi.com/article/10.3390/su18010254/s1. References [67,68,69,70,71,72,73] are citied in the Supplementary Materials.
Author Contributions
Conceptualization, S.F. and A.G.; methodology, S.F. and A.G.; software, S.F.; validation, S.F., A.G. and S.L.R.P.; formal analysis, S.F.; investigation, S.F. and A.G.; resources. A.G. and S.L.R.P.; data curation, S.F.; writing—original draft preparation, S.F.; writing—review and editing, A.G. and S.L.R.P.; visualization, S.F.; supervision, A.G.; project administration, A.G.; funding acquisition, S.L.R.P. and A.G. All authors have read and agreed to the published version of the manuscript.
Funding
This research was funded by the Ministry of Science, Technology and Innovation of Colombia and the General System of Royalties—SGR (BPIN 2020000100469) and Universidad Nacional de Colombia, project HERMES 59049.
Institutional Review Board Statement
Not applicable.
Informed Consent Statement
Not applicable.
Data Availability Statement
The original contributions presented in this study are included in the article and Supplementary Materials. Further inquiries can be directed to the corresponding author.
Conflicts of Interest
The authors declare no conflicts of interest.
Abbreviations
The following abbreviations are used in this manuscript:
| AC | Acidification |
| APOS | Allocation at the Point of Substitution |
| CC | Climate Change |
| ETfw | Freshwater Ecotoxicity |
| EUTfw | Freshwater Eutrophication |
| EUTm | Marine Eutrophication |
| EUTt | Terrestrial Eutrophication |
| FU | Functional Unit |
| GSA | Global Sensitivity Analysis |
| HTc | Human Toxicity cancer effects |
| HTnc | Human Toxicity non-cancer effects |
| HTC | Hydrothermal Carbonization |
| ICP-AES | Inductively Coupled Plasma Atomic Emission Spectroscopy |
| ILCD | International Reference Life Cycle Data System |
| IR | Ionizing Radiation |
| LCA | Life Cycle Assessment |
| LCI | Life Cycle Inventory |
| OD | Ozone Depletion |
| PE | Person Equivalent |
| PM | Particulate Matter |
| POF | Photochemical Ozone Formation |
| RD | Resource Depletion |
| S0 | Scenario 0 (Incineration) |
| S1 | Scenario 1 (Pyrolysis) |
| S2 | Scenario 2 (Hydrothermal Carbonization) |
| SC | Sensitivity Coefficient |
| SR | Sensitivity Ratio |
| SS | Sewage Sludge |
| WWTP | Wastewater Treatment Plant |
| XRF | X-ray Fluorescence |
Appendix A
Appendix A presents the life cycle assessment (LCA) results for each scenario: S0 (incineration), S1 (pyrolysis) and S2 (hydrothermal carbonization, HTC) and the contribution analysis (Table A1, Table A2 and Table A3). Results are reported for the ILCD midpoint impact categories: climate change (CC); ozone depletion (OD); human toxicity, cancer effects (HTc); human toxicity, non-cancer effects (HTnc); particulate matter (PM); ionizing radiation (IR); photochemical ozone formation (POF); acidification (AC); terrestrial eutrophication (EUTt); eutrophication, freshwater (EUTfw); eutrophication, marine (EUTm); ecotoxicity, freshwater (ETfw); and resource depletion (RD).
Table A1.
LCA results per process for scenario S0 (incineration).
Table A1.
LCA results per process for scenario S0 (incineration).
| Impact Category | Units | Net | Drying/Filtration | Landfill | Transport | Water Treatment | Combustion |
|---|---|---|---|---|---|---|---|
| CC | kg CO2-eq | 8.23 × 101 | 1.29 × 100 | 1.27 × 100 | 2.61 × 100 | 1.60 × 10⁻¹ | 7.70 × 101 |
| OD | kg CFC-11-eq | 4.06 × 10⁻⁵ | 3.61 × 10⁻⁸ | 4.64 × 10⁻¹⁰ | 9.42 × 10⁻¹⁰ | 4.58 × 10⁻⁹ | 4.05 × 10⁻⁵ |
| HTc | CTUh | 7.29 × 10⁻⁶ | 5.54 × 10⁻⁸ | 3.25 × 10⁻⁷ | 3.66 × 10⁻⁹ | 7.17 × 10⁻⁹ | 6.90 × 10⁻⁶ |
| HTnc | CTUh | 2.52 × 10⁻⁵ | 1.22 × 10⁻⁷ | 2.85 × 10⁻⁷ | 7.47 × 10⁻⁷ | 1.70 × 10⁻⁸ | 2.40 × 10⁻⁵ |
| PM | kg PM2.5-eq | 8.32 × 10⁻² | 4.35 × 10⁻⁴ | 1.84 × 10⁻⁴ | 5.47 × 10⁻⁴ | 6.13 × 10⁻⁵ | 8.20 × 10⁻² |
| IR | kBq U235-eq | 9.27 × 100 | 6.52 × 10⁻³ | 1.83 × 10⁻³ | 3.71 × 10⁻³ | 1.57 × 10⁻³ | 9.25 × 100 |
| POF | kg NMVOC | 1.20 × 100 | 2.73 × 10⁻³ | 8.09 × 10⁻³ | 9.04 × 10⁻³ | 3.51 × 10⁻⁴ | 1.18 × 100 |
| AC | mol H+-eq | 1.17 × 100 | 7.68 × 10⁻³ | 6.94 × 10⁻³ | 8.88 × 10⁻³ | 9.60 × 10⁻⁴ | 1.15 × 100 |
| EUTt | mol N-eq | 4.97 × 100 | 8.96 × 10⁻³ | 3.43 × 10⁻² | 3.91 × 10⁻² | 1.44 × 10⁻³ | 4.89 × 100 |
| EUTfw | kg P-eq | 4.06 × 10⁻³ | 2.79 × 10⁻⁵ | 2.18 × 10⁻⁵ | 2.24 × 10⁻⁶ | 3.42 × 10⁻⁶ | 4.01 × 10⁻³ |
| EUTm | kg N-eq | 4.62 × 10⁻¹ | 8.34 × 10⁻⁴ | 3.06 × 10⁻³ | 3.43 × 10⁻³ | 1.81 × 10⁻⁴ | 4.54 × 10⁻¹ |
| ETfw | CTUe | 1.21 × 10³ | 4.04 × 100 | 1.65 × 101 | 6.83 × 10⁻¹ | 6.96 × 10⁻¹ | 1.19 × 10³ |
| RD | kg Sb-eq | 9.28 × 10⁻⁵ | 1.45 × 10⁻⁷ | 1.14 × 10⁻⁶ | 2.31 × 10⁻⁶ | 3.25 × 10⁻⁸ | 8.91 × 10⁻⁵ |
Table A2.
LCA results per process for scenario S1 (pyrolysis).
Table A2.
LCA results per process for scenario S1 (pyrolysis).
| Impact Category | Units | Net | Pyrolysis | Drying/Filtration | Soil Application | Transport | Combustion | Fertilizer Substitution | Water Treatment |
|---|---|---|---|---|---|---|---|---|---|
| CC | kg CO2-eq | −2.42 × 10² | 1.32 × 101 | 5.19 × 101 | −3.28 × 10² | 3.79 × 100 | 2.81 × 101 | −1.12 × 101 | 1.54 × 10⁻¹ |
| OD | kg CFC-11 eq | 3.36 × 10⁻⁵ | 3.51 × 10⁻⁶ | 1.59 × 10⁻⁵ | 4.23 × 10⁻¹⁰ | 1.36 × 10⁻⁹ | 1.48 × 10⁻⁵ | −6.33 × 10⁻⁷ | 4.40 × 10⁻⁹ |
| HTc | CTUh | 2.07 × 10⁻⁵ | 3.46 × 10⁻⁶ | 1.56 × 10⁻⁵ | 7.02 × 10⁻⁹ | 5.30 × 10⁻⁹ | 2.52 × 10⁻⁶ | −8.91 × 10⁻⁷ | 6.89 × 10⁻⁹ |
| HTnc | CTUh | 1.38 × 10⁻⁴ | 1.66 × 10⁻⁵ | 7.57 × 10⁻⁵ | 3.94 × 10⁻⁵ | 1.08 × 10⁻⁶ | 8.77 × 10⁻⁶ | −3.64 × 10⁻⁶ | 1.64 × 10⁻⁸ |
| PM | kg PM2.5-eq | 7.55 × 10⁻² | 9.83 × 10⁻³ | 4.23 × 10⁻² | 2.27 × 10⁻⁴ | 7.93 × 10⁻⁴ | 3.04 × 10⁻² | −8.11 × 10⁻³ | 5.89 × 10⁻⁵ |
| IR | kBq U235 eq | 9.45 × 100 | 1.17 × 100 | 5.32 × 100 | 1.67 × 10⁻³ | 5.38 × 10⁻³ | 3.38 × 100 | −4.34 × 10⁻¹ | 1.51 × 10⁻³ |
| POF | kg NMVOC | 8.20 × 10⁻¹ | 6.36 × 10⁻² | 2.74 × 10⁻¹ | 9.20 × 10⁻³ | 1.31 × 10⁻² | 4.91 × 10⁻¹ | −3.13 × 10⁻² | 3.37 × 10⁻⁴ |
| AC | mol H+ eq | 1.11 × 100 | 1.36 × 10⁻¹ | 5.73 × 10⁻¹ | 7.66 × 10⁻³ | 1.29 × 10⁻² | 4.65 × 10⁻¹ | −8.07 × 10⁻² | 9.23 × 10⁻⁴ |
| EUTt | mol N eq | 4.04 × 100 | 3.89 × 10⁻¹ | 1.73 × 100 | 3.89 × 10⁻² | 5.67 × 10⁻² | 2.04 × 100 | −2.12 × 10⁻¹ | 1.38 × 10⁻³ |
| EUTfw | kg P eq | 2.74 × 10⁻¹ | 7.23 × 10⁻⁴ | 3.14 × 10⁻³ | 2.70 × 10⁻¹ | 3.24 × 10⁻⁶ | 1.46 × 10⁻³ | −1.36 × 10⁻³ | 3.29 × 10⁻⁶ |
| EUTm | kg N eq | 7.12 × 10⁻¹ | 4.17 × 10⁻² | 1.86 × 10⁻¹ | 3.04 × 10⁻¹ | 4.97 × 10⁻³ | 1.89 × 10⁻¹ | −1.39 × 10⁻² | 1.74 × 10⁻⁴ |
| ETfw | CTUe | 4.84 × 10³ | 8.32 × 10² | 3.80 × 10³ | 1.82 × 101 | 9.91 × 10⁻¹ | 4.33 × 10² | −2.44 × 10² | 6.69 × 10⁻¹ |
| RD | kg Sb eq | 7.62 × 10⁻⁵ | 8.32 × 10⁻⁶ | 3.73 × 10⁻⁵ | 1.04 × 10⁻⁶ | 3.35 × 10⁻⁶ | 3.26 × 10⁻⁵ | −6.37 × 10⁻⁶ | 3.13 × 10⁻⁸ |
Table A3.
LCA results per process for scenario S2 (hydrothermal carbonization).
Table A3.
LCA results per process for scenario S2 (hydrothermal carbonization).
| Impact Category | Units | Net | Water Treatment | Transport | Drying/Filtration | HTC | Soil Application | Fertilizer Substitution |
|---|---|---|---|---|---|---|---|---|
| CC | kg CO2-eq | −3.16 × 10² | 2.69 × 101 | 5.02 × 100 | 1.92 × 101 | 1.68 × 101 | −3.64 × 10² | −1.98 × 101 |
| OD | kg CFC-11 eq | 7.23 × 10⁻⁶ | 6.70 × 10⁻⁹ | 1.81 × 10⁻⁹ | 5.97 × 10⁻⁶ | 2.35 × 10⁻⁶ | 5.61 × 10⁻¹⁰ | −1.11 × 10⁻⁶ |
| HTc | CTUh | 3.38 × 10⁻⁵ | 1.05 × 10⁻⁸ | 7.02 × 10⁻⁹ | 5.83 × 10⁻⁶ | 2.45 × 10⁻⁶ | 2.71 × 10⁻⁵ | −1.63 × 10⁻⁶ |
| HTnc | CTUh | 3.98 × 10⁻² | 2.49 × 10⁻⁸ | 1.43 × 10⁻⁶ | 2.84 × 10⁻⁵ | 1.08 × 10⁻⁵ | 3.97 × 10⁻² | −7.00 × 10⁻⁶ |
| PM | kg PM2.5-eq | 3.32 × 10⁻² | 8.97 × 10⁻⁵ | 1.05 × 10⁻³ | 1.58 × 10⁻² | 8.89 × 10⁻³ | 2.17 × 10⁻² | −1.44 × 10⁻² |
| IR | kBq U235 eq | 1.98 × 100 | 2.29 × 10⁻³ | 7.13 × 10⁻³ | 2.00 × 100 | 7.43 × 10⁻¹ | 2.21 × 10⁻³ | −7.74 × 10⁻¹ |
| POF | kg NMVOC | 1.33 × 10⁻¹ | 5.13 × 10⁻⁴ | 1.74 × 10⁻² | 1.02 × 10⁻¹ | 5.69 × 10⁻² | 1.22 × 10⁻² | −5.58 × 10⁻² |
| AC | mol H+ eq | 1.21 × 100 | 1.40 × 10⁻³ | 1.70 × 10⁻² | 2.14 × 10⁻¹ | 1.34 × 10⁻¹ | 9.81 × 10⁻¹ | −1.42 × 10⁻¹ |
| EUTt | mol N eq | 5.03 × 100 | 2.11 × 10⁻³ | 7.51 × 10⁻² | 6.47 × 10⁻¹ | 2.94 × 10⁻¹ | 4.38 × 100 | −3.65 × 10⁻¹ |
| EUTfw | kg P eq | 2.80 × 10⁻¹ | 5.00 × 10⁻⁶ | 4.29 × 10⁻⁶ | 1.17 × 10⁻³ | 6.25 × 10⁻⁴ | 2.81 × 10⁻¹ | −2.16 × 10⁻³ |
| EUTm | kg N eq | 4.39 × 10⁻¹ | 2.65 × 10⁻⁴ | 6.58 × 10⁻³ | 6.97 × 10⁻² | 3.07 × 10⁻² | 3.57 × 10⁻¹ | −2.52 × 10⁻² |
| ETfw | CTUe | 2.17 × 10⁴ | 1.02 × 100 | 1.31 × 100 | 1.43 × 10³ | 5.26 × 10² | 2.02 × 10⁴ | −4.44 × 10² |
| RD | kg Sb eq | 1.38 × 10⁻⁵ | 4.76 × 10⁻⁸ | 4.44 × 10⁻⁶ | 1.40 × 10⁻⁵ | 5.98 × 10⁻⁶ | 1.38 × 10⁻⁶ | −1.21 × 10⁻⁵ |
Appendix B
The parameters with the highest influence, identified through the normalized sensitivity procedure, that is, those with |SRi|/|SR|max greater than 0.05 in at least one impact category or scenario, are reported in Table A4.
Table A4.
Selected parameters with normalized sensitivity ratio (SR) > 0.05 across all scenarios and impact categories.
Table A4.
Selected parameters with normalized sensitivity ratio (SR) > 0.05 across all scenarios and impact categories.
| Process | Parameter | Scenario | Description |
|---|---|---|---|
| Gas cleaning | GC_AC | S0 | Activated carbon requirement |
| GC_CaOH2 | S0 | Calcium hydroxide requirement | |
| GC_NaOH | S0. S1 | Sodium hydroxide requirement | |
| Pyrolysis | HR_HeatPirol | S1 | Heat requirement in rotary kiln reactor |
| HR_HeatRecov | S1 | Energy recovery in pyrolysis | |
| HR_Ychar | S1 | Char yield in pyrolysis | |
| HTC | HTC_Heat_react | S2 | Heat requirement in HTC reactor |
| HTC_HeatDry | S2 | Heat requirement in HTC dryer | |
| HTC_Ychar | S2 | Char yield in HTC | |
| Soil application | LU_CS_HR | S1 | Carbon storage rate in soil for pyrolysis char |
| LU_CS_HTC | S2 | Carbon storage rate in soil for HTC char | |
| LU_HR_Zn | S1 | Zinc transfer to soil from pyrolysis char | |
| LU_HTC_Cr | S2 | Chromium transfer to soil from HTC char | |
| LU_HTC_Zn | S2 | Zinc transfer to soil from HTC char | |
| SS composition | SS_Ash | S0. S1. S2 | Ash content in sewage sludge |
| SS_M | S0. S1 | Moisture content in sewage sludge | |
| SS_VS | S0. S1. S2 | Volatile solids content in sewage sludge | |
| SS_Zn | S2 | Zinc content in sewage sludge | |
| Fertilizer substitution | Subs_K | S1. S2 | Potassium fertilizer substitution rate in HTC and pyrolysis |
| Subs_N_HTC | S2 | Nitrogen fertilizer substitution rate in HTC | |
| Subs_N_HR | S1 | Nitrogen fertilizer substitution rate in pyrolysis | |
| Subs_P_HTC | S2 | Phosphorus fertilizer substitution rate in HTC | |
| Subs_P_HR | S1 | Phosphorus fertilizer substitution rate in pyrolysis |
References
- Pariente, M.I.; Segura, Y.; Molina, R.; Martínez, F. Wastewater treatment as a process and a resource. In Wastewater Treatment Residues as Resources for Biorefinery Products and Biofuels; Elsevier: Amsterdam, The Netherlands, 2019; pp. 19–45. [Google Scholar] [CrossRef]
- Demirbas, A.; Edris, G.; Alalayah, W.M. Sludge production from municipal wastewater treatment in sewage treatment plant. Energy Sources Part A Recovery Util. Environ. Eff. 2017, 39, 999–1006. [Google Scholar] [CrossRef]
- Rulkens, W. Sewage Sludge as a Biomass Resource for the Production of Energy: Overview and Assessment of the Various Options†. Energy Fuels 2007, 22, 9–15. [Google Scholar] [CrossRef]
- Gao, N.; Kamran, K.; Quan, C.; Williams, P.T. Thermochemical conversion of sewage sludge: A critical review. Prog. Energy Combust. Sci. 2020, 79, 100843. [Google Scholar] [CrossRef]
- EAAB. Informes de Actividades PTAR Salitre. 2025. Available online: https://www.acueducto.com.co/wps/portal/EAB2/Home/ambiente/saneamiento/rio-bogota/ptar-salitre/informes-de-actividades-ptar-salitre (accessed on 29 September 2025).
- U.S. Environmental Protection Agency (EPA). Biosolids. 2024. Available online: https://www.epa.gov/biosolids (accessed on 29 September 2025).
- Eurostat. Sewage Sludge Production and Disposal. Available online: https://ec.europa.eu/eurostat/databrowser/view/env_ww_spd/default/table?lang=en (accessed on 29 September 2025).
- Zhang, B.; Zhou, X.; Ren, X.; Hu, X.; Ji, B. Recent Research on Municipal Sludge as Soil Fertilizer in China: A Review. Water Air Soil. Pollut. 2023, 234, 119. [Google Scholar] [CrossRef]
- Hušek, M.; Homma, R.; Moško, J.; Pohořelý, M.; Oshita, K. P-recovery versus current sewage sludge treatment policy in the Czech Republic and Japan. Clean Technol. Environ. Policy 2024, 26, 1883–1899. [Google Scholar] [CrossRef]
- Government of Colombia. Propuesta de Modificación del Decreto 1287 de 2014 ‘Por el Cual se Establecen las Condiciones y Criterios para el uso de los Biosólidos Generados en Plantas de Tratamientos de Aguas Residuales Municipales. 2023. Available online: https://www.minvivienda.gov.co/system/files/consultasp/documento-soporte-modificacion-biosolidos-version-final-diciembre-de-2023.pdf (accessed on 9 November 2025).
- EAAB. Alcalde Galán Inaugura Primera Fase de Moderna Planta de Manejo de Biosólidos en la PTAR-Salitre. Available online: https://www.acueducto.com.co/wps/portal/EAB2/Home/general/sala-de-prensa/boletines/detalle/planta+biosolidos+ptar+salitre+alcalde+acueducto (accessed on 9 November 2025).
- Ellen MacArthur Foundation. Founding Partners of the Ellen MacArthur Foundation 2013 Circular Economy Towards the Economic and Business Rationale for an Accelerated Transition; Ellen MacArthur Foundation: Cowes, UK, 2013. [Google Scholar]
- Korhonen, J.; Honkasalo, A.; Seppälä, J. Circular Economy: The Concept and its Limitations. Ecol. Econ. 2018, 143, 37–46. [Google Scholar] [CrossRef]
- European Parliament and Council. Directive-2008/98-EN-Waste Framework Directive-EUR-Lex. Available online: https://eur-lex.europa.eu/eli/dir/2008/98/oj/eng (accessed on 29 September 2025).
- Basri, S.; Oruganti, R.K.; Panda, T.K.; Bhattacharyya, D. Beyond conventional approaches: Sustainable valorization of sewage sludge-challenges and opportunities. Sustain. Mater. Technol. 2025, 45, e01496. [Google Scholar] [CrossRef]
- Syed-Hassan, S.S.A.; Wang, Y.; Hu, S.; Su, S.; Xiang, J. Thermochemical processing of sewage sludge to energy and fuel: Fundamentals, challenges and considerations. Renew. Sustain. Energy Rev. 2017, 80, 888–913. [Google Scholar] [CrossRef]
- Fang, Y.; Tao, Y.; Wang, Q.; Chen, G.; Wang, L.; Pan, W.; Zou, B.; Qian, G.; Xu, Y. Preparation of phosphorus adsorbent while recovering phosphorus from sewage sludge ash. J. Environ. Chem. Eng. 2025, 13, 119503. [Google Scholar] [CrossRef]
- Hasan, M.M.; Rasul, M.G.; Khan, M.M.K.; Ashwath, N.; Jahirul, M.I. Energy recovery from municipal solid waste using pyrolysis technology: A review on current status and developments. Renew. Sustain. Energy Rev. 2021, 145, 111073. [Google Scholar] [CrossRef]
- Jerzak, W.; Acha, E.; Li, B. Comprehensive Review of Biomass Pyrolysis: Conventional and Advanced Technologies, Reactor Designs, Product Compositions and Yields, and Techno-Economic Analysis. Energies 2024, 17, 5082. [Google Scholar] [CrossRef]
- Mendoza, L. Pirólisis de Biosólidos en Horno Rotatorio; Universidad Nacional de Colombia: Bogotá, Colombia, 2016. Available online: https://repositorio.unal.edu.co/handle/unal/58938 (accessed on 29 September 2025).
- Ho, T.T.-T.; Nadeem, A.; Choe, K. A Review of Upscaling Hydrothermal Carbonization. Energies 2024, 17, 1918. [Google Scholar] [CrossRef]
- Antaco. Technology-Antaco. Available online: https://www.antaco.co.uk/technology/ (accessed on 8 October 2025).
- Ingelia. Plantas HTC Ingelia|Tecnología de Carbonización Hidrotermal para Valorización de Biomasa. Available online: https://www.ingelia.com/plantas-htc (accessed on 23 November 2025).
- Hou, S.; Wang, H.; Sun, J.; Liu, J.; Bai, M.; Zhang, W.; Xing, W.; Li, R. Hydrothermal carbonization of sewage sludge: Effects of hydrothermal temperature and time on biochar properties and migration and transformation of heavy metals. Int. Biodeterior. Biodegrad. 2026, 206, 106216. [Google Scholar] [CrossRef]
- Kwapińska, M.; Burke, N.; Leahy, J.J. Hydrothermal carbonization and pyrolysis of dairy processing sludge for improved nutrient management in agriculture: Current state-of-the-art. Chem. Eng. J. Adv. 2025, 24, 100888. [Google Scholar] [CrossRef]
- Rincón, S.; Mendoza, L.; Gómez, A. Tratamiento Térmico de Biosólidos para Aplicaciones Energéticas. Pirólisis y Conversión de sus Alquitranes; Kassel University Press: Kassel, Germany, 2019. [Google Scholar] [CrossRef]
- Miao, C.; Zeller, V. Nutrient circularity from waste to fertilizer: A perspective from LCA studies. Sci. Total Environ. 2025, 965, 178623. [Google Scholar] [CrossRef] [PubMed]
- ISO 14044:2006; Environmental Management—Life Cycle Assessment—Requirements and Guidelines. ISO Standards: Geneva, Switzerland, 2006. Available online: https://www.iso.org/obp/ui/#iso:std:iso:14044:ed-1:v1:en (accessed on 29 September 2025).
- Christensen, T.; Damgaard, A.; Levis, J.; Zhao, Y.; Björklund, A.; Arena, U.; Barlaz, M.; Starostina, V.; Boldrin, A.; Astrup, T.; et al. Application of LCA modelling in integrated waste management. Waste Manag. 2020, 118, 313–322. [Google Scholar] [CrossRef]
- Clavreul, J.; Baumeister, H.; Christensen, T.H.; Damgaard, A. An environmental assessment system for environmental technologies. Environ. Model. Softw. 2014, 60, 18–30. [Google Scholar] [CrossRef]
- Bisinella, V.; Conradsen, K.; Christensen, T.H.; Astrup, T.F. A global approach for sparse representation of uncertainty in Life Cycle Assessments of waste management systems. Int. J. Life Cycle Assess. 2016, 21, 378–394. [Google Scholar] [CrossRef]
- Gievers, F.; Mainardis, M.; Catenacci, A.; Loewen, A.; Nelles, M. Life cycle assessment of biochar and hydrochar derived from sewage sludge: Material or energy utilization? Clean. Environ. Syst. 2025, 16, 100254. [Google Scholar] [CrossRef]
- Abuşoğlu, A.; Özahi, E.; Kutlar, A.I.; Al-Jaf, H. Life cycle assessment (LCA) of digested sewage sludge incineration for heat and power production. J. Clean. Prod. 2017, 142, 1684–1692. [Google Scholar] [CrossRef]
- Pagés-Díaz, J.; Huiliñir, C.; Lorenzo-Llanes, J.; Gónzalez, L.M.L.; Barrera, E.L. Techno-economic and environmental assessment of hydrothermal carbonization coupled with anaerobic digestion for sewage sludge and municipal solid waste co-treatment in Chile. Biomass Bioenergy 2025, 201, 108105. [Google Scholar] [CrossRef]
- Behjat, M.; Svanström, M.; Peters, G. Environmental assessment of phosphorus recovery from dairy sludge: A comparative LCA study. Waste Manag. 2024, 187, 50–60. [Google Scholar] [CrossRef]
- Mendoza-Geney, L.; Fonseca, S.; Bermudez-Aguilar, F.D.; Martínez-Cordón, M.J.; Gómez, A.; Rincon-Prat, S. Agronomic potential of pyrochar and hydrochar from sewage sludge: Effects of carbonization conditions. Sustainability, 2025; in preparation. [Google Scholar]
- Rincón-Prat, S.; Gómez, A.; Mendoza-Geney, L. Valorización Térmica de Biosólidos en la Economía Circular: Producción de Biocarbonizados y Aprovechamiento Energético; Editorial UN: New York, NY, USA, 2025; in preparation. [Google Scholar]
- ISO 17246:2024; Coal and Coke—Proximate Analysis. ISO Standards: Geneva, Switzerland, 2024. Available online: https://www.iso.org/standard/86978.html (accessed on 29 September 2025).
- ISO 17247:2020; Coal and Coke—Ultimate Analysis. ISO Standards: Geneva, Switzerland, 2020. Available online: https://www.iso.org/standard/79740.html (accessed on 29 September 2025).
- ASTM D240-19; Test Method for Heat of Combustion of Liquid Hydrocarbon Fuels by Bomb Calorimeter. ASTM: West Conshohocken, PA, USA, 2019. [CrossRef]
- EPA Method 6010C (SW-846); Inductively Coupled Plasma-Atomic Emission Spectrometry. U. Environmental Protection Agency: Washington, DC, USA, 2017.
- Groarke, R.; Vijayaraghavan, R.K.; Powell, D.; Rennie, A.; Brabazon, D. Powder characterization—methods, standards, and state of the art. Fundam. Laser Powder Bed Fusion Met. 2021, 491–527. [Google Scholar] [CrossRef]
- ISO 18134-3:2023; Solid Biofuels—Determination of Moisture Content—Part 3: Moisture in General Analysis Sample. ISO Standards: Geneva, Switzerland, 2023. Available online: https://www.iso.org/standard/83193.html (accessed on 29 September 2025).
- ISO 18122:2022; Solid Biofuels—Determination of Ash Content. ISO Standards: Geneva, Switzerland, 2022. Available online: https://www.iso.org/standard/83190.html (accessed on 29 September 2025).
- ISO 18123:2023; Solid Biofuels—Determination of Volatile Matter. ISO Standards: Geneva, Switzerland, 2023. Available online: https://www.iso.org/standard/83192.html (accessed on 29 September 2025).
- Faragò, M.; Damgaard, A.; Logar, I.; Rygaard, M. Life Cycle Assessment and Cost-Benefit Analysis of Technologies in Water Resource Recovery Facilities: The Case of Sludge Pyrolysis. Environ. Sci. Technol. 2022, 56, 17988–17997. [Google Scholar] [CrossRef]
- Mayer, F.; Bhandari, R.; Gäth, S.A. Life cycle assessment of prospective sewage sludge treatment paths in Germany. J. Environ. Manag. 2021, 290, 112557. [Google Scholar] [CrossRef] [PubMed]
- Meisel, K.; Clemens, A.; Fühner, C.; Breulmann, M.; Majer, S.; Thrän, D. Comparative Life Cycle Assessment of HTC Concepts Valorizing Sewage Sludge for Energetic and Agricultural Use. Energies 2019, 12, 786. [Google Scholar] [CrossRef]
- Yuan, H.; Zhai, S.; Fu, H.; Li, Z.; Gao, D.; Zhu, H. Environmental and economic life cycle assessment of emerging sludge treatment routes. J. Clean. Prod. 2024, 449, 141792. [Google Scholar] [CrossRef]
- Pérez, L.E.; Pérez, A.E.; Pino-Cortés, E.; Vallejo, F.; Díaz-Robles, L.A. An environmental assessment for municipal organic waste and sludge treated by hydrothermal carbonization. Sci. Total Environ. 2022, 828, 154474. [Google Scholar] [CrossRef]
- Mannarino, G.; Caffaz, S.; Gori, R.; Lombardi, L. Environmental Life Cycle Assessment of Hydrothermal Carbonization of Sewage Sludge and Its Products Valorization Pathways. Waste Biomass Valorization 2022, 13, 3845–3864. [Google Scholar] [CrossRef]
- Medina-Martos, E.; Istrate, I.R.; Villamil, J.A.; Gálvez-Martos, J.L.; Dufour, J.; Mohedano, Á.F. Techno-economic and life cycle assessment of an integrated hydrothermal carbonization system for sewage sludge. J. Clean. Prod. 2020, 277, 122930. [Google Scholar] [CrossRef]
- Fonseca, S. Evaluación Comparativa del Ciclo de Vida de Pirólisis y Carbonización Hidrotérmica para Valorización de Biosólidos; Universidad Nacional de Colombia: Bogotá, Columbia, 2025; Available online: https://repositorio.unal.edu.co/handle/unal/88580 (accessed on 29 September 2025).
- Breulmann, M.; van Afferden, M.; Müller, R.A.; Schulz, E.; Fühner, C. Process conditions of pyrolysis and hydrothermal carbonization affect the potential of sewage sludge for soil carbon sequestration and amelioration. J. Anal. Appl. Pyrolysis 2017, 124, 256. [Google Scholar] [CrossRef]
- Kooij, J.; Yang, P.-T.; Bruun, S.; Magid, J.; Nielsen, U.G.; Kuhn, L.T.; Müller-Stöver, D. Phosphorus speciation in different sewage sludges and their biochars and its implications for movement of labile phosphate in two soils. J. Environ. Manag. 2024, 370, 122565. [Google Scholar] [CrossRef]
- Yuan, H.; Lu, T.; Wang, Y.; Chen, Y.; Lei, T. Sewage sludge biochar: Nutrient composition and its effect on the leaching of soil nutrients. Geoderma 2016, 267, 17–23. [Google Scholar] [CrossRef]
- Fei, Y.H.; Zhao, D.; Liu, Y.; Zhang, W.; Tang, Y.-Y.; Huang, X.; Wu, Q.; Wang, Y.-X.; Xiao, T.; Liu, C. Feasibility of sewage sludge derived hydrochars for agricultural application: Nutrients (N, P, K) and potentially toxic elements (Zn, Cu, Pb, Ni, Cd). Chemosphere 2019, 236, 124841. [Google Scholar] [CrossRef] [PubMed]
- Wernet, G.; Bauer, C.; Steubing, B.; Reinhard, J.; Moreno-Ruiz, E.; Weidema, B. The ecoinvent database version 3 (part I): Overview and methodology. Int. J. Life Cycle Assess. 2016, 21, 1218–1230. [Google Scholar] [CrossRef]
- European Commission-Joint Research Centre-Institute for Environment and Sustainability. ILCD Handbook: Analysis of Existing Environmental Impact Assessment Methodologies for Use in Life Cycle Assessment; European Commission-Joint Research Centre-Institute for Environment and Sustainability: Ispra, Italy, 2016; Available online: https://eplca.jrc.ec.europa.eu/ (accessed on 29 September 2025).
- Zampori, L.; Saouter, E.; Castellani, V.; Schau, E.; Cristobal, J.; Sala, S. Guide for Interpreting Life Cycle Assessment Result; Publications Office of the European Union: Luxembourg, 2016. [Google Scholar] [CrossRef]
- Heijungs, R.; Kleijn, R. Numerical approaches towards life cycle interpretation five examples. Int. J. Life Cycle Assess. 2021, 6, 141–148. [Google Scholar] [CrossRef]
- Czerwińska, K.; Wierońska-Wiśniewska, F.; Bytnar, K.; Mikusińska, J.; Śliz, M.; Wilk, M. The effect of an acidic environment during the hydrothermal carbonization of sewage sludge on solid and liquid products: The fate of heavy metals, phosphorus and other compounds. J. Environ. Manag. 2024, 365, 121637. [Google Scholar] [CrossRef]
- Song, X.; Xue, X.; Chen, D.; He, P.; Dai, X. Application of biochar from sewage sludge to plant cultivation: Influence of pyrolysis temperature and biochar-to-soil ratio on yield and heavy metal accumulation. Chemosphere 2014, 109, 213–220. [Google Scholar] [CrossRef]
- Schlederer, F.; Martín-Hernández, E.; Vaneeckhaute, C. Ensuring safety standards in sewage sludge-derived biochar: Impact of pyrolysis process temperature and carrier gas on micropollutant removal. J. Environ. Manag. 2024, 352, 119964. [Google Scholar] [CrossRef] [PubMed]
- Henderson, A.D.; Hauschild, M.Z.; van de Meent, D.; Huijbregts, M.A.J.; Larsen, H.F.; Margni, M.; McKone, T.E.; Payet, J.; Rosenbaum, R.K.; Jolliet, O. USEtox fate and ecotoxicity factors for comparative assessment of toxic emissions in life cycle analysis: Sensitivity to key chemical properties. Int. J. Life Cycle Assess. 2011, 16, 701–709. [Google Scholar] [CrossRef]
- Clavreul, J.; Guyonnet, D.; Christensen, T.H. Quantifying uncertainty in LCA-modelling of waste management systems. Waste Manag. 2012, 32, 2482–2495. [Google Scholar] [CrossRef]
- Inc. Aspen Technology. Aspen Plus ® Aspen Plus User Guide. 2000. Available online: http://www.aspentech.com (accessed on 29 September 2025).
- Liu, W.; Zheng, X.; Feng, Y.; Ying, Z.; Wang, B.; Dou, B. Prediction and optimization of hydrogen-rich gas production from sewage sludge via a combined process of hydrothermal carbonization, pyrolysis, and reforming. Energy Convers. Manag. 2023, 293, 117462. [Google Scholar] [CrossRef]
- Lumley, N.P.; Ramey, D.F.; Prieto, A.L.; Braun, R.J.; Cath, T.Y.; Porter, J.M. Techno-economic analysis of wastewater sludge gasification: A decentralized urban perspective. Bioresour. Technol. 2014, 161, 385–394. [Google Scholar] [CrossRef] [PubMed]
- Ghavami, N.; Özdenkçi, K.; Chianese, S.; Musmarra, D.; De Blasio, C. Process simulation of hydrothermal carbonization of digestate from energetic perspectives in Aspen Plus. Energy Convers. Manag. 2022, 270, 116215. [Google Scholar] [CrossRef]
- Haydary, J. Processes with Nonconventional Solids. In Chemical Process Design and Simulation; Springer: Berlin/Heidelberg, Germany, 2018; pp. 321–346. [Google Scholar] [CrossRef]
- Margraf, R. 531 Flue Gas Treatment for Sewage Sludge Incinerators Flue Gas Treatment for Sewage Sludge Incinerators-Concepts and First Results from Plants in Operation. Available online: www.luehr-filter.com (accessed on 29 September 2025).
- Chang, H.; Zhao, Y.; Bisinella, V.; Damgaard, A.; Christensen, T.H. Climate change impacts of conventional sewage sludge treatment and disposal. Water Res. 2023, 240, 120109. [Google Scholar] [CrossRef] [PubMed]
Disclaimer/Publisher’s Note: The statements, opinions and data contained in all publications are solely those of the individual author(s) and contributor(s) and not of MDPI and/or the editor(s). MDPI and/or the editor(s) disclaim responsibility for any injury to people or property resulting from any ideas, methods, instructions or products referred to in the content. |
© 2025 by the authors. Licensee MDPI, Basel, Switzerland. This article is an open access article distributed under the terms and conditions of the Creative Commons Attribution (CC BY) license.