Abstract
The transition toward carbon neutrality is accelerating the deployment of renewable energy sources (RES), creating new challenges for power balance, stability, and renewable generation curtailment. In the Baltic States, this RES growth coincides with synchronization with the Central European Synchronous Area, which poses additional technical and operational challenges. This paper evaluates the integration of offshore wind farms (OWFs) into the Lithuanian power system for 2027 and 2035, focusing on their impact on system operation, transmission loading, power balance and power system strength. A methodology based on extrapolated historical hourly data is applied to assess Lithuanian power system security under large-scale RES penetration, identifying critical contingencies and lines most prone to overloading. Results indicate that in 2027, network overloads may occur under N–1 contingencies when OWF capacity reaches 1400 MW; higher capacities require curtailment to maintain the generation–load balance. In 2035, planned grid reinforcements eliminate N–1 overloads. However, in both years, system strength remains the limiting factor. With an admissible short-circuit ratio (SCR) of 3, the maximum allowable OWF capacity is 1141 MW in 2027 and 1582 MW in 2035 under N–1, and 562 MW and 1039 MW under N–2 conditions.
1. Introduction
Global renewable energy targets, driven by the need to phase out carbon-intensive energy sources to reduce carbon emissions and achieve carbon neutrality by 2050, have significantly accelerated the deployment of renewable energy resources (RES). This transition has increased the share of solar and wind generation in the global energy mix, enabling the use of low-cost, sustainable primary energy sources for power production. However, the high penetration of these variable energy sources has introduced new challenges for network operators and offshore wind farm (OWF) owners, including renewable energy curtailment. Curtailment refers to reducing power plant output when full energy production cannot be fed into the grid due to constraints or oversupply.
The Renewable Energy Directive [1], established by the European Union, aims to promote integration of renewable energy into the power grid while ensuring sustainability, efficiency, and reliability. Its key objectives regarding renewable integration include increasing renewable energy share, grid access and infrastructure development, facilitating renewable energy curtailment management, enhancing market integration, encouraging flexibility and energy storage, guaranteeing priority dispatch, removing barriers, and promoting cross-border cooperation.
Wind energy is expected to constitute a significant portion of power generation soon, resulting in a substantial number of wind turbines operating across various wind farms. However, power systems with high levels of wind energy integration face technical challenges due to wind energy’s inherent variability. High wind energy penetration typically involves numerous wind farms spread across different geographic locations being connected to the power system.
The integration of RES into the power grids of European countries varies significantly due to differences in policies, resource availability, grid infrastructure, and economic priorities. A distinctive situation, related to the integration of RES, exists in the Baltic States. The moderate pace of RES development in this region is accompanied by a dual challenge: synchronization with Central European Synchronous Area (CESA) (which entails disconnection from the Integrated Power System/Unified Power System (IPS/UPS) and substantial changes in electrical grid infrastructure) and the simultaneous expansion of RES.
This paper focuses on the connection of OWF to the Lithuanian electricity grid. Currently, Lithuania is still dependent on imports of natural gas, oil, and electricity, yet has been actively pursuing transition towards solar and wind energy with a growing number of RES projects and significant investment in offshore wind. According to the National Energy Independence Strategy [2], by 2050 the situation is expected to change fundamentally, with fossil fuels being phased out in favour of electricity generated from RES, biogas, and hydrogen. Most of the electricity production in 2050 is expected come from onshore and offshore wind farms, solar power plants, and other flexible energy generation technologies.
In the context of this study, “critical grid elements” are defined as transmission system components whose operational state strongly influences system security or OWF operation. These include transmission lines due to their impact on transmission line loading, synchronous condensers, and high-voltage direct-current (HVDC) interconnections, which significantly affect short-circuit power levels at the OWF connection point. The paper analyzes the impact of OWF on the power system regimes, considering loading of the transmission network, the overall balance of the power system and transmission line loads, as well as the impact of the power grid on the operation of OWF, considering the power system’s short-circuit power. Such an assessment allows for a better evaluation of large renewable energy projects’ interaction with the power grid.
2. Literature Review
Wind energy impacts and interacts with environmental, social, economic, technical, and legal systems with which it is integrated. McKenna et al. (2025) [3] conducted a detailed analysis of them. The authors showed that at low wind energy penetration levels, specific recurring concerns, like bird and bat collisions, noise and health effects, local weather variations, and market price fluctuations, are not substantial. However, they highlighted several challenges that remain difficult to address, including integrating high wind energy penetration levels into power systems. The challenges become more serious when integrating offshore wind power plants (OWPPs), specifically because they empower a variable and uncertain natural resource (wind), which results in variability and unpredictability of wind energy (Carta et al., 2022) [4]; high offshore wind speeds, which tend to increase with a distance from the shore; and enormous energy potential (Fernández-Guillamón et al., 2019) [5]. OWPPs operate in extraordinary environmental conditions, including but not limited to strong wind, waving, and hurricanes (Longabart et al., 2011) [6], and therefore require advanced technologies resulting in high installation and maintenance costs (Fernández-Guillamón et al., 2019) [5]. Desalegn et al. (2023) [7] summarized the technological challenges of utilizing offshore wind energy. They include exceeding the cost of marine foundations, the addition of a high price to integrate into the grid systems due to increasing distances between OWFs and onshore power loading centres; substantial cost and time are needed during the installation of wind farm infrastructures, as the installation process may be interrupted due to the harsh offshore weather conditions; and restricted access for supervisions and maintenance during operation. Furthermore, as observed by Kurth et al. (2022) [8], as the number and size of OWPPs increase and their distance from the shore grows, the challenges associated with connecting them to the grid intensify.
Wu et al. (2024) [9] pointed out that due to the integration of OWPP, there are broad concerns about grid reliability, stability, power quality, and resilience. Syed Wajahat Ali et al. (2021) [10] identified power quality, system stability, and frequency and voltage control as key issues when integrating OWPP into the grid. They indicated that these issues arise from the operational mode and the structural and performance constraints imposed by OWPP. Carta et al. (2022) [4] discussed a few disturbances in the interaction of wind turbines with the electrical network and described advanced devices, techniques, methods, measures, and algorithms used to manage them. Potential disturbances that were identified include voltage variations, voltage flicker, phase voltage imbalance, voltage dips and swells, voltage notching, oscillatory transients, impulsive transients, transient interruptions, harmonics, short-circuit current contribution, reactive power, active power, frequency variations, and islanding. Mugambi et al. (2025) [11] argued that the interconnections of OWPPs present challenges to system operation and control, making stability analysis crucial for addressing these issues. Hu et al. (2015) [12] classified power system stability issues in relation to the size of the disturbance and time span into small signal stability, static stability, and transient stability, and concerning the grid type, they classified them as transmission- and distribution-grid-related. Shair et al. (2021) [13] and Hatziargyriou et al. (2021) [14] critically examined the existing classical and extended power system stability classifications of 2004 and 2020, respectively. They demonstrated that the early power system stability classification is of a physical nature and includes rotor angle, voltage, and frequency. Widely integrating the converter-interfaced generation technologies, this classification has been expanded to include converter-driven and resonance stability. In addition, Shair et al. (2021) [13] proposed a new power system stability classification. It preserves the logic of classical classifications while offering a broad coverage and adaptability to emerging stability challenges in the context of high renewable penetration and power electronics. In detail, the proposed classification emphasized time scale, disturbance size, stability variable, and frequency range dimensions of power system stability.
Global scientific literature has historically analyzed steady-state to transient stability issues of OWPP integration in the power system. Small-signal stability analysis, when the system was found around an equilibrium point; and large-signal stability analysis, when it moved from one equilibrium point to another due to wind speed variation; energizing of the OWPP; the kick-in of a wind turbine generator after maintenance; or a cutoff of a cable with failure, etc., were carried out for the purpose (Wu et al., 2024) [9]. Sajadi et al. (2020) [15] proposed a statistical methodology for steady-state stability analysis to identify normal and contingency operational issues of large-scale power systems integrating OWPPs. Voltage stability and thermal stability criteria were considered, conducting a normal operation analysis. In contrast, severity indices, such as voltage regulation, transmission line loading, and reactive reserve support, were calculated using a contingency operation analysis which considered N–1 security criteria. Results demonstrated that the integration of OWPPs improved voltage stability across the system. Line congestion was not a concern when adding wind generation capacity in a lightly loaded power system. In a particular case, retirement or loss of a candidate point of interconnection (POI) can negatively impact the steady-state stability of the system. Similarly, Dantas et al. (2025) [16] studied the impact of connecting OWPPs to the Brazilian Southern system on steady-state voltage stability under progressively increasing load, N–1 contingency operation, and increased offshore wind generation at three different power factors. Results revealed that power systems integrated with OWPPs presented voltage safety margin values below adequate safety limits for the nominal operation case and for a list of contingencies. The appropriate design of the Static Var Compensator was an effective control device that increased the voltage safety margin to desirable and safe values. Modelling OWPPs as PQ-type buses for different power factors was valid and facilitated the steady-state voltage stability analysis. Choi et al. (2022) [17] carried out a steady-state analysis of large-scale OWPPs integration on the southwest side of the Korea Electric Power Corporation. The results of the system strength assessment and the fault current analysis showed that interaction between OWPPs and inverter-based resources makes the power system weaker, and fault current contributions from OWPPs violate the capacity limit of existing circuit breakers. A steady-state analysis was performed to assess the OWPP’s ability to meet local network demands for active and reactive power by Alves et al. (2025) [18]. Scientists showed that OWPPs could fulfil these demands with minimal adjustments, such as tuning controllers or accounting for reactive power compensation variations and cable lengths.
Mugambi et al. (2025) [11] summarized system screening indexes and dynamic stability analysis methodologies. They observed that for initial screening to identify potential instability scenarios, the interaction factors are calculated, and the SCR, grid strength impedance metric, and impedance margin ratio are needed for assessing the system strength. They noticed that frequency and time domain methods are required to analyze OWPP stability accurately. These include transfer function-, impedance-, passivity-, and eigenvalue-based, as well as EMT and real-time simulations. Qays et al. (2023) [19] reviewed the system strength measurement and mitigation techniques in a power system by installing multiple energy resources. The weighted short-circuit ratio was an effective metric for system strength. Similarly, Yu et al. (2022) [20] argued that the short-circuit ratio (SCR) and the grid impedance ratio are two indices to quantify the system strength of the power system with RES. Wang and Hsiung (2010) [21] introduced a control scheme based on a static synchronous compensator (STATCOM) to achieve voltage control and damping enhancement of integrated 80 MW OWPPs and 40 MW marine-current farm. Results showed that the STATCOM, combined with the designed damping controller, effectively stabilizes the system under disturbances. Moreover, the voltage fluctuations of the alternative current (AC) bus subject to the active power variations in the system are effectively controlled. Wang and Wang (2011) [22] performed the dynamic stability analysis of 80 MW OWPPs connected to a high-voltage direct-current (HVDC) link. Scientists designed the damping controller of the rectifier current regulator of the proposed HVDC link using modal control theory to contribute adequate damping under various wind speeds and different disturbance conditions. The eigenvalue analysis was carried out to validate the effectiveness of the designed damping controller under different wind speeds, and the nonlinear model simulations were performed to demonstrate its efficacy under various disturbance conditions. Results showed that the HVDC link combined with the designed damping controller renders adequate damping characteristics under different wind speeds and effectively mitigates the fluctuations of the OWPPs under disturbance conditions. Sindhura and Sridhar (2012) [23] analyzed a control scheme based on a flexible AC transmission system (FACTS) controller device to achieve voltage control and enhance grid-connected 80 MW offshore wind and 40 MW marine-current farms. The effectiveness of the suggested control scheme was assessed by applying the eigenvalue technique and the nonlinear system model under various disturbances. The simulated results demonstrated that the STATCOM when connected to the damping controller successfully stabilized the system under disturbance conditions. The suggested control scheme, in principle, controlled AC bus voltage fluctuations in response to changes in the system’s active power too. Sharma et al. (2023) [24] developed the Automated System-wide Strength Evaluation Tool to assess system strength under various operating conditions and contingencies, addressing the challenge of integrating 30 GW of offshore wind power in the USA by 2030 with minimal system upgrades. Results revealed that the Eastern Interconnection is big enough to demonstrate a significant impact on SCR reduction when integrating 30 GW of offshore wind. Turning off the selected traditional generators does not create new weak grid conditions. Gevorgian et al. (2024) [25] developed advanced modelling, control, stability monitoring, and protection methods for the analysis and mitigation of dynamic stability problems in OWPPs interconnected with onshore power systems via high-voltage alternating-current (HVAC) or HVDC submarine transmission connected to strong and weak POIs in onshore power grids. The tool application was demonstrated for OWPP POIs in three interconnections, i.e., PJM, NYISO, and ISO-NE. Results of analysis of interactions between HVAC- and HVDC-interconnected OWPPs showed that OWPPs develop undamped active and reactive power oscillations that are hard to dampen using plant controls since the POI becomes too weak. A synchronous condenser was added to maintain the POI strength. Results demonstrated that a reduction in SCR did not result in undamped oscillations because of the damping effect introduced by a synchronous condenser. The authors argued that the tool helps evaluate dynamic and transient behaviour.
Poulose and Kim (2023) [26] comprehensively reviewed the latest research investigating novel approaches to assessing and enhancing the transient stability of RES-dominated power systems specified by inherent low-inertia characteristics of RES and fast-acting power electronic devices. They found that transient stability analysis tools for RES-penetrated grids incorporate numerical simulation methods, energy function techniques, and alternative simple and quick graphical methods. Wu et al. (2024) [9] classified research methods for transient stability analysis in power systems. Scientists observed that methods investigate the nonlinear behaviour of power systems under significant disturbances. Methods vary in analytical depth, precision, and intuitiveness, and include simulation, direct, data-driven, analytical, and other. RES variability complicates balancing supply and demand and exacerbates transient stability issues. Therefore, power systems require advanced control strategies to manage the interactions between different generation and transmission technologies, ensuring the system remains stable under various operating conditions. Sajadi and Clark (2018) [27] and Sajadi et al. (2019) [28] developed a methodology to evaluate the transient stability (enormous signal stability) of power systems integrated with OWPPs by considering classical stability classifications. The methodology was applied to study short-term faults, referring to short-circuits on transmission lines or generators [28], and long-term faults, referring to outages of generation unit(s) or line disconnections [27]. Scientists examined integrating 1000 MW of OWPP into the FirstEnergy/PJM service territory using a realistic model of a 63-bus test system representing the USA Eastern Interconnection. Rotor angle difference and deviation were computed to assess the transient rotor angle stability performance. The transient voltage stability was evaluated by computing the transient over-voltage, transient low-voltage, and settling voltage metrics. At the same time, the system’s frequency response was evaluated on a swing-based frequency response index. Results revealed that integrating an OWPP improves the transient stability of the overall system by decreasing the number of oscillation modes. Pelosi et al. (2025) [29] implemented a modified IEEE 23-bus test system representing the Romanian national power system to conduct the load flow and the dynamic transient simulations. Their results demonstrated that replacing conventional generators with intermittent and low-inertia units impacts buses’ voltage magnitudes, active/reactive power flows, power losses, and frequency deviations. Shewarega et al. (2009) [30] analyzed the impact of increased offshore wind power generation on the transient stability performance of the interconnected system. While the electromechanical power oscillations are characteristic of traditional synchronous generators in the event of grid faults, it was found that they are not relevant in wind plants. Furthermore, the critical fault clearance time reduces by increasing the installed capacity of wind in the total power structure. The oscillations in voltage, real, and reactive power can result from the deadband in the voltage controller. Lu and Rao (2023) [31] suggested a STATCOM damper based on a recurrent Petri fuzzy probabilistic neural network to improve the transient stability of the power system when large OWPPS and photovoltaic power plants (PPs) are integrated into the power system. The transient fluctuations in the power supply were slowed down thanks to the control scheme, and the steady-state was achieved within 1–1.5 s.
Thus, the review of the literature demonstrates an increasing number of stability issues that the integration of OWPP might cause to the power system, affecting its security. Mainly, stability issues were analyzed at the theoretical level by applying a descriptive analysis method. Stability issues are proposed to be addressed by applying a variety of tools, analysis methods, indicators, etc. Historically, broad stability analyses were carried out mainly for onshore wind power plants (OnWPPs), their integration into a distribution grid, and traditional power systems, but investigations of OWPPs and their connection to the transmission lines are gaining momentum. The literature review demonstrated that scientists were interested in PJM, Brazilian, Korean, etc., power systems as case studies, while the Lithuanian power system gained little attention, even though it was studied in the context of the IPS/UPS system. From the beginning of 2025, the Lithuanian power system was disconnected from the IPS/UPS and synchronized with continental Europe. There is a lack of research on how the Lithuanian power system will operate under changed conditions, taking into account both current circumstances and approved development plans. Therefore, research is timely, especially that which analyzes the effects of the latest energy generation technologies (OWPPs) on transmission system operation. This will allow assessing power system security with a high penetration of RES.
3. Methodology
The methodology includes the assessment of the wind farm grid interface in the following aspects:
- Grid steady-state regimes after connecting a high-power wind farm. This aspect assesses the load on power lines in normal operation and N–1 contingencies.
- The overall active power balance of the power system. With high renewable penetration and overlapping solar and wind power generation, there may be a need to limit electricity production because the existing load and the ability to export electricity are insufficient.
- Short-circuit power of the power system. Modern technology wind farms require a leading synchronous energy source. Wind farms, like solar farms, can operate stably when the power of the power system is at least three times higher than the power of a specific farm [32]. Otherwise, the connection is considered very weak, and the wind farm may lose stability and disconnect, even if the thermal capacity of the power lines is sufficient.
3.1. Grid Security Assessment Using Load Flow and Contingency Analysis
Grid regimes are investigated by solving the load flow task. In practice, only boundary conditions are usually analyzed, such as the winter and summer on-peak and off-peak load conditions. However, when analyzing a power system with a high penetration of RES, it is necessary to estimate stochastically changing wind and solar generation profiles. For this reason, historical hourly data were used, including information about the power system load, solar and wind, as well as conventional power plant generation data, taking into account their geographical distribution. Such an approach allows for a more accurate assessment of RES profiles, considering the geographical specifics of a particular connection point.
For each hour, the load flow problem is solved, checking the N–0 and N–1 contingencies, determining the load levels of the power lines, and identifying overloads.
The security level of the power grid is calculated based on the methodology presented in [33]. Following the contingency process, one contingency is selected as the worst one. A performance index (PI) is usually used in the literature to rank the contingencies. In this research, a simplified approach of PI is used to identify that which branch outage has the most negative influence on in the system in terms of overload security:
where is the MVA loading of branch , is its transmission capacity, and is the total number of branches.
The contingency having the highest PI is selected as the worst one. The result of power flow in the selected contingency reflects the most critical situation
The risk index is usually used to capture the security level in a power system [34]. In this research, security assessment is expressed through the concept of overload risk. The overload index is used to evaluate the system security which is based on the maximum loading limit of branches. If the loading of any equipment exceeds some maximum set value, then it will be disconnected from the network [35]. To measure the risk, a severity function should be defined first. The severity function in fact depends on the power system operator’s decision. Following each contingency, the operating condition will change. The consequence of this operating condition in terms of overload can be represented by a severity function. The continuous severity function was used to reflect the extent of the violation for loading:
where i is branch number, is loading of the branch in percent, and is the parameter (<100%) describing the margin of branch overloading [33,36]. In this study, the value of parameter was set at 90%, based on engineering experience and the value used by other authors [33].
As the severity function value varies depending on the contingency, two values for each branch are selected: one which represents the higher performance index [33] and the other one which represents the highest overloading of this branch, even if the corresponding contingency creates a low performance index.
The branches are ranked based on their risk indices, and the bottlenecks are then identified.
3.2. Ensuring the Active Power Balance
Active power balance between power consumption and power production should be ensured to maintain the frequency within permissible limits. The equilibrium of active power is expressed by
where is generated power in the power system, is imported active power from other power systems, is active power load, is active power losses in the grid, and is exported active power to other power systems.
If generation in the power system is insufficient to supply electricity to consumers, additional power is imported from other (neighbouring) power systems. If generation is higher than consumption, the surplus electricity can be exported to other power systems (Figure 1), or it can be curtailed. In case of high penetration of renewables and insufficient interconnections, the export can be limited due to tie-lines transmission capability, and the generation should be curtailed.
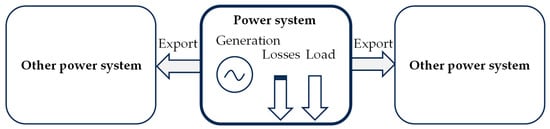
Figure 1.
Illustration of active power flows in the power system.
In this work, the curtailment factor for generators subject to curtailment is derived as
where is active power of generators to be curtailed, is maximum permissible export, and is calculated export.
It should be noted that the curtailment factor is calculated only if . Since modifying generator outputs affects the power flows, the associated network losses change as well. This, in turn, alters the amount of power available for export. Therefore, the curtailment factor has to be obtained iteratively by recalculating the formula. In practice, two iterations are sufficient. Then, the final curtailment factor for generators which power should be reduced is
The sequence algorithm of calculations is presented in Figure 2.
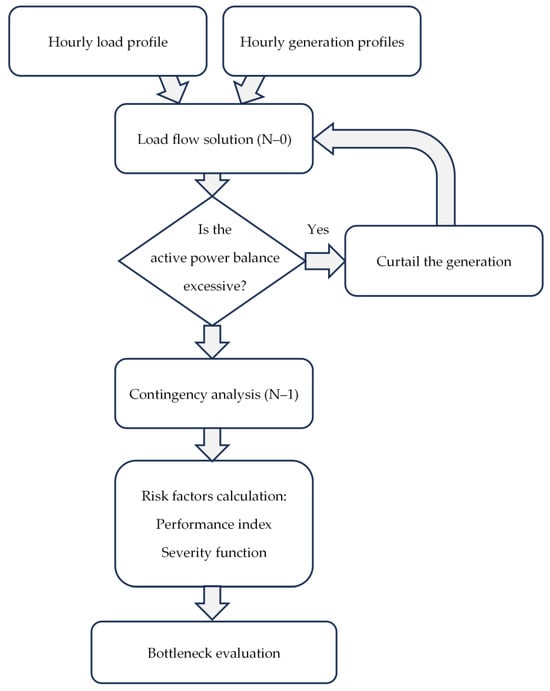
Figure 2.
Algorithm of bottleneck evaluation.
3.3. Short-Circuit Power Assessment
The short-circuit ratio (SCR) [20] is an index to evaluate the system strength [37]. Furthermore, the critical short-circuit ratio is defined as the corresponding SCR when the system voltage is in a critical stable state. Existing studies are mostly focused on the SCR. Many forms of SCR and the critical value to distinguish the weak system were proposed to consider the interactive impact among power electronic equipment. The multi-infeed short-circuit ratio [38] and the equivalent effective short-circuit ratio [39] were proposed to evaluate the system strength of the multi-infeed HVDC system. The weighted short-circuit ratio [40], the composite short-circuit ratio [41], and the equivalent circuit-based short-circuit ratio [42] were proposed to analyze the voltage stability problem of the weak power system with RES.
The system strength is a common concern in a power system with high penetration of RES. The system strength means the ability of the system to maintain or restore the voltage to the allowable range both during the steady state and following disturbances [43]. The SCR is a common index to quantify the system strength. The SCR is the ratio of the short-circuit capacity at the connection point to the rated capacity of the power electronic equipment connected to that point:
where is the short-circuit capacity and is the rated capacity of power electronic equipment, which can be expressed in MW or MVA at the discretion [42]. The short-circuit capacity is equal to the short-circuit current times the rated voltage [44]. When set, with the rated voltage at the connection point as the reference voltage and the rated capacity of power electronic equipment as the reference capacity, the base impedance . Then, SCR can be expressed as
The SCR indicates the ability of the power system to respond to the active/reactive power injection and absorption. The low SCR indicates that the system strength is insufficient to support the reliable operation of power electronic equipment. Power electronics-based generators (wind or solar power plant) can operate only if SCR at the point of connection equals or is higher than 3. If this ratio is lower under certain conditions, it may cause the disconnection of the wind or solar power plant. The SCR = 3 threshold is a widely used planning benchmark for converter-interfaced generation, as lower SCR values are known to increase the risk of voltage instability, reduced phase-locked loop robustness, and small-signal control interactions in grid-following wind turbine converters. A detailed EMT-level stability study lies beyond the scope of this planning analysis, but SCR = 3 provides a conservative and industry-accepted indicator of minimum system strength.
4. Research Object and Scenarios
In this study, the research object is the Lithuanian power system, including its planned configuration after synchronization with the continental European network, with a particular focus on the integration of an offshore wind farm.
4.1. Characteristics of the Power System and Model
Historically, the Lithuanian electricity system operated synchronously with the IPS/UPS system connecting the systems of Belarus, Russia, Estonia, Latvia, Lithuania, and other countries. The frequency of the Baltic countries electricity systems was centrally controlled and coordinated by a dispatch centre in Moscow, which meant that, in terms of system control, Lithuania, Latvia, and Estonia were isolated energy islands within the European Community.
On 9 February 2025, synchronization with the continental European electricity networks took place. The infrastructure installed as part of the synchronization project helps to integrate more electricity production from RES into the Lithuanian system. The new lines and equipment contribute to Lithuania’s goal of becoming a country that generates 100% of its electricity from wind, solar, and other RES by 2050.
As of 2025, the Lithuanian, Latvian, and Estonian power systems are physically disconnected from the Belarusian and Russian power systems, including the Kaliningrad region, and are synchronously interconnected with Poland. Non-synchronous interconnections via high-voltage direct-current (HVDC) cables with the Scandinavian countries remain in operation: Lithuania is linked to the Swedish power system through the NordBalt HVDC interconnector, while Estonia is linked to the Finnish power system through the Estlink 1 and Estlink 2 HVDC interconnectors (Figure 3).
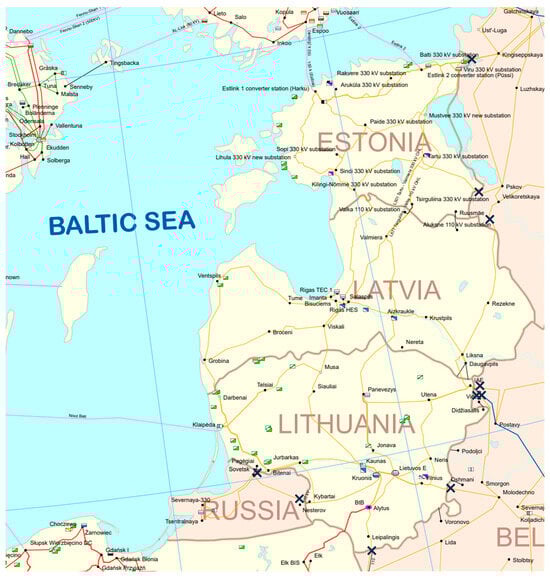
Figure 3.
Fragment of power grid map [45].
The main emphasis of this study is on the connection of OWFs to the Lithuanian electricity grid; therefore, the regimes of the Lithuanian electricity system are examined in detail.
According to the grid development plan of Lithuania [46], the connection point of the offshore wind farm is expected to be the existing 330 kV overhead line in the western part of Lithuania. The analysis assumes that the wind farm will be connected to the 330 kV overhead line and assesses the suitability of the existing infrastructure.
4.2. Data of Load and RES Generation
The analysis used historical hourly load and generation data for 2020–2022 [47] to assess load growth and dependence on different climate conditions. The historical load data were scaled based on the predicted system maximum load. Wind and solar generation were extrapolated according to available wind and solar profiles considering geographical location.
The load profile is presented in Figure 4, and generation profiles of two random wind parks and two random solar parks installed in different geographical locations of Lithuania are presented in Figure 5, Figure 6, Figure 7 and Figure 8. The load profile shows that the winter months of 2021 exhibit significantly higher demand compared to the corresponding periods in 2020 and 2022. This increase can be attributed to the lower temperatures observed in January, February, and December 2021.
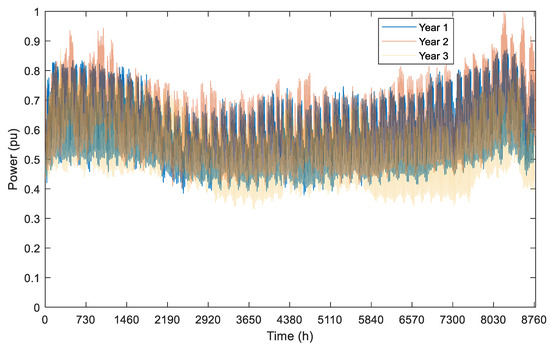
Figure 4.
Load profile.

Figure 5.
Generation profile of wind park 1.
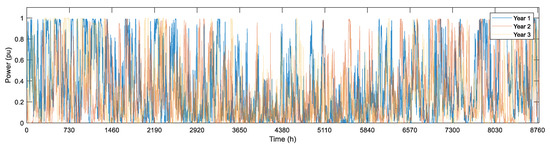
Figure 6.
Generation profile of wind park 2.
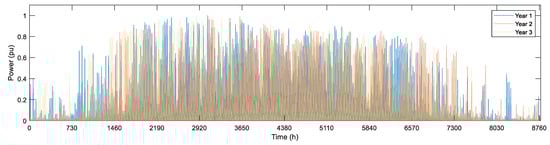
Figure 7.
Generation profile of solar park 1.
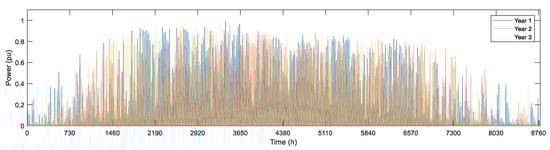
Figure 8.
Generation profile of solar park 2.
A comparison of the generation of two wind farms located in different regions of the Lithuanian electricity system and two solar parks is presented in Figure 9. A visual representation of the coincidence of generation shows that wind power generation is more dispersed across Lithuania, while solar power generation is more simultaneous across solar power plants.
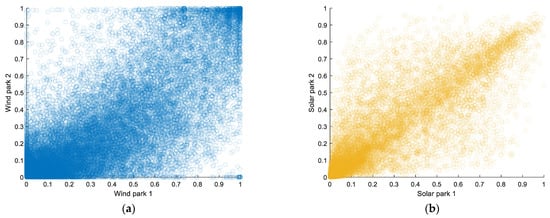
Figure 9.
Correlation of two wind parks’ generation (a) and two solar parks’ generation (b).
Figure 10 shows the overlap of solar and wind power generation in the same region of Lithuania based on historical hourly data for 2020–2022. This graph illustrates that there were hours when solar and wind power generation reached 80–90% of installed capacity at the same time, while the load at that time was 60–70% of maximum load capacity.
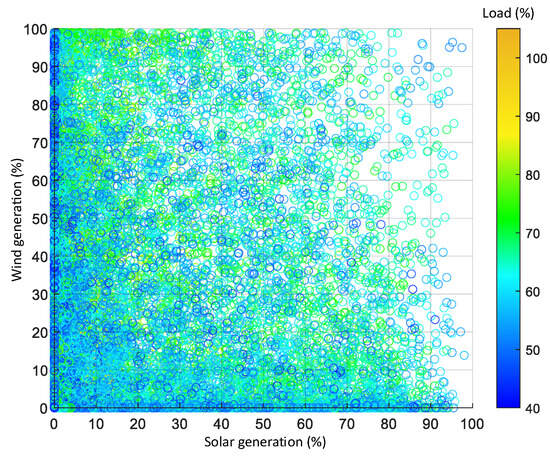
Figure 10.
Distribution of solar and wind generation and load over a three-year period (one dot represents one hour). Warmer colour indicates higher system load.
4.3. Scenarios
Two scenarios are being considered, differing in terms of the load on the electricity system, installed capacity, but most significantly in terms of the electricity network topology, taking into account the current electricity network topology and the topology envisaged in the ten years development plan [46] of the transmission system operators, i.e., taking into account the necessary network expansion due to planned changes in load and generation.
The first scenario corresponds to the current situation of the electricity network but takes into account existing and planned wind and solar parks. This scenario would best correspond to the situation in 2027, when the currently designed and constructed solar and wind farms will start operating. This scenario is referred to below as Scenario 2027.
The second scenario corresponds to the situation in the more distant future, when the electricity grid expansion projects necessary for the smoother and more flexible use of RES, the possibility of connecting OWFs, and the transition to greater electrification of the energy system will have been implemented. This scenario would correspond to the situation around 2035, when these projects are expected to be fully implemented. This scenario is referred to below as Scenario 2035.
The summary of the Lithuanian power system characteristics used for the analysis are presented in Table 1.

Table 1.
Summary of the Lithuanian power system characteristics [46].
The topology of the Lithuanian electricity transmission network (330 kV) used in the study is shown in Figure 11. Due to the sensitivity of information about the electricity network, the names of substations and lines are not disclosed, and the lines are marked with code names from L1 to L34. Comparing scenarios 2027 and 2035, Scenario 2035 evaluates additional lines that reinforce the electricity network and increase its resilience.
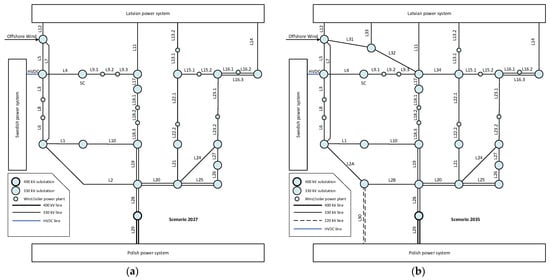
Figure 11.
Topology of the analyzed power grid for Scenario 2027 (a) and Scenario 2035 (b).
The capacities of the inter-system sections assessed in the analysis are as follows: cross-border transmission capacity with the Latvian power system is 1200 MW in both directions, connection with the Swedish power system (NordBalt) is 700 MW in both directions, and cross-border with the Polish power system (synchronous connection LitPol Link) is up to 1000 MW with the flow direction from Lithuania to Poland.
Since line loads depend not only on loads and solar and wind generation but also on inter-system flows, two boundary scenarios were distinguished. Priority is applied to electricity export from the Lithuanian power system to the Latvian power system. This scenario assesses the possibility that Lithuania will be the first in the development of RES and will export electricity to other Baltic countries. The maximum power flow in the Lithuanian–Latvian cross-border can reach up to 1200 MW.
The power flow between the Lithuanian power system and the Latvian power system is minimal (about 0 MW). This scenario is possible if other Baltic countries also intensively develop renewable energy and there will be no possibility to export electricity from Lithuania to other Baltic countries.
The analysis of the resilience of the electricity network is performed by solving the flow distribution problem in N–1 contingencies. The N–1 criterion is applied to 330 kV lines and an HVDC cable shown in Figure 11. For each simulation step, all single-element outages are evaluated, and the resulting post-contingency operating states are assessed against thermal and voltage limits. The contingency that produces the largest violation (e.g., maximum line overload or largest voltage deviation) is identified as the worst case.
5. Results
5.1. Overloading Risk Analysis
This section presents the results of risk parameters calculation. For data visualization, lines were selected whose disconnection has the greatest impact on power flow redistribution and power system resilience. Disconnections of these lines are numbered as contingencies C1 to C9, corresponding to lines listed in Table 2. The impact of disconnecting other lines is less significant, so they are not included in the visualization.
Table 2.
Numbers of contingencies corresponding to Figure 12 and Figure 14.
Distribution of the performance index in Scenario 2027 is shown in Figure 12. Analysis shows that contingencies C2 and C8 have the most impact on load flows, while C5 and C9 have the least. In 2027, impact factor is less than 2.0 in most cases. Only if offshore wind capacity exceeds 2000 MW, the performance index exceeds 2.0.
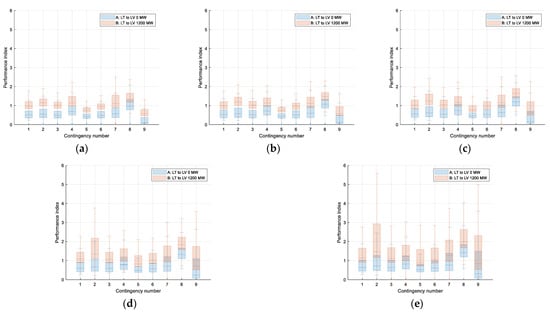
Figure 12.
Performance index (year 2027) with different installed capacity of offshore wind farm: (a) 700 MW, (b) 1000 MW, (c) 1400 MW, (d) 2000 MW, (e) 2500 MW.
Severity function of the most affected branches is presented in Figure 13 (Scenario 2027). Analysis shows that the power grid is strong enough to withstand N–1 contingencies. In Scenario 2027 situation, overloads caused by OWF are observable if the installed capacity reaches 1400 MW. This may result in overloading of overhead lines L5 and L12, which are connected to the OWF substation. The analysis shows that as increasingly powerful OWFs are installed, transmission line overloads do not increase linearly; instead, their rate of growth diminishes due to the need for generation curtailment under excess power conditions. This phenomenon is described below.
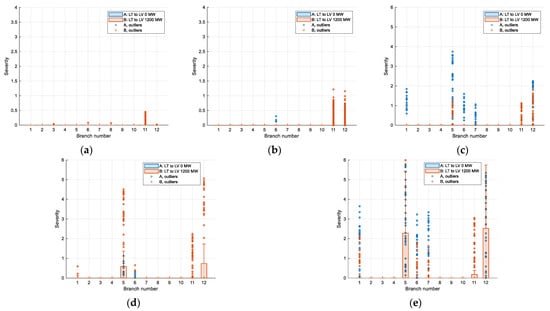
Figure 13.
Severity (year 2027) with different installed capacity of offshore wind farm: (a) 700 MW, (b) 1000 MW, (c) 1400 MW, (d) 2000 MW, (e) 2500 MW.
In Scenario 2035, new power lines L30 to L34 are planned to be installed to reinforce the power grid and increase its internal transmission capacity. Hence, the performance index decreases below 2.0 and is less than 1.0 in most cases (Figure 14).
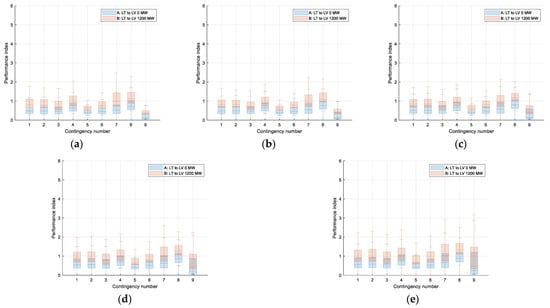
Figure 14.
Performance index (Scenario 2035) with different installed capacity of offshore wind farm: (a) 700 MW, (b) 1000 MW, (c) 1400 MW, (d) 2000 MW, (e) 2500 MW.
The severity function remains very low in Scenario 2035 (Figure 15), as the simulation accounts for the newly constructed lines.
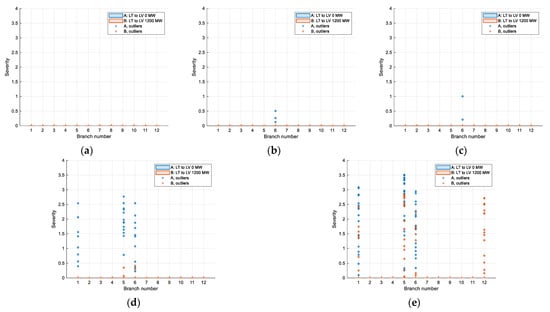
Figure 15.
Severity (year 2035) with different installed capacity of offshore wind farm: (a) 700 MW, (b) 1000 MW, (c) 1400 MW, (d) 2000 MW, (e) 2500 MW.
As previously noted, the slower growth of transmission line overloads is not due to larger offshore wind capacity itself, but to the curtailment required when installed capacity is high. During periods when wind and solar generation coincide, system load and export capabilities cannot absorb all active power. As a result, wind output is curtailed, which limits further increases in transmission line flows. Figure 16 shows the calculated derating factor which should be accounted to maintain active power balance.
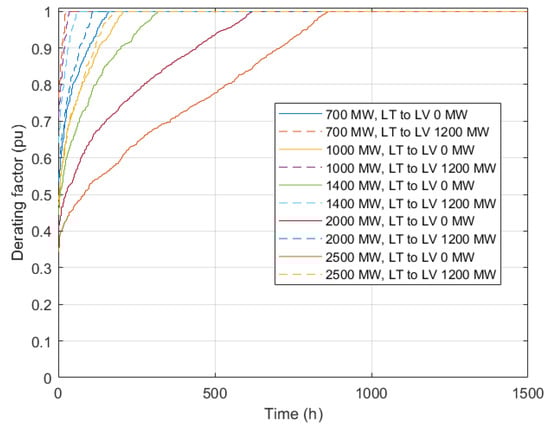
Figure 16.
Derating factor of wind and solar power parks due to power system balance requirements.
5.2. Short-Circuit Power Analysis
Short-circuit power levels were estimated for the scenarios of the year 2027 and 2035. The short-circuit power at the offshore wind farm connection point was evaluated using the complete network model, which includes the contributions of must-run synchronous generators, synchronous condensers, onshore renewable energy sources, and the HVDC interconnection. The SCR was assessed using three-phase short-circuit currents, which provide the highest fault level at the connection point and are therefore used as the reference condition in system-strength evaluation. Short-circuit power was calculated for normal operation (N–0) and contingencies (N–1 and N–2). The results are presented in Table 3 and Table 4.
Table 3.
Short-circuit power levels in scenario 2027.
Table 4.
Short-circuit power levels in scenario 2035.
The analysis shows that under N–1 contingencies the strength of the power system remains sufficient to connect a wind farm with an installed capacity of up to 1100 MW in the 2027 scenario and up to 1580 MW in the 2035 scenario. These limits correspond to cases where at least one major transmission element is out of service, but the remaining network is still able to provide the minimum required short-circuit ratio (SCR = 3) at the connection point.
Under N–2 conditions, such as a concurrent outage and scheduled maintenance of another transmission line, the short-circuit power is significantly reduced. As a result, the permissible capacity of the wind farm decreases to approximately 560 MW in the 2027 scenario and 1040 MW in the 2035 scenario. These reductions occur because the lower short-circuit strength during N–2 events would otherwise result in an SCR below the acceptable threshold.
Overall, the results indicate that system strength is the limiting factor for the integration of large offshore wind farms, and the maximum connectable capacity is strongly dependent on the contingency conditions. While the grid in 2035 provides higher short-circuit levels due to planned reinforcements, N–2 situations remain critical and may impose stricter limits on allowable wind farm capacity.
6. Discussion on Power Curtailment Consequences and Mitigation Options
While energy curtailment can be seen as a necessary action taken by the system operator to ensure the balance between supply and demand, it comes with certain implications. It not only causes the loss of potential energy production but also has economic and environmental consequences.
The most evident consequence of curtailment is wasted zero-emission generation that could otherwise have been utilized to meet consumer energy needs. With ongoing sector electrification and growing energy demand, this wasted potential represents a significant social and financial cost. Environmentally, the most consequential curtailment outcome is the increase in CO2 emissions. To compensate for curtailed renewable generation, fast ramping but CO2-intensive power plants, such as combined cycle gas turbine and other thermal power plants, must often be dispatched [48].
The large government efforts to reduce carbon footprint through extensive renewable asset deployment is hindered by under-utilization of RES and the continued reliance on fossil fuel plants to offset the curtailed renewable production. Curtailment of RES also results in additional system integration and dispatch costs. These include lost revenue or compensation required for curtailed RES, as well as the costs of deploying more expensive conventional generators to replace the curtailed output [49]. Moreover, as RES deployment rises (especially in weak grids) the risk of curtailment and of zero or negative wholesale market prices also rise. This in turn lowers the expected utilization and revenue of RES projects and raises investment risk [50]. Consequently, although the overall deployment of RES has been growing rapidly, their large curtailment volumes in weak grids, which have low SCR and sub-optimal utilization, leading to higher green-energy costs, hindering the overall transition towards carbon neutrality.
As RES integration continues to rise globally, the challenges presented above will continue to rise in significance. They can be addressed through various mitigation strategies ranging from increased transmission capacity to smart grid and new technology deployment allowing for system flexibility
Curtailment occurs because of oversupply or insufficient transmission capability. In this study, it was determined that the transmission lines would be overloaded in the 2027 scenario if 1400 MW OWF were installed. This overload could be alleviated by expanding the transfer capacity of existing high-voltage transmission lines or by building new ones (inter-regional and especially cross-border interconnections). These are the most direct and effective strategies to reduce congestions and utilize RES more effectively. However, they come with significant investment costs [51].
It was also found that grid strength, quantified by the SCR, is a critical measure for effective OWF integration and connection to the grid. OWF production in grids with low SCR, may have to be limited to ensure voltage stability, inertia, and fault ride through (FRT) capability. Increasing grid strength typically involves deploying synchronous condensers (SC) which provide short-circuit power, inertia, and reactive power support, thereby improving voltage stability and making the system more resilient against disturbances [52].
Flexibility and energy sector coupling strategies are another way of mitigating RES curtailment by shifting or absorbing surplus energy production. Integrating RES power with other systems and sectors increases its utilization and helps alleviate congested network areas. The most prominent options include
- Energy Storage Systems. Utility scale batteries (such as lithium-ion and flow batteries) and other energy storage technologies enable the storage of excess wind and solar power for later use, thus allowing to shift RES production in time. This smooths production output, reduces curtailment, and lowers associated costs [53].
- Power-to-X (P2X). Converting surplus electricity using technologies, such as Power-to-Hydrogen, Power-to-Ammonia, or Power-to-Liquids, allows the production of hydrogen, ammonia for fertilizer or fuel, and synthetic fuels like methanol or jet fuel, using hydrogen and captured CO2. These technologies can substantially reduce curtailment when operated flexibly (utilizing hours of excess production) and co-located in constrained parts of the network [54].
- Sector Coupling (Electrification of Heat, Electrification of Transport, and Electrification of Industry). RES can drive heat pumps or resistive heating for residential, commercial, or industrial heating and support smart electric vehicle (EV) charging aligned with wind generation output and power industrial processes (such as steelmaking or chemical production) with renewable electricity. Each of these processes create demand during hours of high RES generation, thus reducing surplus energy and the need for curtailment [55].
- Implementing these strategies is system-specific and depends on local conditions, network topology, grid infrastructure, and economic considerations. Combining transmission upgrades, storage, P2X technologies, and demand-side flexibility would provide the most robust solution to mitigate RES curtailment.
When examining the specific case of the Baltic energy system (Lithuania), the topology of the electricity grid and the correlation of offshore and onshore wind and solar power plant generation must be taken into account. In the case of Baltics, the limitation of offshore wind farm generation may result from (a) the overall system balance or (b) the transmission limitations of specific power lines.
Reducing the overall system balance limitations on wind farm generation can be achieved through installation of heat pumps, industrial electrification, development of electric transport, and by reinforcing inter-system connections. However, installing additional large flexible loads (e.g., electrolysis units) or energy storage units in remote areas of the grid may redistribute power flows, which could potentially overload lines located close to the wind farm. While this is beyond the scope of this study, future work should analyze the co-optimization of these units with the grid and evaluate not only their size but also their location within the network.
Mitigating transmission capacity limitations on specific line can be achieved by reinforcing the internal electricity grid, flow control using FACTS devices or the installation of energy storage systems or electrolysis units. The location of these devices should be selected close to the wind farm in question.
7. Conclusions
A methodology was developed to assess the security of a power system with a high penetration of RES, using extrapolated historical hourly data, considering the transmission capacity of the power grid and the short-circuit power of the system.
Having chosen the Baltic power system as the object of study, the main contingencies with the highest performance index and the most sensitive power lines that can be overloaded have been identified. It has been shown that the development of internal power grids, especially in the wind farm connection region, reduces the likelihood of overloads and increases the security of the power system.
When installed RES capacity becomes extremely high, curtailment is required to maintain the generation–load balance. Limiting active power injection from RES consequently restrains the increase in power flows across the transmission network. As a result, the growth of line loading is moderated, as less active power is transferred through the grid. This can be seen as a natural balancing response of the system: by curtailing generation, the network inherently operates at lower flow levels, thereby mitigating the risk of potential overloads.
The study also shows that transmission capacity alone does not determine the feasibility of large OWF integration. System strength, expressed through short-circuit power, remains the dominant limiting factor. Assuming an admissible short-circuit ratio of SCR = 3, the maximum allowable OWF capacity is 1141 MW (2027) and 1582 MW (2035) under N–1 conditions, and 562 MW and 1039 MW under N–2 conditions, respectively. This highlights the need to consider synchronous condensers, grid-forming converters, and inertia-providing technologies in future RES development.
Ensuring sufficient short-circuit strength also requires organizational and operational measures. Planned outages of transmission lines, HVDC links, and synchronous condensers must be carefully coordinated. Outages of elements most critical for SCR should be scheduled during periods of minimal OWF output, as N–1 and especially N–2 conditions cannot be entirely avoided.
Author Contributions
Conceptualization, A.J. and S.G. (Saulius Gudzius); methodology, A.J. and J.V.; formal analysis, S.G. (Saule Gudziute) and A.J.; investigation, S.G. (Saule Gudziute) and A.J.; resources, A.J.; data curation, A.J.; writing—original draft preparation, S.G. (Saule Gudziute), A.J., V.B., I.K. and V.K.; writing—review and editing, S.G. (Saule Gudziute), V.B., V.K. and A.V.; visualization, A.J.; supervision, A.J. and V.K.; project administration, A.J. and S.G. (Saulius Gudzius); funding acquisition, S.G. (Saulius Gudzius). All authors have read and agreed to the published version of the manuscript.
Funding
This research was funded by the “Technology and Physics Science Excellence Center” (TiFEC) No. S-A-UEI-23-1, financed by the Research Council of Lithuania.
Institutional Review Board Statement
Not applicable.
Informed Consent Statement
Not applicable.
Data Availability Statement
Some of the data presented in this study are openly available from the ENTSO-E Transparency Platform and dashboards of transmission system operators. Data of transmission grid parameters were obtained from the national transmission system operator under restricted access conditions and cannot be shared publicly. Only aggregated and processed results derived from these data are presented in this paper.
Conflicts of Interest
The authors declare no conflicts of interest.
Abbreviations
The following abbreviations are used in this manuscript:
| BESS | battery energy storage system |
| CESA | Continental Europe synchronous area |
| FACTS | flexible AC transmission system |
| HVAC | high-voltage alternating-current |
| HVDC | high-voltage direct-current |
| IPS/UPS | integrated power system/unified power system |
| OWF | offshore wind farm |
| OWPP | offshore wind power plant |
| PI | performance index |
| POI | point of interconnection |
| PP | power plant |
| RES | renewable energy sources |
| SCR | short-circuit ratio |
| STATCOM | static synchronous compensator |
References
- European Parliament and the Council. Directive (EU) 2023/2413 of the European Parliament and of the Council of 18 October 2023 amending Directive (EU) 2018/2001 on the promotion of the use of energy from renewable sources. In Official Journal of the European Union; Publications Office of the European Union: Luxembourg, 31 October 2023. [Google Scholar]
- Government of Lithuania. National Energy Independence Strategy of the Republic of Lithuania; Resolution No. XIII-1288; Seimas of the Republic of Lithuania: Vilnius, Lithuania, 2018. [Google Scholar]
- McKenna, R.; Lilliestam, J.; Heinrichs, H.U.; Weinand, J.; Schmidt, J.; Staffell, I.; Hahmann, A.N.; Burgherr, P.; Burdack, A.; Bucha, M.; et al. System impacts of wind energy developments: Key research challenges and opportunities. Joule 2025, 9, 101799. [Google Scholar] [CrossRef]
- Carta, J.A.; Cabrera Santana, P.; González Hernández, J. Wind Power Integration. In Comprehensive Renewable Energy, 2nd ed.; Letcher, T.M., Ed.; Elsevier: Oxford, UK, 2022; Volume 2, pp. 644–720. [Google Scholar] [CrossRef]
- Fernández-Guillamón, A.; Das, K.; Cutululis, N.A.; Molina-García, Á. Offshore Wind Power Integration into Future Power Systems: Overview and Trends. J. Mar. Sci. Eng. 2019, 7, 399. [Google Scholar] [CrossRef]
- Longabart, A.; Tsiatas, G.; Manuel, L. Performance Indicators for Offshore Wind Farms. In Proceedings of the Structures Congress 2011, Las Vegas, NV, USA, 14–16 April 2011. [Google Scholar] [CrossRef]
- Desalegn, B.; Gebeyehu, D.; Tamrat, B.; Tadiwose, T.; Lata, A. Onshore versus Offshore Wind Power Trends and Recent Study Practices in Modeling of Wind Turbines’ Life-Cycle Impact Assessments. Clean. Eng. Technol. 2023, 17, 100691. [Google Scholar] [CrossRef]
- Kurth, R.; Taiarol, P.; Crowther, J.; Stobart, M. 4 Challenges to Overcome When Transmitting Offshore Wind Power. Stantec. 2022. Available online: https://www.stantec.com/en/ideas/topic/energy-resources/4-challenges-to-overcome-when-transmitting-offshore-wind-power (accessed on 5 November 2025).
- Wu, D.; Seo, G.-S.; Xu, L.; Su, C.; Kocewiak, L.; Sun, Y.; Qin, Z. Grid Integration of Offshore Wind Power: Standards, Control, Power Quality and Transmission. IEEE Open J. Power Electron. 2024, 5, 583–604. [Google Scholar] [CrossRef]
- Ali, S.W.; Sadiq, M.; Terriche, Y.; Naqvi, S.A.R.; Hoang, L.Q.N.; Mutarraf, M.U.; Hassan, M.A.; Yang, G.; Su, C.L.; Guerrero, J.M. Offshore Wind Farm-Grid Integration: A Review on Infrastructure, Challenges, and Grid Solutions. IEEE Trans. Ind. Appl. 2021, 9, 102811–102827. [Google Scholar] [CrossRef]
- Mugambi, G.R.; Darii, N.; Khazraj, H.; Saborío-Romano, O.; Raducu, A.G.; Sharma, R.; Cutululis, N.A. Methodologies for offshore wind power plant dynamic stability analysis. Renew. Sustain. Energy Rev. 2025, 216, 115635. [Google Scholar] [CrossRef]
- Hu, R.; Hu, W.; Chen, Z. Review of Power System Stability with High Wind Power Penetration. In Proceedings of the 41st Annual Conference of IEEE Industrial Electronics Society (IECON 2015), Yokohama, Japan, 9–12 November 2015. [Google Scholar] [CrossRef]
- Shair, J.; Li, H.; Hu, J.; Xie, X. Power system stability issues, classifications and research prospects in the context of high-penetration of renewables and power electronics. Renew. Sustain. Energy Rev. 2021, 145, 111111. [Google Scholar] [CrossRef]
- Hatziargyriou, N.; Milanovic, J.; Rahmann, C.; Ajjarapu, V.; Canizares, C.; Erlich, I.; Hill, D.; Hiskens, I.; Kamwa, I.; Pal, B.; et al. Definition and Classification of Power System Stability—Revisited & Extended. IEEE Trans. Power Syst. 2021, 36, 3271–3281. [Google Scholar] [CrossRef]
- Sajadi, A.; Clark, K.; Loparo, K.A. Statistical Steady-State Stability Analysis for Transmission System Planning for Offshore Wind Power Plant Integration. Clean Technol. 2020, 2, 20. [Google Scholar] [CrossRef]
- Dantas, J.P.L.; Tavares, M.F.; Marques, A.J.O.; Bento, M.E.C. Analysis and Control of Voltage Stability in Offshore Wind Systems Under Small Disturbances. Energies 2025, 18, 3050. [Google Scholar] [CrossRef]
- Choi, N.; Kim, B.; Kim, D.; Park, B.; Kim, S.; Lee, B. Grid Connection Studies for Large-Scale Offshore Wind Farms Considering High Penetration of Regional Renewables. Sustainability 2022, 14, 1015. [Google Scholar] [CrossRef]
- Alves, R.; Yang, N.; Xu, L.; Egea-Àlvarez, A. Enabling Power System Restoration from Offshore Wind Power Plants in the UK. Energies 2025, 18, 436. [Google Scholar] [CrossRef]
- Qays, M.O.; Ahmad, I.; Habibi, D.; Aziz, A.; Mahmoud, T. System Strength Shortfall Challenges for Renewable Energy-Based Power Systems: A Review. Renew. Sustain. Energy Rev. 2023, 183, 113447. [Google Scholar] [CrossRef]
- Yu, L.; Sun, H.; Xu, S.; Zhao, B.; Zhang, J. A Critical System Strength Evaluation of a Power System with High Penetration of Renewable Energy Generations. CSEE J. Power Energy Syst. 2022, 8, 710–720. [Google Scholar] [CrossRef]
- Wang, L.; Hsiung, C.-T. Dynamic Stability Improvement of an Integrated Grid-Connected Offshore Wind Farm and Marine-Current Farm Using a STATCOM. IEEE Trans. Power Syst. 2011, 26, 690–698. [Google Scholar] [CrossRef]
- Wang, L.; Wang, K.-H. Dynamic Stability Analysis of a DFIG-Based Offshore Wind Farm Connected to a Power Grid Through an HVDC Link. IEEE Trans. Power Syst. 2011, 26, 1501–1510. [Google Scholar] [CrossRef]
- Sindhura, J.; Sridhar, M. Improve the Dynamic Stability of an Integrated Grid-Connected Offshore Wind Farm and Marine-Current Farm Using FACTS. Int. J. Eng. Res. Technol. 2012, 26, 690–698. [Google Scholar]
- Sharma, P.; Rese, L.; Wang, B.; Vyakaranam, B.; Shah, S. Grid Strength Analysis for Integrating 30 GW of Offshore Wind Generation by 2030 in the U.S. Eastern Interconnection: Preprint; NREL/CP-5D00-87392; National Renewable Energy Laboratory: Golden, CO, USA, 2023. Available online: https://www.nrel.gov/docs/fy24osti/87392.pdf (accessed on 3 December 2025).
- Gevorgian, V.; Shah, S.; Yan, W.; Sharma, P.; Konstantinopoulos, S.; Uppalapati, S.; Del Rosso, A. Development of Advanced Methods for Evaluating Grid Stability Impacts by HVAC- and HVDC-Interconnected Offshore Wind Power Plants. Final Report, NOWRDC Contract #154627. 2024. Available online: https://nationaloffshorewind.org/wp-content/uploads/154627_NOWRDC-Final-Report.pdf (accessed on 3 December 2025).
- Poulose, A.; Kim, S. Transient Stability Analysis and Enhancement Techniques of Renewable-Rich Power Grids. Energies 2023, 16, 2495. [Google Scholar] [CrossRef]
- Sajadi, A.; Kolacinski, R.M.; Clark, K.; Loparo, K.A. Transient Stability Analysis for Offshore Wind Power Plant Integration Planning Studies—Part II: Long Term Faults. IEEE Trans. Ind. Appl. 2018, 55, 193–202. [Google Scholar] [CrossRef]
- Sajadi, A.; Kolacinski, R.M.; Clark, K.; Loparo, K.A. Transient Stability Analysis for Offshore Wind Power Plant Integration Planning Studies—Part I: Short-Term Faults. IEEE Trans. Ind. Appl. 2019, 55, 182–192. [Google Scholar] [CrossRef]
- Pelosi, D.; Ciupageanu, D.A.; Vaccaro, A.; Barelli, L. Impact Analysis of Wind Power Generation on Steady-State and Transient Stability of a National Power System—The Romanian Case Study. Wind Energy Eng. Res. 2025, 3, 1–15. [Google Scholar] [CrossRef]
- Shewarega, F.; Erlich, I.; Rueda, J.L. Impact of Large Offshore Wind Farms on Power System Transient Stability. In Proceedings of the 2009 IEEE/PES Power Systems Conference and Exposition, Seattle, WA, USA, 15–18 March 2009. [Google Scholar] [CrossRef]
- Lu, K.-H.; Rao, Q. Enhancing the Dynamic Stability of Integrated Offshore Wind Farms and Photovoltaic Farms Using STATCOM with Intelligent Damping Controllers. Sustainability 2023, 15, 13962. [Google Scholar] [CrossRef]
- CIGRE. Connection of Wind Farms to Weak AC Networks; Technical Report No. B4.62 (Reference 671); CIGRE: Paris, France, 2016. [Google Scholar]
- Mehdizadeh, M.; Ghazi, R.; Ghayeni, M. Power System Security Assessment with High Wind Penetration Using the Farms Models Based on Their Correlation. IET Renew. Power Gener. 2018, 12, 893–900. [Google Scholar] [CrossRef]
- Hamon, C.; Perninge, M.; Söder, L. An importance sampling technique for probabilistic security assessment in power systems with large amounts of wind power. Electr. Power Syst. Res. 2016, 131, 11–18. [Google Scholar] [CrossRef]
- Kundur, P.; Paserba, J.; Ajjarapu, V.; Andersson, G.; Bose, A.; Canizares, C.; Hatziargyriou, N.; Hill, D.; Stankovic, A.; Taylor, C.; et al. Definition and classification of power system stability (IEEE/CIGRE joint task force on stability terms and definitions). IEEE Trans. Power Syst. 2004, 19, 1387–1401. [Google Scholar] [CrossRef]
- Arabali, A.; Ghofrani, M.; Etezadi-Amoli, M.; Fadali, M.S.; Moeini-Aghtaie, M. A multi-objective transmission expansion planning framework in deregulated power systems with wind generation. IEEE Trans. Power Syst. 2014, 29, 3003–3011. [Google Scholar] [CrossRef]
- Liyanage, C.; Nutkani, I.; Meegahapola, L. A Comparative Analysis of Prominent Virtual Synchronous Generator Strategies Under Different Network Conditions. IEEE Open Access J. Power Energy 2024, 11, 178–195. [Google Scholar] [CrossRef]
- Yu, L.; Zhao, B.; Wang, S.; Su, Z.; Wu, G.; Wang, T. Analysis of Transmission Distance of the MMC-HVDC Connecting Islanded Renewable Energy Generation System. In Proceedings of the 2024 6th Asia Energy and Electrical Engineering Symposium (AEEES), Chengdu, China, 28–31 March 2024; pp. 621–625. [Google Scholar] [CrossRef]
- Yu, L.; Zhao, B.; Xi, G.; Zhang, J.; Cheng, S.; Sun, W.; Ma, J.; Sun, Q. Analysis of the Influence of System Strength on Transient Overvoltage for Power Systems with Renewable Energy Sources. In Proceedings of the 2024 IEEE 3rd International Conference on Electrical Engineering, Big Data and Algorithms (EEBDA), Changchun, China, 27–29 February 2024; pp. 652–656. [Google Scholar] [CrossRef]
- Albukhari, W.M.; Liu, Y.; Till, A.; Alshuaibi, K.M. Frequency Stability Enhancement in a Fully Solar Power Grid: A Case Study on the Saudi Model. In Proceedings of the 2024 IEEE PES ISGT Conference, Washington, DC, USA, 19–22 February 2024. [Google Scholar] [CrossRef]
- Yamada, Y.; Tsusaka, A.; Nanahara, T.; Yukita, K. A Study on Short-Circuit-Ratio for an Inverter-Based Resource with Power-Voltage Curves. IEEE Trans. Power Syst. 2024, 39, 6076–6086. [Google Scholar] [CrossRef]
- Lin, Y.; Wang, B.; Guo, Q.; Zhao, H.; Sun, H. Short-Circuit Ratio and Short-Term Voltage Security Constrained Unit Commitment in High Wind Power-Penetrated Power Systems. IEEE Trans. Power Syst. 2024, 39, 5631–5644. [Google Scholar] [CrossRef]
- Miao, Y.; Zhang, X.; Peng, H.; Wang, L.; Guo, Q. Modeling and Oscillation Mechanism Analysis of Renewable Energy Base Connected into MMC-HVDC. In Proceedings of the 2023 3rd Power System and Green Energy Conference (PSGEC), Shanghai, China, 24–26 August 2023; pp. 203–209. [Google Scholar] [CrossRef]
- Alfaris, F.E. System Strength Evaluation of a Multi-terminal Power Grid Integrated a Distributed PV Generation. In Proceedings of the 2023 6th International Conference on Electrical Engineering and Green Energy (CEEGE), Grimstad, Norway, 6–9 June 2023; pp. 186–191. [Google Scholar] [CrossRef]
- ENTSO-E. ENTSO-E Transmission System Map. Available online: https://www.entsoe.eu/data/map/ (accessed on 21 October 2025).
- Litgrid, A.B. 400–110 kV Transmission Network Development Plan of Lithuanian Electricity System 2024–2033. 2024. Available online: https://www.litgrid.eu/uploads/files/dir747/dir37/dir1/13_0.php (accessed on 21 October 2025).
- Litgrid, A.B. Dashboard. Available online: https://www.litgrid.eu/index.php/dashboard/630 (accessed on 11 October 2025).
- Emblemsvåg, J. Wind energy is not sustainable when balanced by fossil energy. Appl. Energy 2022, 305, 117748. [Google Scholar] [CrossRef]
- Impram, S.; Varbak Nese, S.; Oral, B. Challenges of renewable energy penetration on power system flexibility: A survey. Energy Strategy Rev. 2020, 31, 100539. [Google Scholar] [CrossRef]
- Egli, F. Renewable energy investment risk: An investigation of changes over time and the underlying drivers. Energy Policy 2020, 140, 111428. [Google Scholar] [CrossRef]
- Yasuda, Y.; Bird, L.; Carlini, E.M.; Eriksen, P.B.; Estanqueiro, A.; Flynn, D.; Fraile, D.; Gómez Lázaro, E.; Martín-Martínez, S.; Hayashi, D.; et al. C-E (curtailment—Energy share) map: An objective and quantitative measure to evaluate wind and solar curtailment. Renew. Sustain. Energy Rev. 2022, 160, 112212. [Google Scholar] [CrossRef]
- Mangunkusumo, K.G.H.; Rizqiawan, A.; Sriyono, S.; Munir, B.S.; Pramana, P.A.; Ridwan, M. Enhancing Grid Stability in Renewable Energy Systems Through Synchronous Condensers: A Case Study on Dedieselization and Assessment Criteria Development. Energies 2025, 18, 1410. [Google Scholar] [CrossRef]
- Denholm, P.; Mai, T. Timescales of energy storage needed for reducing renewable energy curtailment. Renew. Energy 2019, 130, 388–399. [Google Scholar] [CrossRef]
- Onodera, H.; Delage, R.; Nakata, T. Systematic effects of flexible power-to-X operation in a solar- and wind-rich energy system. Energy Convers. Manag. X 2023, 17, 100416. [Google Scholar] [CrossRef]
- Kirkerud, J.G.; Nagel, N.O.; Bolkesjø, T.F. The role of demand response in the future renewable northern European energy system. Energy 2021, 235, 121336. [Google Scholar] [CrossRef]
Disclaimer/Publisher’s Note: The statements, opinions and data contained in all publications are solely those of the individual author(s) and contributor(s) and not of MDPI and/or the editor(s). MDPI and/or the editor(s) disclaim responsibility for any injury to people or property resulting from any ideas, methods, instructions or products referred to in the content. |
© 2025 by the authors. Licensee MDPI, Basel, Switzerland. This article is an open access article distributed under the terms and conditions of the Creative Commons Attribution (CC BY) license.