Abstract
Driven by the increasing importance of sustainable development, Environmental Management Accounting (EMA) has become a key focus in modern accounting. However, the factors influencing EMA use and its relationship with Business Process Management (BPM) remain underexplored. This study aims to identify the organizational factors that determine EMA intensity and to empirically examine its correlation with BPM—a relationship that has been theorized but not yet empirically verified. The research is based on a survey of 746 practitioners across 26 countries, conducted in December 2024. Data analysis involved k-means clustering validated by one-way ANOVA with Tukey’s HSD post hoc tests and Spearman’s coefficients. The results show that EMA intensity is highly dependent on organizational context. Four distinct profiles were identified: “Market Leaders,” “Laggards,” “Micros,” and “Average.” Additionally, high EMA intensity (mean = 3.25) strictly correlates with larger company size, greater technological sophistication, and decentralized decision-making, as seen in the “Market Leaders” group. Conversely, “Micros” and “Laggards” demonstrated significantly lower adoption levels (means of 2.15 and 1.37, respectively), suggesting that resource availability and technology are prerequisites for advanced EMA. Notably, no link was found between EMA intensity and environmental uncertainty. Importantly, the study provides new empirical evidence of a significant positive relationship between EMA and BPM intensities. These findings indicate that standardized reporting regulations (e.g., EU CSRD) may disproportionately burden smaller, less technologically advanced organizations. Therefore, policymakers should combine environmental mandates with support for digitalization, especially in developing economies where organizational maturity often necessitates capacity-building initiatives.
1. Introduction
Advances in accounting theory and practice increasingly better reflect real processes within the accounting system, especially in external reporting. As a result, non-financial reporting, including environmental reporting, has become a key part of modern accounting. This requires companies to measure and disclose emissions, resource use, waste, water, pollution, and effects on biodiversity; recognize costs and capital expenses related to environmental protection; report on the compliance of operations and investments with the European Union (EU) taxonomy; and present data both quantitatively and qualitatively, following a consistent methodology. Within the EU, there is a unified, detailed, and mandatory system for disclosing Environmental, Social, and Governance (ESG) data, primarily based on the following regulations:
- -
- The Corporate Sustainability Reporting Directive (CSRD) [1], which introduced mandatory reporting in accordance with the European Sustainability Reporting Standards (ESRS), requires reporting under the dual materiality principle (financial materiality and impact materiality), mandates attestation of reports, and calls for digital data disclosure (XHTML format, ESEF tagging). It is currently the most important regulatory act concerning non-financial reporting in the EU.
- -
- ESRS—European Sustainability Reporting Standards (effective from 2024) are directly connected to environmental accounting. These standards specify detailed indicators, measurement principles, narratives, and both quantitative and qualitative disclosures.
- -
- The EU Taxonomy Regulation [2] classifies an economic activity as “environmentally sustainable” if it: contributes significantly to one of six environmental goals, does not cause significant harm to other objectives (DNSH principle—do no significant harm), meets minimum protective guarantees, and satisfies technical qualification criteria.
According to the regulations outlined earlier, environmental accounting provides information on environmental events, including greenhouse gas emissions, resource use, environmental costs, and investments in low-emission technologies. Disclosing this information serves a dual purpose. For stakeholders, it is predictive because it allows the assessment of transformational threats and opportunities, the sustainability of business models, and future cash flows. A connection exists between environmental accounting and management processes (EMA). For companies, this information also legitimizes their operations over the long term.
The goal of this paper is twofold. First, we examine the factors that predict the level of environmental disclosures. Second, we aim to explore the relationship between the patterns of intensity used in environmental management accounting and process management. The literature review, conducted using the keywords “environmental management accounting” and “factors” across the Scopus database, clearly highlights the research gap, showing a lack of quantitative empirical evidence.
This study uses a quantitative research approach. Data collection was performed through an online questionnaire survey, with invitations sent via email to individuals responsible for management accounting. A total of 746 valid responses were obtained from companies across 26 countries. The data analysis included descriptive statistics and k-means clustering to identify company profiles based on various contextual variables. The uniqueness of the clusters was verified using one-way ANOVA and Tukey’s HSD post hoc tests. Additionally, Spearman’s coefficients were employed to assess relationships between variables. All calculations were conducted using Python 3.10.11.
The rest of this paper is organized as follows: Section 2 provides a review of relevant literature and outlines our research hypotheses. Section 3 describes the research design, including the sample, data collection methods, and variable measurement. Section 4 presents the findings, while Section 5 discusses them. Finally, Section 6 offers the main conclusions along with the theoretical and practical implications of this research, its limitations, and suggestions for future studies.
2. Theoretical Framework and Hypotheses Development
2.1. Legitimacy Theory in Establishing the Concept of Environmental Management Accounting
The importance of providing information about a company’s impact on society and its surroundings, especially on the environment, is highlighted by theories of legitimacy, among others. This theory is one of the “mainstream” approaches for researchers in social and environmental accounting [3,4]. The legitimacy theory posits that companies require societal acceptance to validate the legitimacy of their actions, ensuring that their activities align with social norms and values. Therefore, companies strive to legitimize their activities in society. It is also possible to observe a positive public influence on processes within the enterprise, as posited by the legitimacy theory. This is because companies must introduce and report on processes that are accepted by society, and, as a result, gain legitimacy for their activities. The introduction of reported activities, especially in management, is also beneficial for the company.
Many studies confirm the impact of social pressure on a company from the perspective of legitimacy theory. Bitektine and Haack [5] examined the influence of the community on introducing changes in the company’s activities, specifically through the granting of legitimacy [6]. The study by Moll and Hoque [7] described the phenomenon of passive, often unconscious, submission of management staff to irrational (ineffective) social expectations that influence the company. In particular, legitimacy affects the performance of management accounting systems. In their research, Moll and Hoque [7] found a substantial impact of legitimacy-related social mechanisms on the selection and use of a new financial planning and control system at one Australian university. Although the introduced system reduced process efficiency, it was left in place because the company’s primary objective was to meet social expectations regarding the proper allocation and use of the funds it received, and this system ensured that. Similarly, Łada [6] examined the change in method for calculating study fees at one of the state universities. It proved that the change was motivated by meeting the environment’s expectations and that the fees set and collected for studies perfectly covered education costs. One reason for this action may have been the fear of being “debunked” and losing legitimacy. Patten’s [8] study examined the impact of the threat of legitimacy loss on environmental reporting following the 1989 Exxon Valdez disaster. The study found an increase in environmental disclosures in companies’ annual reports across the petrochemical sector.
On the other hand, according to the legitimacy theory, companies can actively shape the social reception of reported information and, therefore, the social reception of their business. Companies can take proactive management measures to enhance the legitimacy of their activities. This is the so-called legitimacy management, related to impression management. Studies show that social and environmental reporting is strategic because companies generate these disclosures for survival and profitability, not out of a sense of responsibility and accountability [9]. Deegan, Ranki, and Voght [10] also concluded that managers treat voluntary disclosures as a tool for mitigating adverse image effects, thereby treating them as a strategic tool.
Some studies take legitimacy theory into account, demonstrating that managers’ specific strategies for disclosing information can legitimize certain institutions or social structures. This may result in some members of society gaining benefits at the expense (to the detriment) of other members of society [9].
In 2002, O’Dwyer was among the first to address the issue of where social and environmental information should be disclosed [9]. He argued that the annual report was not the best place for it. Over time, these demands were taken up, and various recommendations on non-financial reporting and, ultimately, ESG reporting guidelines were introduced.
Other researchers, such as Tilt [11], studied social disclosure in developed and developing countries. It was found that informing may be related to other factors, such as regulatory, cultural, or cognitive [9]. Deegan, for example, argued that there are cultural or normative reasons why managers do not adopt certain strategic behaviors, regardless of the consequences for the company’s legitimacy, success, or self-interest [9]. Research by De Villiers and Marques [12] found that in more democratic countries, the likelihood of disclosing social information is higher.
The literature also contains radical research conclusions, suggesting that the ongoing increase in disclosures is a response to the legitimacy crisis, most often linked to poor environmental protection [13]. The theory of legitimacy also explains the following phenomenon: the increased intensity of measures aimed at improving legitimacy clearly indicates its loss [6].
Legitimacy theory, therefore, serves as a strong predictor of increased pressure for environmental disclosures. In many cases, this so-called legitimacy is the reason for the increased generation, disclosure, and management of environmental information. Conversely, endogenous factors within a company, such as internal conditions stemming from its structure, resources, decision-making processes, and organizational culture, can also predict increased environmental disclosures. The accounting and non-financial reporting literature emphasizes that internal factors often have a greater influence on the scope and quality of disclosures than external pressures. Endogenous company characteristics can be a significant predictor of the extent and quality of environmental disclosures because they determine both the company’s ability to produce credible information and its motivation to communicate it.
In this study, we investigated the influence of various factors, including company size, decision-making decentralization, managers’ and employees’ participation in strategy development and execution, and technological progress, on EMA. The following research hypothesis was adopted:
Hypothesis H1: It is assumed that the intensity of EMA is positively associated with factors such as company size, decision-making decentralization, and the participation of managers and employees in strategy formulation and implementation, as well as technological advancements.
The study assumed that endogenous company factors primarily explain differences in EMA intensity, indicating that their development is not only a response to regulatory pressures but also the result of internal organizational maturity and a strategic approach to managing non-financial information.
2.2. Business Process Management and Its Integration with Environmental Management Accounting
Considering the needs of broadly defined customers has gained particular popularity in recent years, not only by adapting external reporting to their needs and legitimizing operations through environmental disclosures but also by implementing suitable corporate governance. Organizational theory researchers have long argued that how companies interact with their environments is vital to their performance [14]. Company management plays a crucial role in efforts to achieve sustainable development. Sustainable corporate management involves enhancing the efficiency of ongoing processes to ensure that society’s needs are met without compromising future generations’ ability to meet their own needs. For example, this includes producing safe products that do not pose a threat to human health. Therefore, processes and systems that reduce environmental pollution, conserve energy and raw materials, and are economically sustainable are implemented.
In the 20th century, the concept of a process approach to company management emerged through the works of management pioneer Frederic Taylor [15]. Business Process Management (BPM) is one of many Strategic Management Accounting (SMA) tools that support the implementation, execution, and analysis of business processes (BPM stages include process identification, process modeling, process analysis, process design, implementation, and process monitoring). BPM, therefore, refers to specific information processes aimed at process improvement. BPM adopts a holistic approach to management, aligning all aspects of management with customer needs. It assumes continuous improvement of ongoing processes and ongoing refinement of management processes. Enhancing a company’s operational efficiency and performance is also vital, primarily through integration with business intelligence technology.
Generally, company benefits from implementing BMP include, among others [16]:
- -
- Reducing workload through automation;
- -
- Increasing company flexibility thanks to this technology and simplifying the management of business process logic;
- -
- Enhancing transparency of execution, due to the critical role of information provided about the actual implementation of processes in operational and historical contexts;
- -
- BPM ensures that the process is performed exactly as intended and in compliance with the established rules.
The literature on the subject acknowledges the concept of Green BPM, which merges sustainable development with BPM. Green BPM is primarily linked to two objectives: reducing a company’s negative environmental impact and fostering cultural changes that encourage environmentally supportive behaviors [17,18]. Green BPM is defined as BPM that produces positive business outcomes with minimal harm to the natural environment and without jeopardizing the availability of these environmental resources for future generations [19].
The authors of the study believe that a key area of BPM integration is connecting with the EMA system. Both BPM and EMA focus on measuring, improving, and controlling processes, though from different angles. BPM provides an organizational and technical framework for managing processes by breaking down activities into manageable parts. To fully identify environmental information, it must be situated within a detailed process structure. The EMA, for example, requires identifying pollution sources, activities that incur environmental costs, material flows, and other relevant factors. Through activity breakdowns, BPM also enables the precise location of EMA components, not just across the organization, but within specific processes. This also enables management of these EMA elements. Additionally, EMA data helps identify the processes with the greatest environmental impact, inefficient activities, waste costs, and potential savings from environmentally efficient process redesign.
This study aims to examine the correlation between the company’s BPM implementation and the level of EMA intensity. The following research hypothesis was adopted:
Hypothesis H2. There is a positive relationship between the intensity of BPM and the intensity of EMA.
Enhanced business process management can significantly drive EMA development, as greater process maturity within an organization boosts both the demand for detailed environmental information and the capacity to produce it. BPM fosters a deeper understanding of resource flows and provides a foundation for implementing environmental accounting tools.
Furthermore, BPM reinforces a culture of continuous process improvement and transparency within the organization, encouraging the integration of an environmental perspective into daily operations. High process maturity enhances managers’ awareness of environmental costs and fosters eco-efficient processes. Additionally, intensive process management allows for more detailed and reliable measurement of environmental impacts.
Therefore, it can be argued that organizations with a higher level of BPM maturity develop more advanced EMA practices, as evidenced by greater volume of EMA information, greater detail, and better integration of this data into management processes.
3. Materials and Methods
The survey questionnaire was developed following a comprehensive literature review. The study sample included company owners, business executive officers (such as CEOs and CFOs), managers, finance and accounting directors, specialists in accounting and finance, and other professionals engaged in strategic decision-making processes, including financial analysis and impact assessment. In December 2024, participants were recruited via a survey distributed to 18,035 companies. All participants were informed that participation was voluntary, anonymous, and confidential, and that their responses would be protected accordingly. A total of 746 responses were collected, resulting in a response rate of 4.13%. The respondents demonstrate a considerable degree of professional responsibility, with most occupying strategic or executive positions. Specifically, the sample comprises specialists engaged in strategic decision-making (23.59%), business owners (22.52%), senior executives such as CEOs and CFOs (21.31%), and finance or accounting managers (19.17%). This distribution guarantees that the data accurately represents the viewpoints of key organizational stakeholders.
Contingency theory is applied in managerial accounting to explain how contingent factors, such as technology, culture, and the external environment, influence the design and functioning of organizations [20,21]. In accordance with this framework, the sample was characterized using a comprehensive set of contextual variables, encompassing structural attributes (company size, age, quality of structure), internal dynamics (decentralization, participation, trust, organizational culture), strategic orientation (strategic clarity, adaptability, sustainability), and environmental contingencies (uncertainty, competitive pressure, technological sophistication). The contextual variables were operationalized using a 5-point Likert scale, where 1 represents the lowest intensity and 5 the highest.
The companies in the sample conducted operational activities in multiple countries. Figure 1 presents the distribution of these companies across the sampled countries.
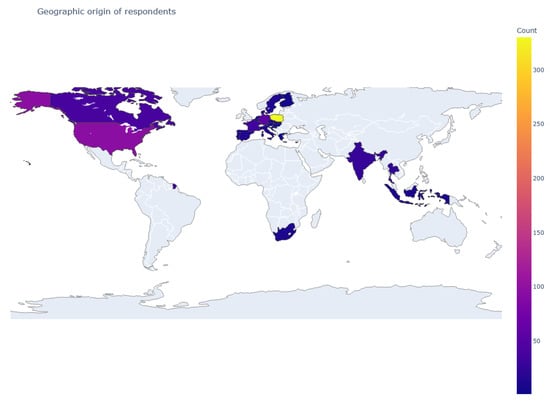
Figure 1.
Geographic origin of respondents.
Geographically, the sample is predominantly European, with a significant portion coming from Poland (44.24%) and other European Union countries, including Germany, France, and Spain. North America is also well-represented, with the U.S. and Canada collectively accounting for 17.96% of the sample. Additionally, the study includes participants from Asian markets, including India (3.62%) and Thailand (3.22%), as well as representation from South Africa (1.47%).
The companies in the sample operated across various sectors. Figure 2 illustrates the distribution of these companies among the 11 Global Industry Classification Standard (GICS) sectors.
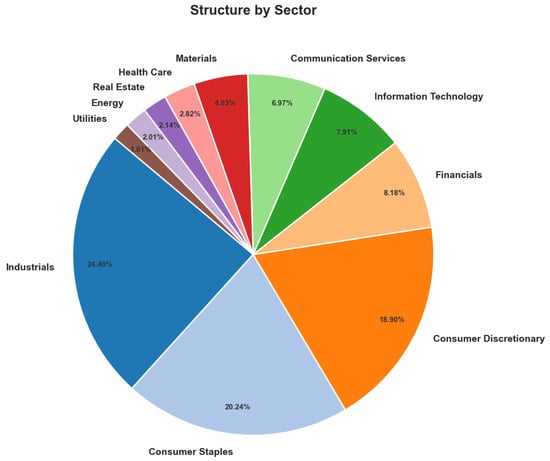
Figure 2.
Distribution of the sample members by sectors.
The study sample includes organizations from all eleven GICS sectors, ensuring a broad representation of the economy. The Industrials sector is the most heavily represented, mainly due to companies in Commercial and Professional Services (12.60%, N = 94) and Transportation (10.72%, N = 80). The Consumer Staples sector also makes up a significant part of the sample, largely due to high participation from firms in the Food, Beverage & Tobacco Retail sector (10.99%, N = 82). Additionally, the Consumer Discretionary sector is well-represented, with Automobiles & Components (6.57%, N = 49) and Consumer Services (6.30%, N = 47) being key contributors. The Information Technology and Financial sectors have moderate representation, while Real Estate, Energy, and Utilities account for smaller but distinct segments of the sample.
Regarding potential biases, the geographic spread appears to have a focus on European countries. This reflects the advanced regulatory environment in the EU (CSRD directive), which requires stricter environmental reporting and promotes the use of EMA practices. Likewise, the sectoral bias toward Industrials and Consumer Staples is common in sustainability research, as these industries face greater environmental scrutiny and have more developed data reporting systems compared to service-based sectors.
The intensity of EMA usage was evaluated using a five-level Likert scale, as shown in Figure 3. Results indicate that 78.55% of surveyed enterprises have adopted EMA, but only 32.30% use it at a high intensity level or above.
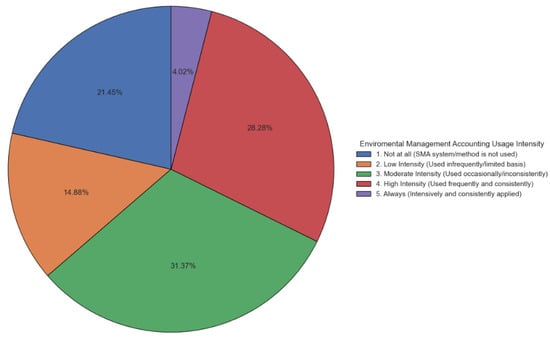
Figure 3.
The intensity of EMA usage.
The data analysis for this study involved four distinct steps. First, descriptive statistics and correlations among measurement variables were calculated. Second, k-means clustering analysis was performed to classify companies based on patterns in their contextual variables. K-means clustering was chosen because it is recognized as a powerful and widely used data mining algorithm within the research community [22]. This method is commonly applied to uncover the underlying structure of data distributions and to establish grouping rules for data with similar characteristics [22]. Additionally, k-means clustering is often used for classifying Likert scale data, as demonstrated in previous studies, such as [23]. Third, to validate the distinctiveness of the identified profiles, a one-way Analysis of Variance (ANOVA) was conducted across all characterized variables. Post hoc analysis using Tukey’s HSD was then performed to identify specific differences between clusters. Finally, Spearman’s correlation coefficient was used to assess the strength of relationships between paired data, since the variables were measured on an ordinal Likert scale. All analyses were performed using Python and its associated libraries.
4. Results
Table 1 shows the descriptive statistics among the contextual variables. It summarizes the values of mean and standard deviation as well as the quartiles.

Table 1.
Distribution of the sample members.
The significant variation in company size (S) and age (AG) confirms that this sample is drawn from a demographically diverse range of firms. Organizational Culture (OC) showed the highest average score (mean = 3.84, median = 4.00), with the third quartile reaching the maximum value of 5.00. This indicates a sample primarily composed of organizations with strong, well-defined cultures. Likewise, Trust and Open Communication (LS) (mean = 3.69) and Strategic Clarity (BG) (mean = 3.68) suggest that the sampled organizations operate in high-trust environments where strategic goals are clearly communicated. Conversely, structural variables related to hierarchy received the lowest ratings. Decision-making decentralization (OS) (mean = 2.79) and participation in strategy (PE) (mean = 2.89) were the only variables with mean scores below the midpoint of 3.00. This difference implies that, although these organizations foster a culture of trust and openness, their structures remain largely centralized, with limited strategic input from lower-level management or staff. Additionally, the sample shows the most consistency in measures such as Quality of Organizational Structure (SQ) (standard deviation = 0.82) and Competitive Pressure (CP) (standard deviation = 0.83). The clustering of responses around the mean for CP suggests that most firms face similar, moderate to high market pressures.
Subsequently, a k-means clustering algorithm was used to assign each company in the sample to a group with similar contextual patterns. This unsupervised learning method partitions a dataset into a set number of clusters based on the centroid, without requiring labeled data.
The optimal number of clusters (k) was determined using the Elbow method, as implemented in the Yellowbrick library [24] (Figure 4a). Four distinct profiles were identified within the sample. However, the final choice of k = 4 was based not only on statistical metrics but also on the interpretability and theoretical uniqueness of the profiles. We tested solutions for k = 3, 4, and 5 and found that the four-cluster solution provided the clearest differentiation between companies without fragmenting the sample excessively. Figure 4b shows the sizes of each cluster.
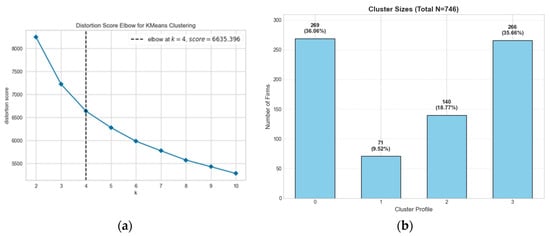
Figure 4.
(a) Determination of the optimal number of clusters using the Elbow Method. The plot indicates an inflection point (“elbow”) at k = 4, suggesting that four is the optimal number of clusters for classifying the organizational profiles; (b) Distribution of companies across the identified clusters (N = 746).
The average values of variables within clusters were displayed as a heatmap (Figure 5).
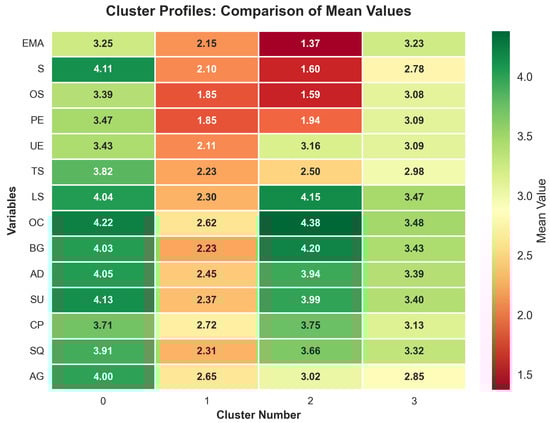
Figure 5.
Cluster Profiles: comparison of mean values.
The identified clusters demonstrate considerable heterogeneity in terms of size, organizational culture, and the application of EMA.
Cluster 0 (N = 269) represents the most mature and high-performing segment of the sample, referred to as “Market Leaders”. This cluster is distinguished by the largest average company size (S = 4.11), high technological sophistication (TS = 3.82), and formal EMA usage (EMA = 3.25). Additionally, these organizations demonstrate strong organizational culture (OC = 4.22), high levels of trust (LS = 4.04), and well-defined strategic goals (BG = 4.03). Decision-making within this cluster is relatively decentralized (OS = 3.39). This suggests that large organizations utilize their resource availability to implement formal EMA tools while maintaining a flexible, decentralized structure that fosters innovation.
Cluster 1 comprises Small and Medium-sized Enterprises (SMEs) (S = 2.10) and includes 71 firms. Companies in this cluster record the lowest scores across nearly all dimensions and can be described as “Laggards”. Decision-making is highly centralized (OS = 1.85), and employee participation is limited (PE = 1.85), indicating a traditional and autocratic management model. These companies also report low scores for organizational culture (OC = 2.62), trust (LS = 2.30), and adaptability (AD = 2.45). EMA usage is minimal (EMA = 2.15). The combination of centralization and low trust likely acts as a barrier to adopting advanced management practices, confirming that without cultural readiness, formal environmental accounting is difficult to implement.
Cluster 2 comprises 140 members, primarily Micro-Enterprises (S = 1.60), herein referred to as the “Micros”. These entities exhibit the lowest utilization of EMA among all clusters, with an average score of 1.37. Nevertheless, they are characterized by the highest organizational culture (OC = 4.38), well-defined and effectively communicated strategic objectives (BG = 4.20), and elevated levels of trust and transparent communication (LS = 4.15). These values may serve as a substitute for formal EMA tools; however, this phenomenon appears to be confined to Micro-Enterprises. This presents an intriguing paradox: although resource limitations likely impede the implementation of formal EMA tools, the elevated levels of trust and organizational culture imply that these firms address environmental responsibility through informal social mechanisms rather than through formal bureaucratic controls.
Finally, Cluster 3 (N = 266) includes mid-sized companies (S = 2.78) with average metrics ranging from 2.78 to 3.48, labeled as “Average.” This cluster shows relatively high EMA usage (EMA = 3.23), similar to that of the “Market Leaders” in Cluster 0 (EMA = 3.25). This similarity suggests that mid-sized companies are actively copying the environmental practices of “Market Leaders”, likely to gain a competitive edge or meet supply chain demands, even though they have fewer resources than the largest firms.
Our findings are illustrated in Figure 6, shown as an MCA Perceptual Map that displays the spatial differentiation of the four organizational profiles. The first two dimensions explain 100% of the total variance within the analyzed subspace (Dimension 1: 56.46%; Dimension 2: 43.54%). Therefore, this projection provides a highly accurate representation of the actual differences among the companies. Dimension 1 (Horizontal) mainly distinguishes organizations based on size and formalization (“Market Leaders” vs. “Laggards”). In contrast, Dimension 2 (Vertical) highlights the contrast between culture-driven agility (Cluster 2, top) and procedural compliance (Cluster 3, bottom).
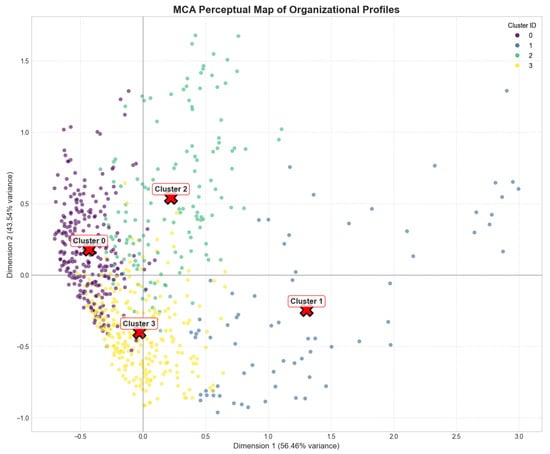
Figure 6.
MCA Perceptual Map.
Figure 7 illustrates the distribution of different sectors across various clusters. This confirms that organizational profiles vary across industries. Specifically, 54.24% of companies in the Information Technology sector fall into Cluster 0. Sectors like Consumer Staples, Real Estate, and Materials also have a significant presence in this cluster. This suggests that high-tech industries tend to prefer the decentralized, high-culture model typical of Cluster 0. In contrast, regulated service sectors—including Finance, Healthcare, Utilities, Industrials, and Communication Services—mainly belong to Cluster 3, indicating a management style focused on compliance rather than culture. Heavy industries such as Energy and Materials are mostly found in Cluster 1, highlighting sectoral challenges to modernization. The large share of firms in the ‘Industrials’ category within Cluster 2 (30.22%) likely includes small manufacturing businesses or specialized engineering firms. These organizations usually operate on a small scale, need minimal management systems, but rely heavily on skilled craftsmanship and cohesive teams.
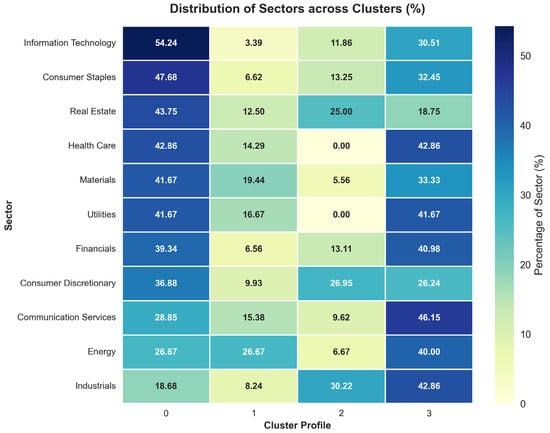
Figure 7.
Distribution of Sectors across Clusters.
To verify Hypothesis H1, which proposes that factors like company size, decentralization in decision-making, participation of managers and employees in strategy formulation and implementation, and technological progress positively influence EMA intensity, we examined the characteristics of the identified clusters. A one-way Analysis of Variance (ANOVA) was performed on all measured variables to confirm the distinctiveness of the four profiles. The results show that the clustering solution is reliable. All variables tested revealed statistically significant differences between groups (p < 0.001), suggesting that the clusters represent different organizational profiles rather than random groupings (Table 2). Specifically, Cluster 0 (“Market Leaders”), which has the highest EMA intensity (mean = 3.25), also shows the highest scores for Company Size (S = 4.11), Technological Sophistication (TS = 3.82), and Decision-making Decentralization (OS = 3.39). Conversely, Cluster 1 (“Laggards”) and Cluster 2 (“Micros”), with the lowest EMA usage (2.15 and 1.37, respectively), have significantly lower scores on these organizational factors. This clear separation suggests that high levels of technological development, size, and decentralized management are strongly associated with high EMA adoption. Therefore, based on the significant group differences (F-statistics, p < 0.001), Hypothesis H1 is supported.
Table 2.
The results of ANOVA.
Company size (S) (F = 303.72) and decision-making decentralization (OS) (F = 184.03) were the most influential variables in forming clusters, followed by the use of Environmental Management Accounting (EMA) (F = 164.41). Trust and open communication (LS) (F = 147.73) and Goal Clarity (BG) (F = 147.53) also significantly contribute to segmentation. Although still statistically significant, variables related to the external environment, such as environmental uncertainty (UE) (F = 45.97) and competitive pressure (CP) (F = 55.63), had lower F-values. This indicates that while the clusters perceive their environments differently, internal structural and strategic factors—such as size, culture, and EMA adoption—are more prominent in differentiating the profiles.
To identify specific differences between clusters, a post hoc analysis was performed using Tukey’s Honestly Significant Difference (HSD) test. The pairwise comparisons showed several significant differences. For EMA usage, there was a statistically significant difference between Cluster 0 and Cluster 2, with Cluster 2 scoring notably lower (mean_diff = −1.87; p < 0.001). The analysis found no significant difference in EMA usage between Cluster 0 and Cluster 3, suggesting that moderate-to-high EMA adoption is common across different organization types. Regarding Organizational Culture (OC), although Cluster 0 and Cluster 2 differ significantly in size (S) and EMA usage, the Tukey test indicated no significant difference between them in OC or Strategic Goal Clarity (BG). This suggests that both large corporations (Cluster 0) and micro-enterprises (Cluster 2) attain similarly high levels of cultural cohesion, likely through different means. Cluster 1 scored significantly lower than all other groups across nearly all dimensions (p < 0.001), confirming its status as a distinct group of underperforming SMEs.
Spearman’s rank correlation analysis showed a statistically significant, moderate-to-strong positive relationship (rs = 0.511, p < 0.001) between the intensity of BPM and EMA, considering the ordinal nature of the 5-point Likert scale data. This suggests that organizations with more advanced process management are significantly more likely to utilize environmental cost accounting systems to support their sustainability efforts. Therefore, based on the significant positive correlation coefficient (rs = 0.511), Hypothesis H2 is fully supported. This confirms that the maturity of BPM is a key factor for the successful implementation of EMA. Additionally, a weak positive relationship was observed between EMA usage intensity and financial results evaluation (rs = 0.208, p < 0.001).
5. Discussion
The objective of the paper was to analyze the factors of EMA. Although the sample shows a geographical concentration in European countries, mainly Poland, and a sectoral skew toward industrial services, it maintains a high level of representativeness in terms of organizational diversity. The sample effectively captures the structural dichotomy of the economy by including a balanced mix of large incumbents (“Market Leaders”) and the SME sector (“Micros” and “Laggards”). This structure enables the identification of patterns specific to both resource-rich organizations and resource-constrained entities. While the results are most relevant to economies operating under EU-style regulatory frameworks, the inclusion of global sectors (GICS) allows for broader generalizations regarding the relationship between organizational culture and management accounting.
The results have shown that applying EMA may depend on many factors, among which the most important were the company’s size, decision-making decentralization, managers’ and employees’ participation in strategy formulation and implementation, and technological advancement. The study found that companies that use EMA more extensively tend to be larger, have more decentralized decision-making processes, and exhibit greater participation by managers and employees in strategy development and implementation. These companies also demonstrate higher levels of technological advancement. No link was identified between EMA intensity and factors such as increased environmental uncertainty.
The debate over EMA factors is extensive and widespread; researchers report different results, leading them to consider various factors necessary and increasing the use of environmental management accounting. For example, Giang et al. [25] conducted research that indicated factors influencing the development of environmental accounting for sustainable development. These factors include managers’ perceptions of costs and benefits, environmental changes, the characteristics of the scale of production and business activities of enterprises, and pressures to disclose sustainable environmental information and reporting [25]. The purpose of the article by Chaudhry and Amir was to assess the impact of institutional pressures (coercive, mimetic, and normative) on a company’s environmental performance, as well as the mediating role of environmental management accounting in this relationship and the moderating effect of environmental proactivity [26]. The research results showed that coercive, mimetic, and normative pressures are significant drivers of environmental performance. It is further found that coercive, mimetic, and normative pressures significantly enhance the implementation of environmental management accounting [26]. The research by Ntalamia aimed to determine whether a company’s financial status affects the adoption of EMA practices among manufacturing companies in Kenya. Regression results showed that financial status and the adoption of EMA practices are positively and significantly correlated [27]. Christ and Burritt’s research aimed to expand on this knowledge by examining whether organizational context could better explain the use of EMA by Australian organizations [28]. A connection was found with environmental strategy, organizational size, and environmentally sensitive industries [28]. A study by Gunarathne et al. found that the implementation of EMA varies significantly across organizations at different stages of environmental management maturity [29]. Further, it was observed that organizations at higher stages of environmental management maturity use significantly more domain-based EMA tools and environmental management accounting for functional purposes [29]. Research by Huynh and Nguyen demonstrated that increased environmental unpredictability, heightened market competition, larger organizational size, and more effective corporate governance tend to promote the use of EMA, thereby improving environmental performance [30]. The findings of Szewieczek et al. confirm that there is a positive correlation between the detail of disclosures about the business model (as part of non-financial reporting) and selected economic parameters of an enterprise (the strongest with total assets, board, and EBIT) [31]. Thus, it becomes possible to recognize that large enterprises with a strong and stable asset structure follow specific, more detailed reporting patterns aimed at the sustainable development of reporting.
Elhossade et al. conducted research in Libya [32]. Data were collected from a sample of medium- and large-sized manufacturing companies. Institutional pressure and contingency factors were analyzed in relation to the level of EMA adoption using multiple regression analysis and moderator multiple regression. Their findings suggest that the relationship between coercive pressures and EMA adoption differs depending on the size of the company [32]. Our results, which indicate that firm-specific characteristics, particularly firm size, may influence the adoption of EMA, also align with the findings of Barani et al. [33].
In summary, many authors confirm the link between EMA intensity and company size. The previously cited authors include Christ and Burritt [28], Szewieczek et al. [31], Elhossade [32], and Huynh and Nquyen [30]. The research conducted for this article also supports this connection. Since non-financial reporting requirements mainly apply to large companies and those that are not micro-enterprises but are listed on a regulated EU market, it can be inferred that these regulatory requirements have affected the level of EMA. Similarly, Chaudhry and Amir [26] argue that coercive pressures are significant factors influencing environmental outcomes. The research also confirms the relationship between EMA intensity and decision-making decentralization, as well as participation by managers and employees in strategy formulation and implementation, along with technologically advanced operational activities. No similar empirical research results were found in the existing literature.
Sari et al. demonstrated that implementing EMA has a positive impact on organizational performance [34]. This connection is supported by the introduction of process innovations, which lead to enhanced organizational results. In the current study, the authors examined the EMA factor and satisfaction with the results achieved and found weak, positive, significant correlations. Similarly, Huynh and Nguyen found that environmental uncertainty affects EMA, whereas our research did not confirm this link [30]. Likewise, research by Angelin et al. [35] has demonstrated that organizational culture has a significant influence on sustainability reporting. However, our research did not confirm this finding.
The study attempted to examine the impact of EMA factors on the intensity of EMA, including: an environment of trust and open communication, the organization’s strategic goals being clearly defined and communicated, adapting to change, long-term sustainability and growth, competitive pressure, quality of the organizational structure, and age in operation. However, positive results were not obtained. No empirically confirmed relationships were found in the literature.
The cited studies demonstrate that EMA factors are a crucial topic for discussion. These studies, along with those by other Authors, cite different EMA factors. The Authors’ research adds to the debate on EMA factors.
Regarding the correlation between EMA intensity and BPM intensity, no similar empirical studies have been identified in the literature. However, many authors have theoretically proposed that disclosing non-financial information provides essential data for management [36] and that a theoretical connection exists between Green BMP and ESG reporting [37].
6. Conclusions
There is no doubt that many studies have been conducted on sustainable accounting; however, the issue of EMA for BPM has not been thoroughly explored. This research is highly important because it identifies the factors that influence the use of EMA in BPM.
EMA and BPM form a complementary system within the company, functioning not only as an information system but also as a management system. By offering insights into the environmental impact of activities and supporting BPM, EMA becomes a tool for integrated process management. In this complementary system, BPM serves as both a process framework and a process improvement tool, enabling the accurate measurement of information, precise assignment to processes and products, and support for operational optimization and strategic decision-making.
In light of the above, it is essential to note that EMA is not just a reporting tool for a company. By integrating it with management processes, such as BPM, it becomes an integral part of the decision-making system, supporting the efficiency of capital allocation and the development of a competitive advantage alongside this system.
These research findings contribute to both the literature and practice in several ways. For academia, the study broadens the understanding of the factors that influence the intensity of EMA and the relationship between EMA and BPM. From a practical management perspective, the results indicate that EMA requires a supportive structure and advanced process capabilities. For policymakers and regulators, especially in the context of the EU’s expanding reporting mandates (CSRD), the findings suggest that standardized requirements may place a disproportionate burden on smaller, less technologically advanced entities—the “Micros”. Therefore, effective policy should combine environmental mandates with targeted support for digitalization and process improvements. Similarly, for developing economies, especially within the “Laggards” profile, incentives should focus on capacity building and technology transfer to foster the organizational maturity needed for effective environmental management.
Building on the finding that institutional strength and isomorphic pressures vary significantly by context [38], future research will include a comparative analysis of developed and developing countries. This will enable a deeper investigation of how specific institutional voids in developing economies hinder the adoption of EMA compared to their developed counterparts.
However, it is essential to note that the research relies on self-reported data, which may be susceptible to biases or inaccuracies. Another limitation is that this study focused solely on respondents from 26 countries. In some of these countries, survey response rates are low.
Author Contributions
Conceptualization, B.D.-K. and A.M.K.; methodology, B.D.-K. and A.M.K.; software, B.D.-K. and A.M.K.; validation, B.D.-K. and A.M.K.; formal analysis, B.D.-K. and A.M.K., investigation, B.D.-K. and A.M.K.; resources, B.D.-K. and A.M.K.; data curation, B.D.-K. and A.M.K.; writing—original draft preparation, B.D.-K. and A.M.K.; writing—review and editing, B.D.-K. and A.M.K.; visualization, B.D.-K. and A.M.K. supervision, B.D.-K. and A.M.K.; project administration, B.D.-K. and A.M.K.; funding acquisition, B.D.-K. and A.M.K. All authors have read and agreed to the published version of the manuscript.
Funding
This paper was supported and co-financed by the Minister of Science of the Republic of Poland under the “Regional Initiative of Excellence” Program. RID/SP/0034/2024/01.
Institutional Review Board Statement
The study was conducted in accordance with the Declaration of Helsinki. The survey was conducted by the Center for Research and Development at the University of Economics in Katowice (Poland). It was exempt from ethical conduct.
Informed Consent Statement
Informed consent was obtained from all subjects involved in the study.
Data Availability Statement
The data that support the findings of this study are available from the anna.karmanska@uekat.pl upon reasonable request.
Conflicts of Interest
The authors declare no conflicts of interest.
References
- European Union. Directive (EU) 2022/2464 of the European Parliament and of the Council of 14 December 2022 amending Regulation (EU) No 537/2014, Directive 2004/109/EC, Directive 2006/43/EC and Directive 2013/34/EU as regards corporate sustainability reporting. Official Journal of the European Union, 14 December 2022; p. 15. [Google Scholar]
- European Union. Regulation (EU) 2020/852 of the European Parliament and of the Council of 18 June 2020 on the establishment of a framework to facilitate sustainable investment, and amending Regulation (EU) 2019/2088. Official Journal of the European Union, 18 June 2020; p. 13. [Google Scholar]
- Gray, R.; Owen, D.; Adams, C. Some theories for social accounting? A review essay and a tentative pedagogic categorisation of theorisations around social accounting. In Sustainability, Environmental Performance and Disclosures; Emerald Group Publishing Limited: Leeds, UK, 2010; Volume 4, pp. 1–54. [Google Scholar]
- Dumay, J.; De Villiers, C.; Guthrie, J.; Hsiao, P. Thirty years of accounting, auditing and accountability journal: A critical study of the journal’s most cited papers. Account. Audit. Account. J. 2018, 31, 1510–1541. [Google Scholar] [CrossRef]
- Bitektine, A.; Haack, P. The “macro” and the “micro” of legitimacy: Toward a multilevel theory of the legitimacy process. Acad. Manag. Rev. 2015, 40, 49–75. [Google Scholar] [CrossRef]
- Łada, M. Teoria legitymizacji w badaniach nad zarządzaniem uczelnią wyższą. Pr. Nauk. Uniw. Ekon. Wrocławiu 2016, 420, 207–215. [Google Scholar]
- Moll, J.; Hoque, Z. Budgeting for legitimacy: The case of an Australian university. Account. Organ. Soc. 2011, 36, 86–101. [Google Scholar] [CrossRef]
- Patten, D.M. Intra-industry Environmental Disclosures in Response to the Alaskan Oil Spill: A Note on Legitimacy Theory. Account. Organ. Soc. 1992, 17, 471–475. [Google Scholar] [CrossRef]
- Deegan, C.M. Legitimacy theory: Despite its enduring popularity and contribution, time is right for a necessary makeover. Account. Audit. Account. J. 2019, 32, 2307–2329. [Google Scholar] [CrossRef]
- Deegan, C.; Rankin, M.; Voght, P. Firms’ Disclosure Reactions to Major Social Incidents: Australian Evidence. Account. Forum 2000, 24, 101–130. [Google Scholar] [CrossRef]
- Tilt, C. Corporate social responsibility research: The importance of context. Int. J. Corp. Soc. Responsib. 2016, 1, 2. [Google Scholar] [CrossRef]
- De Villiers, C.; Marques, A. Corporate social responsibility, country-level predispositions, and the consequences of choosing a level of disclosure. Account. Bus. Res. 2016, 46, 167–195. [Google Scholar] [CrossRef]
- Cho, C.H.; Patten, D.M. The role of environmental disclosures as tools of legitimacy: A research note. Account. Organ. Soc. 2007, 32, 639–647. [Google Scholar] [CrossRef]
- Perrow, C. Organizational Analysis: A Sociological View; Brooks-Cole: Belmont, CA, USA, 1967. [Google Scholar]
- Davenport, T.H. Foreword. In Business Process Management: Practical Guidelines to Successful Implementation; Jetson, J., Nelis, J., Eds.; Elsevier: Oxford, UK, 2008; pp. XIV–XVIII. [Google Scholar]
- Dumas, M.; La Rosa, M.; Mendling, J.; Reijers, H.A. Business Process Management. Istota Zarządzania Procesami Biznesowymi; PWN: Warszawa, Polska, 2022. [Google Scholar]
- Optiz, N.; Krüp, H.; Kolbe, L.M. Green Business Process Management—A Definition and Research Framework. In Proceedings of the 2014 47th Hawaii International Conference on System Sciences, Waikoloa, HI, USA, 6–9 January 2014; pp. 3808–3817. [Google Scholar]
- Hernández González, A.; Calero, C.; Pérez Parra, D.; Mancebo, J. Approaching Green BPM characterisation. J. Softw. Evol. Process 2019, 31, e2145. [Google Scholar] [CrossRef]
- Maciel, J.C. The Core Capabilities of Green Business Process Management—A Literature Review. In Proceedings of the International Conference on Wirtschatsinformatik, St. Gallen, Switzerland, 12–15 February 2017; Leimeister, J.M., Brenner, W., Eds.; pp. 1526–1537. [Google Scholar]
- Islam, J.; Hu, H. A review of literature on contingency theory in managerial accounting. Afr. J. Bus. Manag. 2012, 6, 5159–5164. [Google Scholar] [CrossRef]
- Piosik, A.; Karmańska, A. Impact of digitalization on budgeting functions: An investigation into contingency theory perspectives. J. Appl. Econ. Sci. 2023, 18, 312–338. [Google Scholar]
- Ahmed, M.; Seraj, R.; Islam, S.M.S. The k-means algorithm: A comprehensive survey and performance evaluation. Electronics 2020, 9, 1295. [Google Scholar] [CrossRef]
- Kim, S.; Cho, S.; Kim, J.Y.; Kim, D.J. Statistical assessment on student engagement in asynchronous online learning using the k-means clustering algorithm. Sustainability 2023, 15, 2049. [Google Scholar] [CrossRef]
- Bengfort, B.; Bilbro, R.; Danielsen, N.; Gray, L.; McIntyre, K.; Roman, P.; Poh, Z. Yellowbrick, Version 0.9.1; Zenodo; Yellow Brick Systems: New York, NY, USA, 2018.
- Giang, N.P.; Binh, T.Q.; Thuy, L.T.T.; Ha, D.N.; Loan, C.H. Environmental accounting for sustainable development: An empirical study in Vietnam. Manag. Sci. Lett. 2020, 10, 1613–1622. [Google Scholar] [CrossRef]
- Chaudhry, N.I.; Amir, M. From institutional pressure to the sustainable development of firm: Role of environmental management accounting implementation and environmental proactivity. Bus. Strategy Environ. 2020, 29, 3542–3554. [Google Scholar] [CrossRef]
- Ntalamia, W.L. Factors Influencing Adoption of Environmental Management Accounting (EMA) Practices Among Manufacturing Firms in Nairobi, Kenya. Master’s Thesis, Jomo Kenyatta University of Agriculture and Technology, Nairobi, Kenya, 2017. [Google Scholar]
- Christ, K.L.; Burritt, R.L. Environmental management accounting: The significance of contingent variables for adoption. J. Clean. Prod. 2013, 41, 163–173. [Google Scholar] [CrossRef]
- Gunarathne, N.; Lee, K.-H.; Hitigala Kaluarachchilage, P.K. Tackling the integration challenge between environmental strategy and environmental management accounting. Account. Audit. Account. J. 2023, 36, 63–95. [Google Scholar] [CrossRef]
- Huynh, Q.L.; Nguyen, V.K. The Role of Environmental Management Accounting in Sustainability. Sustainability 2024, 16, 7440. [Google Scholar] [CrossRef]
- Szewieczek, A.; Dratwińska-Kania, B.; Ferens, A. Business Model Disclosure in the Reporting of Public Companies—An Empirical Study. Sustainability 2021, 13, 10088. [Google Scholar] [CrossRef]
- Elhossade, S.S.; Abdo, H.; Mas’ud, A. Impact of institutional and contingent factors on adopting environmental management accounting systems: The case of manufacturing companies in Libya. J. Financ. Report. Account. 2021, 19, 497–539. [Google Scholar]
- Barani, O.; Ahmed, A.D.; Joshi, M.; Asiaei, K. How environmental management accounting drives performance: A me-ta-analysis considering national EMA maturity. J. Account. Lit. 2025, 47, 416–443. [Google Scholar] [CrossRef]
- Sari, R.N.; Pratadina, A.; Anugerah, R.; Kamaliah, K.; Sanusi, Z.M. Effect of environmental management accounting practices on organizational performance: Role of process innovation as a mediating variable. Bus. Process Manag. J. 2021, 27, 1296–1314. [Google Scholar] [CrossRef]
- Angelin, A.; Yuwono, W.; Yulfiswandi, Y. The Influence of Organizational Culture on Financial Reporting Quality: The Mediating Role of Innovation, Risk Management Implementation, and Sustainability Reporting in Sharia Rural Bank. Indones. Interdiscip. J. Sharia Econ. 2025, 8, 670–686. [Google Scholar]
- Walińska, E.; Gad, J. Kluczowe narzędzia raportowania korporacyjnego w praktyce polskiego rynku kapitałowego-analiza przypadku. Zesz. Teoretyczne Rachun. 2017, 92, 207–226. [Google Scholar] [CrossRef]
- Brajer-Marczak, R.; Kalinowski, B.T.; Bitkowska, A. Green BPM as a concept of meeting the ESG requirements in the financial and insurance sector. Stud. Pr. Kol. Zarządzania Finans. 2024, 196, 69–80. [Google Scholar] [CrossRef]
- Van der Poll, H.M. The barriers and drivers of environmental management accounting practices’ adoption in developed and developing countries for sustainable development. Sustain. Dev. 2022, 30, 1222–1234. [Google Scholar] [CrossRef]
Disclaimer/Publisher’s Note: The statements, opinions and data contained in all publications are solely those of the individual author(s) and contributor(s) and not of MDPI and/or the editor(s). MDPI and/or the editor(s) disclaim responsibility for any injury to people or property resulting from any ideas, methods, instructions or products referred to in the content. |
© 2025 by the authors. Licensee MDPI, Basel, Switzerland. This article is an open access article distributed under the terms and conditions of the Creative Commons Attribution (CC BY) license.