Abstract
Cyberattacks targeting industrial control systems can produce environmental damage by disrupting energy production, altering chemical processes, or forcing reliance on more carbon-intensive backup resources. Yet, the environmental dimension of cybersecurity risk is rarely quantified. This paper examines the connection between cybersecurity and sustainability by comparing the environmental impact of cyber-induced power plant disruption with the life cycle emissions involved in deploying cybersecurity monitoring solutions. We present a quantitative scenario in which a cyberattack forces a temporary disconnection of a power generation unit from the grid, leading to additional CO2 emissions primarily from wasted fuel during the operational disruption and subsequent reconnection procedures. The resulting carbon footprint is then compared with the emissions associated with implementing a continuous monitoring system designed to prevent such incidents. The results demonstrate that the installation and operation of a continuous monitoring system has a negligible environmental impact (below 5 tCO2 over five years) compared to the emissions resulting from a single 12 h outage event (460–836 tCO2), even when considering only the direct fuel waste. These findings position cybersecurity investment as a climate-positive strategy for the energy sector.
1. Introduction
In recent years, the relationship between cybersecurity and sustainability has become increasingly evident. Modern industrial infrastructures, including power generation plants, water treatment facilities, and pipeline networks, rely heavily on digital communication, remote monitoring, and automated control. While these technologies improve efficiency and enable the transition toward low-carbon and renewable energy systems, they also increase the exposure of critical infrastructure to cyber threats. The environmental consequences of such attacks are often overlooked: cybersecurity is still primarily framed in terms of data breaches, operational downtime, or financial losses. However, when digital controls govern physical processes, a cyberattack can produce real and tangible environmental harm.
Several documented incidents demonstrate this connection. For example, in 2021 an intrusion targeting the drinking water treatment facility in Oldsmar, Florida, attempted to manipulate sodium hydroxide dosing levels in the water supply, risking contamination and public health harm if not promptly detected [1,2].
Additionally, the ransomware attack on Colonial Pipeline in 2021 forced the shutdown of a major fuel distribution network, resulting in widespread shortages and increased reliance on less efficient emergency transportation and logistics methods, indirectly increasing environmental emissions [3]. These examples illustrate how cyber incidents within industrial systems can propagate beyond the digital realm, affecting public health, resource use, and ecological stability.
Despite this evidence, the environmental dimension of cybersecurity remains underrepresented in both research and policy discussions. Life Cycle Assessment (LCA) methodologies are widely used to evaluate the environmental impact of physical infrastructure, energy systems, and manufacturing processes, but they rarely encompass the effects of cyber incidents or the sustainability benefits of cybersecurity controls. Conversely, cybersecurity assessments typically do not consider ecological impacts when evaluating risk. This gap limits the ability of decision-makers to recognize cybersecurity not only as a technological safeguard, but also as an enabler of sustainable and resilient industrial operations.
This paper addresses this gap by proposing a comparative analysis between the environmental impact of a cyberattack and the environmental footprint of cybersecurity monitoring solutions. Specifically, we present a quantitative example in which a power plant suffers a temporary disconnection from the grid following a cyber intrusion. The forced shutdown and subsequent reconnection, occurring several hours later, cause fluctuations in power supply and require compensatory generation from carbon-intensive backup sources, resulting in measurable additional CO2 emissions. This impact is then compared with the life cycle emissions associated with deploying and operating a cybersecurity monitoring system designed to prevent such incidents. The aim is to demonstrate that, in many cases, the carbon footprint of implementing adequate cybersecurity measures is significantly lower than the environmental damage caused by the disruption itself.
Ultimately, the results of this study emphasize that cybersecurity is not only a matter of operational continuity or economic protection. It is a necessary condition for environmental stewardship, sustainable energy transitions, and the resilience of critical infrastructure. In this sense, security means sustainability: protecting digital systems is essential for protecting the planet.
The paper is structured as follows. Section 2 analyzes the literature regarding the evaluation of environmental damages related to cyberattacks. Section 3 quantitatively evaluates the carbon footprint of a cyberattack against a power plant. Section 4 computes the Life Cycle Assessment of a cybersecurity monitoring solution. Section 5 compares the two impacts. Section 6 discusses the results, while Section 7 presents conclusions.
2. State of the Art
Several works have quantified the carbon footprint of information and communication technology (ICT) infrastructures, with estimates ranging from 2% to 4% of global CO2 emissions [4]. Similarly, life cycle assessments (LCA) of microcomputing platforms such as the Raspberry Pi have shown embodied emissions of approximately 6–10 kg CO2 per unit [5].
On the energy side, CCGT plants represent a key component of the Italian electricity system, with thermal efficiencies between 55–60%. Forced disconnections due to cyber incidents or control failures can lead to emission spikes both from on-site fuel waste and grid rebalancing via less efficient backup generation [6]. However, the environmental impact of such cyber-induced inefficiencies remains largely unquantified in the literature.
Beyond the ICT and power-generation domains, recent research has begun to explore how cyber-physical attacks can generate measurable environmental consequences. Studies of energy infrastructures show that cyber intrusions can trigger operational inefficiencies, forced shutdowns, or resource leaks that directly increase emissions or pollution. For example, reviews of energy-system cyberattacks [7] highlight how compromised control systems in smart grids and power plants may disrupt supply–demand balance, compelling operators to rely on less efficient reserve units. Real-world events such as the 2021 Colonial Pipeline ransomware incident [3] and the 2025 Norwegian dam intrusion [8] demonstrate that cyber-induced outages can waste fuel, release untreated materials, or cause large-scale flooding.
In parallel, a new research strand on “sustainability-targeting” or Green Hack attacks [9] has emerged. These studies propose that adversaries might deliberately manipulate industrial or energy-control parameters to degrade efficiency or increase emissions while keeping performance within nominal limits. Early modeling work suggests such attacks can significantly raise a system’s energy consumption without triggering traditional alarms, effectively turning cybersecurity failures into sustainability failures.
Despite these advances, the quantitative comparison between the environmental footprint of cyberattacks and that of cybersecurity countermeasures remains absent. Prior literature documents the general risks of cyber-physical disruptions to the environment but stops short of measuring or contrasting the magnitude of these effects using LCA or emissions data.
To position this study within the existing literature, we identify four related research domains. First, the Life Cycle Assessment (LCA) of Information and Communication Technology (ICT) provides the foundational emissions data for the monitoring system. Second, operational analysis of Combined-Cycle Gas Turbine (CCGT) plants supplies the parameters for the attack scenario (e.g., efficiency, idle load, restart time). Third, studies on cyber-physical attacks and Green Hacks demonstrate the mechanism by which an intrusion can translate into environmental harm, specifically focusing on energy efficiency degradation and forced outages. Finally, documentation of real-world incidents (e.g., Oldsmar, Colonial Pipeline) provides precedent for the environmental consequences of such events. This work distinctively integrates the quantitative outcomes of the first two domains (ICT footprint and operational emissions) with the risk concepts of the latter two (attack consequences and probability) within a unified LCA framework.
This work contributes by linking these two domains—ICT LCA and operational power-plant emissions—within a unified framework that allows the environmental justification of cybersecurity investment. While the current scenario focuses on a CCGT plant, the methodology is designed to be technology-agnostic and can be applied to other energy and industrial systems, such as coal plants or water treatment facilities, by substituting the relevant operational parameters (e.g., efficiency, fuel type, or material waste factor).
3. Carbon Footprint of a Cyberattack
3.1. Scenario Description
For the purpose of this analysis, the assumed adversary capabilities involve a sophisticated attack targeting the plant’s Industrial Control System (ICS), specifically aiming at the digital protection relays or the Sequence of Events (SoE) logging system. Such an intrusion is designed to trigger a trip condition that forces a protective shutdown of the turbine unit and subsequent grid disconnection. This is a simplified threat model—a zero-day exploit or a compromised remote access channel—but one that realistically leads to the operational outcome described below: a forced and controlled unit trip to safeguard the physical equipment.
We consider a 600 MWe combined-cycle gas turbine (CCGT) power plant located in Italy. In the event that the facility becomes the target of a cyberattack, the following operating conditions are assumed for the duration of the incident:
- The plant is taken offline and remains disconnected from the national electricity grid for a total of 12 h, preventing power delivery during this period.
- During the disconnection, the unit is maintained in a synchronous/spinning mode, operating at minimum firing levels. This state, common in CCGT operations, is necessary to minimize thermal stress and allow for a rapid return to service. The minimum firing level represents the thermal energy required to keep the unit ready and spinning, but without producing net electrical output. This approach is adopted to avoid the substantial delays and thermal stresses associated with performing a complete cold shutdown and subsequent restart.
- Once the cyberattack has been contained and the system is considered secure, the plant is brought back to normal operation through a controlled restart procedure. The assumption reflects the equivalent full-load fuel consumption during the ramping-up phase from minimum load to full capacity, which is a simplification of a complex, dynamic process but maintains an accurate order of magnitude for total fuel usage.
The following subsection quantifies the carbon footprint of the previously discussed phases, considering the sum of them as the overall carbon footprint of the attack.
3.2. Methodology
The wasted thermal energy () during the idle and restart periods is calculated as:
where:
The results are consistent with IPCC and IEA guidelines for natural gas combustion emissions [10,11].
It is important to note that the calculated CO2 emissions represent only the direct emissions from wasted fuel at the affected CCGT plant. The scenario neglects a potentially significant secondary effect: the compensatory generation required to meet the grid’s demand balance. Since the CCGT unit (600 MWe) is offline, the lost power must be supplied by other available, often less efficient, reserve units—typically older gas turbines or coal plants. Modeling this complex grid rebalancing falls outside the scope of this paper but would significantly increase the total environmental impact of the cyberattack, thereby strengthening the central claim that prevention is climate-positive.
Table 1 summarizes all key assumptions used in the scenario, including the electrical capacity, the corresponding thermal input of, idle time, restart duration, and two alternative idle-load fractions (10% and 25%).

Table 1.
Assumptions for the CCGT forced disconnection scenario.
To ensure replicability, we provide a worked example for Scenario A (Low idle: ).
- 1.
- Thermal Input ():
- 2.
- Wasted Thermal Energy ():
- 3.
- Wasted Fuel (GJ): Conversion factor .
- 4.
- CO2 Emissions (t): Conversion factor .
This calculation confirms the 460 tCO2 result in Table 2 (Scenario A). Using these inputs, Table 2 presents the calculated wasted thermal energy, the equivalent fuel consumption, and the resulting CO2 emissions for both scenarios. Under low-idle conditions (10%), the 12 h idle period results in approximately of wasted energy and 460 t of . In the higher-idle case (25%), the wasted energy increases to about , corresponding to 836 t of emissions.
Table 2.
Computed CO2 emissions from wasted fuel during a 12 h forced idle period.
4. Cybersecurity Monitoring Solution LCA
4.1. Architecture Description
We consider a cybersecurity monitoring solution developed by the spinoff of the University of Genova. The solution has been tested in a relevant industrial environment, and the results are presented in [12] The WatchField monitoring solution is an Artificial Intelligence-based system developed for the cybersecurity and safety monitoring of industrial control networks. It specifically focuses on analyzing network traffic at the lower levels of the architecture, including direct monitoring of Fieldbus communications. WatchField provides direct visibility into fieldbus communications, which enables the creation and maintenance of an up-to-date inventory of industrial assets, such as local control devices like Programmable Logic Controllers (PLCs) and Intelligent Electronic Devices (IEDs).
In this work, we consider that as a comprehensive monitoring solution, and we analyze the hardware components in order to evaluate the Life Cycle Assessment. The solution consists of three main components:
- Field Hub: This component functions to intercept communication between Fieldbus hosts, and utilizes a third monitoring port to replicate the electrical signal in both directions. It’s a passive element, and we consider that negligible for this analysis.
- Field Probe: This component receives the traffic data replicated by the Field Hub. Its role is to analyze and pre-process data related to the communication channel, network packets, and physical measurements. It is implemented through a on-the-shelf Raspberry Pi.
- Anomaly Detection Engine: This component processes the pre-processed data streams. It utilizes various algorithms to identify potential anomalous events and is designed to quickly identify the specific portion of the field network where the anomaly is occurring. The implementation of that needs a medium-performance rack server.
To briefly explain the detection mechanism: the WatchField solution is designed to prevent a successful attack by monitoring the integrity of the process data and control sequences. In the context of a forced outage cyberattack, the system would detect one or more of the following:
- (1)
- Protocol violations or unauthorized network commands targeting the PLCs/IEDs (Field Probe analysis).
- (2)
- Anomaly in process variables (e.g., unexpected pressure, temperature, or valve position readings) immediately preceding the trip signal, as analyzed by the Anomaly Detection Engine.
- (3)
- Abnormal patterns in the communication frequency or timing between field devices, which could indicate a Man-in-the-Middle attack or a compromised node attempting to manipulate the control logic and thus trigger the shutdown.
The proposed monitoring system consists of 1–10 Raspberry Pi microcomputers distributed across field assets, connected to a centralized server station equipped with a human–machine interface (HMI). Each Raspberry Pi node executes local monitoring and forwards aggregated logs and security data to the server, which performs anomaly detection and visualization.
4.2. Life Cycle Boundaries and Data
In accordance with the ISO 14040/14044 [13,14] standards for Life Cycle Assessment, the system boundary for the monitoring solution is defined as a “Cradle-to-Gate with Use-Phase” scope. This boundary encompasses the product stage (raw material acquisition and manufacturing, resulting in Embodied Emissions) and the use stage (Operational Emissions over the 5-year lifespan). The functional unit is defined as: Continuous protection of a 600 MWe CCGT power plant over a 5-year period.
The life-cycle assessment (LCA) considers the following components:
- Embodied emissions: These account for the greenhouse gas emissions associated with the manufacturing phase, including the production of electronic components, structural materials, and device casings. The total Embodied CO2 in Table 3 primarily comes from the central rack server (assumed 500 kg CO2 for manufacture and shipment) 12 and the additional Raspberry Pi units (6.5 kg CO2 per unit).
Table 3. Estimated LCA results for the cybersecurity monitoring system over a 5-year lifespan.
- Operational emissions: End-of-life emissions are assumed to be negligible relative to those from the operational phase and are therefore not included in the present analysis. This simplification is based on the finding that the disposal phase for ICT hardware typically contributes less than 1% of the total CO2 equivalent, a common omission in LCA studies for such systems.
- Disposal: End-of-life emissions are assumed to be negligible relative to those from the operational phase and are therefore not included in the present analysis.
With , where kg CO2/kWh (Italian electricity carbon intensity, 2023 average [11]).
The results show a linear relationship between the number of Raspberry Pi nodes and the overall CO2 impact, dominated by operational energy use.
5. Carbon Footprint Comparison
5.1. Raw Comparison
A single cyberattack event leading to a 12 h outage of one CCGT unit releases between 460 and 836 tCO2 in wasted fuel alone. This range reflects the uncertainty in the operating condition () during the forced idle period and represents a conservative estimate for the total emissions. In contrast, the entire 5-year life cycle of the monitoring infrastructure, even in its largest configuration, emits less than 5 tCO2.
Figure 1 illustrates this contrast by visually comparing the emissions from a single cyberattack event against the life cycle footprint of the monitoring system across different configurations.
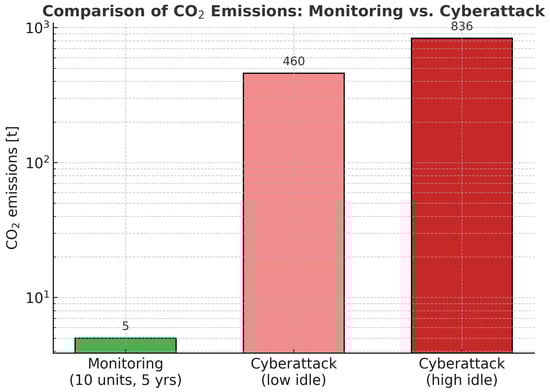
Figure 1.
Comparison between monitoring system LCA and cyberattack-induced emissions (log scale).
As predictable, the difference is of two orders of magnitude. The magnitude of this gap suggests the result is robust to typical uncertainties in CCGT operational parameters and ICT LCA data, even before considering system-level compensatory emissions. To provide more practical advice for decision-makers, we also take into account the probability of an attack in this analysis.
5.2. Probabilistic Comparison
As previously quantified, the total life-cycle greenhouse gas (GHG) emissions associated with this monitoring system over a 5-year operational horizon range between 4.47 tCO2 (1 Raspberry Pi configuration) and 5.03 tCO2 (10 Raspberry Pi configuration). These values include embodied emissions from hardware production as well as energy consumption during operation.
To evaluate the avoided emissions attributable to the monitoring system, we consider the disruption of a 600 MW combined-cycle gas turbine (CCGT) power plant. In the event of a cyberattack requiring forced disconnection from the grid and operation at minimum firing conditions for 12 h, the wasted natural gas results in substantial CO2 emissions. Two operational scenarios are considered:
- Scenario A: Minimum firing level at 10% load, leading to an estimated 459.63 tCO2 of wasted fuel.
- Scenario B: Minimum firing level at 25% load, leading to an estimated 835.70 tCO2 of wasted fuel.
The previous analysis implicitly assumes that the monitoring system is perfectly effective, meaning the probability of an avoided attack is equal to the probability of an attack (p). In reality, the success of a cybersecurity system is defined by its ability to reduce the likelihood of a successful attack. We therefore re-express the expected CO2 in terms of the Risk Reduction Factor (), which quantifies the reduction in the probability of a successful attack due to the monitoring system. The expected CO2 emissions avoided by the monitoring system over the 5-year horizon () are calculated as the product of the probability of an attack (p), the attack emissions (), and the risk reduction factor ():
The ranges from 0 (no effect) to 1 (perfect prevention). For simplicity and to establish a conservative lower bound, the subsequent calculations in Table 4 and Table 5 assume the monitoring system is perfectly effective (). Since we kept for the main tables, the structure of Table 4 and Table 5 remains largely the same, but the interpretation changes to a break-even p instead of the overall attack probability.
Table 4.
Expected CO2 (tCO2) from a single successful attack conditional on probability p and ratio to the monitoring system footprint (5-year horizon).
Table 5.
Break-even probability for the monitoring system to achieve net CO2 benefit.
Now, the expected CO2 emissions associated with the cyberattack, over the same 5-year horizon, depend on the probability p that such an event occurs. This is expressed as:
where depending on the scenario.
Table 4 reports the expected CO2 emissions for several illustrative values of p, together with the ratio of these emissions to the monitoring system footprint.
The critical threshold at which the monitoring system yields net environmental benefit is obtained by setting the expected emissions of Equation (3) equal to the monitoring footprint:
Table 5 reports the resulting break-even probabilities.
These results show that even a relatively low probability of a significant cyber-induced outage (on the order of 0.5–1.1% over a 5-year period) is sufficient for the expected avoided emissions to exceed the life-cycle emissions of the monitoring deployment. In other words, the monitoring solution provides a net environmental benefit under highly realistic threat likelihoods.
5.3. Probabilistic Analysis with Sensitivity
To address the reliance on fixed parameters and illustrate the spread of possible outcomes, we introduce two forms of sensitivity analysis: a Monte-Carlo simulation on the attack parameters and a scenario-based analysis on the monitoring system’s effectiveness ().
5.3.1. Sensitivity to Attack Parameters
We model the uncertainty in the two main attack parameters, (Idle fraction) and (Idle time), using a simplified Monte-Carlo simulation (1000 trials). We assume both parameters follow a uniform distribution within a realistic range of operational conditions:
- : Uniformly distributed between 5% and 30% (instead of fixed 10% and 25%).
- : Uniformly distributed between 8 h and 24 h (instead of fixed 12 h).
The median, 5th percentile, and 95th percentile of the resulting distribution are presented below. We use the 10 Pi monitoring case (5.0326 tCO2) for comparison.
The sensitivity analysis Table 6 shows that even under the most favorable conditions for the attack (5th percentile, minimum downtime/idle load), the required break-even probability remains low, at over five years. This reinforces the core finding: the environmental benefit is not highly sensitive to the exact scenario parameters.
Table 6.
Sensitivity of to parameter ranges and resulting break-even probability .
5.3.2. Scenario: Partial Mitigation
We now consider a scenario where the monitoring system is only partially effective, introducing a Risk Reduction Factor () less than 1. This could occur if the attack is detected late, or if the system is compromised but can still prevent the most severe outcome (e.g., reducing a 12 h outage to a 4 h outage).
The expected emissions avoided by the monitoring system over the 5-year horizon () are calculated as the product of the probability of an attack (p), the attack emissions (), and the risk reduction factor ():
If we set the required break-even probability to a high, conservative value, such as , we can calculate the minimum required for the monitoring system to be climate-positive (using the 10 Pi case, t, and Scenario B, t ):
This calculation demonstrates that even with a high probability of attack () and under the worst-case attack scenario (Scenario B), the monitoring system only needs to reduce the risk of a successful outage by to achieve a net environmental benefit. This confirms that the net environmental benefit is achieved even if the monitoring system provides only partial mitigation.
6. Discussion of Results
The results highlight a pronounced imbalance between the preventive and reactive emission footprints associated with cybersecurity in industrial energy systems. The operational carbon cost of deploying and running continuous monitoring infrastructure is negligible when compared with the emissions generated by even a single forced disconnection event. For the CCGT case analyzed, one 12 h cyber-induced outage produces emissions that exceed those of a five-year monitoring system by approximately three orders of magnitude. Beyond this direct comparison, we also evaluated the expected carbon footprint by incorporating the probability of a cyberattack. When the likelihood of an event is taken into account, the preventive approach becomes even more favorable: the expected avoided emissions far outweigh the marginal footprint of the monitoring infrastructure. The break-even analysis showed that the environmental benefit is achieved even with a very low probability of attack ( to over five years) or, conversely, if the monitoring system provides only a ∼6% reduction in the attack success probability. This probabilistic perspective mirrors common practices in risk assessment and provides a more realistic indication of the long-term environmental implications of inadequate cybersecurity.
The broader implication of these findings is that cybersecurity should increasingly be recognized not only as a reliability or safety requirement but also as a lever for sustainability. By re-framing the analysis in terms of a Risk Reduction Factor, we align cybersecurity investment with standard risk management practices, providing a measurable environmental justification for deploying defense mechanisms like the WatchField system. Decision-makers responsible for industrial assets—particularly in energy-intensive sectors—should consider the environmental consequences of cyber-induced operational disruptions. Integrating cybersecurity investment into sustainability strategies can help prevent avoidable emissions, improve operational continuity, and strengthen compliance with emerging environmental reporting frameworks. In summary, the analysis reinforces that strengthening digital resilience is aligned with climate objectives: preventive cybersecurity measures deliver disproportionately large emission savings compared with their modest operational footprint. As industrial systems become more interconnected and cyber threats more sophisticated, incorporating these considerations into policy, investment planning, and corporate sustainability assessments becomes increasingly critical.
7. Conclusions
This work has examined the environmental implications of cyberattacks on industrial energy systems and highlighted the role of cybersecurity as a critical enabler of sustainability. While cybersecurity is often evaluated in terms of financial loss, operational disruption, or safety risk, our analysis shows that cyber incidents can also generate measurable environmental damage. When industrial processes are interrupted, particularly in the energy sector, substitution by carbon-intensive backup generation can lead to significant additional emissions. These impacts are rarely considered in traditional cybersecurity risk assessments or sustainability planning, leading to an underestimation of the broader systemic cost of cyber threats.
By comparing the carbon footprint associated with the temporary grid disconnection of a power plant due to a cyberattack with the life cycle emissions of deploying a cybersecurity monitoring solution, we demonstrated that the environmental cost of disruption can exceed the footprint of prevention by a substantial margin. Our sensitivity analysis showed that the break-even probability for the monitoring system to achieve a net CO2 benefit is consistently low (between and over five years) and that the system only requires a small risk reduction factor (∼6%) to be climate-positive. In other words, the environmental impact of not implementing adequate cybersecurity may be greater than the environmental cost of maintaining it. This evidence supports the interpretation of cybersecurity as a safeguard for both operational reliability and ecological stewardship.
The results presented here encourage a re-framing of cybersecurity within sustainability strategies, environmental policy, and critical infrastructure management. Future work should expand this analysis to other domains such as water treatment networks, smart transportation systems, and industrial manufacturing chains, where cyber-physical interactions are similarly capable of producing environmental harm. Furthermore, future modeling should incorporate the systemic effects of compensatory generation on the grid, and expand the environmental metric beyond CO2 to include other key indicators (e.g., water usage, NOx emissions) to provide a more holistic environmental impact assessment. Moreover, integrating environmental impact metrics into cybersecurity risk models and investment decisions may support more informed and responsible infrastructure planning. In conclusion, securing digital systems is not merely a technical or economic consideration: it is a necessary condition for protecting the environment. As industrial infrastructures continue to digitize and energy systems transition toward decarbonization, cybersecurity must be recognized as a foundational component of sustainable and resilient operations.
Author Contributions
G.B.G. and F.B.S.: Conceptualization, Methodology, Writing—original draft, Data curation, Software, Validation. P.G. and M.M.: Supervision, Writing—review & editing. All authors have read and agreed to the published version of the manuscript.
Funding
This research received no external funding.
Data Availability Statement
No new data were created or analyzed in this study.
Acknowledgments
This work has been developed in the context of the project Interreg IT FR Marittimo “OPEN CIRCULAR”, with the collaboration of the Spinoff of the University of Genova Airfield Security.
Conflicts of Interest
The authors declare no conflicts of interest.
References
- Cybersecurity and Infrastructure Security Agency; Federal Bureau of Investigation; Environmental Protection Agency; National Security Agency. Cyber Actors Targeted U.S. Water Sector Facilities; U.S. Government: February 2021; Report No. AA21-042A. Available online: https://www.cisa.gov/news-events/cybersecurity-advisories/aa21-042a (accessed on 1 May 2025).
- Perlroth, N. A Hacker Tried to Poison a Florida City’s Water Supply, Officials Say. The New York Times, 8 February 2021. Available online: https://www.nytimes.com/2021/02/08/us/oldsmar-florida-water-supply-hack.html (accessed on 1 May 2025).
- Cybersecurity and Infrastructure Security Agency. The Attack on Colonial Pipeline: What We’ve Learned & What We’ve Done Over the Past Two Years. 2023. Available online: https://www.cisa.gov/news-events/news/attack-colonial-pipeline-what-weve-learned-what-weve-done-over-past-two-years (accessed on 1 May 2025).
- Belkhir, L.; Elmeligi, A. Assessing ICT Global Emissions Footprint: Trends to 2040 and Recommendations. J. Clean. Prod. 2018, 177, 448–463. [Google Scholar] [CrossRef]
- Loubet, P.; Vincent, A.; Collin, A.; Dejous, C.; Ghiotto, A.; Jego, C. Life cycle assessment of ICT in higher education: A comparison between desktop and single-board computers. Int. J. Life Cycle Assess. 2023, 28, 255–273. [Google Scholar] [CrossRef]
- Terna, S.p.A. Rapporto Mensile sul Sistema Elettrico Italiano 2023; Terna S.p.A.: Rome, Italy, 2023; Available online: https://www.terna.it (accessed on 1 May 2025).
- Diaba, S.; Shafie-khah, M.; Elmusrati, M. Cyber-physical attack and the future energy systems: A review. Energy Rep. 2024, 12, 2914–2932. [Google Scholar] [CrossRef]
- Adomaitis, N. Norway Attributes Dam Cyberattack to Russian Hackers. 2025. Available online: https://dailysecurityreview.com/cyber-security/norway-attributes-dam-cyberattack-to-russian-hackers/ (accessed on 1 May 2025).
- Ahamed, F.; Roy, T. Green Hacks: Generating Sustainability-Targeting Attacks for Cyber-Physical Systems. arXiv 2025, arXiv:2505.14982. Available online: https://arxiv.org/abs/2505.14982 (accessed on 1 May 2025).
- Intergovernmental Panel on Climate Change (IPCC). 2006 IPCC Guidelines for National Greenhouse Gas Inventories, Volume 2: Energy; IPCC: Geneva, Switzerland, 2019; Available online: https://www.ipcc-nggip.iges.or.jp/public/2006gl/vol2.html (accessed on 1 May 2025).
- International Energy Agency (IEA). Electricity Information 2023; IEA Publications: Paris, France, 2023. [Google Scholar]
- Gaggero, G.B.; Caviglia, R.; Girdinio, P.; Marchese, M. Toward a Security Operation Center for Operational Technology in Industrial Networks. In Proceedings of the 2024 IEEE International Workshop on Technologies for Defense and Security (TechDefense), Naples, Italy, 11–13 November 2024; pp. 160–164. [Google Scholar]
- ISO 14040:2006; Environmental Management—Life Cycle Assessment—Principles and Framework. International Organization for Standardization (ISO): Geneva, Switzerland, 2006.
- ISO 14044:2006; Environmental Management—Life Cycle Assessment—Requirements and Guidelines. International Organization for Standardization (ISO): Geneva, Switzerland, 2006.
Disclaimer/Publisher’s Note: The statements, opinions and data contained in all publications are solely those of the individual author(s) and contributor(s) and not of MDPI and/or the editor(s). MDPI and/or the editor(s) disclaim responsibility for any injury to people or property resulting from any ideas, methods, instructions or products referred to in the content. |
© 2025 by the authors. Licensee MDPI, Basel, Switzerland. This article is an open access article distributed under the terms and conditions of the Creative Commons Attribution (CC BY) license.