Abstract
The deterioration of the water environment in small towns in China due to urbanization has posed a significant challenge to their socioeconomic sustainability. Therefore, this study aims to employ an integrated assessment method based on the principal component analysis–minimal water quality index model (PCA–WQImin) to objectively evaluate the water quality and analyze the pollution characteristics of Wangwenzhuang in Tianjin, thereby providing a scientific basis and decision-making support for the sustainable development of small towns. This study’s findings reveal that the PCA–WQImin method identified four key water quality parameters essential for a comprehensive assessment of water quality across seasonal and spatial variations. The analysis revealed that the water quality in the investigated region remained at a “poor” level, with relatively consistent levels across the four catchments, ranked from poorest to best as the Xingchilong catchment area (29.61) < Jianxinpaigan catchment area (31.03) < Chilong catchment area (32.94) < Machangjian catchment area (39.61). This study revealed that the average WQImin values slightly increased in the wet season relative to those in the dry season. This research highlights the critical importance of effectively managing domestic rural sewage and aquaculture pollution to increase surface water quality in small towns. Pollution prevention policies and multiple sources of pollution evaluation will be considered the focus of future studies.
1. Introduction
In recent years, surface water pollution in small towns across China has intensified, driven by rapid urbanization and growing urban populations. A key contributing factor is the relocation of polluting industries from major cities to smaller towns, which has led to heightened levels of surface water contamination [1,2]. This environmental degradation has become a significant barrier to the sustainable development of small towns, underscoring the urgent need for effective surface water resource management. Central to such management efforts is the accurate identification and monitoring of water quality. Accordingly, it is essential to undertake objective assessments and comprehensive analyses of surface water quality and pollutant sources in small towns to support informed and sustainable policy interventions.
This study focuses on rivers in the town of Wangwenzhuang (WWZ), Xiqing District, Tianjin, China, which is characterized by a dense population and rapid urbanization. Tianjin, as the economic center of China’s Circum–Bohai–Sea Region, has experienced industries gradually relocating to small towns. Previous studies have focused primarily on simulating non-point source pollution or water pollution characteristics along the Duliujian River Basin [3,4]. In this study, the water quality at 30 monitoring sites along rivers was evaluated via the principal component analysis–minimal water quality index (PCA–WQImin) model. Compared with traditional water quality index (WQI) models, the PCA–WQImin model reduces the number of parameters required for assessment, making it more cost-effective and efficient while maintaining high accuracy in evaluating water quality [5,6,7]. Previous research has focused primarily on the Duliujian River Basin or the seagoing rivers within the Haihe River Basin, exploring aspects such as bacterial flora, sediment metabolic functions, phytoplankton community characteristics, eutrophication, and the spatial distribution of pollutants [8,9,10]. However, a significant gap persists in understanding the specific characteristics of water quality and pollution sources within small-town contexts. Research on river systems and the nature of pollution sources in these areas remains limited, thereby constraining the development of effective pollution control policies essential for promoting sustainable development. Accurate water quality assessment is critical for government agencies tasked with water environment protection and pollution mitigation. A range of analytical techniques and evaluation models have been applied in this domain, most of which are based on national and regional standards that emphasize fundamental physicochemical indicators [11,12,13]. The WQI model has been widely used over the past decade to assess river water quality [12,14,15]. It converts monitoring data into numerical values, serving as a measure of water quality [13,15]. Over 30 different WQI models have been utilized globally [12].
To reduce uncertainty and costs, some studies recommend cost-effective parameters for calculating the WQI, known as the minimal water quality index (WQImin) [13]. Identifying key parameters has become a primary research focus in enhancing the efficiency and reducing the analytical costs of the WQImin model. Utilizing PCA for parameter selection has led to reductions in parameter sets, such as from 28 to 9 for the Ganga River [16], 11 to 4 for groundwater in Jabalpur [17], and 20 to 7 for drinking water in Africa [18]. The strong correlation between WQI results enhances the feasibility and cost-effectiveness of the assessment process, substantially reducing the time, labor, and financial resources required to monitor samples across a broad spectrum of parameters. The primary objective of this study is to evaluate the water environmental quality of the WWZ rivers comprehensively using the PCA–WQImin model. This model was hypothesized to provide a more efficient and cost-effective assessment of water quality than traditional methods do in this study, while accurately identifying key pollution sources and their spatial and seasonal variations. By analyzing the spatial and seasonal distributions of water quality evaluation results through a geographic information system (GIS), this study aims to identify the underlying causes and extent of pollution in the rivers of the WWZ region. The findings are anticipated to support long-term environmental management, enhance economic prospects in small towns, and advance sustainable development goals. This research offers a practical and scientifically grounded framework for the quantitative analysis and management of surface water contamination in small-town settings, providing a more systematic approach to addressing this pressing environmental issue.
2. Materials and Methods
2.1. Study Area
The study area is located in Wangwenzhuang (WWZ), a small town in the southeastern part of the Xiqing District, Tianjin, China, spanning coordinates 38°51′ to 39°51′ N and 116°51′ to 117°20′ E, with a total administrative area of 116 km2 (Figure 1). Characterized by a temperate continental monsoon climate, the region experiences an average annual temperature of 13.6 °C, with over 75% of its annual precipitation occurring between June and September. The area features a dense river network comprising three secondary rivers—Jingang River (JG), Hongni River (HN), and Xingchilong River (XC)—as well as nine tributaries, including the Chilong River (CL), Dongpaigan River (DP), Jieliu River (JL), Jianxinpaigan River (JX), Machangjian River (MJ), Sanba River (SB), Xiaowu River (XW), Yuejin River (YJ), and Zhongxin River (ZX). In addition, five pumping stations have been constructed along the Duliujian River to facilitate flood drainage during the rainy season. The study area is further delineated into four catchment areas, namely, the Jianxinpaigan catchment area (JXCA), Xingchilong catchment area (XCCA), Chilong catchment area (CLCA), and Machangjian catchment area (MJCA), on the basis of the flow directions and locations of the pumping stations. Details on point source pollutant wastewater discharge and non-point source pollutant discharge are outlined in Table 1. Non-point source pollutants from crop agriculture predominantly occur in the MJCA and CLCA catchment areas, whereas aquaculture activities are concentrated in the XCCA and CLCA regions. Serving as a significant rice cultivation hub in Tianjin, cultivated land is the predominant land use type in WWZ. The rural domestic sewage in JXCA and XCCA is managed by small, centralized treatment facilities. Within the MJCA, 30 industrial enterprises operate (73.2%), with the majority involved in key polluting industries such as metal surface treatment, metal smelting and processing, and inorganic salt manufacturing. Notably, industrial and domestic wastewater discharges in this catchment area account for 94.96% and 88.11%, respectively. Municipal sewage treatment facilities adequately treat these discharges before release. However, the process of urbanization in WWZ has created numerous challenges for the water environment.
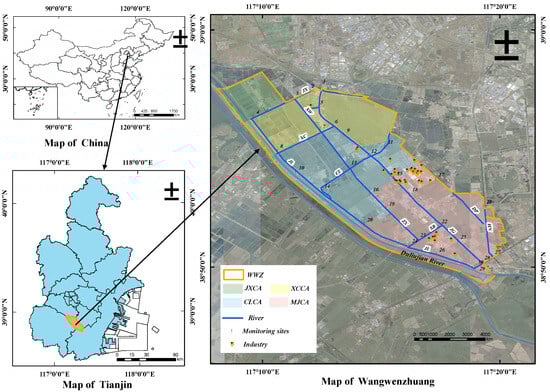
Figure 1.
Distribution of sampling sites and point source pollutants distribution in Wangwenzhuang, Tianjin, China.

Table 1.
The investigation of the source pollutants of the four catchment areas.
2.2. Sample Collection and Lab Analysis
Eight water quality parameters were selected for integrated analysis to comprehensively assess the pollution sources, contamination levels, and health conditions of the water bodies in this study area. Specifically, dissolved oxygen (DO), five-day biochemical oxygen demand (BOD5), the permanganate index (CODMn), and chemical oxygen demand (CODCr) were employed to evaluate organic pollution from domestic sewage and industrial discharges [19,20]. Nutrient indicators, including total nitrogen (TN), ammonium nitrogen (NH4+-N), and total phosphorus (TP), were used to characterize the nutrient status and eutrophication risk of water bodies [21,22]. Given the presence of industrial pollution sources in the study area, fluoride ions (F−) were specifically introduced as characteristic pollutant indicators to assess inorganic pollution. This parameter system is grounded in a robust scientific rationale and provides critical data support for pollution source apportionment and the formulation of urban water environment management strategies [23].
Seasonal sampling was conducted in 2022 during four periods: March 15–20, June 15–20, September 15–20, and November 15–20, covering both the dry season (March and November) and the wet season (June and September). A total of 30 monitoring sites were established, yielding 120 river water samples. The precise geographic coordinates of these sites were recorded using a GPS device (G120BD, Jisibao, Beijing, China) and are depicted in Figure 1. Sample collection, transportation, and storage strictly followed national guidelines, including the “Technical Guidance for Water Quality Sampling” (HJ 494–2009) [24], “Technical Regulations for the Preservation and Management of Water Samples” (HJ 493-2009) [25] and “Technical Specifications for Surface Water Environmental Quality Monitoring” (HJ 91.2-2022) [26]. Sampling was carried out under stable weather conditions (clear or overcast). In cases of rainfall, sampling was postponed for 48 h to eliminate the influence of runoff on water quality and to maintain the physicochemical stability of samples. Given that river depths in the study area generally did not exceed 5 m, the sampling depth was set at 0.5 m below the surface. If the water depth was less than 0.5 m, samples were collected at half the depth. DO was measured in situ. For BOD5 analysis, samples were rinsed 2–3 times, filled completely (eliminating headspace), and collected in volumes > 500 mL. Three replicates were taken per site, stored at 4 °C, and analyzed within 12 h. For TN, NH4+-N, TP, CODMn, and CODCr, samples were collected in glass bottles, pre-rinsed, filled with >500 mL, acidified to pH < 2 with sulfuric acid, stored at 4 °C, and analyzed within 24 h. For F− analysis, samples were collected in polyethylene bottles, pre-rinsed, filled with >250 mL, stored at 4 °C, and analyzed within 24 h. All procedures strictly adhered to standard protocols to ensure the accuracy and reliability of the data. The analysis of DO was conducted using a multiparameter portable meter (3630 IDS, MultiLine® Multi, Munich, Germany). CODMn was measured by the titration potassium permanganate oxidation method, and CODCr was measured via the dichromate method. The determination of BOD5 was performed by the dilution and seeding method, whereas the NH4+-N values were measured using Nessler’s reagent colorimetric method. TN values were obtained through the alkaline potassium persulfate digestion method, and the analysis of TP was carried out through the ammonium molybdate spectrophotometric method. Three parameters, NH4+-N, TN, and TP, were analyzed using a spectrophotometer (DR6000, HACH, Colorado, USA), whereas fluoride (F−) was analyzed using ion chromatography (PXSJ-216, Rex Electric Chemical, Shanghai, China). Notably, all the aforementioned test methods conform meticulously to the environmental quality standards for surface water (GB 3838–2002) [27].
2.3. Methods
2.3.1. Principal Component Analysis
PCA is the most frequently utilized multivariate statistical approach for identifying essential components [28]. It has been used in various cases of water quality assessment to identify effective pollutant factors [29,30]. The principal component was determined on the basis of a characteristic value higher than 1 and a cumulative contribution rate of nearly 80% [29]. Variable loadings on principal components (PCs) and variables are defined as weak (0.3–0.5), moderate (0.5–0.75), and strong (>0.75) [31]. All the variables were analyzed using Pearson’s correlation coefficient. The variable was excluded from the subsequent analysis process if it was extremely multicollinear (R ≥ 0.9) or if it was not significantly correlated with the other variables [32]. The applicability of the water quality parameters was analyzed using the Kaiser–Meyer–Olkin (KMO) test and Bartlett’s sphericity test (p) before performing PCA. In general, a KMO value above 0.5 and a p-value below 0.05 indicate that the analysis result is appropriate [29,33].
For most parameters, higher concentrations indicate more severe levels of pollution. However, DO functions as a special indicator, where higher values represent better water quality. A range normalization method was applied to standardize the indices to address differences in the thresholds and units of measurement across parameters. Specifically, the calculation of DO was determined by the following equation:
where is the normalization parameter, and is the measured concentration.
The environmental parameter data used in the PCA were standardized to eliminate the influence of variable weights on the computations. All datasets were adjusted to meet the assumptions of normality and homogeneity of variance. Statistical analyses were conducted using Excel 2019, SPSS 25.0, and Origin 2021.2.3.2 WQImin calculation.
2.3.2. WQImin Calculation
The WQImin model, which considers parameter weights determined by the PCA method, was employed to assess water quality. The expression of the WQImin mode is as follows:
where WQImin is the integrated score for water quality, n indicates the overall count of the key water quality parameters selected via PCA, Ci represents the normalized factors of parameter −th, and Pi represents the relative weight assigned from 1–4 to each parameter.
On the basis of standards for surface water [27], the normalization values in the WQImin were adopted and revised, as presented in Equation (3).
where is the actual concentration of the -th parameter; and are the standard thresholds for the -th parameter at levels and , respectively; is the standard normalization value for the parameter classification (Table 2); and is the number of equal thresholds, with = 1 if no equal threshold exists.
Table 2.
Normalization values and weights of water quality parameters for the WQImin calculation, in accordance with standards for surface water [27].
The WQImin score ranges from 0 to 100, with high values suggesting good water quality conditions. The water quality was categorized into five categories on the basis of the WQI values: very poor (0–20), poor (21–40), moderate (41–60), good (61–80), and excellent (81–100), which meet the actual water quality management standards in China.
2.3.3. Statistical Analysis
All statistical analyses were performed using MATLAB 10.2, Excel 2019, and Origin 2021, while spatial modeling and visualization of WQImin evaluation results and water pollutant concentrations were conducted using the Spatial Analyst tool in ArcGIS 10.3. The proportion of missing data was less than 1% of the total dataset. Given this minimal proportion, which is unlikely to significantly influence the overall analysis, missing values were directly excluded during the statistical processing. Boxplots and scatterplots were employed to visualize data distribution and to identify outliers or extreme values. Identified outliers were categorized based on their origin: those resulting from measurement errors or data entry mistakes were removed, whereas biologically or environmentally plausible outliers, such as those caused by extreme weather events or natural ecosystem variability, were retained to preserve the scientific validity and completeness of the results.
3. Results and Discussion
3.1. Statistical Characteristics of the Water Quality Factors
Table 3 provides a statistical summary of the annual and seasonal mean concentrations of eight basic water quality indices, and Figure 2 displays comparisons of the dry and wet seasons of the indices for the 12 rivers. In general, river water quality was influenced by stream flow, with seasonal variation and human activities. The DO concentration ranged from 1.67 to 8.8 mg·L−1, with an annual mean concentration of 5.99 ± 1.33 mg·L−1, which was close to the Class II standard of 6 mg·L−1, suggesting a stable aquatic ecosystem in the study area. The TN annual mean concentration was relatively high at 4.44 ± 4.58 mg·L−1, exceeding the Class V standard limit of 2 mg·L−1 by at least 2.44 mg·L−1. The annual mean TP concentration approached the Class V standard limit of 0.4 mg·L−1. The TN and TP concentrations in the WWZ river system ranged widely from 0.54 mg·L−1 to 16.2 mg·L−1 and 0.08 mg·L−1 to 2.66 mg·L−1, respectively, indicating significant seasonal variability, with peak concentrations in the dry season. The highest TN and TP concentrations were observed in the ZX (14.78 mg·L−1) and DP (1.21 mg·L−1) rivers, respectively. F− presented a mean concentration of 1.05 ± 0.36 mg·L−1 in the dry season, which was slightly higher than that in the wet season (0.86 ± 0.26 mg·L−1). River ZX, DP, CL, and XC presented relatively high F− concentrations during the dry season. The NH4+-N, BOD5, CODMn and CODCr had mean concentrations of 0.38 ± 0.24 mg·L−1, 5.23 ± 2.2 mg·L−1, 7.67 ± 3.84 mg·L−1, and 28.13 ± 13.33 mg·L−1, respectively, meeting the Class V standard limits, with higher average concentrations observed in the wet season than in the dry season. These pollutants are typically associated with anthropogenic activities such as domestic waste discharge and open defecation [30]. The increases in river pollutant concentrations during the rainy season can be attributed to direct runoff from tributaries. Furthermore, industrial and non-point sources contributed to the TN, TP, and F- concentrations within the river buffer zone. Notably, the seasonal trends in the TN, TP, and F- concentrations contrasted with those of the aforementioned pollutants, with rainy season peaks possibly due to rainwater and sewage mixing.
Table 3.
Statistical results of water quality parameters summarized as the mean and standard deviation for the surface water samples in WWZ (s.d.: standard deviation).
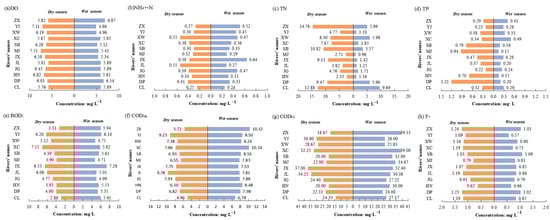
Figure 2.
Dry season and wet season comparisons for 12 rivers’ distribution characteristics: (a) DO, (b) NH4+-N, (c) TN, (d) TP, (e) BOD5, (f) CODMn, (g) CODCr, and (h) F− during 2022. Where Zhongxin River (ZX), Yuejin River (YJ), Xiaowu River (XW), Xingchilong River (XC), Sanba River (SB), Machangjian River (MJ), Jianxinpaigan River (JX), Jieliu River (JL), Jingang River (JG), Hongni River (HN), Dongpaigan River (DP) and Chilong River (CL).
Figure 3 shows the spatial distribution characteristics of eight water quality parameters at the WWZ river monitoring sites via ArcGIS 10.3. The results revealed significant spatial heterogeneity in DO concentrations across the study area, with notably lower DO levels along Rivers JG and JX in MJCA. Specifically, the DO concentrations at sites 2, 12, and 26 were all less than 5 mg·L−1 (Class III water quality standard). The spatial distribution of TN indicated that about two-thirds of the monitoring sites had average TN concentrations exceeding 2.0 mg·L−1 (Class V water quality standard), with sites 12, 13, 15, and 23 exhibiting particularly high TN levels, all above 10 mg·L−1. Notably, at site 15, the average TN concentration was 14.28 mg·L−1, which was 7.14 times greater than the Class V standard. Concurrently, F− concentrations at these sites were also relatively high. Further analysis revealed that the TN and F− concentrations at the CLCA monitoring sites were significantly higher than those in the other catchment areas, which was closely associated with the spatial distribution of the industrial zones, indicating that industrial discharge was the primary cause of the elevated TN and F− levels in this region.
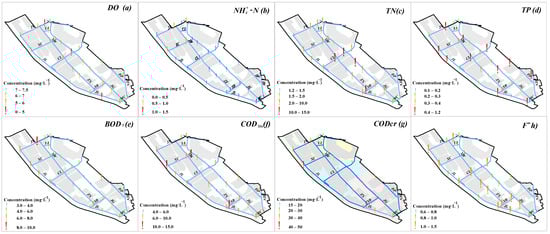
Figure 3.
Spatial comparisons of water quality indices distribution characteristics of mean value: DO (a), NH4+–N (b), TN (c), TP (d), BOD5 (e), CODMn (f), CODCr (g), and F− (h) of the 12 rivers during 2022.
In terms of the distributions of TP and TN, their concentrations were generally greater in the CLCA and MJCA regions than in the other regions, which is consistent with the distributions of the fishponds and paddy fields in these areas. Studies have shown that fishpond effluents and paddy field drainage release substantial amounts of pollutants into the surrounding environment, significantly impacting the TN and TP concentrations in regional river sections [34,35]. Among these sites, site 18 presented the highest TP concentration, with an average of 1.20 mg·L−1, three times the Class V surface water quality standard (0.4 mg·L−1). In addition to agricultural non-point source pollution, this site is also influenced by discharges from nearby industrial areas.
The spatial distributions of NH4+-N, BOD5, CODMn, and CODCr exhibited similar patterns, with relatively high concentrations observed at the JXCA and XCCA monitoring sites. This was attributed primarily to the river JL receiving drainage from upstream villages and towns, coupled with the reliance on small-scale centralized facilities for rural domestic wastewater treatment, resulting in significant variability in effluent quality compared with municipal wastewater treatment plants [36]. Notably, site 3 exhibited the highest concentrations of NH3-N and BOD5 within the study area, reaching 0.78 mg·L−1 and 8.2 mg·L−1, respectively. Field investigations indicated that this site was heavily influenced by domestic sewage discharge from nearby villages and towns. Additionally, small-scale poultry farming in the surrounding area significantly contributed to elevated levels of NH3-N and BOD5, highlighting the combined effect of residential and agricultural pollution sources.
3.2. Water Quality Assessment Results
3.2.1. Pearson Correlation Coefficients
To enhance the accuracy of the analytical process, a variable exhibiting no significant correlation with the other indicators was excluded from further analysis [31,37]. Pearson’s correlation coefficient results, results, as shown in Figure 4, revealed several noteworthy patterns among the eight water quality parameters. Strong positive correlations (p ≤ 0.001) were observed among NH4+-N, CODMn, CODCr, and BOD5. Specifically, CODCr and BOD5 exhibited a significant positive correlation (r = 0.768, p ≤ 0.01), indicating that the organic pollutants in the water bodies of the study area share common sources. F− was significantly positively correlated with TN, CODMn, NH4+-N, and TP (p ≤ 0.01). Given that F− originates primarily from industrial wastewater, it was preliminarily inferred that industrial wastewater has a certain effect on TN, CODMn, NH4+-N, and TP in the region. Additionally, the positive correlation coefficients between TP and CODMn (0.263) and CODCr (0.195) suggested that phosphorus pollution may co-occur with organic contaminants, likely originating from rural domestic sewage and agricultural non-point source runoff. A significant negative correlation was observed between CODCr and TN (r = −0.235, p ≤ 0.01), leading to the preliminary hypothesis that the primary source of nitrogen in the water bodies of the study area is inorganic nitrogen (e.g., agricultural fertilizers or industrial wastewater), which may simultaneously dilute organic pollutants in the water. TN was negatively correlated with DO (r = −0.089), likely because of the consumption of dissolved oxygen during the oxidation of nitrogen in the water. Similarly, the weak negative correlations among CODMn and DO, CODMn and TN, and TN and BOD5 (p ≤ 0.05) further support this conclusion. These relationships indicated that rural sewage discharge is a primary contributor to both organic and nutrient pollution in surface waters. This underscores the urgent need to strengthen sewage treatment infrastructure and implement effective non-point source pollution control measures to enhance overall water quality. Therefore, all the variables were considered key indicators of water quality and were retained for further analysis. Multiple collinearity tests were conducted on all the correlation coefficients, and the results revealed that none of the correlation coefficients in this study exceeded 0.9, so we retained all eight variables for subsequent analysis.
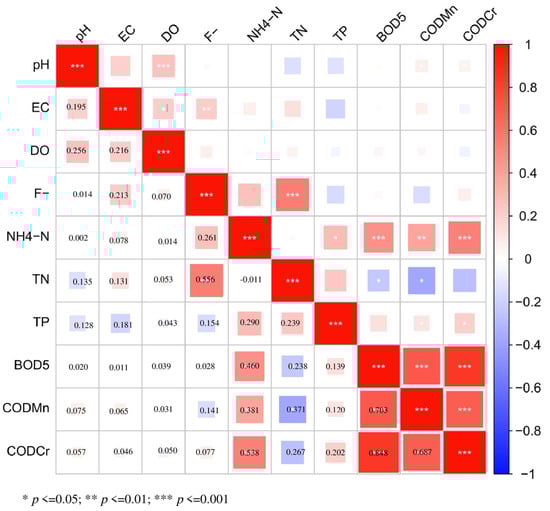
Figure 4.
Pearson correlation coefficients of the water quality indicators.
3.2.2. Results of Principal Component Analysis
In this study, a standardized set of eight variables was employed to perform PCA. The KMO and Bartlett’s sphericity tests were used to assess the applicability of these water quality parameters to PCA. The KMO value of 0.657 and the p-value of 0.000 from Bartlett’s sphericity test indicated good relationships among the parameters, establishing the data’s suitability for PCA. Following maximum variance rotation, four factors were identified that collectively explained 76.83% of the total variance. The loadings of each parameter on each rotation factor are detailed in Table 4. The first principal component (PC1), which was responsible for 34.81% of the variance, exhibited robust positive loadings (>0.75) for BOD5, CODMn, and CODcr, as illustrated in Table 4. In our study area, sampling sites exhibiting relatively high concentrations of BOD5, CODMn, and CODcr were primarily situated along the JL River of JXCA and XCCA, reflecting pollutants from rural domestic sewage sources [30]. This relationship led us to interpret PC1 as representing a domestic sewage factor. Significant positive correlations (p ≤ 0.001) were observed among BOD5, CODMn, and CODCr, with correlation coefficients ranging from 0.510 to 0.768 (Figure 4). Among these, CODCr emerged as the dominant pollutant, exhibiting the highest positive loading (0.93) on PC1, thus serving as a key indicator of domestic sewage pollution. In contrast, the second principal component (PC2) showed a strong positive loading for F− (0.84) and a moderate positive loading for TN (0.64), suggesting an alternate source of contamination. The average concentration of F− ranged from 0.62 mg·L−1 to 1.17 mg·L−1. Based on the investigation results, the key polluting industries identified were the metal surface treatment industry, the metal smelting and calendering processing industry, and the inorganic salt manufacturing industry. The water samples with relatively high F− values were predominantly found downstream of factories in the study area. TN, with a strong positive loading of 0.86 on PC3, accounting for 14.13% of the total variance, exhibited significant spatial variability. Two-thirds of the sampling sites exceeded the national Class V standards, as presented in Table 3. Comparatively, the TN and F− levels at the monitoring sites within the CLCA exceeded those in the other catchment areas, indicating similar spatial distributions. Thus, PC2 and PC3 can be explained as industrial wastewater. The fourth principal component (PC4), which accounted for 12.33% of the total variance, was characterized by a strong positive loading of TP (0.86). Previous studies have suggested that high percentages of nutrients possibly originate from agricultural land [37,38]. These findings indicate that aquaculture wastewater effluents are a significant source of TP. Therefore, PC4 can be interpreted as being related to agricultural and aquaculture wastewater. In contrast, F- and TN were identified as the main pollutants for PC2 and PC3, respectively. According to the PCA results, the WQImin method proposed in this study for the WWZ study area consisted of four key water quality parameters: TP, TN, CODcr, and F−. The results demonstrated that these parameters performed exceptionally well in evaluating water quality.
Table 4.
Loading coefficient matrix of the principal component, eigenvalue, percentage of variance, and cumulative percentage variance.
3.2.3. Water Quality Assessment Results Based on the WQImin
According to the evaluation results, the mean WQImin of the water samples in WWZ was 34.8, with the overall water quality being categorized as “poor”. Despite four catchment areas being classified as “poor”, the WQImin values across all 30 sampling sites varied significantly (see Figure 5a). Specifically, 73.3% (22/30) of the stations were rated as “poor” on the basis of the average WQImin results and were mainly observed in the CLCA. Moreover, 23.3% of the sampling sites presented “moderate” water quality and were predominantly situated in the MJCA. When the four catchment areas were ranked in terms of WQImin results, the order from worst to best was XCCA (29.61) < JXCA (31.03) < CLCA (32.94) < MJCA (39.61). The investigation and monitoring results revealed that (1) the catchment area with the worst water quality was XCCA, as indicated by its WQImin scores being very similar to those of JXCA but with a much lower degree of dispersion. Site 8 in XCCA had a WQImin value of 18.0, indicating “very poor” water quality, and was located at the confluence of XC and JL (Figure 5b). The mean concentrations of TN, TP, CODCr, and F− at site 8 were 2.18 mg·L−1, 0.62 mg·L−1, 45.00 mg·L−1, and 1.15 mg·L−1, respectively, with three of these values exceeding the Class V standard limit, except for F−. Rural domestic sewage from small, centralized treatment facilities was found to be the main source of surface water pollution in the catchment area, which was attributed to significant effluent fluctuations [36]. According to Table 1, 36.18% of agricultural and 0.01% of industrial wastewater discharges were identified in XCCA, highlighting the presence of aquaculture non-point sources as a significant contributor to pollution in this catchment area. (2) Table 1 shows that the proportions of point sources and non-point sources were considerably lower in JXCA than in XCCA. The WQImin result for JXCA was slightly better than that of XCCA. The CODCr concentration, which signifies pollution from human activities, was greater at sites 3 and 4 than the average concentration (28.13 ± 13.33 mg·L−1) of WWZ. This indicated that the discharge of rural domestic sewage was the primary pollution source at XCCA and JXCA and was predominantly concentrated near sites 3 and 4 along the JX River. (3) XCCA had the lowest WQImin value and the worst water quality. The WQImin values in XCCA and JXCA were significantly close, while the dispersion degree of MJCA was higher than that of XCCA, suggesting more noticeable differences in the degree of contamination among the sampling sites. The catchment area under study was found to be surrounded by non-point pollution sources from aquaculture. The evaluation results of JXCA revealed a low degree of dispersion, with average WQImin values for sites 10, 11, and 13 being 24.5, 29.2, and 27.8, respectively. The concentrations of TP (0.42–0.91 mg·L−1) and TN (2.85–12.03 mg·L−1) were higher than the Class V standard limits of these sampling sites, indicating that water pollution likely originated from aquaculture non-point sources within the catchment area. (4) Compared with CLCA, MJCA had superior water quality. According to the survey findings, 94.97% and 88.11% of the wastewater in MJCA originated from industrial effluent and domestic sewage, respectively. These point-source pollutants are conveyed to the sewage treatment plant through the municipal pipeline network and are subsequently discharged into the aquatic environment following treatment. Although point-source pollution constitutes a substantial proportion of the total pollutant load, its impact on the broader catchment area appears to be limited, likely due to the mitigating effects of wastewater treatment processes.
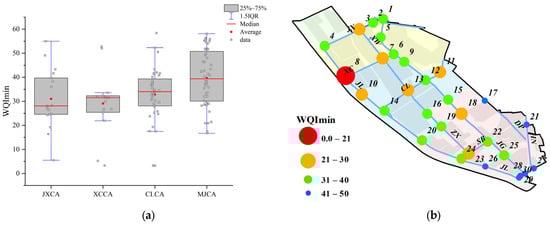
Figure 5.
Spatial variations (a) and spatial distribution characteristics (b) of WQImin values in the 4 catchment areas (JXCA, XCCA, CLCA, and MJCA) of WWZ.
As shown in Figure 6, the water quality exhibited distinct seasonal variation, with higher WQImin values observed in the wet season (mean value of 36.86) and lower values in the dry season (mean value of 32.40). In the dry season, 25 sampling sites were classified as “poor”, whereas 22 sampling sites were classified in the wet season (Figure 6a,b). The analysis in Figure 6c indicated a wider spread of WQImin values and a higher median in the wet season, suggesting better water quality during this period. During the wet season, the WQImin values at 21 monitoring sites improved. Furthermore, the classification results demonstrated that the average WQImin values at sites 5, 17, 26, and 29 increased, leading to an increase in water quality classification from “bad” to “moderate”, whereas those at sites 8 and 10 improved from “very bad” to “bad”. The WQImin values at sites 5, 17, 26, and 29 showed improvement in water quality, rising from the “bad” to the “moderate” category, while sites 8 and 10 improved from “very bad” to “bad”. Among these, site 8 demonstrated the most substantial increase in WQImin, with the wet season value (31.8) being about seven times higher than that recorded during the dry season (4.4). During the dry season, site 8 exhibited notably elevated concentrations of CODCr and TP, measured at 60.5 mg·L−1 and 0.90 mg·L−1, respectively, at least 40 mg·L−1 and 0.5 mg·L−1 higher than their respective wet season values. Notably, the temperature during the wet season was significantly higher than that during the dry season. Recent studies have demonstrated that low temperatures can significantly reduce the treatment capacity and overall efficiency of centralized wastewater treatment facilities. This suggests that pollution sources in the vicinity of these facilities may be associated with the discharge of rural domestic sewage by nearby residents. Conversely, during the wet season, WQImin values declined at nine sites, with site 19 showing a particularly marked decrease. Its WQImin value dropped from 46.9 in the dry season to 23.3 in the wet season. The TN concentration at site 19 was significantly different, with a mean concentration of 3.35 mg·L−1 in the wet season, which was 2.46 times higher than that in the dry season (1.36 mg·L−1) and did not meet the Class V water quality standard. In addition, numerous fishponds have been developed around the CLCA, and their drainage is discharged directly into adjacent water bodies during the wet season. As a result, the water quality at site 19 is particularly vulnerable to the influence of fishpond effluent, which significantly degrades the overall water quality of the river at this location.
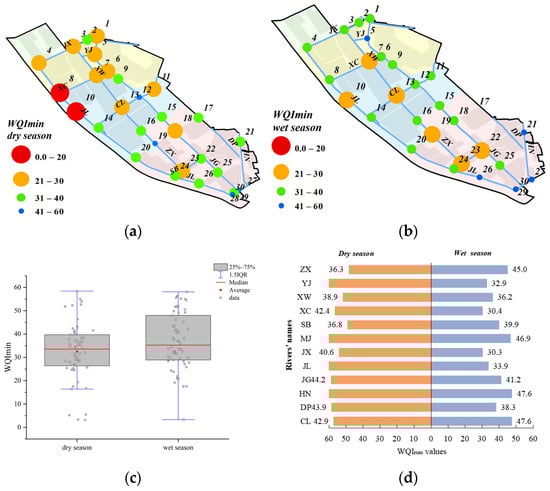
Figure 6.
Spatial distribution characteristics of WQImin values in dry season (a), wet season (b), seasonal variations (c), and rivers’ seasonal variations (d) in WWZ.
Figure 6d shows significant seasonal variations in river WQImin values between the dry and wet seasons. Most rivers (e.g., JL, JX, XC, and YJ) present relatively high WQImin values in the dry season, with differences ranging from 10.3 to 13.8, suggesting reduced flow or increased WQImin values. Conversely, rivers such as CL and ZX had higher values in the wet season, which is likely due to increased runoff or dilution effects. The mean dry season WQImin value (43.6) was greater than that in the wet season (38.9), indicating a general trend of seasonal influence. A paired t-test was conducted to compare the seasonal variations between the dry and wet seasons across the 12 rivers. The mean dry season value (43.6 ± 5.2) was significantly greater than the wet season value (38.9 ± 6.8) (mean difference = 4.7, t(11) = 2.5, p = 0.02). The normality of the differences was confirmed via the Shapiro–Wilk’s test (W = 0.92, p = 0.25). These results indicated statistically significant seasonal variation, with higher WQImin values observed during the dry season. This analysis highlights the influence of seasonal changes on WQImin values and the need to account for temporal variability in environmental studies.
3.3. Discussion
3.3.1. Parameter Selection for WQImin Establishment
This study aimed to evaluate the water quality of WWZ by testing eight physico-chemical parameters, DO, TN, NH4+-N, TP, CODMn, CODCr, BOD5, and F−, at 30 sampling stations in different seasons. The spatial distributions of these parameters were analyzed via geographic information systems to understand the characteristics of their spatiotemporal distributions.
Using the PCA–WQImin analysis method, four primary pollution factors were identified for water quality assessment, facilitating rapid evaluation and cost reduction. This approach has been widely adopted in comprehensive assessments of surface water quality across various aquatic environments [29,36,39]. Compared with other methods, the main advantage of PCA–WQImin is that it can better recognize effective pollutant factors across the study area.
This present study applied PCA–WQImin to evaluate the water quality of the WWZ. It comprised four critical parameters, including TP, TN, CODcr, and F−, that can best reflect the water quality of the study area and are usually associated with anthropogenic activities. These four crucial parameters were TP, TN, CODcr, and F−. They accurately reflected the water quality in the research area, with direct links to anthropogenic activities. TP and TN, recognized as key nutritional indicators of water quality, significantly influence the overall quality of rivers and reservoirs [40]. The contamination caused by chemical fertilizers, agricultural wastes, and livestock manure plays a major role in increasing the levels of these parameters in water bodies [41,42]. In this study area, the main source of TP pollution was non-point sources, as evidenced by the sites surrounded by fish ponds and rice fields exhibiting relatively high TP concentrations. Sampling sites with elevated TN concentrations in the WWZ study area were primarily located near industrial sources, including metal surface treatment, smelting, and calendaring operations. These industrial activities may partially explain the high TN levels observed in local rivers. Furthermore, the spatial distribution of TN closely mirrors that of F−, suggesting a potential common source of pollution for both parameters. Previous studies have indicated that elevated concentrations of F− in riverine or surface waters are predominantly linked to the dissolution of fluoride-bearing minerals, effluent discharge, and atmospheric deposition [43,44]. The CODCr level indicates organic matter pollution, which mostly originates from domestic discharge [30]. During the evaluation process of WQImin, the scientific screening of parameters poses a challenging task. In this study, we utilized the PCA method to screen out the primary factors of WQImin. Our findings revealed that PCA–WQImin was more representative than manually determined primary factors. This approach effectively circumvents the subjective influence inherent in the manual determination process. Thus, our recommendation is to consider the application of PCA–WQImin, which demonstrated excellent performance in the WWZ study area.
3.3.2. Analysis of Water Quality Characteristics and Their Impact Sources
The distribution of the PCA–WQImin in the WWZ region is illustrated in Figure 5. The WQImin values for all the sampling points fell within the range of 18.0 to 50.7. The water quality classification indicated that 3.3% of the sampling points were rated as “very poor”, 73.3% as “poor”, and 23.3% as “moderate”. The mean WQImin value was 34.8, which was near the lower limit of the “poor” level. In terms of spatial distribution, there was no significant variation in water quality among the four catchments. The order from worst to best was XCCA (29.61) < JXCA (31.03) < CLCA (32.94) < MJCA (39.61). The worst water quality conditions were identified at site 8, which was located at the confluence of rivers XC and JL. This site suffers from poor water quality because of the effluent from small, centralized treatment facilities. Rural domestic sewage, characterized by large and scattered discharges with complex components, exacerbates this problem [36]. A comparison with surface water standards [27] revealed that the Discharge standard of water pollutants for rural sewage treatment facilities of Tianjin [45] sets higher limits for TN, TP, and CODcr than do the national surface water standards. The continuous discharge of rural sewage contributes to elevated levels of these pollution indicators. Additionally, the overdesign of treatment facility capacity may exacerbate contamination, as underutilization can create suboptimal conditions for microbial activity, thereby reducing treatment efficiency [36]. Seasonal variations in water quality were evident, as illustrated in Figure 6. WQImin values were generally higher during the wet season, with 70% of sampling sites exhibiting improved water quality compared to the dry season, while the remaining 30% showed a decline in quality. The data indicated that both point and non-point source pollution exhibit distinct seasonal patterns. Notably, the performance of small, centralized treatment facilities was significantly affected by low temperatures, which may be a key factor contributing to rural domestic sewage pollution during colder periods. The discharge of untreated aquaculture wastewater may lead to chronic increases in nitrogen and phosphorus levels. These findings further support the idea that high concentrations of TP and TN are linked to nutrient use in aquaculture production processes [46]. These findings suggested that fishpond drainage is the primary cause of degraded water quality in the wet season.
The analysis results of JXCA clearly revealed that the area surrounding sampling site 13 was predominantly an aquaculture zone, where the TN concentration was relatively high at 12.03 mg·L−1, with an average WQImin value of 27.8. Furthermore, as illustrated in Figure 2, the TN concentrations along the XC and XW Rivers, which are primarily associated with aquaculture activities, exhibited significant fluctuations between the dry and wet seasons, with notably higher TN levels during the dry season. This phenomenon is closely linked to the discharge of high-concentration wastewater during pond cleaning activities, further substantiating the earlier hypothesis regarding the sources of wastewater in the JXCA area. According to the Emission Requirements for Freshwater Pond Aquaculture (SC/T9101-2007) [47], the TN discharge limit for general water bodies is ≤15.0 mg·L−1. However, TN concentrations in the environmental water bodies of this region approached this threshold and significantly exceeded the Class V surface water standard of 2 mg·L−1 [27]. These findings highlighted the considerable impact of freshwater pond aquaculture on TN levels, especially given the dense and contiguous distribution of fishponds in the area. Therefore, it is essential for the WWZ region to strengthen the management of aquaculture tailwater discharge in order to mitigate its detrimental effects on the local aquatic environment.
3.3.3. Impact of Water Quality on the Regional Economy and Society
The economy of the study area relies primarily on rice cultivation and aquaculture. With the advancement of agricultural technologies, the region has progressively adopted a facility-based agricultural model characterized by “interconnected points, interwoven lines, and aggregated surfaces”. However, both paddy field irrigation and aquaculture demand high water quality standards, as regional water conditions directly influence irrigation practices, crop yields, and aquaculture profitability. Agricultural irrigation runoff, along with the infiltration of pesticides and fertilizers into surface water bodies by overland flow and subsurface pathways, poses a significant risk of regional water pollution. Such pollution threatens the long-term sustainability of food production and introduces considerable risks to freshwater aquaculture, thereby jeopardizing the stable development of the regional economy. To address these challenges, it is recommended that the study area adopt integrated ecological engineering solutions to establish a non-point source pollution treatment system. This approach can effectively regulate large-scale irrigation runoff and aquaculture tailwater, mitigating pollutant discharge into water bodies. In turn, it supports the sustainable development of agriculture and aquaculture, ensuring the continued stability and growth of the regional economy.
3.3.4. Improving Water Quality Management in the Future
The major causes of contamination in the WWZ rivers were the discharge of rural domestic wastewater from small, centralized treatment facilities and untreated wastewater from fishponds. This contamination led to an increase in the concentrations of physicochemical parameters and a decrease in WQImin values. To address these issues and improve the water quality of the WWZ rivers, the following suggestions for water quality management are proposed:
Improving water quality is closely linked to strengthening the management of rural domestic sewage, where the operation and maintenance of decentralized domestic sewage treatment facilities are crucial for the effective control of rural sewage [48]. Given that the effluent quality of rural decentralized domestic sewage treatment facilities is affected by various factors, including climatic conditions, the level of operation and maintenance (O&M) management, and the specific technical processes employed, the following comprehensive measures are recommended to balance treatment efficiency with economic feasibility. First, the reuse of treated wastewater for purposes such as agricultural irrigation, landscaping, or scenic water applications should be promoted. This approach not only facilitates the recycling of water resources but also reduces environmental pollution and alleviates the pressure on freshwater demand. Second, facilities should be upgraded with modular designs to allow flexible adjustment of treatment capacity at the village scale, thereby reducing initial investment costs and improving system adaptability and maintainability [49]. High-efficiency, low-energy treatment technologies, such as small-scale constructed wetlands and integrated treatment systems, should be adopted to ensure stable and regulatory-compliant effluent quality. Additionally, the establishment of a community-based operation and maintenance (O&M) management mechanism is essential. This system should be supported through a combination of government funding and social capital investment to ensure the long-term stability and effective functioning of decentralized domestic sewage treatment facilities, thereby improving overall treatment efficiency [50,51].
Aquaculture sewage pollution, a significant non-point source of pollution in the WWZ, has been identified as a key contributor to water quality degradation. The high density of aquaculture ponds in the region has led to the accumulation of substantial amounts of uneaten feed and manure in pond sediments. These excess pollutants are often discharged directly into adjacent water bodies without adequate treatment, posing a significant threat to the ecological integrity of aquatic ecosystems [46]. Currently, aquaculture tailwater treatment in the WWZ area, which is predominantly characterized by pond-based aquaculture, relies on a combination of traditional methods and ecological engineering technologies. Common practices include natural sedimentation, mechanical treatment, and artificial interception. To further enhance tailwater treatment efficiency and improve overall water quality, restoration of the ecological balance of aquatic environments through the enhancement of natural self-purification processes is recommended. Specific interventions include the cultivation of aquatic plants (e.g., reeds) and the introduction of filter-feeding organisms (e.g., bivalves), which can absorb and degrade organic matter, nitrogen, phosphorus, and other nutrients from the tailwater [52,53]. Additionally, the construction of artificial wetlands can leverage the synergistic effects of plant uptake and microbial decomposition to further reduce pollutant concentrations in aquaculture effluent [54]. Moreover, local governments should establish and improve tailwater discharge standards and monitoring systems, promote green aquaculture models, reduce pollution at the source, ensure the long-term stability of treatment effectiveness, and achieve sustainable development in aquaculture.
Although the PCA–WQImin evaluation results present clear characteristics of the water quality of the WWZ water, there is a lack of evaluation of the pollution source. To ensure the long-term sustainability of the project, future efforts should include a comprehensive investigation of pollution sources in conjunction with systematic monitoring of pollutant emissions. By integrating diverse data types, policymakers can more effectively prioritize pollution prevention strategies and develop targeted environmental management policies based on robust scientific evidence.
4. Conclusions
In this study, the water quality status of the WWZ rivers in 2022 was examined, and the spatiotemporal variations in eight parameters were analyzed. A methodology known as the PCA–WQImin was developed to assess water quality in the WWZ region. This approach enabled the identification of key water quality parameters and facilitated a comprehensive evaluation of water quality across both seasonal and spatial dimensions. The main conclusions drawn from this analysis are as follows:
The PCA–WQImin evaluation method was integrated with geographic information system (GIS) technology to analyze the spatial distribution and water quality characteristics of the study area. Developed as a water quality evaluation method that builds upon the WQI model by employing PCA, PCA–WQImin objectively identified four key parameters (TP, TN, CODcr, and F−) and economically evaluated the spatiotemporal variations in water quality in the WWZ study area.
The water quality of the study area remained at a “poor” level, as indicated by the mean WQImin values ranging from 18.0 to 50.7 across different stations and seasons. Although the water quality did not significantly vary among the four catchments, the ranking from worst to best was XCCA (29.61) < JXCA (31.03) < CLCA (32.94) < MJCA (39.61). Furthermore, the mean WQImin values were slightly greater during the wet season (36.86) than during the dry season (32.40).
Ensuring the quality of the surface water environment is of critical importance, as emphasized in this study. Effective control of rural domestic sewage and aquaculture effluent is essential for achieving this objective. Future research will focus on the development of pollution prevention policies and the comprehensive evaluation of multiple pollution sources to support more effective environmental management strategies. These efforts aim to increase the environmental management efficiency of WWZ water quality.
This study provides informative data, useful models, and methods for water quality management in the WWZ, offering a reference for similar projects. Determining key water quality parameters and improving the efficiency of water quality evaluation are essential steps. Thus, investigating pollution sources and quantifying the amount of contamination they release is crucial for future studies. Such quantification can support decision-makers in prioritizing pollution prevention efforts and formulating more scientifically informed and targeted environmental management policies.
Author Contributions
Conceptualization, H.Y.; methodology, H.Y. and Y.T.; software, H.Z. and S.H.; validation, S.H. and H.Z.; investigation, H.Z.; resources, S.H.; data curation, J.L. and H.Z.; writing—original draft preparation, H.Y.; writing—review and editing, H.Y.; visualization, J.L.; supervision, H.Z. and H.Y.; project administration, J.L.; funding acquisition, J.L. All authors have read and agreed to the published version of the manuscript.
Funding
The work was jointly supported by grants from the Tianjin Government Procurement Project (SZTJ-GK-2021-026), the Revision Plan of the Local Standard System (2022-41), and the National Natural Science Foundation of China (No. 52270151).
Institutional Review Board Statement
This study did not involve human participants, animal subjects, or any data requiring ethical approval.
Informed Consent Statement
Not applicable.
Data Availability Statement
Data are contained within the article. The original contributions presented in this study are included in the article Further inquiries can be directed to the corresponding author(s).
Conflicts of Interest
The authors declare that they have no known competing financial interests or personal relationships that could have influenced the work reported in this paper.
References
- Wang, X.; Liu, S.; Sykes, O.; Wang, C. Characteristic development model: A transformation for the sustainable development of small towns in China. Sustainability 2019, 11, 3753. [Google Scholar] [CrossRef]
- Wu, Y.; Chen, Y.; Deng, X.; Hui, E.C.M. Development of characteristic towns in China. Habitat Int. 2018, 77, 21–31. [Google Scholar]
- Liu, X.; Li, G.; Liu, Z.; Guo, W.; Gao, N. Water pollution characteristics and assessment of lower reaches in Haihe River Basin. Procedia Environ. Sci. 2010, 2, 199–206. [Google Scholar]
- Sun, X.; Zhang, H.; Zhong, M.; Wang, Z.; Liang, X.; Huang, T.; Huang, H. Analyses on the Temporal and Spatial Characteristics of Water Quality in a Seagoing River Using Multivariate Statistical Techniques: A Case Study in the Duliujian River, China. Int. J. Environ. Res. Public Health 2019, 16, 1020. [Google Scholar]
- Nong, X.; Shao, D.; Zhong, H.; Liang, J. Evaluation of water quality in the South-to-North Water Diversion Project of China using the water quality index (WQI) method. Water Res. 2020, 178, 115781. [Google Scholar]
- Hammoumi, D.; Al-Aizari, H.S.; Alaraidh, I.A.; Okla, M.K.; Assal, M.E.; Al-Aizari, A.R.; Moshab, M.S.; Chakiri, S.; Bejjaji, Z. Seasonal variations and assessment of surface water quality using water quality index (WQI) and principal component analysis (PCA): A case study. Sustainability 2024, 16, 5644. [Google Scholar] [CrossRef]
- Fatima, S.U.; Khan, M.A.; Siddiqui, F.; Mahmood, N.; Salman, N.; Alamgir, A.; Shaukat, S.S. Geospatial assessment of water quality using principal components analysis (PCA) and water quality index (WQI) in Basho Valley, Gilgit Baltistan (Northern Areas of Pakistan). Environ. Monit. Assess. 2022, 194, 151. [Google Scholar]
- Liu, J.-Y.; Feng, Y.; Yang, X.-C.; Zhang, Y.; Li, D.-S.; Liu, F.-d. Identification of Bacterial Flora and Metabolic Function of Sediments in Different Channels of Duliujian River Basin, Tianjin. Huanjing Kexue 2022, 43, 3635–3644. (In Chinese) [Google Scholar]
- Dou, Y.; Zhou, W.L. Community characteristics of phytoplankton and eutrophication assessment in Tianjin section, downstream of Haihe River Basin. J. Freshw. Ecol. 2022, 37, 525–542. [Google Scholar]
- Liu, Q.; Liu, D.; Zhang, Y.; Wang, Y.; Xing, M. Study on spatial distribution of pollutants and total amount reduction in the Duliujian River (Tianjin, China). Water Supply 2020, 20, 1380–1395. [Google Scholar]
- Tyagi, S.; Sharma, B.; Singh, P. Water Quality Assessment in Terms of Water Quality Index. J. Am. Water Resour. 2013, 1, 34–38. [Google Scholar]
- Uddin, M.G.; Nash, S.; Olbert, A.I. A review of water quality index models and their use for assessing surface water quality. Ecol. Indic. 2021, 122, 107218. [Google Scholar]
- Uddin, M.G.; Nash, S.; Rahman, A.; Olbert, A. A comprehensive method for improvement of water quality index (WQI) models for coastal water quality assessment. Water Res. 2022, 219, 118532. [Google Scholar] [PubMed]
- Krishna Kumar, S.; Logeshkumaran, A.; Magesh, N.; Godson, P.S.; Chandrasekar, N. Hydro-geochemistry and application of water quality index (WQI) for groundwater quality assessment, Anna Nagar, part of Chennai City, Tamil Nadu, India. Appl. Water Sci. 2015, 5, 335–343. [Google Scholar]
- Kannel, P.R.; Lee, S.; Lee, Y.-S.; Kanel, S.R.; Khan, S.P. Application of water quality indices and dissolved oxygen as indicators for river water classification and urban impact assessment. Environ. Monit. Assess. 2007, 132, 93–110. [Google Scholar]
- Tripathi, M.; Singal, S.K. Use of Principal Component Analysis for parameter selection for development of a novel Water Quality Index: A case study of river Ganga India. Ecol. Indic. 2019, 96, 430–436. [Google Scholar]
- Ghoderao, S.B.; Meshram, S.G.; Meshram, C. Development and evaluation of a water quality index for groundwater quality assessment in parts of Jabalpur District, Madhya Pradesh, India. Water Supply 2022, 22, 6002–6012. [Google Scholar]
- Gara, T.; Fengting, L.; Nhapi, I.; Makate, C.; Gumindoga, W. Health safety of drinking water supplied in Africa: A closer look using applicable water-quality standards as a measure. Exposure 2018, 10, 117–128. [Google Scholar]
- Yuan, X.; Lu, Z.; Shu, L.; Qian, Y.; Tan, S.; Zhou, Y.; Li, Y.; Quan, Q. A spatiotemporal analysis of water quality characteristics in the first-level tributaries in Nanchong Section of Jialing River. Desalin. Water Treat. 2022, 254, 238–250. [Google Scholar]
- Nica-Badea, D.; Tataru, T. Water quality and spatial assessment of physicochemical parameters. Pharmacophore 2023, 14, 40–47. [Google Scholar]
- Xu, L.; Hao, G.; Li, S.; Song, F.; Zhao, Y.; Guo, P. Prediction and sensitivity analysis of chlorophyll a based on a support vector machine regression algorithm. Environ. Monit. Assess. 2023, 195, 698. [Google Scholar] [PubMed]
- Yongo, E.; Mutethya, E.; Jin, F.; Zhang, P.; Lek, S.; Mo, L.; Li, J.; Guo, Z. Spatio-temporal variation in water quality and phytoplankton community structure in Changwang, Meishe, and Wuyuan Rivers in Hainan Island, China. Environ. Monit. Assess. 2023, 195, 905. [Google Scholar] [PubMed]
- Nayak, B.; Panda, P.K. A Comprehensive Review of Water Quality Analysis. Int. J. Image Graph. 2024, 2650033. [Google Scholar]
- HJ 494–2009; Water Quality–Guidance on Sampling Techniques. Ministry of Ecology and Environment: Beijing, China, 2009. (In Chinese)
- HJ 493-2009; Technical Regulations for the Preservation and Management of Water Samples. Ministry of Ecology and Environment: Beijing, China, 2009. (In Chinese)
- HJ 91.2-2022; Technical Specifications for Surface Water Environmental Quality Monitoring. Ministry of Ecology and Environment: Beijing, China, 2022. (In Chinese)
- GB3838-2002; Environmental Quality Standards for Surface Water. Ministry of Ecology and Environment: Beijing, China, 2002. (In Chinese)
- Hasan, B.M.S.; Abdulazeez, A.M. A Review of Principal Component Analysis Algorithm for Dimensionality Reduction. Appl. Soft Comput. 2021, 2, 20–30. [Google Scholar]
- Gao, J.; Deng, G.; Jiang, H.; Wen, Y.; Zhu, S.; He, C.; Shi, C.; Cao, Y. Water quality pollution assessment and source apportionment of lake wetlands: A case study of Xianghai Lake in the Northeast China Plain. J. Environ. Manag. 2023, 344, 118398. [Google Scholar]
- Chen, K.; Liu, Q.; Jiang, Q.; Hou, X.; Gao, W. Source apportionment of surface water pollution in North Anhui Plain, Eastern China, using APCS-MLR model combined with GIS approach and socioeconomic parameters. Ecol. Indic. 2022, 143, 109324. [Google Scholar]
- Zhang, H.; Cheng, S.; Li, H.; Fu, K.; Xu, Y. Groundwater pollution source identification and apportionment using PMF and PCA-APCA-MLR receptor models in a typical mixed land-use area in Southwestern China. Sci. Total Environ. 2020, 741, 140383. [Google Scholar]
- Ma, Z.; Li, H.; Ye, Z.; Wen, J.; Hu, Y.; Liu, Y. Application of modified water quality index (WQI) in the assessment of coastal water quality in main aquaculture areas of Dalian, China. Mar. Pollut. Bull. 2020, 157, 111285. [Google Scholar]
- Kaiser, H.F. An index of factorial simplicity. Psychometrika 1974, 39, 31–36. [Google Scholar]
- Sun, X.; Li, X.; Tang, S.; Lin, K.; Zhao, T.; Chen, X. A review on algal-bacterial symbiosis system for aquaculture tail water treatment. Sci. Total Environ. 2022, 847, 157620. [Google Scholar]
- Qi, D.; Wu, Q.; Zhu, J. Nitrogen and phosphorus losses from paddy fields and the yield of rice with different water and nitrogen management practices. Sci. Rep. 2020, 10, 9734. [Google Scholar]
- Tian, J.; Ji, J.; Liu, Z.; Huang, J.; Xue, W. Effect evaluation of decentralized domestic sewage treatment facilities in rural areas–A case study of Nantong City, China. Water Sci. Technol. 2023, 88, 711–722. [Google Scholar] [PubMed]
- Salim, I.; Sajjad, R.U.; Paule-Mercado, M.C.; Memon, S.A.; Lee, B.-Y.; Sukhbaatar, C.; Lee, C.-H. Comparison of two receptor models PCA-MLR and PMF for source identification and apportionment of pollution carried by runoff from catchment and sub-watershed areas with mixed land cover in South Korea. Sci. Total Environ. 2019, 663, 764–775. [Google Scholar] [PubMed]
- Yang, Z.; Zou, L.; Xia, J.; Qiao, Y.; Bai, F.; Wang, Q.; Cai, D. Spatiotemporal variation characteristics and source identification of water pollution: Insights from urban water system. Ecol. Indic. 2022, 139, 108892. [Google Scholar]
- Ren, X.; Zhang, H.; Xie, G.; Hu, Y.; Tian, X.; Gao, D.; Guo, S.; Li, A.; Chen, S. New insights into pollution source analysis using receptor models in the upper Yangtze river basin: Effects of land use on source identification and apportionment. Chemosphere 2023, 334, 138967. [Google Scholar]
- Hou, W.; Sun, S.; Wang, M.; Li, X.; Zhang, N.; Xin, X.; Sun, L.; Li, W.; Jia, R. Assessing water quality of five typical reservoirs in lower reaches of Yellow River, China: Using a water quality index method. Ecol. Indic. 2016, 61, 309–316. [Google Scholar]
- Hou, X.; Xu, Z.; Tang, C.; Zhang, S. Spatial distributions of nitrogen and phosphorus losses in a basin and responses to best management practices—Jialing River Basin case study. Agric. Water Manag. 2021, 255, 107048. [Google Scholar]
- Xu, J.; Mo, Y.; Tang, H.; Wang, K.; Ji, Q.; Zhang, P.; Wang, Y.-G.; Jin, G.; Li, L. Distribution, transfer process and influence factors of phosphorus at sediment-water interface in the Huaihe River. J. Hydrol.-Reg. Stud. 2022, 612, 128079. [Google Scholar]
- Li, P.; Qian, H.; Wu, J.; Chen, J.; Zhang, Y.; Zhang, H. Occurrence and hydrogeochemistry of fluoride in alluvial aquifer of Weihe River, China. Environ. Earth Sci. 2014, 71, 3133–3145. [Google Scholar]
- Rashid, A.; Guan, D.-X.; Farooqi, A.; Khan, S.; Zahir, S.; Jehan, S.; Khattak, S.A.; Khan, M.S.; Khan, R. Fluoride prevalence in groundwater around a fluorite mining area in the flood plain of the River Swat, Pakistan. Sci. Total Environ. 2018, 635, 203–215. [Google Scholar]
- DB12/889-2019; Discharge Standard of Water Pollutants for Rural Sewage Treatment Facilities. Tianjin Municipal Bureau of Ecological Environment: Tianjin, China, 2019. (In Chinese)
- Cao, L.; Wang, W.; Yang, Y.; Yang, C.; Yuan, Z.; Xiong, S.; Diana, J. Environmental impact of aquaculture and countermeasures to aquaculture pollution in China. Environ. Sci. Pollut. Res.-Int. 2007, 14, 452–462. [Google Scholar] [PubMed]
- SC/T9101-2007; Emission Requirements for Freshwater Pond Aquacultur. Ministry of Agriculture of the People’s Republic of China: Beijing, China, 2007. (In Chinese)
- Chen, P.; Zhao, W.; Chen, D.; Huang, Z.; Zhang, C.; Zheng, X. Research progress on integrated treatment technologies of rural domestic sewage: A review. Water 2022, 14, 2439. [Google Scholar] [CrossRef]
- Huang, Y.; Li, P.; Li, H.; Zhang, B.; He, Y. To centralize or to decentralize? A systematic framework for optimizing rural wastewater treatment planning. J. Environ. Manag. 2021, 300, 113673. [Google Scholar]
- Zhao, W.; Liu, Y.; Guo, D.; Zou, D. Development application of rural domestic sewage treatment project in cold areas of Northeast China: Opportunities and challenges. J. Water Process. Eng. 2023, 56, 104326. [Google Scholar]
- Bo, Y.; Wen, W. Treatment and technology of domestic sewage for improvement of rural environment in China. J. King Saud Univ.-Sci. 2022, 34, 102181. [Google Scholar]
- Wang, J.; Chen, G.; Fu, Z.; Qiao, H.; Liu, F. Assessing wetland nitrogen removal and reed (Phragmites australis) nutrient responses for the selection of optimal harvest time. J. Environ. Manag. 2021, 280, 111783. [Google Scholar]
- Yang, Q.; Mei, J.; Tang, X.; Wang, T.; Long, K.; Liu, Y.; Li, Y.; Yu, X.; Yao, W.; Wu, Z. Assessing the suitability of three purple soils for aquaculture by physiological responses in freshwater bivalves (Hyriopsis cumingii). Aquaculture 2023, 575, 739765. [Google Scholar]
- Xu, F.; Wang, Y.; Shi, Q.; Wu, Y.; Zhang, Z.; Shi, X. Unraveling the pharmaceutical footprint and risks of combining different aquaculture modes and tailwater treatment systems. Aquaculture 2025, 596, 741763. [Google Scholar]
Disclaimer/Publisher’s Note: The statements, opinions and data contained in all publications are solely those of the individual author(s) and contributor(s) and not of MDPI and/or the editor(s). MDPI and/or the editor(s) disclaim responsibility for any injury to people or property resulting from any ideas, methods, instructions or products referred to in the content. |
© 2025 by the authors. Licensee MDPI, Basel, Switzerland. This article is an open access article distributed under the terms and conditions of the Creative Commons Attribution (CC BY) license (https://creativecommons.org/licenses/by/4.0/).