Abstract
This study explores the public acceptance of autonomous vehicles (AVs) using the Unified Theory of Acceptance and Use of Technology 2 framework. Drawing on survey data from 1000 commuters in Seoul, South Korea, this study examines the influence of performance expectations, effort expectations, social influence, hedonic motivation, and facilitating conditions on the behavioral intention to adopt AVs. Structural equation modeling reveals that hedonic motivation (β = 0.56, p < 0.001), price value (β = 0.47, p < 0.001), and performance expectancy (β = 0.64, p < 0.001) are critical determinants of AV acceptance. Additionally, risk perception negatively impacts behavioral intention (β = −0.25, p < 0.001), while policy support (β = 0.51, p < 0.001) and facilitating conditions (β = 0.46, p < 0.001) demonstrate substantial positive influences. Demographic analysis highlights age and gender as significant moderators, with younger users prioritizing performance expectancy and being more sensitive to risk, while older users exhibit a shift from hedonic to utility-driven motivations as they age. Women exhibit greater sensitivity to policy support and economic factors, while men respond more strongly to environmental considerations. In addition, prior experience with advanced driver assistance systems amplifies the influence of enjoyment on facilitating conditions, whereas inexperienced users are more affected by perceived risks. These findings underscore the importance of tailored interventions that address demographic variations, enhance user satisfaction, and balance cost-effectiveness with safety assurances. This study provides insights into actionable strategies for policymakers and industry leaders to promote AV adoption and support the evolution of sustainable urban mobility systems.
1. Introduction
In recent decades, humanity has experienced rapid advancements in technology, heralding a new era in transportation characterized by the emergence of autonomous vehicles (AVs). These AVs, powered by sophisticated algorithms, sensors, and artificial intelligence, promise to revolutionize the manner in which we navigate our world. The integration of AVs into our daily lives has the potential to significantly improve road safety, reduce traffic congestion, and provide greater mobility for those who cannot drive. However, the transition to the widespread use of AVs is fraught with challenges, including regulatory hurdles, ethical considerations, and technological limitations.
Many countries plan to lay the groundwork for the secure and appropriate incorporation of AVs into everyday travel on public roadways by conducting substantial projects on roads in mixed conditions and on various road networks to investigate technology and human interconnections [1]. AVs allow drivers to become involved in nondriving endeavors such as reading or using portable digital devices such as smartphones, tablets, and computers [2,3,4,5]. Consequently, AVs represent an evolutionary change for drivers in terms of their interactions with self-driving cars. Numerous human factor experts have highlighted the hazards posed by AVs, conveying profound concerns about delegating driving tasks to machines and algorithms. Several investigations have further demonstrated the public’s doubts and concerns regarding AVs [6]. This is concerning, given that the embrace of AVs is an incubator for realizing their capacity to enhance traffic security and efficiency [7]. Ref. [8] defined the acceptance of a new technology as an individual’s intention to use it. To enhance the probability of an innovation gaining traction, it is necessary to model a technology acceptance concept to understand the variables that affect acceptance and its evolution over time [9].
The Unified Theory of Acceptance and Use of Technology (UTAUT) represents one of the most complete technology acceptance models, incorporating eight significant acceptance models, such as the Theory of Planned Behavior (TPB) [10] and the Technology Acceptance Model (TAM) [11]. UTAUT assumes that a person’s behavioral intention to use (BIU) a technology is determined by performance expectancy (i.e., the extent to which a technology is considered useful), effort expectancy (i.e., the level to which employing a new technology is viewed as easy to use), social influence (i.e., the degree to which the application of a technology is recognized in one’s social context), and facilitating conditions (i.e., the extent to which the user feels that they have the resources for utilizing the technology) [8]. According to the UTAUT2, in addition to the UTAUT factors, the intention to interact with a technology is influenced by hedonic motivation (the point to which a technology appears to be pleasurable), price value (the psychological compensation between the apparent advantages and financial expenses of using the technology), and habit (described as the period from the beginning of using the technology) [12]. AVs are not yet within the reach of consumers, which is why none of the respondents use this technology regularly. Therefore, the current study did not investigate the effect of habit on behavioral intention. Future research should examine the effect of habit after the prolonged on-road use of AVs.
Various studies have examined the adoption of private, public, conventional, and capsule-type automated vehicles using factors from mainstream technology acceptance models, including TAM, TPB, and UTAUT [9,13,14,15,16,17,18,19]. The understanding of AV adoption has improved as a result of these investigations. However, these methods exhibit two major drawbacks. First, they have not analyzed people’s attitudes toward AVs, adding variables such as risk, policy support, and the environment to the UTAUT2 model to simulate people’s acceptance of them. Compared to TAM, TPB, and UTAUT [15,17,20], UTAUT2 has actually been customized for user experience and shown to explain a greater percentage of the variance in the BIU AVs [16]. Second, Seoul’s distinctive cultural context and unique technological behaviors and attitudes could make the results different from those of other countries and societies. Through a comprehensive analysis, this study seeks to provide a balanced perspective on the transformative potential of AVs, highlighting both the opportunities they present and the obstacles that must be overcome to fully realize their promise.
The early acceptance of AVs must be examined to successfully integrate them into the transportation network. This study used a questionnaire to obtain data from individuals asked to envisage the use of AVs. The primary goal of the questionnaire survey was to evaluate and model conditional AV acceptability using the UTAUT2 model constructs. The current study focused on two subresearch goals targeting regular commuters in Seoul, which are as follows:
- To investigate how people’s BIU AVs is influenced by the UTAUT2 dimensions of performance, effort expectancy, social influence, facilitating conditions, hedonic motivation, policy support, environment, price value, and risk.
- To investigate how these notions relate to one another.
2. Literature Review
2.1. Factors Affecting AV Acceptance
Extensive research has been conducted to examine the determinants of consumer acceptance and willingness to adopt AVs. For instance, ref. [21] utilized data from an online survey in China to explore factors contributing to the widespread adoption of AVs. Their study focused on the environmental implications of AV technology, particularly its potential to reduce emissions, and identified that consumers’ purchase intentions were positively influenced by perceived usefulness (PU), perceived ease of use (PEU), and environmental consciousness. Ref. [22] investigated the role of policymakers in facilitating AV diffusion. Their findings revealed that perceived risk and PU were pivotal factors, with perceived risk exhibiting a negative association with AV adoption. Ref. [23] developed a mathematical framework grounded in theories of innovation diffusion, perceived value, and trust to identify the latent variables affecting the public acceptance of AVs. Their results highlighted that the influence of perceived value on acceptance is partially mediated by trust, while innovation diffusion attributes—such as comparative advantage, compatibility, complexity, testability, and observability—are fully mediated by perceived value.
Ref. [24] conducted a systematic review of the factors shaping public perceptions of AVs and identified seven critical determinants that significantly affected adoption intentions: PEU, attitude, social norms, trust, PU, perceived risk, and compatibility. Excluding behavioral theories, six additional criteria, safety, price-value effectiveness, mobility, travel-time value, intangible benefits, and environmental friendliness, were also found to influence acceptance. Their analysis noted regional differences in AV perceptions, particularly between Europe and Asia, with safety emerging as the predominant concern among stakeholders. Complementing these findings, ref. [25] analyzed survey data from 610 Brisbane residents to uncover the demographic and contextual factors influencing AV interest. They observed that positive perceptions were more prevalent among young and middle-aged adults, low-income individuals, people with disabilities, public transportation users, and those feeling unsafe in current transit systems, while higher domestic vehicle ownership was negatively correlated with AV adoption.
In an era of rapid societal evolution, traditional paradigms that emphasize cost and environmental considerations may insufficiently address the nuanced factors affecting AV engagement. This underscores the importance of multidimensional constructs such as policy support, environment, social influence, price value, facilitating conditions, hedonic motivation, and risk perception in shaping consumer attitudes toward AV adoption. Ref. [26] extended the UTAUT framework by incorporating insights from the Diffusion of Innovations Theory, emphasizing that social influence and perceived risk play crucial roles in the acceptance of automated shuttles. Their findings align with prior studies that highlight the significance of trust in AV technology. These dimensions, supported by theoretical and empirical evidence, provide a comprehensive understanding of the motivations and barriers governing AV acceptance. Collectively, these insights enable the development of robust predictive models and conceptual frameworks, advancing the scholarly discourse and informing policy and industry strategies that are critical to the integration of AVs into contemporary transportation systems.
2.2. Research Gap
Despite extensive research on AV adoption, significant gaps persist in understanding the interplay among key factors in frameworks such as UTAUT2. Existing studies often examine individual determinants, such as performance expectancy, effort expectancy, and perceived usefulness, but fail to explore their interdependence or the role of broader societal and regulatory influences, such as policy support and environmental readiness. Notwithstanding the growing body of research on UTAUT2, ref. [27] identified the need for more domain-specific adaptations of the model, particularly in the context of emerging transportation technologies such as AVs. Their systematic literature review suggests that extending UTAUT2 with psychological and contextual factors could enhance predictive accuracy in AV adoption studies. Multidimensional constructs, such as hedonic motivation, facilitating conditions, and social influence, are also underexplored, particularly their interaction with perceived risk. Furthermore, research lacks comprehensive analysis of how demographic and experiential factors, such as age, gender, and prior exposure, moderate these relationships. Addressing these gaps requires extending existing frameworks to integrate psychological, contextual, and regulatory dimensions, offering actionable insights for advancing AV adoption strategies.
3. Hypothesis Development and Previous Studies
3.1. UTAUT2 Components’ Primary Implications on Behavioral Intention
TAM and TPB were used to forecast AV acceptance [14,17,18,20]. Using a modified TAM, ref. [17] discovered that PU (equal to performance expectancy) and PEU (equivalent to effort expectancy) were the factors that most significantly predicted the BIU AVs. The greatest predictor of the propensity to re-ride was PU. Using TPB and TAM, ref. [20] discovered that behavioral intention was significantly predicted by PU, perceived behavioral control (which is comparable to facilitating conditions), and subjective norms (which is comparable to social influence). Ref. [14] used TPB and TAM to observe the adoption of conditional and fully automated vehicles. The attitude toward using this technology was found to be the most significant predictor of intentions to use these vehicles, followed by PU, subjective norms, and PEU. Using a modified version of TAM, ref. [18,19] discovered a direct relationship between the BIU conditionally automated cars and PU and PEU. Additional research has demonstrated a correlation between the BIU SAE Level 4+ AVs and the UTAUT2 constructs of performance and effort expectancy, social influence, facilitating conditions, and hedonic motivation [13,15,16]. Drawing from the aforementioned literature review, we postulate the following:
People who value the perceived benefits of AVs are more likely to use AVs (i.e., have a high level of behavioral intention) than those who have a low level of perceived benefits.
H1.
Performance expectancy of AVs is a significant positive predictor of behavioral intention.
People who believe that AVs are easy to use (i.e., effort expectancy) are more likely to intend to use them (i.e., behavioral intention) than those who do not.
H2.
Effort expectancy is a substantial positive predictor of behavioral intention.
People are more likely to intend to use AVs if they believe that influential people in their social networks support their use of AVs (i.e., social influence) than if they do not believe that important people in their social networks support their use of AVs.
H3.
Social influence is a significant positive predictor of behavioral intention.
People who are more likely to believe that AVs can be used are more likely to intend to use them than those who are less likely to believe that AVs can be used.
H4.
Facilitating conditions for the use of AVs are significant positive predictors of behavioral intention.
People who find AVs enjoyable (i.e., have hedonic motivation) are more likely to plan to use them than those who do not think they are enjoyable.
H5.
Hedonic motivation is a significant positive predictor of behavioral intention.
Policy support is a crucial factor influencing behavioral intention, particularly in the context of AVs. Ref. [12] emphasized that supportive policies create an environment conducive to technology adoption. In the case of AVs, clear regulatory guidelines can alleviate concerns regarding safety and liability, thereby enhancing users’ intention to adopt the technology. Research by [28] indicates that effective government policies foster user trust in autonomous technologies; when users perceive regulatory frameworks that ensure safety and accountability, their BIU AVs increases. In addition, ref. [29] highlighted the role of public policies in shaping perceptions of AVs, noting that governmental support enhances public confidence, which positively influences behavioral intention. Furthermore, incentives provided through policy measures, such as tax rebates for AV purchases, can act as motivators, reinforcing users’ intentions to engage with the technology [30].
H6.
Policy support positively influences behavioral intention to use AVs.
A robust body of literature supports the connection between environmental factors, particularly those related to nature and sustainability, and the BIU AVs. The foundational work of [12] within the UTAUT2 framework suggests that external factors, including environmental considerations, influence technological adoption. Studies by [31,32] highlight the role of sustainability and eco-friendliness in shaping consumer attitudes toward AVs. In addition, ref. [33] underscored the impact of environmental factors, such as pollution and traffic congestion, on adoption behavior, while [34] identified environmental consciousness as a critical driver of consumer readiness to adopt AVs. Collectively, these studies suggest that environmental factors, particularly those emphasizing sustainability, significantly enhance the BIU AVs, aligning with broader societal and individual concerns regarding ecological impact.
H7.
Environment positively influences behavioral intention to use AVs.
Price value is a critical factor that influences behavioral intention, especially in the context of AVs. Ref. [12] noted that price value serves as a significant predictor of behavioral intention, as individuals are more likely to adopt technology when they perceive that the benefits outweigh the costs. Ref. [28] further illustrated that consumers conduct a cost–benefit analysis when considering AVs; if they believe that long-term savings in fuel, insurance, and time compensate for the initial investment, their intention to adopt the technology is strengthened. Ref. [30] emphasized the positive impact of government incentives, such as tax rebates for purchasing AVs, on the perceived price value, as these incentives make the cost of AVs more justifiable and enhance users’ adoption intentions. Ref. [29] also supported this by demonstrating that price sensitivity significantly affects acceptance; individuals who see substantial advantages relative to costs are more inclined to adopt AVs.
H8.
Price value positively influences behavioral intention to use AVs.
Perceived risk significantly influences behavioral intention, particularly regarding the adoption of AVs. Ref. [12] noted that higher levels of perceived risk often result in lower behavioral intentions to adopt technology, as individuals become apprehensive about potential negative outcomes. Ref. [28] emphasized that specific risks associated with AVs, such as concerns about privacy, safety, and loss of control, can substantially inhibit users’ willingness to embrace the technology. Ref. [18] demonstrated that initial trust and perceived risk significantly influence AV acceptance. Their study found that individuals with higher levels of initial trust in AV technology were more likely to adopt it, whereas concerns about safety and technological failures negatively impacted behavioral intention. Ref. [29] highlighted that safety concerns are a major barrier to user acceptance; when individuals doubt the ability of a technology to operate safely under various driving conditions, their intention to adopt AVs diminishes. Ref. [30] discussed the role of trust in mitigating perceived risk, arguing that a lack of trust in the technology or its supporting systems can exacerbate perceived risk, leading to negative behavioral intentions. Overall, the literature indicates that perceived risk negatively affects users’ intentions to adopt AVs.
H9.
Perceived risk negatively influences behavioral intention to use AVs.
Behavioral intention is a key predictor of actual use behavior, and this relationship is particularly important in the adoption of AVs. Ref. [12] noted that a strong behavioral intention to adopt a technology significantly increases the likelihood of its actual use, a pattern observed across various technologies. In the context of AVs, ref. [35] demonstrated that individuals with a positive intention to use AVs, driven by perceived convenience and safety, are more likely to adopt them. Similarly, ref. [36] found that users’ perceptions of the benefits and risks of AVs directly shape their behavioral intentions, which subsequently influence use behavior. Ref. [16] emphasized that while behavioral intention is a strong predictor, facilitating conditions such as infrastructure and legal support are essential for converting intention into actual use.
H10.
Behavioral intention positively influences the actual use behavior of AVs.
3.2. Connections Among UTAUT2 Factors
To devise effective strategies for promoting the acceptance of AVs, a comprehensive understanding and identification of the foundational beliefs or assumptions underpinning the UTAUT2 constructs, namely performance expectancy, effort expectancy, hedonic motivation, facilitating conditions, price value, social influence, environment, policy support, and risk, are imperative. Recent scholarly discourse has shown a revived interest in exploring the interrelationships among UTAUT2 constructs within the AV domain. Nevertheless, there remains a significant gap in the literature regarding the interrelationships among the UTAUT2 constructs in relation to environment, policy support, and risk.
Social influence plays a critical role in shaping performance expectancy, particularly in the context of AVs. Ref. [12] explained that social influence, including opinions from peers, family, and society, significantly affects how individuals perceive the benefits of new technologies. For AVs, positive endorsements from social circles and public figures can enhance user expectations of the technology’s performance. Ref. [16] found that social influence shapes perceptions of AV capabilities, such as safety and efficiency, leading individuals to expect that AVs will improve their driving experience. Ref. [29] emphasized the role of media and public opinion in shaping societal views, noting that positive portrayals of AVs increase users’ expectations of their performance. Ref. [28] argued that trust in AV performance is strengthened through social endorsement as trusted opinions foster confidence in the technology’s ability to deliver expected benefits.
H11.
Social influence positively affects performance expectancy regarding AVs.
Price value significantly influences effort expectancy, particularly in the context of AVs. Ref. [12] explained that when individuals perceive a high price value and believe that the benefits of a technology justify its cost, they are more likely to form positive expectations regarding the ease of use of that technology. In the case of AVs, ref. [28] found that consumers often equate the high cost of advanced technology with better quality and user-friendly features, such as autonomous navigation systems, which reduce the perceived effort required to operate the vehicle. Ref. [29] showed that individuals expect more expensive AVs to offer intuitive interfaces and smoother operations, thus positively influencing their effort expectancy. Ref. [11] argued that consumers often associate higher-priced technology with a more seamless and less effort-intensive experience, reinforcing the connection between price value and ease of use.
H12.
Price value positively influences effort expectancy regarding AVs.
Hedonic motivation plays a crucial role in influencing social influence, particularly in the context of AVs. Ref. [12] suggested that when individuals derive enjoyment from using a technology, they are more likely to share their positive experiences with others, thereby increasing social influence. In the case of AVs, users who find pleasure in autonomous driving are likely to talk about their experiences, which can encourage others to adopt the technology. Ref. [16] emphasized that enjoyable experiences with AVs can create word-of-mouth effects, where satisfaction leads to social endorsement and peer influence. Ref. [28] further noted that positive experiences with AVs increase users’ influence on their social circles, enhancing the social pressure to adopt the technology. Ref. [29] argued that when users enjoy AVs, they are more likely to seek and receive social validation, amplifying their social influence.
H13.
Hedonic motivation positively influences social influence regarding AVs.
Social influence plays a significant role in shaping user perceptions of price value, particularly in the context of AVs. Ref. [12] emphasized that social influence affects how individuals evaluate the cost–benefit trade-off of new technologies, with positive social feedback leading to a higher perceived price value. Ref. [28] explained that when peers and family members express favorable opinions about the convenience, safety, and advanced features of AVs, individuals are more likely to perceive the high cost of AVs as justified. Ref. [29] highlighted the role of public opinion and societal norms, noting that positive portrayals of AVs by influential figures or media can increase users’ acceptance of the price, as they believe that the benefits outweigh the costs. Ref. [30] supported this by arguing that social endorsement enhances perceived price value by reinforcing users’ beliefs in the technology’s advantages, such as improved safety and convenience.
H14.
Social influence positively affects price value regarding AVs.
Performance expectancy plays a significant role in influencing policy support, particularly in the context of AVs. Ref. [12] emphasized that when individuals believe that a technology will deliver substantial benefits, they are more likely to support policies that promote its adoption. For AVs, users who expect improvements in safety, efficiency, and convenience are more inclined to endorse policies that facilitate AV deployment. Ref. [28] found that individuals with high expectations of AV safety were more supportive of government regulations aimed at accelerating AV adoption. Ref. [29] highlighted that perceived performance benefits, such as reduced driver fatigue and increased transportation efficiency, lead to greater public backing for policies related to AV infrastructure and safety standards. Ref. [16] added that trust in AV performance fosters acceptance of policies designed to govern and regulate the technology.
H15.
Performance expectancy positively influences policy support for AVs.
Hedonic motivation is a key factor in shaping user perceptions of facilitating conditions, particularly in the context of AVs. Ref. [12] highlighted that the enjoyment users experience from a technology increases their engagement and desire for a supporting infrastructure. In the case of AVs, users who find the technology enjoyable are more likely to demand better facilitating conditions, such as road infrastructure, charging stations, and technical support, to maintain their positive experience. Ref. [16] suggested that when individuals enjoy the convenience and entertainment features of AVs, they expect a robust infrastructure and support systems to sustain this pleasurable experience. Ref. [28] found that users who derive satisfaction from AVs are more aware of and expect seamless integration with transportation systems and real-time support. Ref. [29] argued that users who enjoy innovative technologies are more likely to recognize the need for facilitating conditions, such as infrastructure and maintenance, to enhance their experience.
H16.
Hedonic motivation positively influences the perception of facilitating conditions for AVs.
We anticipate that age, gender, and prior experience with advanced driver assistance systems will alter the associations between performance and effort expectancy, hedonic motivation, enabling conditions, social influence, and behavioral intention, in accordance with [8,12]. We postulated the following:
H17.
The study uses age, gender, and prior experience with advanced driver assistance systems as moderators of the associations between performance and effort expectancy, hedonic motivation, facilitating conditions, social influence, and behavioral intention to use AVs. These moderators align with those recommended or designated by the UTAUT2 model.
Figure 1 shows a modified version of the UTAUT2 model originally proposed by [12]. The model was adapted to suit the specific contextual parameters of the current study. It depicts the relationships among several constructs, including performance expectancy, effort expectancy, social influence, facilitating conditions, hedonic motivation, policy support, environment, and price value, all of which serve as predictors of the behavioral intention toward technology use. In addition, risk was incorporated as an influential variable directly linked to behavioral intention, which subsequently predicts use behavior. Moderating factors such as age, gender, and experience are represented, illustrating their potential impact on the strength of relationships between the independent variables and behavioral intention. The solid lines indicate direct influences, while the dotted lines reflect moderating effects, collectively elucidating the theoretical framework under investigation.
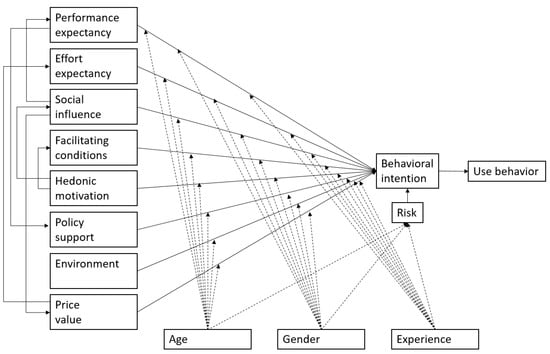
Figure 1.
UTAUT2 model modified to align with specific context of this study.
4. Data and Method
4.1. Process and Participant Recruitment
In December 2021, a professional survey company was commissioned to collect the data for this study through an online platform. The survey gathered data from a total of 1000 commuters, comprising 518 men and 482 women, drawn from 25 districts across Seoul. An initial exploratory pilot survey was conducted before full-scale survey deployment. The pilot phase evaluated and refined the conceptual framework, methodological tools, and measurement instruments used in the survey. The pilot survey involved the development of survey instruments, the administration of the survey protocol, and iterative adjustments that collectively enhanced the accuracy, reliability, and contextual relevance of the data collected in the comprehensive survey.
To ensure the recruitment of car drivers, individuals who reported never using private, carsharing, or rental cars as drivers were excluded from the study. Invitations to participate in the questionnaire were disseminated via email through online panels with access to a large pool of potential respondents. Once a representative sample was obtained, the questionnaire was closed, prohibiting further participation. The survey company employed various technologies to enhance data quality, ensuring that only human respondents participated. Measures were taken to exclude bot responses and detect suspicious proxies or email addresses. In addition, safeguards were implemented to prevent individuals from taking the questionnaire multiple times, such as through multiple email accounts or panel memberships from the same computer.
4.2. Questionnaire
Participants responded to specific questions designed to assess their attitudes and perceptions toward AVs using a seven-point Likert scale, ranging from 1 (strongly disagree) to 7 (strongly agree). The sample included participants in their 20s (155), 30s (255), 40s (251), 50s (253), and 60s (86). The study also considered six economic levels, with the largest group earning KRW 4–6 million per month (USD 3.5–5 thousand), representing 30% of the sample. Another section of the survey focused on respondents’ attitudes and perceptions toward AVs through a questionnaire incorporating TAM-related questions. To evaluate the influence of external factors on users’ attitudes, behavioral intentions, and actual usage of AVs, seven items—policy support, environment, social influence, price value, facilitating conditions, hedonic motivation, and risk—were measured. Eligibility for survey participation was restricted to individuals who either currently owned a car or intended to purchase one within the next three years.
The descriptive statistics presented in Table 1 comprise measures of central tendency, represented by the mean and measures of variability, represented by the standard deviation, for variables related to perceptions and attitudes toward AVs. They were measured based on a seven-point Likert scale, with higher means indicating stronger agreement or positive perceptions. The perceptions and attitudinal constructs were organized in descending order based on their mean scores to facilitate the identification of high, moderate, and low mean ratings. Policy support and performance expectancy received the highest mean scores, reflecting strong agreement on the importance of institutional incentives and belief in AVs’ efficiency benefits. Moderate scores for social influence, hedonic motivation, and environment suggest that participants recognized societal norms, enjoyment, and ecological benefits as relevant factors. Lower scores for use behavior, price value, and behavioral intention indicated mixed intentions and economic considerations regarding AV adoption. Facilitating conditions underscore the need for a robust infrastructure, while effort expectancy and risk perception highlight concerns about usability and safety, with considerable variability. Overall, the findings reveal a multidimensional framework of technical, societal, economic, and environmental factors that shape attitudes toward AVs.

Table 1.
Descriptive statistics of perceptions and attitudes toward AVs.
4.3. Demographic and Experience Profiles of Respondents
Table 2 provides an in-depth overview of the categorical variables related to travel preferences, demographics, and contextual factors, offering insights into the behaviors and characteristics of the surveyed population. The majority of respondents expressed the intention to use AVs as their primary mode of transportation, highlighting a growing interest in advanced mobility solutions, although a significant proportion remained hesitant: 67.7% of respondents chose privately owned or shared AVs, while 32.3% opted for regular cars or public transportation. Public transport has emerged as the dominant travel mode with fewer participants relying on private vehicles, reflecting urban-oriented mobility trends. Car ownership was relatively balanced, although the adoption of semi-autonomous vehicle technology appeared to be limited, with many respondents lacking exposure or awareness of these features. Gender representation in the sample was nearly equal, and marital status leaned slightly toward individuals with family obligations. Parental status was evenly distributed, indicating diverse family structures among the respondents. In addition, an overview of commuters’ ages is provided, highlighting the variability of this factor within the sample.
Table 2.
Survey participants’ responses toward AVs and socio-economic characteristics (N = 1000).
Table 3 provides an analytical breakdown of participants’ frequency of usage of semi-autonomous vehicle functions, offering insights into the adoption and integration of these technologies within the surveyed population. A small proportion of respondents reported frequent utilization of semi-autonomous features, reflecting limited but notable engagement with these advanced functionalities. A slightly larger segment indicated occasional use, suggesting a moderate level of familiarity and experimentation with such technologies. A similarly modest share of participants reported rare usage, indicating minimal reliance or sporadic exposure to semi-autonomous systems. It is noteworthy that a large portion of respondents have never used them, indicating that the majority of the population does not interact with these functions, at least to some degree. These findings underscore the nascent stage of semi-autonomous technology adoption, marked by varied levels of engagement, and highlighting potential opportunities for broader user integration and acceptance.
Table 3.
Number of participants using semi-autonomous functions (N = 1000).
4.4. Analytical Approach
The data analysis adhered to the two-step procedure proposed by [37]. Initially, confirmatory factor analysis (CFA) was conducted to scrutinize the measurement relationships between latent constructs and their respective observed indicators (i.e., questionnaire items). The psychometric properties of the measurement model were evaluated using indicator reliability, internal consistency reliability, convergent validity, and discriminant validity. Convergent validity was established using four criteria: (1) all scale items were required to be significant and exhibit loadings exceeding 0.50 on their corresponding constructs, (2) the average variance extracted (AVE) needed to surpass 0.50, (3) construct reliability (CR), and (4) Cronbach’s alpha values (α) should exceed 0.70 [37,38,39]. Discriminant validity was assessed using ref. [37]’s squared correlations test, in which the correlation coefficient between any two latent variables must be less than the square root of the AVE of each latent variable.
The second phase involved estimating the structural model that delineated the path relationships among latent variables using structural equation modeling (SEM). SEM is an advanced multivariate statistical methodology that examines structural associations among variables. In this framework, measured variables serve as exogenous or independent variables that are directly observed and recorded as data by researchers. Conversely, latent variables represent endogenous or dependent constructs that, while conceptually understood, cannot be directly measured [40]. SEM enables the exploration of structural relationships between observed variables and latent constructs by combining the elements of linear regression and factor analysis. For a single subject, the simple linear regression equation is expressed as follows [41]:
where represents the intercept, denotes the regression coefficient, is the observed predictor, and is the residual error. Similarly, the factor analysis model for a single item is formulated as follows [41]:
where represents the observed item (e.g., a survey question), denotes the item intercepts or means, signifies factor loadings (correlations between items and the factor), represents the latent factor predicting the item, and is the residual error for the model. The multivariate nature of this model allows it to be compactly expressed as a matrix equation, providing a robust framework for analyzing complex structural relationships [41].
The SEM evaluation included reporting standardized regression weights, their significance levels, and the variance explained by each latent variable. Maximum likelihood estimation was employed for these calculations. Model fit was determined using the following indices: comparative fit index (CFI) ≥ 0.90, root mean square error of approximation (RMSEA) ≤ 0.08, and standardized root mean square residual ≤ 0.06 [39,42,43,44]. To investigate the moderating effects of age, gender, and experience with advanced driver assistance systems on the relationships between the constructs of the UTAUT2 model (i.e., performance expectancy, effort expectancy, social influence, facilitating conditions, hedonic motivation, policy support, environment, price value, risk, and behavioral intention), analyses were developed for each moderator (age, gender, and experience) and UTAUT2 predictor constructs following the established protocols in the literature [45].
5. Results
Descriptive statistics for the selected constructs of the primary survey were calculated using IBM SPSS Amos 24 SEM software. Covariance-based SEM and CFA were employed to evaluate the hypothesized relationships within the model. The CB-SEM approach leverages a statistical framework to estimate and assess the relationships between dependent and independent variables as well as the latent constructs mediating these interactions. The estimated UTAUT2 model has a satisfactory RMSEA of 0.069. The CFI is 0.89, which is still an acceptable result according to [39,42,43,44], indicating a reasonable fit of the model to the AV data.
5.1. Factors Shaping the Acceptance and Perception of AVs
In SEM, factor loadings serve as critical indicators of the relationship between observed variables and their underlying latent constructs. Typically, a factor loading (λ) of 0.7 or higher is preferred, signifying that the observed variable explains at least 49% of the variance in the latent construct [46]. However, several circumstances warrant the acceptance of lower factor loadings, particularly in exploratory research, where loadings between 0.4 and 0.6 may be considered acceptable as initial models undergo further refinement [41]. Complex constructs, often multidimensional, may naturally exhibit lower loadings because of their abstract nature [47]. Small sample sizes can also contribute to lower loadings, reflecting the increased variability inherent in such data [40]. Cross-loadings, in which a variable correlates with multiple factors, further justify accepting lower loadings, particularly if they are theoretically justified [48]. Practical considerations, such as the retention of theoretically significant indicators or the need to ensure overall model fit, may also justify the inclusion of variables with loadings below 0.7 [49]. Finally, decisions regarding model re-specification or modification indices, which suggest improvements through cross-loadings or correlated errors, may lead to the acceptance of lower loadings [50]. Thus, the acceptance of lower factor loadings should always be supported by theoretical rationale and careful consideration of model fit, ensuring that such decisions are transparently discussed in the interpretation and conclusions of the research.
Table 4 presents a comprehensive analysis of the various constructs influencing the acceptance and perception of AV technologies assessed through psychometric measures of reliability and validity, including CR, AVE, and α. These constructs are grounded in established theoretical frameworks. Performance expectancy demonstrates strong reliability, emphasizing the perceived benefits of AVs in enhancing quality of life and utility, with high factor loadings reflecting the belief in their potential to improve daily living. Effort expectancy, however, shows lower reliability, with items focusing on ease of use, accessibility, and after-sale services, indicating potential barriers to adoption. Behavioral intention emerged as highly reliable, reflecting trust and a strong intention to engage with AVs. Use behavior, which reflects actual and intended behaviors, also showed robust reliability, with participants expressing strong intentions to purchase and recommend AVs. An additional construct such as price value, although less reliable, reflects economic considerations. Overall, the table offers a nuanced understanding of the psychological, economic, social, and environmental factors that influence consumer attitudes toward AVs, thus providing a basis for research on technology adoption.
Table 4.
Constructs influencing acceptance and perception of AVs.
Table 5 lists the total effects between key constructs relevant to BIU and actual system use (ASU) within the framework of the UTAUT2 model. These coefficients provide valuable insights into the direction and magnitude of relationships between variables, shedding light on the determinants of AV acceptance. Hedonic motivation emerges as a significant positive predictor across multiple dimensions, demonstrating robust relations with constructs such as policy support, effort expectancy, BIU, and ASU. This underscores the importance of intrinsic enjoyment and user satisfaction in shaping behavioral intentions and system use. Price value, another critical factor, exhibits a pronounced positive correlation with BIU and ASU, indicating its pivotal role in driving adoption behaviors, particularly where cost considerations are salient.
Table 5.
Total effects on constructs in UTAUT2 model.
Certain constructs exert inhibitory effects, as reflected in their negative effects. For instance, risk was inversely related to both BIU and ASU, highlighting the detrimental effects of perceived risk on user acceptance. Similarly, effort expectancy and policy support demonstrated modest negative associations with ASU, suggesting that greater perceived effort and insufficient institutional support may hinder ASU. BIU, a key mediating variable, is positively influenced by several factors, including price value, Hedonic motivation, and social influence, reflecting the multifaceted nature of user intentions. Conversely, ASU is shaped by overlapping yet distinct predictors, with notable positive effects with price value and negative effects with risk. These findings underscore the complex interplay between motivational, contextual, and risk-related factors that influence technology adoption. Constructs such as hedonic motivation and price value emerged as critical drivers, emphasizing the importance of creating engaging and cost-effective solutions to enhance user acceptance. Simultaneously, addressing barriers such as risk and perceived effort expectancy is essential for fostering sustained system use. These insights contribute to a nuanced understanding of user behavior and offer actionable strategies for optimizing AV adoption interventions.
5.2. Gender as a Moderator
Table 6 presents the results of examining gender as a moderator in the adoption and use of AVs based on the UTAUT2 model. The table compares path estimates, significance levels (p-values), and z-scores for male and female groups across several constructs, shedding light on how gender influences key determinants such as social influence, performance expectancy, and the BIU AVs. The z-scores particularly highlight significant gender differences, revealing how these relationships vary between men and women, providing valuable insights into understanding gender-specific motivations in the adoption of AV technologies. A z-score close to 0 indicates little to no difference between the two groups, while a larger absolute z-score (|z| > 1.96) typically suggests a statistically significant difference at the 95% confidence level.
Table 6.
Gender as a moderator in the adoption and use of AVs.
In hedonic motivation over social influence, a z-score of −2.925 indicates a significant difference between the estimates of male and female participants for this path, with male participants showing a stronger influence of hedonic motivation on social influence (estimate of 0.773 for men vs. 0.541 for women). A negative z-score suggests that this effect was significantly greater for men than for women. Regarding the effect of price value on effort expectancy, a z-score of 2.216 indicated a significant positive difference between men and women, with female participants showing a stronger influence of price value on effort expectancy. Environment on BIU showed a negative z-score, suggesting that the effect of environment on BIU was significantly stronger for men than for women. The significant z-score of −3.054 and its corresponding p-value exhibit that this is a highly significant difference. Policy support for BIU revealed a large positive z-score of 3.137, indicating that female participants have a significantly stronger relationship between policy support and BIU than male participants. The estimates are −0.357 and −0.097 for men and women, respectively, and this positive z-score emphasizes the stronger influence for female participants. Concerning risk on BIU, the z-score of −2.453 shows a significant negative difference between men and women, with the effect of risk on BIU being more negative for females than for males. This indicates that risk impacts female participants’ BIU more negatively than male participants.
For some relationships, the z-scores were relatively small, indicating no significant difference between men and women. For example, social influence on performance expectancy had a z-score of 0.448, with the difference between the estimates of male and female participants insignificant, suggesting that social influence affects performance expectancy similarly for both groups. The z-scores in this table highlight the significance of gender differences in the relationships between the variables. For paths such as hedonic motivation on social influence and environment on BIU, the differences were substantial, with men showing stronger effects. Conversely, women showed stronger effects in relationships such as price value on effort expectancy and policy support on BIU. Understanding these gender differences is crucial for tailoring interventions or strategies based on specific influences that strongly affect each group.
5.3. Experience with AV Functions as a Moderator
Table 7 lists how experience with AVs moderates the relationships between key variables in the UTAUT2 model. The analysis compared individuals with and without experience using AVs to assess whether their experience significantly affected the strength of these relationships.
Table 7.
Experience with AV functions as a moderator in the adoption and use of AVs.
The z-scores and p-values in Table 7 provide insights into whether the relationships between variables differed significantly based on the experience with AVs. The z-score measures the difference between the path estimates for the “Yes_Exp” and “No_Exp” groups. Hedonic motivation on the facilitating conditions path (z = −2.132) showed a significant difference between the two groups, suggesting that hedonic motivation influences facilitating conditions differently depending on whether the individual has experience with AVs. A negative z-score indicated that the effect was stronger for the experienced group. In the case of risk on BIU (z = −1.416), although the z-scores were not as large as 1.96, it indicates a moderately substantial difference, with risk having a stronger impact on BIU for inexperienced individuals. Other paths, such as hedonic motivation on social influence (z = −1.36) and social influence on price value (z = −1.295), had z-scores that suggest moderate differences between experienced and inexperienced users. Many relationships (e.g., performance expectancy and price value) do not show statistically significant differences between the two groups, suggesting that these factors influence experienced and inexperienced users similarly. This analysis highlights the key pathways where user experience moderates the impact of key variables in the UTAUT2 model, emphasizing the importance of hedonic motivation and risk perception.
5.4. Age as a Moderator
The results of the survey on the acceptance of AVs across the five age groups, with age acting as a moderator in the UTAUT2 model, indicated an RMSEA value of 0.038, well below the 0.05 threshold, suggesting an excellent model fit. In terms of incremental fit indices, the CFI (0.844) was slightly below the ideal 0.90 cutoff but remained within acceptable ranges. In contrast, the independence model, which assumes no relationships between the variables, shows poor fit (RMSEA = 0.088), highlighting the superiority of the unrestricted model. This suggests that the model reflects the true relationships in the data and that its parameters are well suited to the survey data. This confirms that the UTAUT2 model, with age as a moderator, is appropriate for analyzing the acceptance of AVs across different age groups.
The acceptance of AVs, as analyzed through the lens of the UTAUT2 model with age as a moderating variable, revealed nuanced differences across age groups, as detailed in Table 8. Younger individuals, particularly those in their 20s, exhibited heightened sensitivity to risk, with a strongly negative influence on BIU that diminished progressively in older cohorts, notably among those in their 40s, 50s, and 60s. This heightened aversion among younger users likely reflects a greater perceived vulnerability or less familiarity with such technologies, thus amplifying perceived risks. In contrast, individuals in their 40s demonstrated a stronger relationship between BIU and ASU compared with younger groups, highlighting greater alignment between intention and behavior in midlife. While performance expectancy predicted policy support across all groups, its influence diminished with age, suggesting that younger cohorts prioritize performance-related benefits more heavily. Price value exhibits a generational dichotomy, acting as a deterrent for younger users but a motivator for older users. The 50s group showed significantly stronger associations between price value and BIU, and between BIU and ASU, emphasizing economic considerations in later life. Similarly, the 60s group displayed a stronger connection between BIU and ASU than the 20s group, whereas the 20s group maintained stronger relationships in constructs, such as facilitating conditions on BIU, hedonic motivation on social influence, and performance expectancy on policy support, with more pronounced negative associations with risk. In middle adulthood, individuals in their 30s exhibited heightened sensitivity to hedonic motivation, particularly its influence on facilitating conditions and social influence, while the 50s group demonstrates stronger links between price value and BIU. The influence of hedonic motivation on social influence and facilitating conditions weakens with age, indicating a shift from enjoyment to utility-driven adoption priorities. Notably, minimal differences were observed between the 40s and 60s or between the 50s and 60s groups, suggesting convergence in behavioral intentions and motivations among these older age cohorts. These findings underscore the critical role of age in moderating pathways within the UTAUT2 model, with younger groups exhibiting distinct motivational profiles and risk sensitivities compared with their older counterparts.
Table 8.
Age as a moderator in the adoption and use of AVs.
6. Discussion
This study explored the acceptance of AVs among a sample of 1000 commuters who owned a car or planned to purchase a vehicle in the next three years in Seoul, South Korea, utilizing an online questionnaire. This study was driven by the scarcity of research focusing on the acceptance of AVs within a large, demographically balanced sample from Seoul, incorporating age and gender factors. This study employed the UTAUT2 model to examine constructs such as performance expectancy, effort expectancy, social influence, facilitating conditions, price value, policy support, hedonic motivation, environment, and perceived risk as direct predictors of behavioral intention. In addition, this study considered the moderating effects of age, gender, and prior experience with advanced driver assistance systems on these relationships. The findings of this study have contributed to our understanding of the applicability of the UTAUT2 model in the context of AVs, particularly in identifying the most significant predictors of AV acceptance, and have provided insights into the broader issue of AV acceptance by quantifying its extent within the sample.
Figure 2 presents the reliability and validity measures (CR, AVE, and Alpha) for the key constructs influencing AV acceptance. These results highlight the robustness of performance expectancy, behavioral intention, and hedonic motivation, while price value and effort expectancy exhibit comparatively lower reliability, indicating potential barriers to adoption.
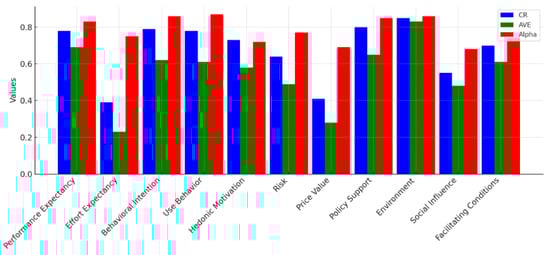
Figure 2.
Constructs influencing AV acceptance (CR, AVE, Alpha).
This study provides a comprehensive lens through which the determinants of AV adoption can be understood. Hedonic motivation emerged as a significant driver of AV acceptance in our study, aligning with the findings from prior studies in Western contexts (e.g., [12,16]). However, while previous research in North America [29,35] emphasizes trust and safety concerns as primary determinants of adoption, our study found that hedonic motivation played a substantial role in shaping AV acceptance in South Korea. This suggests that enjoyment and perceived technological innovation are particularly influential in this cultural context. The interplay of these factors not only highlights pivotal drivers but also underscores potential barriers to widespread acceptance. Policy support had a strong influence on AV adoption in our study, which aligns with findings from European studies where government interventions are key drivers of trust in AVs [28,33]. Our results further indicate that policy support plays a particularly significant role in shaping women’s acceptance of AVs, highlighting the need for targeted policy measures that address demographic variations. Perceived risk was a major barrier to AV acceptance in our study, particularly among younger users, which is consistent with Chinese and Japanese studies emphasizing risk aversion and regulatory concerns [24]. However, unlike findings from Western studies [25], which suggest that prior exposure to AV technology significantly mitigates perceived risk, our study indicates that risk perception remains high among younger users despite increasing technological familiarity.
Hedonic motivation emerged as a cornerstone construct, exhibiting substantial positive correlations with policy support, effort expectancy, BIU, and ASU. These findings are consistent with prior research by [12], who emphasized the role of hedonic motivation in technology adoption, and [16], who found that enjoyment plays a key role in influencing attitudes toward autonomous mobility. The robust influence of hedonic motivation suggests that enhancing the experiential and affective dimensions of AV technologies is integral to fostering user engagement. In this regard, designing AV interfaces and features that evoke enjoyment and satisfaction may serve as critical levers for AV adoption [7,17]. Price value, another significant determinant, demonstrated pronounced positive associations with BIU and ASU, aligning with the findings of [28], who argued that affordability and cost-effectiveness are major drivers in the adoption of emerging mobility technologies. The elevated correlation coefficient between price value and BIU highlights its dual function as both a motivator and an enabler. These findings imply that cost-effective solutions, coupled with clear value propositions, are pivotal for mitigating financial concerns and enhancing adoption rates.
Conversely, the analysis identified risk as a substantial inhibitory factor, with negative correlations observed for both BIU and ASU. Perceived risk was a major barrier to AV acceptance in our study, particularly among younger users, which is consistent with Chinese and Japanese studies emphasizing risk aversion and regulatory concerns [24]. However, unlike findings from Western studies [25], which suggest that prior exposure to AV technology significantly mitigates perceived risk, our study indicates that risk perception remains high among younger users despite increasing technological familiarity. These results reflect the critical role of perceived safety and reliability in user acceptance of AVs, which is consistent with prior studies by [29,36], who found that safety concerns act as major barriers to AV adoption. The inverse relationship between risk and adoption constructs underscores the need to address user concerns regarding technological uncertainties and potential adverse outcomes. Similarly, effort expectancy and policy support exhibited modest negative associations with ASU, suggesting that perceptions of high cognitive or physical effort, as well as inadequate institutional backing, may serve as deterrents to actual system use [35]. BIU emerged as a pivotal mediating variable, positively influenced by constructs such as price value, hedonic motivation, and social influence. These findings reinforce the multifaceted nature of user intentions, which are shaped by a confluence of motivational, contextual, and social factors [17]. However, the distinction in predictors for ASU, including its strong positive correlation with price value and negative association with risk, highlights the nuanced pathways through which behavioral intentions translate into actual use [7]. Taken together, these results underscore the complex interplay between motivational drivers, contextual enablers, and risk-related barriers in shaping AV adoption behaviors. The prominence of hedonic motivation and price value as critical enablers suggests that interventions aimed at increasing user enjoyment and affordability are likely to provide substantial benefits. These findings highlight the importance of mitigating perceived risks and addressing effort-related barriers through targeted policy and design interventions [9,71]. By integrating these insights, stakeholders can develop actionable strategies that not only enhance initial adoption but also foster sustained use, thereby contributing to the broader societal acceptance of AV technologies.
In the subsequent structural model, the moderating influences of age, gender, and prior experience with advanced driver assistance systems were examined regarding the relationships between UTAUT2 constructs. This study highlights significant gender differences in the adoption and use of AVs within the UTAUT2 framework. Key findings include stronger effects of hedonic motivation on social influence for men, while price value has a more pronounced impact on effort expectancy for women. These results align with the work of [25], who found that gender-based preferences influence technology adoption behaviors. Men are also more influenced by environment on behavioral intention, while policy support and risk play more critical roles for women, reinforcing findings from previous studies on gendered perspectives toward mobility innovations [32]. Relationships, such as social influence on performance expectancy, showed no significant gender differences. These results emphasize the importance of tailoring adoption strategies to gender-specific motivations. For men, enhancing enjoyment and addressing environmental factors are crucial, while women benefit more from affordability measures, policy support, and risk mitigation. These insights provide a foundation for designing inclusive and effective interventions to promote AV adoption.
Figure 3 illustrates the gender differences in AV adoption factors. The results indicate that hedonic motivation plays a stronger role in shaping social influence among men, whereas price value has a more pronounced effect on effort expectancy for women. Additionally, men exhibit greater sensitivity to environmental considerations, while policy support and risk perception are more influential for women.
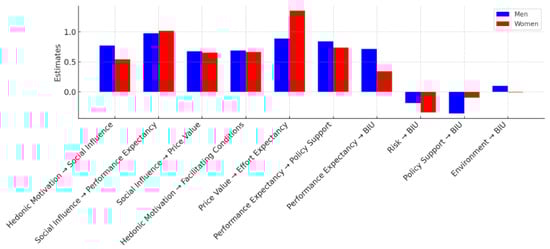
Figure 3.
Gender differences in AV adoption.
In addition, this study examined how user experience moderates relationships between key variables in the UTAUT2 model for adopting AVs. Significant findings include a stronger influence of hedonic motivation on facilitating conditions for experienced users and a more pronounced negative impact of risk on BIU for inexperienced users, similar to the findings of [15]. Moderately significant pathways, such as hedonic motivation on social influence, suggest some variability based on experience, although this is not statistically robust. Many relationships, such as performance expectancy on policy support, showed no significant moderation by experience, indicating their consistent relevance across user groups. These results suggest tailoring strategies to user familiarity, such as emphasizing enjoyment and support for experienced users while addressing risk concerns for inexperienced individuals, alongside maintaining universal approaches for broadly impactful constructs. This dual approach enhances the adoption and integration of AVs.
Figure 4 compares the impact of AV experience on key behavioral predictors. Experienced users display a stronger association between hedonic motivation and facilitating conditions, whereas inexperienced users exhibit heightened sensitivity to risk, which negatively affects their behavioral intention to use AVs.
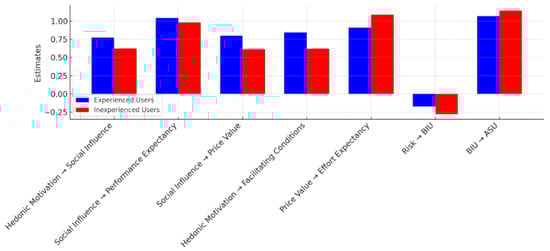
Figure 4.
Effect of AV experience on adoption factors.
Furthermore, age was examined as a moderating factor in the acceptance of AVs using the UTAUT2 model, confirming good fit through configural invariance tests and partial metric invariance. While factor loadings were consistent across age groups, indicating a shared understanding of survey items, age-related differences emerged in baseline attitudes (intercepts), structural relationships, and error variances. Younger users showed heightened sensitivity to risk and placed greater importance on performance expectancy, whereas older users exhibited a stronger relationship between BIU and ASU, indicating increased commitment and consistency in their adoption behavior. In addition, hedonic motivations declined with age, reflecting a transition from enjoyment-focused to utility-oriented priorities, as noted in prior studies by [18,33].
Figure 5 depicts the moderation effects of age on AV adoption. Younger users demonstrate a stronger negative relationship between risk and behavioral intention, while older users exhibit a more stable relationship between behavioral intention and actual system use. Additionally, the impact of hedonic motivation declines with age, reflecting a shift from enjoyment-driven adoption to more practical, utility-based decision-making.
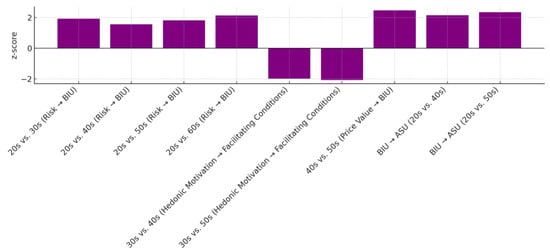
Figure 5.
Effect of age on AV adoption.
7. Conclusions
The study highlights key implications for AV adoption across policy, industry, and consumer engagement. Policy support is crucial, especially for women and older adults, requiring targeted regulations and incentives. Marketing strategies should address demographic differences—emphasizing safety for risk-averse groups, cost–benefit for older consumers, and environmental impact for male users. User experience must focus on enhancing enjoyment and intuitive design, while risk perception remains a major barrier, necessitating transparency, safety validation, and public education. Infrastructure development is critical to support AV deployment, and economic viability should be improved through subsidies and leasing options. Social influence plays a key role, requiring endorsements, media campaigns, and consumer testimonials to normalize AVs. Prior experience with ADAS (Advanced Driver Assistance System) increases acceptance, suggesting that exposure programs and trials could accelerate adoption. Future research should track long-term behavioral changes, cross-cultural differences, and evolving technologies to refine AV adoption strategies. These insights provide a roadmap for a smooth transition to autonomous mobility.
This study conducted a comprehensive analysis of public acceptance of AVs using an enhanced UTAUT2 model, incorporating constructs such as performance expectancy, social influence, hedonic motivation, price value, and perceived risk, along with contextual factors such as policy support and environment. Conducted in Seoul, South Korea, with a sample of 1000 regular commuters, this study offers significant insights into the predictors of AV adoption and the moderating effects of age, gender, and prior experience. Key constructs, such as performance expectancy, BIU, and ASU, exhibited strong reliability and emerged as primary drivers of acceptance, with participants recognizing the potential of AVs to enhance their quality of life and daily utility. Conversely, effort expectancy and price value demonstrated comparatively lower reliability, highlighting barriers such as usability challenges and economic considerations. The role of risk was particularly notable, exerting a significant inhibitory effect on both BIU and ASU, underscoring the critical need to address consumer concerns about safety and trust. Correlation analyses revealed hedonic motivation as a pivotal positive predictor across multiple constructs, emphasizing the importance of intrinsic enjoyment and satisfaction in shaping user intentions and behaviors. In addition, price value showed a strong positive correlation with both BIU and ASU, reaffirming the importance of cost-effectiveness in driving adoption. The interplay of motivational, contextual, and inhibitory factors, such as perceived effort and insufficient policy support, further illustrates the complexity of AV acceptance.
Moderation analyses offer deeper insights into demographic and experiential influences. Gender significantly moderated the relationships between constructs, with male participants exhibiting stronger hedonic motivations and social influences, while female participants demonstrated heightened sensitivity to policy support and price value. These differences underscore the importance of tailoring strategies to address gender-specific motivations and concerns. Experience with AVs also emerged as a critical moderating factor. Experienced users displayed stronger associations between hedonic motivation and facilitating conditions, while inexperienced users exhibited heightened sensitivity to risk, indicating the importance of targeted interventions in building familiarity and reducing apprehension among new users. Age was another significant moderator that revealed generational differences in adoption priorities. Younger users were more sensitive to risk and placed greater emphasis on performance expectancy, while older users demonstrated a stronger coupling between BIU and ASU, reflecting greater commitment and stability in their adoption behavior. Notably, hedonic motivations diminished with age, suggesting a shift in priorities from enjoyment to utility-driven factors. These findings collectively highlight the need for a nuanced and targeted approach to promoting AV adoption. Strategies should focus on reducing perceived risks, enhancing usability, and addressing demographic-specific concerns. Efforts to improve cost-effectiveness, facilitate institutional support, and prioritize user satisfaction will be crucial for fostering widespread acceptance. Moreover, recognizing and addressing the moderating effects of gender, age, and experience will be essential for developing inclusive policies and interventions tailored to diverse user groups.
8. Limitations and Future Research
The findings of this study should be interpreted with consideration of several limitations. First, as AVs are not yet commercially available, participants had no direct experience with them and were instead asked to imagine using such vehicles. This could lead to an overestimation of their perceived capabilities and an overall positive bias toward AVs. This positivity may have been further influenced by social desirability and acquiescence biases inherent in survey research, the novelty surrounding AV technology, and the influence of media marketing [72,73]. Second, this study did not explore the effects of respondents’ sociodemographic factors beyond age and gender. Future research should investigate the additional contributions of sociodemographic characteristics, travel behavior, and personality traits on the behavioral intention to adopt AVs. Third, behavioral intention was measured using two items: intention to use and intention to purchase AVs. While the literature supports this operationalization [74,75], the wording of the purchase intention item may have led to biased responses. Respondents may have disagreed with the purchase item not because they were unwilling to buy an AV but because of factors such as recent vehicle purchases or financial constraints. Therefore, disagreement with this item does not necessarily reflect a lack of interest in AVs. In addition, there has been increasing research on the willingness to pay for automated driving technology and its determinants [76,77,78]. Finally, because cross-country effects were not examined, the dataset is not representative of the broader South Korean population or even the entire population of Seoul. To fully harness the potential of a representative dataset, future research should consider conducting cross-country analyses. This study significantly advances the understanding of AV adoption dynamics and provides actionable insights for researchers, policymakers, and industry stakeholders.
Future research on AV acceptance should explore longitudinal studies tracking behavioral changes over time, cross-cultural comparisons to examine regulatory and infrastructural differences, and the role of habit formation in AV usage. Given the significant impact of perceived risk, scholars should investigate trust-building mechanisms such as transparency in decision-making and safety certifications. The impact of technological advancements, including AI-driven safety features and vehicle-to-infrastructure (V2I) communication, warrants further examination. Additionally, research should assess demographic and socio-economic influences beyond age and gender, exploring factors such as income, education, and urbanization. Investigating consumers’ willingness to pay, policy incentives, and human–machine interaction (HMI) will provide valuable insights into user engagement. Ethical and legal considerations, including liability and privacy concerns, must also be addressed. Moreover, integrating AV adoption models with mobility simulations could provide deeper insights into how AVs influence traffic flow, transportation networks, and urban mobility patterns. Finally, the role of social influence, peer networks, and media representation in shaping public perceptions of AVs remains an essential area for future exploration.
Author Contributions
Methodology, E.A.V.; Validation, E.A.V. and J.K.; Formal analysis, E.A.V.; Data curation, E.A.V.; Writing—original draft, E.A.V.; Writing—review & editing, J.K.; Supervision, J.K.; Project administration, J.K.; Funding acquisition, J.K. All authors have read and agreed to the published version of the manuscript.
Funding
This research was supported by the Korea Institute of Police Technology (KIPoT) grant funded by the Korea government (KNPA) (No. 092021C28S01000, Development of integrated road traffic control system and operation technology when autonomous driving is mixed with normal vehicles).
Institutional Review Board Statement
Ethical review and approval were waived for this study because this research consists of a questionnaire on the acceptance of self-driving cars, with no collection of sensitive personal data or interventions affecting participants. According to the regulations of Hanyang University Ethics Committee, this type of study is exempt from ethical review requirements (https://irb.hanyang.ac.kr/02_guide/guide02.html).
Informed Consent Statement
Informed consent was obtained from all subjects involved in the study.
Data Availability Statement
The raw data supporting the conclusions of this article will be made available by the authors on request.
Conflicts of Interest
The authors declare no conflict of interest.
References
- Park, J.; Jang, S.; Ko, J. Effects of Exclusive Lanes for Autonomous Vehicles on Urban Expressways under Mixed Traffic of Autonomous and Human-Driven Vehicles. Sustainability 2024, 16, 26. [Google Scholar] [CrossRef]
- Berghöfer, F.L.; Purucker, C.; Naujoks, F.; Wiedemann, K.; Marberger, C. Prediction of Take-Over Time Demand in Conditionally Automated Driving—Results of a Real-World Driving Study. In Proceedings of the Human Factors and Ergonomics Society Europe Chapter 2018 Annual Conference, Berlin, Germany, 8–10 October 2018; de Waard, D., Brookhuis, K., Coelho, D., Fairclough, S., Manzey, D., Neumann, A., Onnasch, L., Röttger, S., Toffetti, A., Wiczorek, R., Eds.; 2019. Available online: http://hfes-europe.org (accessed on 13 January 2022), ISSN 2333-4959 (online).
- Gold, C.; Happee, R.; Bengler, K. Modeling Take-Over Performance in Level 3 Conditionally Automated Vehicles. Accid. Anal. Prev. 2018, 116, 3–13. [Google Scholar]
- Naujoks, F.; Forster, Y.; Wiedemann, K.; Neukum, A. Improving Usefulness of Automated Driving by Lowering Primary Task Interference through HMI Design. J. Adv. Transp. 2017, 2017, 6105087. [Google Scholar] [CrossRef]
- Naujoks, F.; Befelein, D.; Wiedemann, K.; Neukum, A. Stanton, N., Ed.; A Review of Non-Driving Related Tasks Used in Studies on Automated Driving. In Advances in Human Aspects of Transportation, Proceedings of the AHFE 2017 Advances in Intelligent Systems and Computing Los Angeles, CA, USA, 17–21 July 2017; Stanton, N., Ed.; Springer: Cham, Switzerland, 2018; Volume 597, pp. 525–537. [Google Scholar]
- Medina, K.F.; Jenkins, R. GATEway: Public Perceptions of a Last-Mile Driverless Shuttle; Gateway: Irvine, CA, USA, 2017; Available online: https://www.trl.co.uk/Uploads/TRL/Documents/D3.7_TRL-Workshop-Findings-Report.pdf (accessed on 30 May 2019).
- Litman, T. Autonomous Vehicle Implementation Predictions: Implications for Transport Planning; Victoria Transport Policy Institute: Victoria, BC, Canada, 2019; Available online: https://www.vtpi.org/avip.pdf (accessed on 31 May 2019).
- Venkatesh, V.; Morris, M.G.; Davis, G.B.; Davis, F.D. User Acceptance of Information Technology: Toward a Unified View. MIS Q. 2003, 27, 425–478. [Google Scholar]
- Rahman, M.M.; Lesch, M.F.; Horrey, W.J.; Strawderman, L. Assessing the Utility of TAM, TPB, and UTAUT for Advanced Driver Assistance Systems. Accid. Anal. Prev. 2017, 108, 361–373. [Google Scholar] [PubMed]
- Ajzen, I. From Intentions to Actions: A Theory of Planned Behavior. In Action-Control: From Cognition to Behavior; Kuhl, J., Beckmann, J., Eds.; Springer: Berlin/Heidelberg, Germany, 1985; pp. 11–39. [Google Scholar]
- Venkatesh, V.; Davis, F.D. A Theoretical Extension of the Technology Acceptance Model: Four Longitudinal Field Studies. Manag. Sci. 2000, 46, 186–204. [Google Scholar]
- Venkatesh, V.; Thong, J.Y.L.; Xu, X. Consumer Acceptance and Use of Information Technology: Extending the Unified Theory of Acceptance and Use of Technology. MIS Q. 2012, 36, 157–178. [Google Scholar]
- Kaur, K.; Rampersad, G. Trust in Driverless Cars: Investigating Key Factors Influencing the Adoption of Driverless Cars. J. Eng. Technol. Manag. 2018, 48, 87–96. [Google Scholar]
- Kaye, S.A.; Lewis, I.; Buckley, L.; Rakotonirainy, A. Examining Queensland Drivers’ A Priori Acceptance of Conditional and Full Automated Vehicles. In Proceedings of the 2019 Australasian Road Safety Conference, Adelaide, Australia, 25–27 September 2019. [Google Scholar]
- Madigan, R.; Louw, T.; Dziennus, M.; Graindorge, T.; Ortega, E.; Graindorge, M.; Merat, N. Acceptance of Automated Road Transport Systems (ARTS): An Adaptation of the UTAUT Model. In Proceedings of the 6th Transport Research Arena, Warsaw, Poland, 18–21 April 2016. [Google Scholar]
- Madigan, R.; Louw, T.; Wilbrink, M.; Schieben, A.; Merat, N. What Influences the Decision to Use Automated Public Transport? Using UTAUT to Understand Public Acceptance of Automated Road Transport Systems. Transp. Res. Part F Traffic Psychol. Behav. 2017, 50, 55–64. [Google Scholar]
- Xu, Z.; Zhang, K.; Min, H.; Wang, Z.; Zhao, X.; Liu, P. What Drives People to Accept Automated Vehicles? Findings from a Field Experiment. Transp. Res. Part F Traffic Psychol. Behav. 2018, 95, 320–334. [Google Scholar]
- Zhang, T.; Tao, D.; Qu, X.; Zhang, X.; Lin, R.; Zhang, W. The Roles of Initial Trust and Perceived Risk in Public’s Acceptance of Automated Vehicles. Transp. Res. Part C Emerg. Technol. 2019, 98, 207–220. [Google Scholar] [CrossRef]
- Zhang, T.; Tao, D.; Qu, X.; Zhang, X.; Zeng, J.; Zhu, H.; Zhu, H. Automated Vehicle Acceptance in China: Social Influence and Initial Trust Are Key Determinants. Transp. Res. Part C Emerg. Technol. 2020, 112, 220–233. [Google Scholar] [CrossRef]
- Buckley, L.; Kaye, S.A.; Pradhan, A.K. Psychological Factors Associated with Intended Use of Automated Vehicles: A Simulated Driving Study. Accid. Anal. Prev. 2018, 115, 202–208. [Google Scholar] [CrossRef] [PubMed]
- Wu, J.; Liao, H.; Wang, J.W.; Chen, T. The Role of Environmental Concern in the Public Acceptance of Autonomous Electric Vehicles: A Survey from China. Transp. Res. Part F Traffic Psychol. Behav. 2019, 60, 37–46. [Google Scholar]
- Ovestad, G.; Eliassen, D. Exploring Policy Influence on Diffusion in an Autonomous Vehicle Context. Master’s Thesis, University of Stavanger, Stavanger, Norway, 2020. [Google Scholar]
- Yuen, K.F.; Wong, Y.D.; Ma, F.; Wang, X. The Determinants of Public Acceptance of Autonomous Vehicles: An Innovation Diffusion Perspective. J. Clean. Prod. 2020, 270, 121904. [Google Scholar]
- Jing, P.; Xu, G.; Chen, Y.; Shi, Y.; Zhan, F. The Determinants Behind the Acceptance of Autonomous Vehicles: A Systematic Review. Sustainability 2020, 12, 1719. [Google Scholar] [CrossRef]
- Butler, L.; Yigitcanlar, T.; Paz, A. Factors Influencing Public Awareness of Autonomous Vehicles: Empirical Evidence from Brisbane. Transp. Res. Part F Traffic Psychol. Behav. 2021, 82, 256–267. [Google Scholar] [CrossRef]
- Nordhoff, S.; Malmsten, V.; van Arem, B.; Liu, P.; Happee, R. A Structural Equation Modeling Approach for the Acceptance of Driverless Automated Shuttles Based on Constructs from the Unified Theory of Acceptance and Use of Technology and the Diffusion of Innovation Theory. Transp. Res. Part F Traffic Psychol. Behav. 2021, 78, 58–73. [Google Scholar] [CrossRef]
- Tamilmani, K.; Rana, N.P.; Wamba, S.F.; Dwivedi, R. The Extended Unified Theory of Acceptance and Use of Technology (UTAUT2): A Systematic Literature Review and Theory Evaluation. Int. J. Inf. Manag. 2021, 57, 102269. [Google Scholar] [CrossRef]
- Gkartzonikas, C.; Gkritza, K. What Have We Learned? A Review of Stated Preference and Choice Studies on Autonomous Vehicles. Transp. Res. Part C Emerg. Technol. 2019, 98, 323–337. [Google Scholar] [CrossRef]
- Kyriakidis, M.; Happee, R.; de Winter, J.C.F. Public Opinion on Automated Driving: Results of an International Questionnaire Among 5,000 Respondents. Transp. Res. Part F Traffic Psychol. Behav. 2015, 32, 127–140. [Google Scholar] [CrossRef]
- Anderson, J.M.; Kalra, N.; Stanley, K.D.; Sorensen, P.; Samaras, C.; Oluwatola, O.A. Autonomous Vehicle Technology: A Guide for Policymakers; RAND Corporation: Santa Monica, CA, USA, 2014. [Google Scholar]
- Hensher, D.A.; Beck, M.J.; Wei, E. The Impacts of Autonomous Vehicles on Future Travel Demand and the Implications for Public Transport. Transp. Res. Part A Policy Pract. 2015, 94, 1–13. [Google Scholar]
- Tussyadiah, I.P.; Park, S.; Chen, S. Drivers and Barriers of Autonomous Vehicle Adoption: A Cross-National Study. Transp. Res. Part C Emerg. Technol. 2020, 118, 102722. [Google Scholar]
- Kester, J.; van der Heijden, M.; Veeneman, W. The Role of Environmental Benefits in the Adoption of Autonomous Vehicles: Evidence from a Survey. Transp. Res. Part D Transp. Environ. 2019, 67, 35–50. [Google Scholar]
- KPMG. Autonomous Vehicles Readiness Index: Are Consumers Ready for Self-Driving Cars? KPMG International: Amstelveen, The Netherlands, 2020. [Google Scholar]
- Zmud, J.; Sener, I.N. Towards an Understanding of the Travel Behavior Impact of Autonomous Vehicles. Transp. Res. Procedia 2017, 25, 2500–2519. [Google Scholar] [CrossRef]
- Schoettle, B.; Sivak, M. A Survey of Public Opinion About Autonomous and Self-Driving Vehicles in the U.S., the U.K. and Australia; University of Michigan: Ann Arbor, MI, USA, 2014. [Google Scholar]
- Anderson, J.C.; Gerbing, D.W. Structural Equation Modeling in Practice: A Review and Recommended Two-Step Approach. Psychol. Bull. 1988, 103, 411–423. [Google Scholar] [CrossRef]
- Fornell, C.; Larcker, D.F. Evaluating Structural Equation Models with Unobservable Variables and Measurement Error. J. Mark. Res. 1981, 18, 39–50. [Google Scholar] [CrossRef]
- Hair, J.; Black, W.C.; Babin, B.J.; Anderson, R.E. Multivariate Analysis; Pearson New International Edition: Harlow, UK, 2014. [Google Scholar]
- Kline, R.B. Principles and Practice of Structural Equation Modeling; Guilford Publications: New York, NY, USA, 2023. [Google Scholar]
- Brown, T.A. Confirmatory Factor Analysis for Applied Research; Guilford Press: New York, NY, USA, 2015. [Google Scholar]
- Hooper, D.; Coughlan, J.; Mullen, M. Structural Equation Modelling: Guidelines for Determining Model Fit. Electron. J. Bus. Res. Methods 2008, 6, 53–60. [Google Scholar]
- Hu, L.; Bentler, P.M. Cutoff Criteria for Fit Indexes in Covariance Structure Analysis: Conventional Criteria versus New Alternatives. Struct. Equ. Model. A Multidiscip. J. 2009, 6, 1–55. [Google Scholar] [CrossRef]
- Schreiber, J.B.; Nora, A.; Stage, F.K.; Barlow, E.A.; King, J. Reporting Structural Equation Modeling and Confirmatory Factor Analysis Results: A Review. J. Educ. Res. 2006, 99, 323–338. [Google Scholar] [CrossRef]
- Du, H.; Liu, D.; Sovacool, B.K.; Wang, Y.; Ma, S.; Man Li, R.Y. Who Buys New Energy Vehicles in China? Assessing Socio-Psychological Predictors of Purchasing Awareness, Intention, and Policy. Transp. Res. Part F Traffic Psychol. Behav. 2018, 58, 56–69. [Google Scholar]
- Hair, J.F.; Black, W.C.; Babin, B.J.; Anderson, R.E. Multivariate Data Analysis, 7th ed.; Prentice Hall: Hoboken, NJ, USA, 2010. [Google Scholar]
- Byrne, B.M. Structural Equation Modeling with AMOS Basic Concepts, Applications, and Programming, 3rd ed.; Routledge: Oxfordshire, UK, 2016. [Google Scholar]
- Fabrigar, L.R.; Wegener, D.T. Exploratory Factor Analysis; Oxford University Press: Oxford, UK, 2012. [Google Scholar]
- Schumacker, R.E.; Lomax, R.G. A Beginner’s Guide to Structural Equation Modeling, 4th ed.; Routledge: Oxfordshire, UK, 2016. [Google Scholar]
- MacCallum, R.C.; Roznowski, M.; Necowitz, L.B. Model Modifications in Covariance Structure Analysis: The Problem of Capitalization on Chance. Psychol. Bull. 1992, 111, 490–504. [Google Scholar] [PubMed]
- Davis, F.D. Perceived Usefulness, Perceived Ease of Use, and User Acceptance of Information Technology. MIS Q. 1989, 13, 319–340. [Google Scholar]
- Taylor, S.; Todd, P. Understanding Information Technology Usage: A Test of Competing Models. Inf. Syst. Res. 1995, 6, 144–176. [Google Scholar]
- Park, E.; Lim, J.; Cho, Y. Understanding the Emergence and Social Acceptance of Electric Vehicles as Next-Generation Models for the Automobile Industry. Sustainability 2018, 10, 662. [Google Scholar] [CrossRef]
- Fishbein, M.; Ajzen, I. Belief, Attitude, Intention, and Behavior—An Introduction to Theory and Research; Addison-Wesley: Reading, MA, USA, 1977. [Google Scholar]
- Abbasi, H.; Johl, S.; Shaari, Z.; Moughal, W.; Mazhar, M.; Musarat, M.; Borovkov, A. Consumer Motivation by Using Unified Theory of Acceptance and Use of Technology Towards Electric Vehicles. Sustainability 2021, 13, 12177. [Google Scholar] [CrossRef]
- Khazaei, H.; Tareq, M. Moderating Effects of Personal Innovativeness and Driving Experience on Factors Influencing Adoption of BEVs in Malaysia: An Integrated SEM–BSEM Approach. Heliyon 2021, 7, e07899. [Google Scholar] [CrossRef]
- Agarwal, R.; Prasad, J. A Conceptual and Operational Definition of Personal Innovativeness in the Domain of Information Technology. Inf. Syst. Res. 1998, 9, 204–215. [Google Scholar]
- Wang, N.; Tian, H.; Zhu, S.; Li, Y. Analysis of Public Acceptance of Electric Vehicle Charging Scheduling Based on the Technology Acceptance Model. Energy 2022, 258, 124804. [Google Scholar]
- Walter, J.; Abendroth, B. On the Role of Informational Privacy in Connected Vehicles: A Privacy-Aware Acceptance Modelling Approach for Connected Vehicular Services. Telemat. Inform. 2020, 49, 101361. [Google Scholar]
- Choi, J.; Ji, Y. Investigating the Importance of Trust on Adopting an Autonomous Vehicle. Int. J. Hum. Comput. Interact. 2015, 31, 692–702. [Google Scholar] [CrossRef]
- Shanmugavel, N.; Micheal, M. Exploring the Marketing Related Stimuli and Personal Innovativeness on the Purchase Intention of Electric Vehicles through Technology Acceptance Model. Clean. Logist. Supply Chain. 2022, 3, 100029. [Google Scholar] [CrossRef]
- Ali, A.; Krapfel, R., Jr.; LaBahn, D. Product Innovativeness and Entry Strategy: Impact on Cycle Time and Break-Even Time. J. Prod. Innov. Manag. 1995, 12, 54–69. [Google Scholar] [CrossRef]
- Jaiswal, D.; Kaushal, V.; Kant, R.; Singh, P.K. Consumer Adoption Intention for Electric Vehicles: Insights and Evidence from Indian Sustainable Transportation. Technol. Forecast. Soc. Change 2021, 173, 121089. [Google Scholar] [CrossRef]
- Wang, S.; Li, J.; Zhao, D. The Impact of Policy Measures on Consumer Intention to Adopt Electric Vehicles: Evidence from China. Transp. Res. Part A Policy Pract. 2017, 105, 14–26. [Google Scholar] [CrossRef]
- Wang, S.; Wang, J.; Li, J.; Wang, J.; Liang, L. Policy Implications for Promoting the Adoption of Electric Vehicles: Do Consumer’s Knowledge, Perceived Risk and Financial Incentive Policy Matter? Transp. Res. Part A Policy Pract. 2018, 117, 58–69. [Google Scholar] [CrossRef]
- Ha, H.Y.; Janda, S. Predicting Consumer Intentions to Purchase Energy-Efficient Products. J. Consum. Mark. 2012, 29, 461–469. [Google Scholar] [CrossRef]
- Kim, Y.; Choi, S.M. Antecedents of Green Purchase Behavior: An Examination of Collectivism, Environmental Concern, and PCE. ACR N. Am. Adv. 2005, 32, 592. [Google Scholar]
- Shi, H.; Fan, J.; Zhao, D. Predicting Household PM2.5-Reduction Behavior in Chinese Urban Areas: An Integrative Model of Theory of Planned Behavior and Norm Activation Theory. J. Clean. Prod. 2017, 145, 64–73. [Google Scholar] [CrossRef]
- Curtale, R.; Liao, F.; Van der Waerden, P. User Acceptance of Electric Car-Sharing Services: The Case of the Netherlands. Transp. Res. Part A Policy Pract. 2021, 149, 266–282. [Google Scholar] [CrossRef]
- Bailey, J.; Axsen, J. Anticipating PEV Buyers’ Acceptance of Utility Controlled Charging. Transp. Res. Part A Policy Pract. 2015, 82, 29–46. [Google Scholar]
- Rahman, M.M.; Thill, J.-C. What Drives People’s Willingness to Adopt Autonomous Vehicles? A Review of Internal and External Factors. Sustainability 2023, 15, 11541. [Google Scholar] [CrossRef]
- Lee, C.; Seppelt, B.; Abraham, H.; Reimer, B.; Mehler, B.; Coughlin, J.F. Consumer Comfort with Vehicle Automation: Changes Over Time. In Proceedings of the Tenth International Driving Symposium on Human Factors in Driver Assessment, Training, and Vehicle Design, Santa Fe, NM, USA, 24–27 June 2019; pp. 412–418. [Google Scholar]
- Nordhoff, S.; De Winter, J.; Payre, W.; Van Arem, B.; Happee, R. What Impressions Do Users Have After a Ride in an Automated Shuttle? An Interview Study. Transp. Res. Part F Traffic Psychol. Behav. 2019, 63, 252–269. [Google Scholar] [CrossRef]
- McDonald, M.; Site, P.D.; Stam, D.; Salucci, M.V. Evaluation of Automated Road Transport Systems in Cities. In Implementing Automated Road Transport Systems in Urban Settings; Elsevier: Amsterdam, The Netherlands, 2018; pp. 81–207. [Google Scholar]
- Wu, J.; Liao, H.; Wang, J.W. Analysis of Consumer Attitudes Towards Autonomous, Connected, and Electric Vehicles: A Survey in China. Transp. Econ. 2020, 80, 100828. [Google Scholar]
- Asgari, H.; Jin, X. Incorporating Attitudinal Factors to Examine Adoption and Willingness to Pay for Automated Vehicles. Transp. Res. Rec. 2019, 2673, 418–429. [Google Scholar]
- Liu, P.; Guo, Q.; Ren, F.; Wang, L.; Xu, Z. Willingness to Pay for Self-Driving Vehicles: Influences of Demographic and Psychological Factors. Transp. Res. Part F Traffic Psychol. Behav. 2019, 100, 306–317. [Google Scholar]
- Tsouros, I.; Polydoropoulou, A. Who Will Buy Alternative Fueled or Automated Vehicles: A Modular, Behavioral Modeling Approach. Transp. Res. Part A Policy Pract. 2020, 132, 214–225. [Google Scholar] [CrossRef]
Disclaimer/Publisher’s Note: The statements, opinions and data contained in all publications are solely those of the individual author(s) and contributor(s) and not of MDPI and/or the editor(s). MDPI and/or the editor(s) disclaim responsibility for any injury to people or property resulting from any ideas, methods, instructions or products referred to in the content. |
© 2025 by the authors. Licensee MDPI, Basel, Switzerland. This article is an open access article distributed under the terms and conditions of the Creative Commons Attribution (CC BY) license (https://creativecommons.org/licenses/by/4.0/).