1. Introduction
Agriculture remains a critical sector ensuring global food security, providing essential resources to sustain the growing world population. However, the sector faces multifaceted challenges arising from climate volatility, resource constraints, and pest pressures. As the world’s population continues to rise, securing a stable food supply becomes increasingly complex. Shifting weather patterns, environmental disturbances, and the rise in extreme weather events exacerbate the behavior, distribution, and population dynamics of agricultural pests. These pests, such as Jassid (
Amrasca biguttula) and Thrips (
Thrips tabaci), have the potential to cause substantial damage to crops like cotton, okra, and horticultural produce, leading to severe economic losses and jeopardizing food security on a global scale [
1,
2,
3]. The urgency for more accurate, data-driven pest management strategies has never been greater, especially in the face of the unprecedented challenges posed by climate change [
4,
5,
6].
The impacts of climate change on agriculture are far-reaching and multifactorial. Rising temperatures, altered precipitation regimes, and more frequent extreme weather events have direct and indirect effects on pest ecology [
7,
8,
9]. Warmer temperatures can accelerate pest life cycles, leading to multiple generations in a single growing season, increasing the likelihood of infestations. Changes in humidity and rainfall further enhance pest survival rates and affect their distribution, complicating the task of pest control [
10,
11]. These climate-induced changes necessitate a proactive, dynamic approach to pest management, one that can adapt to rapidly changing conditions. Understanding weather-pest linkages and using predictive models to anticipate pest outbreaks are critical in this new climate reality, offering the potential for more precise, timely interventions and more resilient agricultural systems [
12,
13].
The modernization of agriculture has been facilitated by advanced sensing technologies (e.g., IoT-based sensors, remote sensing) and high-resolution climate data sets. Machine learning (ML) and artificial intelligence (AI) models, leveraging these data streams, now enable forecasting of pest occurrences, disease outbreaks, and yield fluctuations with unprecedented accuracy [
14,
15]. As agriculture faces increasing challenges due to climate change and pest pressures, advanced technologies are crucial for effective pest management. The integration of remote sensing and computational models is essential, as demonstrated by Ma and Liu (2020), who proposed a modified geometrical optical model for row crops, enhancing pest prediction through better light interaction analysis [
16]. Additionally, genetic studies, such as those by Yang et al. (2019), highlight the potential for crop resilience through the identification of genes that can improve pest resistance [
17]. The development of innovative chemical agents also plays a role in integrated pest management, with Chen et al. (2024) discovering novel anti-plant viral compounds [
18], and Huang et al. (2024) investigating the use of cyclopropane-based pesticides to minimize environmental harm [
19].
Moreover, the data-driven models enable early warnings and allow for targeted, site-specific interventions, reducing the need for broad pesticide application and minimizing environmental impacts. Moreover, predictive models help optimize agricultural productivity, reduce costs, and ensure the economic viability of farming [
20,
21,
22].
Despite their clear advantages, the integration of predictive models into existing agricultural systems is not without its challenges. While ML and AI have shown impressive accuracy in pest prediction, their black-box nature often hinders their adoption by farmers, agronomists, and policymakers [
23,
24]. Without transparency, stakeholders may be hesitant to trust AI-driven recommendations, fearing unpredictability and lack of interpretability. This lack of trust can delay or prevent the widespread adoption of these technologies, limiting their potential impact on pest management. The recent advent of eXplainable AI (XAI) frameworks seeks to address these challenges by enhancing the interpretability of model predictions. By revealing the underlying drivers and providing actionable insights, XAI makes AI models more accessible to agricultural stakeholders, fostering trust and facilitating their integration into pest management practices [
25,
26].
This study aims to predict the presence of Jassid and Thrips based on key local weather parameters, including maximum and minimum temperature, relative humidity, wind speed, sunshine hours, and evaporation. Using five different ML classifiers, this study seeks to identify the most accurate and reliable model for pest prediction. To enhance the interpretability of these predictions, this study applies SHAP (SHapley Additive exPlanations) values, allowing us to uncover the importance of various weather parameters in pest infestations.
The main contributions of this study are threefold:
This study develops robust ML-based models to predict Jassid and Thrips infestation using six key meteorological predictors, demonstrating high accuracy and early warning capabilities.
By employing SHAP to explain model outputs, this study bridges the gap between black-box ML predictions and the interpretability desired by agricultural stakeholders. This fosters trust, facilitates better decision-making, and promotes the operationalization of AI-driven solutions.
Our explainability analysis reveals that relative humidity, minimum temperature, and maximum temperature significantly influence pest infestations. Understanding these drivers can inform climate-resilient pest management strategies and guide future research in crop protection and integrated pest management (IPM) frameworks.
2. Literature Review
This section surveys the existing literature on pest prediction models, the role of weather and climate variables in pest population dynamics, the use of AI and ML techniques in agriculture, and the emergence of explainable AI frameworks. This study emphasizes recent studies that highlight the intersection of advanced modeling techniques and the growing need for transparency, which form the basis of this research.
2.1. Pest Prediction Models and Environmental Correlation
The relationship between environmental parameters and pest dynamics is a well-established foundation in pest prediction model development. Jassids (Amrasca biguttula biguttula) and Thrips are prime examples of pests whose population fluctuations are closely linked to environmental conditions. Understanding these correlations is crucial for forecasting pest outbreaks and developing Integrated Pest Management (IPM) strategies. However, previous studies predominantly focus on basic meteorological parameters such as temperature and humidity, while other meteorological factors like solar radiation intensity or sudden seasonal variations have been underexplored.
In the case of Jassids, several studies highlight the influence of temperature, humidity, and other environmental factors on population growth and survivorship. For instance, ref. [
27] demonstrated that Jassid populations on okra were significantly correlated with temperature and relative humidity. Their work showed that moderate temperatures combined with relatively higher humidity favor Jassid proliferation, increasing feeding damage and subsequent crop yield reduction. Similarly, ref. [
28] noted that temperature and humidity levels not only affected the developmental rates and survival of Jassids but also influenced their interaction with host plants.
Thrips, on the other hand, are also closely tied to environmental variables. Researchers in [
29] illustrated that Thrips species thrive under specific temperature and humidity ranges, often experiencing population surges in warm, humid conditions. Likewise, ref. [
30] further supported these findings by demonstrating that specific temperature and precipitation patterns influence the seasonal flight activity of Thrips, altering their colonization dynamics and spread within crop fields. These studies collectively highlight the importance of integrating weather data—such as temperature extremes, humidity levels, and precipitation patterns—into pest prediction models. By correlating observed pest incidence with these environmental cues, models can learn to anticipate outbreak windows, forecast potential severity, and guide timely interventions. Such predictive frameworks offer essential benefits, including reduced pesticide applications, sustainable resource allocation, and improved economic returns for farmers. As climate change continues to reshape local and regional weather patterns, refining and updating these correlation-based models with real-time meteorological data and advanced computational techniques becomes increasingly critical, ensuring that management strategies remain adaptive, effective, and ecologically sound.
The growing importance of predictive pest models in the context of food security has made it imperative to integrate accurate forecasting systems that help prevent crop losses, minimize pesticide use, and improve resource allocation in agriculture. Although statistically oriented models, such as regression and generalized linear models, have provided early insights into pest dynamics, they often fail to capture the complex non-linear interactions between multiple environmental variables, which limits their predictive power. In contrast, machine learning models can learn from data to model such interactions more accurately.
Recent research has integrated environmental and phenological data to build predictive models. For example, ref. [
31] studied climate-driven population dynamics of Thrips abundance. Other works have applied regression models, generalized linear models, or statistical correlation techniques to link weather parameters (e.g., temperature, humidity, rainfall) to pest abundance and spread. One example is in [
32], which uses Long Short Term Memory networks to predict Cotton pests. Although statistically oriented models provided early insights, machine learning approaches have shown the potential to improve prediction accuracy and capture non-linear interactions. While studies have primarily focused on temperature and humidity as the key drivers of pest dynamics, less emphasized factors like solar radiation intensity and sudden seasonal variations may also play significant roles in shaping pest population trends, suggesting a need for more comprehensive modeling approaches.
2.2. Machine Learning Approaches in Pest Management
Machine learning has rapidly become a cornerstone of precision agriculture. A larger number of ML algorithms, including Random Forests, SVM, Artificial Neural Networks (ANN), and gradient boosting methods, have been employed to address various agricultural challenges. In pest management, these algorithms leverage large datasets of historical weather records, pest scouting information, and agronomic practices to forecast pest outbreaks [
28]. As mentioned in [
33], the three approaches used for pest infestation prediction are:
Regression Approach: Uses advanced regression algorithms to predict the number of pests in a specific area by analyzing the relationship between climatic factors and pest abundance.
Classification Approach: Categorizes areas into “infested” or “non-infested” based on climatic variables and pest invasion patterns. This study focuses on the prediction of pest species invasions within a specific geographic region. It also employs the examination of the relationship between climatic variables and the invasion of pest species.
Time Series Approach: Employs forecasting methods like moving averages, ARIMA, and SARIMA to predict pest numbers using past data. It provides accurate pest quantity predictions over time.
Another study [
34] highlights the transformative potential of deep learning in pest management by automating tasks such as pest detection and agrochemical efficacy assessment. The study emphasizes the advantages of deep learning models in processing complex data patterns. Moreover, the research mentioned in [
35] reviews various ML algorithms, including random forest (RF), support vector machine (SVM), decision tree (DT), and naïve Bayes (NB), as well as DL methods like convolutional neural networks (CNNs), long short-term memory (LSTM), deep convolutional neural networks (DCNNs), and deep belief networks (DBNs), emphasizing their roles in enhancing pest detection accuracy.
2.3. Significance of Explainable AI (XAI)
Despite improved accuracy, ML-based models often function as “black boxes”, making it difficult to understand why a model makes a particular prediction. In the agricultural domain, this lack of transparency can hinder trust and limit adoption among end-users who seek understandable recommendations. XAI techniques provide a systematic framework to demystify model behavior. Explainable artificial intelligence (XAI) aims to provide a suite of machine learning techniques that enable human users to understand, appropriately trust, and produce more explainable models [
36]. Techniques like LIME, SHAP, and Grad-CAM have been applied to various agricultural contexts [
37]. These methods quantify feature contributions to model predictions, enabling domain experts to verify that the model aligns with established scientific knowledge and does not rely on spurious correlations.
3. Dataset
For this research, an open-source dataset, as used in [
32], was utilized to classify two types of pests,
Jassid and
Thrips, along with a
No Pest category. The dataset, collected over several growing seasons of cotton crops, was engineered to represent these three classes:
Jassid,
Thrips, and
No Pest.
The data were sourced from field observations, with environmental parameters measured at various points during the growing seasons and organized according to the Standard Meteorological Week (SMW). These observations were recorded at multiple sites to capture regional variability in environmental conditions. However, potential sources of error include inconsistencies in measurements due to instrument calibration issues or data entry errors, as well as variations in local environmental conditions across different regions. To minimize these errors, all recorded data underwent a comprehensive cleaning process that involved removing or correcting inconsistent readings, conducting outlier detection, and verifying data consistency against known environmental patterns.
A total of six meteorological factors were chosen for this study based on their well-established relevance to pest activity in prior research. These features include temperature (MaxT, MinT), humidity (RH1, RH2), wind speed (WS), sunshine hours (SSH), evaporation (EVP), and rainfall (RF). These factors have been identified in numerous studies as key drivers of pest behavior, influencing aspects such as pest reproduction, movement, and feeding habits [
38,
39]. For instance, temperature and humidity directly affect pest metabolism, while rainfall and wind speed impact pest dispersal. The inclusion of these six features allows the model to account for both local and seasonal environmental influences on pest populations, providing a comprehensive understanding of the ecological conditions that drive pest presence.
A summary of the features recorded in the dataset is provided in
Table 1. These parameters were used to predict the presence or absence of pests, categorized into three classes:
Jassid,
Thrips, and
No Pest.
Before the model training, the dataset underwent a rigorous data cleaning process, which involved eliminating missing or inconsistent readings, along with outlier detection and correction. To ensure the data’s consistency and comparability, all features were standardized using either normalization or min-max scaling, depending on the feature’s distribution. This was done to prevent variables with larger numeric ranges from dominating the analysis.
Feature engineering was deliberately kept minimal to preserve the ecological validity of the dataset, ensuring that the features remained aligned with the real-world environmental conditions. Finally, the dataset was split into training and testing sets using a stratified 80:20 ratio. This stratified approach ensured that each class,
Jassid,
Thrips, and
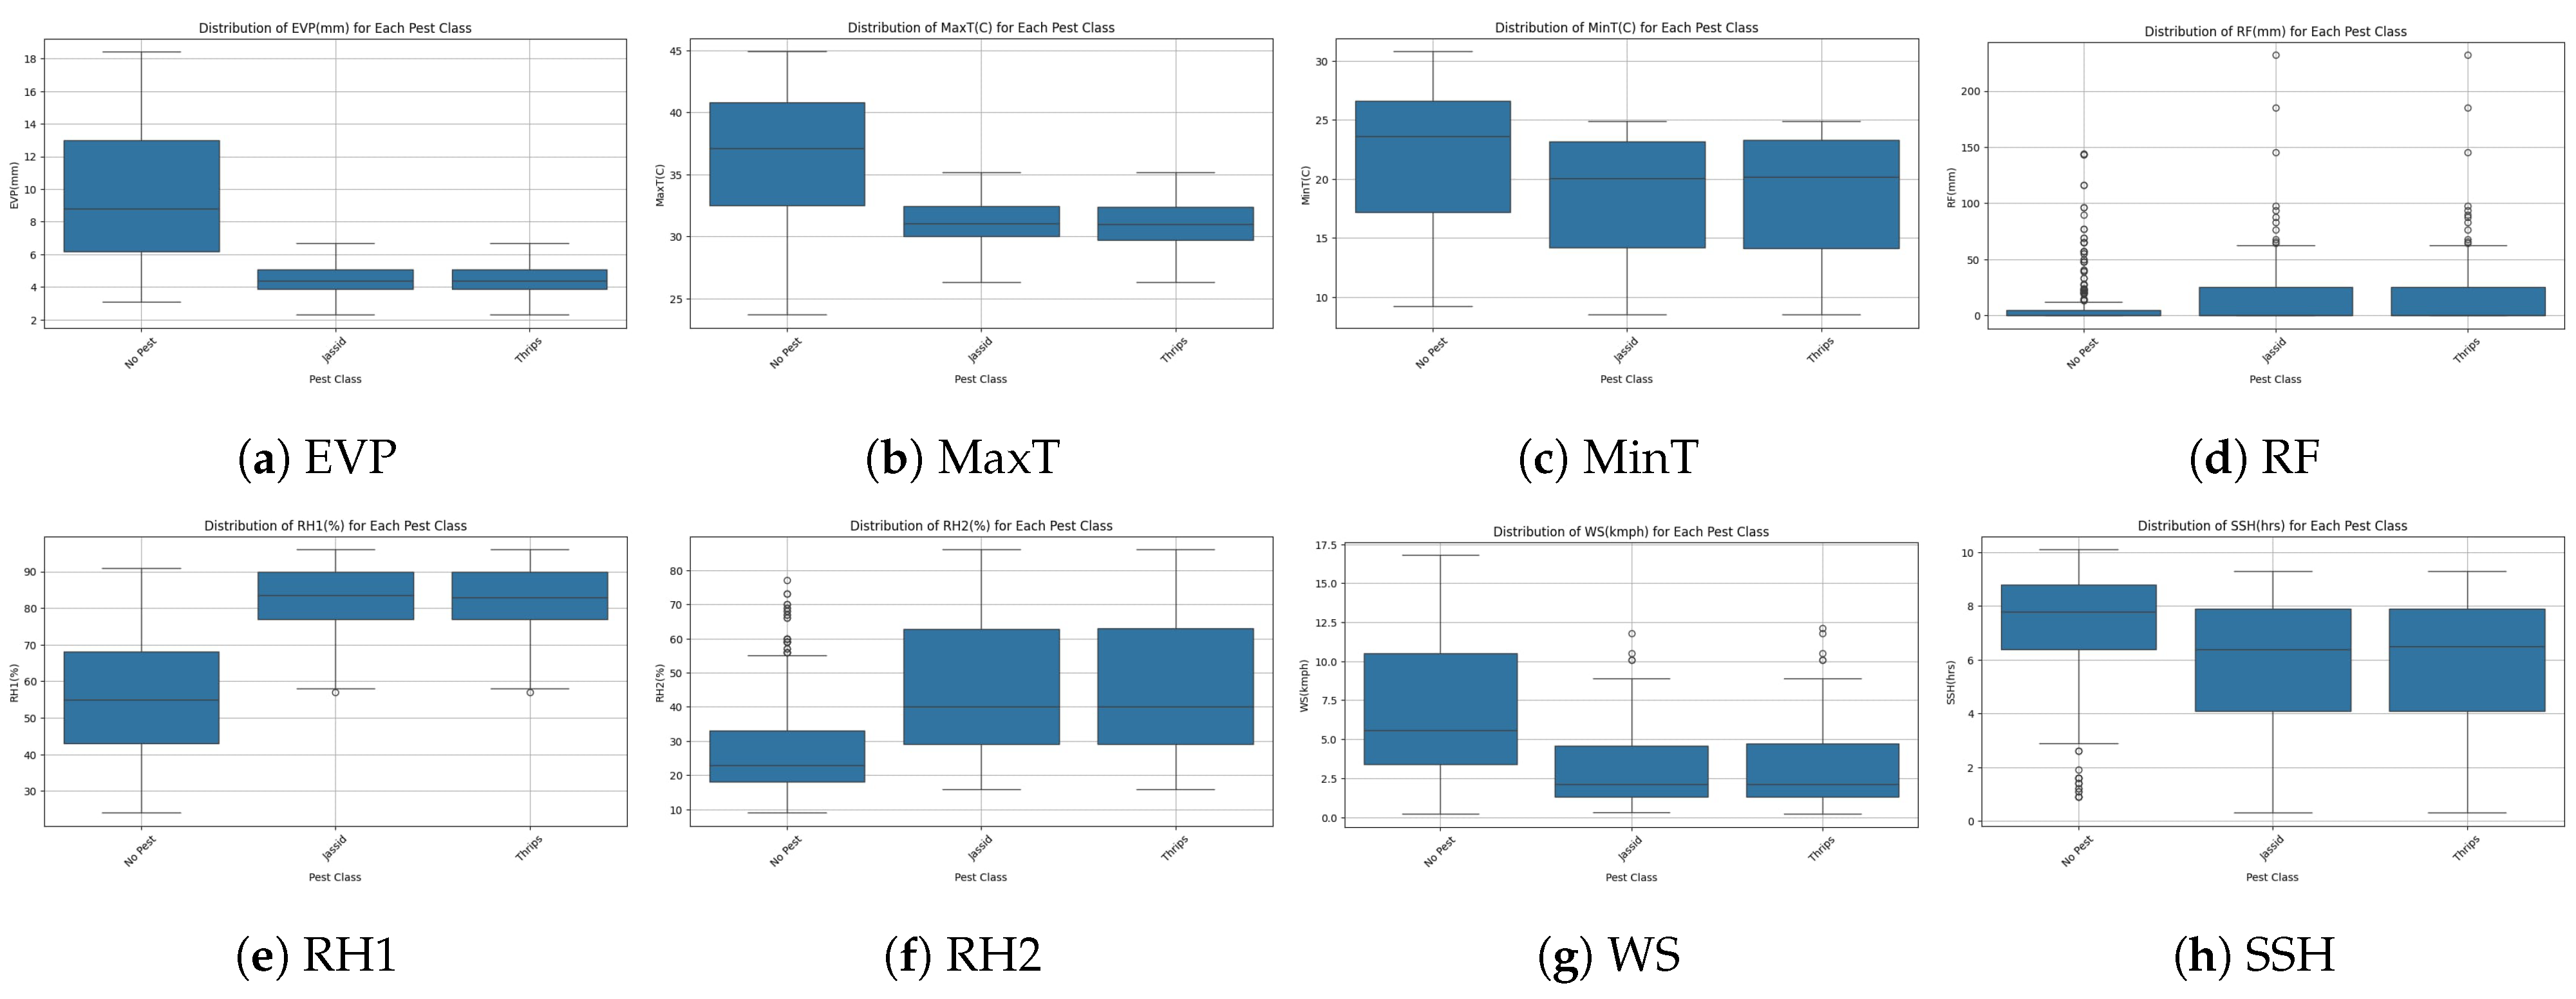
No Pest, was proportionally represented in both the training and testing sets, enhancing the generalizability and reliability of the resulting models. To further analyze the distribution of these features across different pest classes,
Figure 1 presents box plots for each pest category, illustrating the variations in environmental parameters excluding time-based features. These plots provide insights into the differences in feature distributions among the three classes, highlighting potential patterns and trends that contribute to pest classification.
4. Methodology
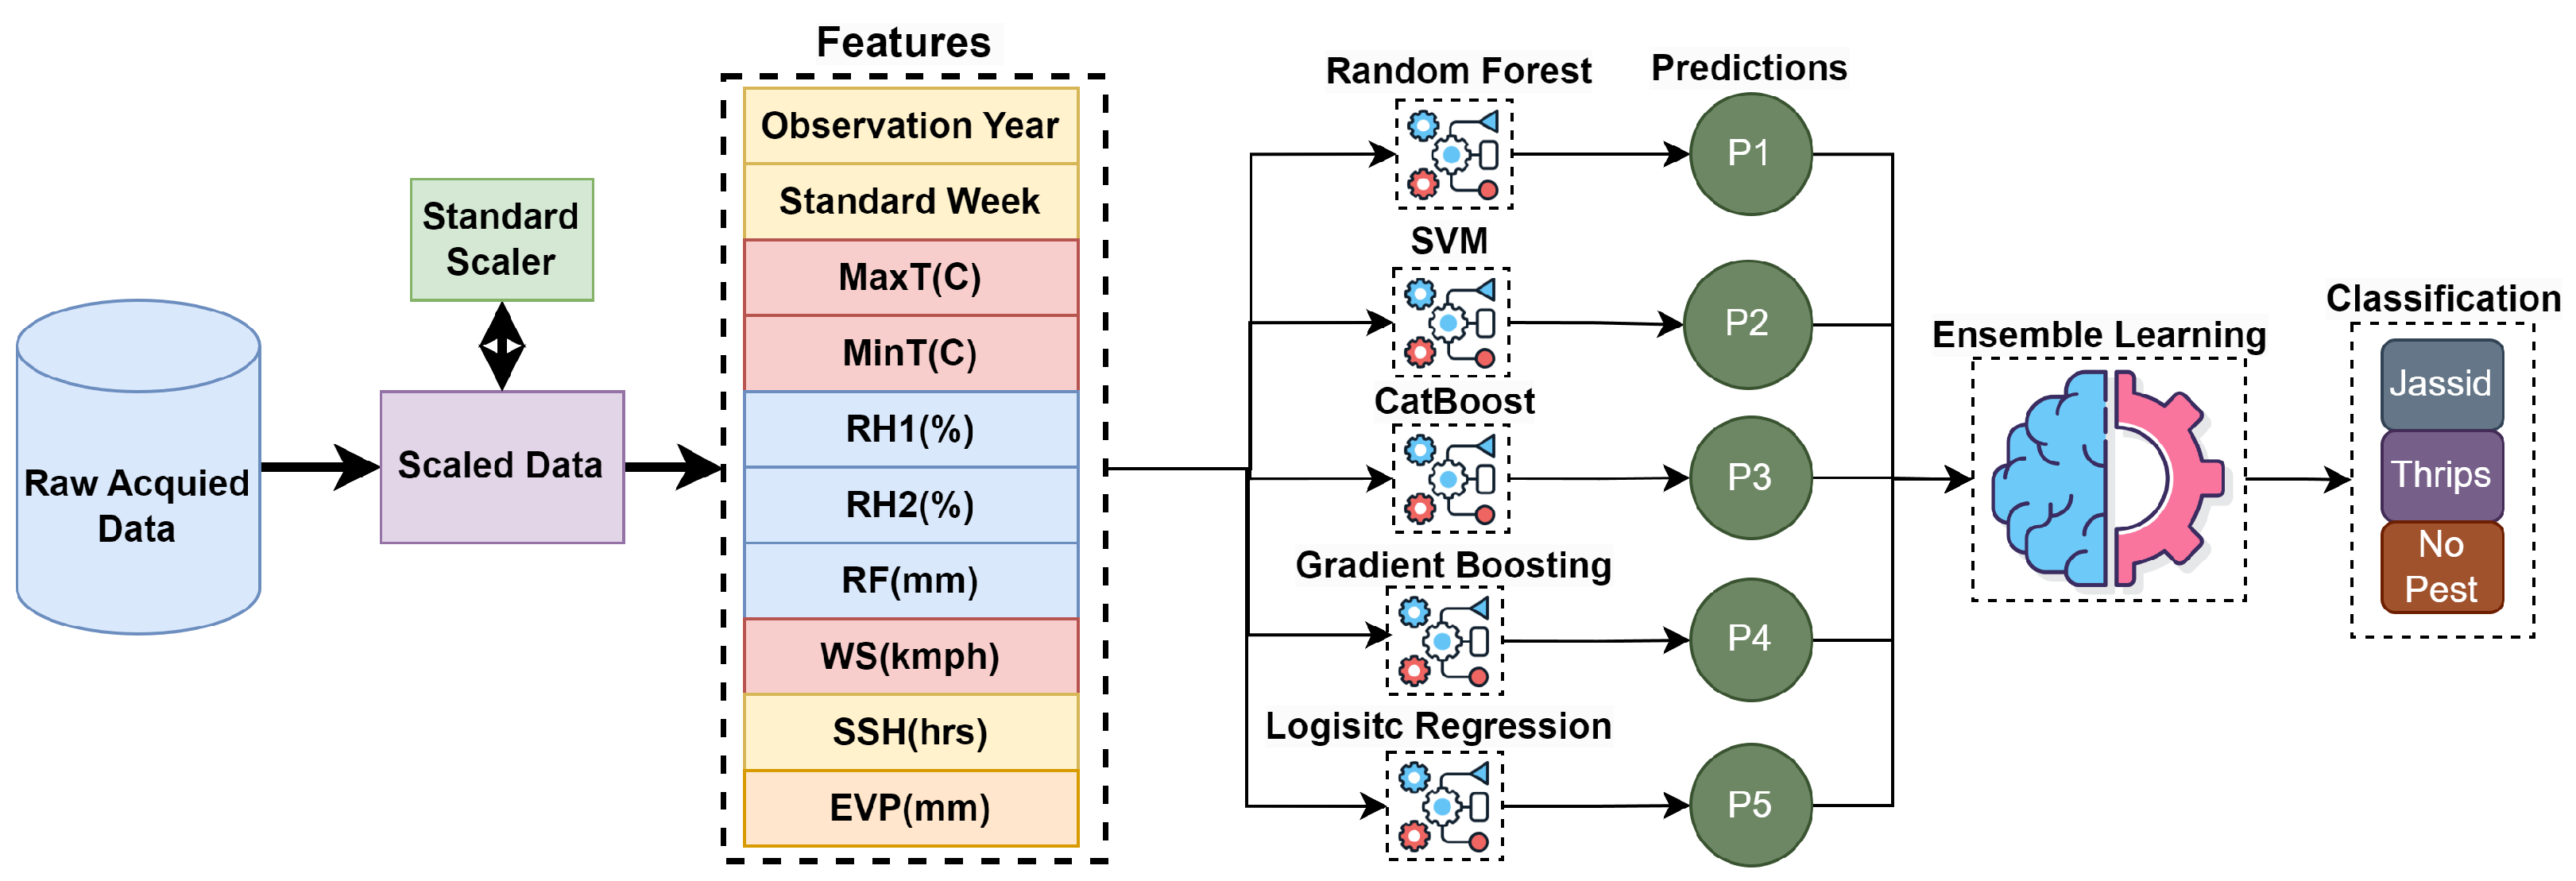
This study proposes a weather-driven predictive modeling approach for forecasting Jassid and Thrips infestations in cotton crops. The methodology consists of data preprocessing, feature engineering, model training, evaluation, and ensemble learning strategies, as illustrated in
Figure 2.
4.1. Pre-Processing
Data preprocessing is a critical step to ensure the dataset is clean, well-structured, and suitable for machine learning algorithms. The following preprocessing steps were performed:
4.1.1. Handling Missing Values
Missing values were handled using mean imputation for numerical features:
where
represents the missing value for feature
j and
N is the total number of available (non-missing) samples.
4.1.2. Feature Scaling
Since different weather features have varying scales, StandardScaler was applied to standardize feature distributions:
where
is the mean and
is the standard deviation of each feature.
4.2. Classifiers Used in the Study
To classify pest infestations, multiple machine learning classifiers were employed, each leveraging different algorithmic strengths to enhance prediction accuracy. The selection of these classifiers was guided by their suitability for handling diverse types of environmental data and their ability to provide interpretable results, which is crucial for the transparency of pest management systems.
4.2.1. Random Forest (RF)
Random Forest is an ensemble learning method that builds multiple decision trees and aggregates their results. It enhances generalization and reduces overfitting. The classification output is determined by majority voting:
where
represents the predicted probability from tree
i for input
x. Random Forest is effective at handling large datasets with complex feature interactions and works well with both continuous and categorical data. However, its reliance on multiple decision trees can lead to high computational costs, especially with large datasets. Additionally, Random Forest models are prone to overfitting if not tuned carefully, especially in the case of noisy data.
4.2.2. Support Vector Machine (SVM)
SVM is a kernel-based classification model that finds the optimal hyperplane separating different classes. The decision function is given by:
where
w is the weight vector,
x is the input feature vector, and
b is the bias term. SVM with a radial basis function (RBF) kernel is often used to handle non-linear classification tasks. While SVMs perform well on smaller datasets, they require high-quality data for optimal performance. Furthermore, SVMs are sensitive to the choice of hyperparameters, such as the kernel and regularization terms, and can be computationally expensive when dealing with large-scale datasets.
4.2.3. Logistic Regression (LR)
Logistic regression models the probability of a class using the sigmoid function:
where
w is the weight vector,
b is the bias term, and
X is the input feature vector. LR is particularly effective when the relationship between features and classes is linear. However, it struggles with non-linear dependencies, which can limit its performance in more complex datasets. Additionally, it is prone to underfitting if the data is not linearly separable, and may also suffer from bias if the data is imbalanced.
4.2.4. CatBoost (CB)
CatBoost is a gradient boosting algorithm optimized for categorical data. The boosting process updates weak learners sequentially to minimize classification errors:
where
is the updated model after the
m-th iteration,
is the weak learner (decision tree), and
is the learning rate. CatBoost is known for its performance on datasets with a large number of categorical variables and its ability to handle overfitting. However, like other gradient boosting methods, CatBoost can be computationally expensive, and its performance heavily relies on the quality of the input data. It is also sensitive to parameter tuning, which can affect model robustness.
4.2.5. Gradient Boosting (GB)
Gradient Boosting improves classification accuracy by sequentially training models to correct the errors of previous iterations. The loss function is minimized iteratively:
where
L is the loss function, and
is the step size. Gradient Boosting improves predictive accuracy by focusing on the hardest-to-predict instances in each iteration, which makes it well-suited for complex, non-linear datasets like pest prediction. However, similar to CatBoost, it can be prone to overfitting without proper regularization and hyperparameter tuning. Moreover, it is computationally intensive, particularly when applied to large-scale problems.
4.3. Effectiveness and Constraints of ML Algorithms
The effectiveness of each of these models depends heavily on the quality of the input data, including the accuracy and completeness of the environmental variables used for predictions. For instance, Random Forest and CatBoost generally perform well with large, heterogeneous datasets, while models like Logistic Regression and SVM can struggle if the relationships between features are non-linear. A major limitation of many of these models is their requirement for high-quality, labeled data. The risk of overfitting is especially pronounced in complex models like CatBoost and Gradient Boosting, where regularization techniques such as early stopping or pruning are necessary to prevent the model from becoming too finely tuned to the training data.
4.4. Ensemble Learning
To enhance predictive performance, two ensemble learning strategies were implemented:
Voting Classifier: A soft-voting approach combining the predictions of multiple classifiers.
Stacking Classifier: A meta-learner-based approach where base classifiers feed into a final logistic regression classifier.
The final prediction in soft voting is computed as:
where
represents the predicted probability from classifier
i.
The Stacking Classifier makes use of base model outputs as input features:
where
f represents the final logistic regression model.
5. Results and Analysis
5.1. Evaluation Metrics
To assess the performance of different classifiers in pest prediction, this study utilized key evaluation metrics, including Accuracy, Precision, Recall, F1 Score, and Area Under the Curve (AUC). These metrics provide a comprehensive evaluation, addressing concerns like class imbalance and predictive reliability.
5.1.1. Accuracy
Accuracy measures the proportion of correctly classified instances and is defined as:
where
(True Positives) and
(True Negatives) represent correctly classified pest and non-pest cases, while
(False Positives) and
(False Negatives) indicate misclassifications. Despite being a fundamental measure, accuracy can be misleading in imbalanced datasets, as it does not distinguish between false positives and false negatives.
5.1.2. Precision
Precision evaluates the proportion of correctly predicted pest occurrences among all predicted pest cases:
A high precision value indicates fewer false alarms, which is crucial in pest management to avoid unnecessary interventions.
5.1.3. Recall
Recall (also called Sensitivity) quantifies the model’s ability to correctly identify actual pest occurrences:
In pest detection, high recall is essential to ensure that potential outbreaks are not missed, as false negatives could lead to severe agricultural damage.
5.1.4. F1 Score
The F1 Score is the harmonic mean of Precision and Recall, balancing both metrics:
This metric is particularly useful in handling imbalanced datasets, where an optimal trade-off between precision and recall is required.
5.1.5. Area Under the Curve (AUC)
AUC provides an aggregated measure of classifier performance across all classification thresholds, representing the probability that a randomly chosen positive instance is ranked higher than a randomly chosen negative instance. A higher AUC indicates better discriminative power.
Among the classifiers evaluated, the stacking-based ensemble model achieved the highest overall performance, as shown in
Table 2. The comparison highlights the superiority of ensemble methods, particularly in leveraging multiple models to enhance decision-making. The findings reinforce that selecting robust classifiers is crucial in pest prediction, ensuring reliable forecasting for timely interventions.
To evaluate the efficacy of different machine learning classifiers in predicting pest incidence, this study analyzed their performance using confusion matrices. The confusion matrices for these models, illustrated in
Figure 3, provide insight into their classification capabilities across three classes which are Jassid, No Pest, and Thrips.
The classifiers demonstrate varying degrees of accuracy in distinguishing between the three classes. All models achieve high accuracy in identifying the “No Pest” class, with minimal misclassification. However, disparities emerge when classifying Jassid and Thrips, as detailed below:
Gradient Boosting and SVM exhibit superior classification performance, particularly in differentiating between Jassid and Thrips. These models maintain a balanced distribution of predictions with fewer misclassifications.
CatBoost and Random Forest tend to misclassify Thrips as Jassid more frequently. This suggests that these models struggle with distinguishing between these two pest types.
Logistic Regression demonstrates competitive performance, though it lacks the robustness of ensemble-based techniques such as Gradient Boosting and SVM.
Misclassification trends indicate that the models may benefit from alternative training strategies to enhance their discriminatory power. The results suggest that ensemble methods, particularly stacking, can further refine classification accuracy. Ensemble learning leverages the strengths of multiple classifiers by combining their predictions, thereby mitigating individual model weaknesses. This approach enhances overall model stability and generalization, leading to improved pest classification. In subsequent analyses, this study explores ensemble strategies to optimize model performance and demonstrate how stacking outperforms individual classifiers in this context.
5.2. Comparison with Ensemble Learning
Table 2 presents the comparative performance of various machine learning classifiers, including ensemble techniques such as Voting and Stacking. The Stacking model demonstrates superior classification capabilities with the highest accuracy (90.38%), F1 score (0.90), and precision (0.91), indicating its robustness in handling complex decision boundaries. Stacking leverages multiple base models and learns an optimal combination of their predictions through a meta-learner, allowing it to generalize better compared to individual classifiers. In contrast, traditional models like Support Vector Machine (SVM) and Logistic Regression, which rely on fixed decision boundaries, exhibit lower performance due to their inherent limitations in capturing intricate patterns in high-dimensional feature spaces. Gradient Boosting, a sequential ensemble learning method, achieves similar results to Logistic Regression but benefits from boosting weak learners iteratively to improve prediction accuracy. The Voting ensemble, which aggregates predictions through majority voting, performs notably worse, suggesting that simple aggregation of classifiers may not be sufficient for complex datasets. CatBoost and Random Forest, though widely used for structured data, struggle to achieve competitive performance, highlighting the importance of selecting an appropriate ensemble strategy. The results emphasize that intelligently combining classifiers through Stacking can significantly enhance prediction accuracy by capturing diverse decision patterns from multiple models.
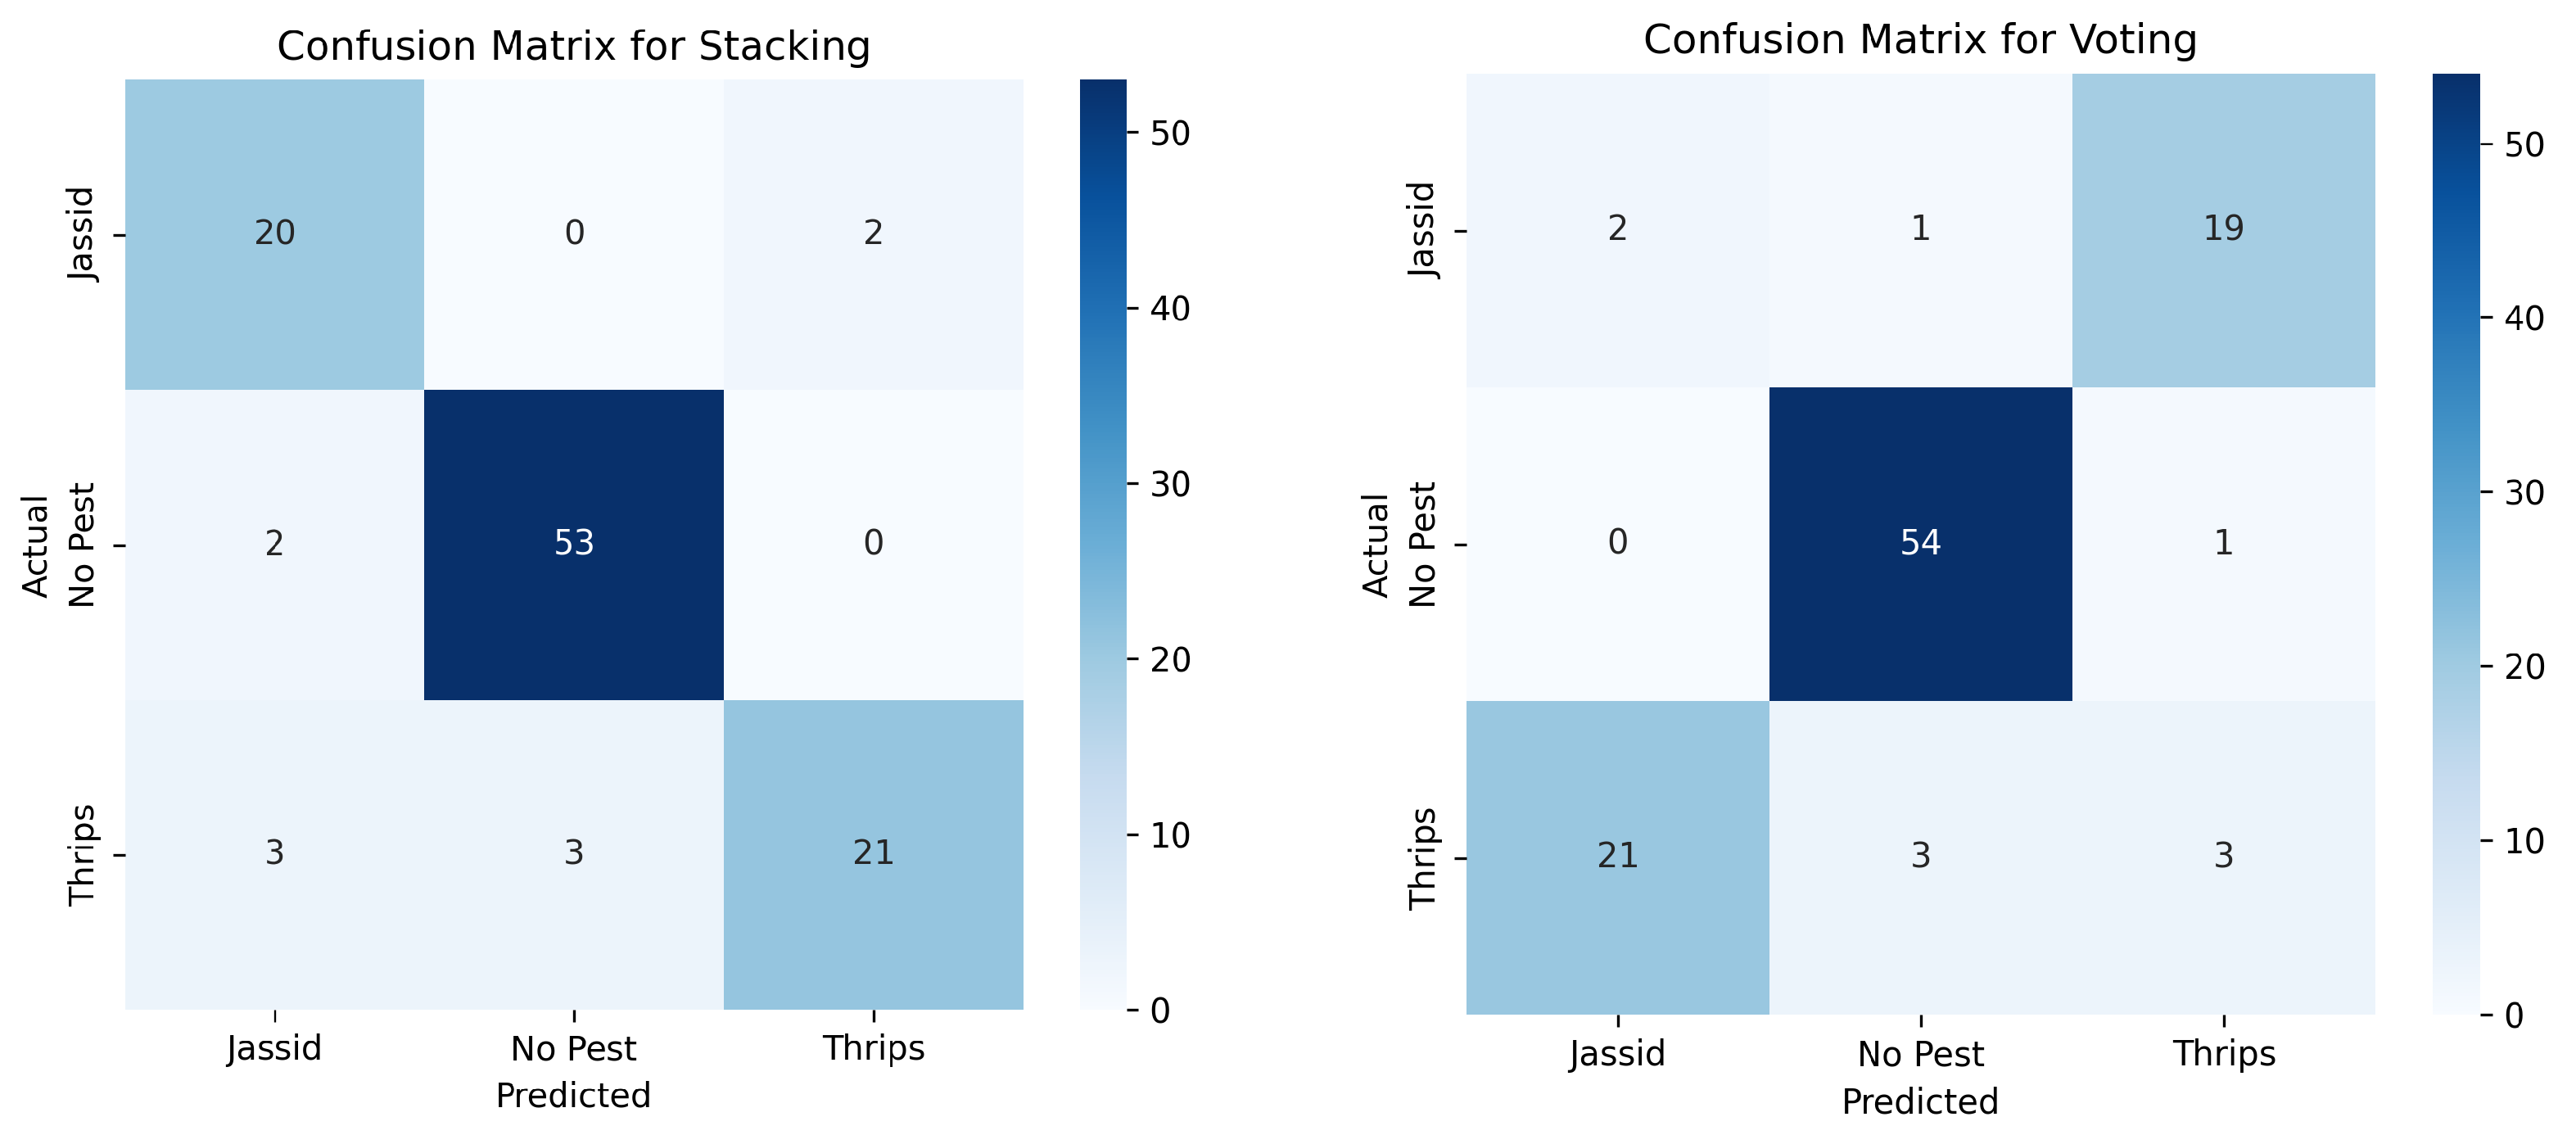
Figure 4 illustrates the confusion matrices for the Stacking and Voting ensemble methods, highlighting their classification performance in distinguishing Jassid, Thrips, and no-pest conditions. The Stacking ensemble demonstrates superior predictive accuracy, correctly identifying 20 instances of Jassid, 21 instances of Thrips, and 53 cases with no pest presence, with minimal misclassifications. In contrast, the Voting ensemble exhibits notable weaknesses in distinguishing Jassid and Thrips, frequently confusing Jassid with Thrips, as indicated by the 19 misclassified Jassid instances. Moreover, the Voting ensemble incorrectly predicts Jassid in 21 cases where Thrips was the actual label, underscoring its limitations in differentiating between the two pest categories. Both models perform well in predicting the absence of pests, with the Stacking model misclassifying only two cases and the Voting model making a single error in this category. These results reinforce the advantage of Stacking, which not only achieves higher overall accuracy but also maintains better balance in correctly identifying different pest types, making it a more reliable choice for pest incidence forecasting.
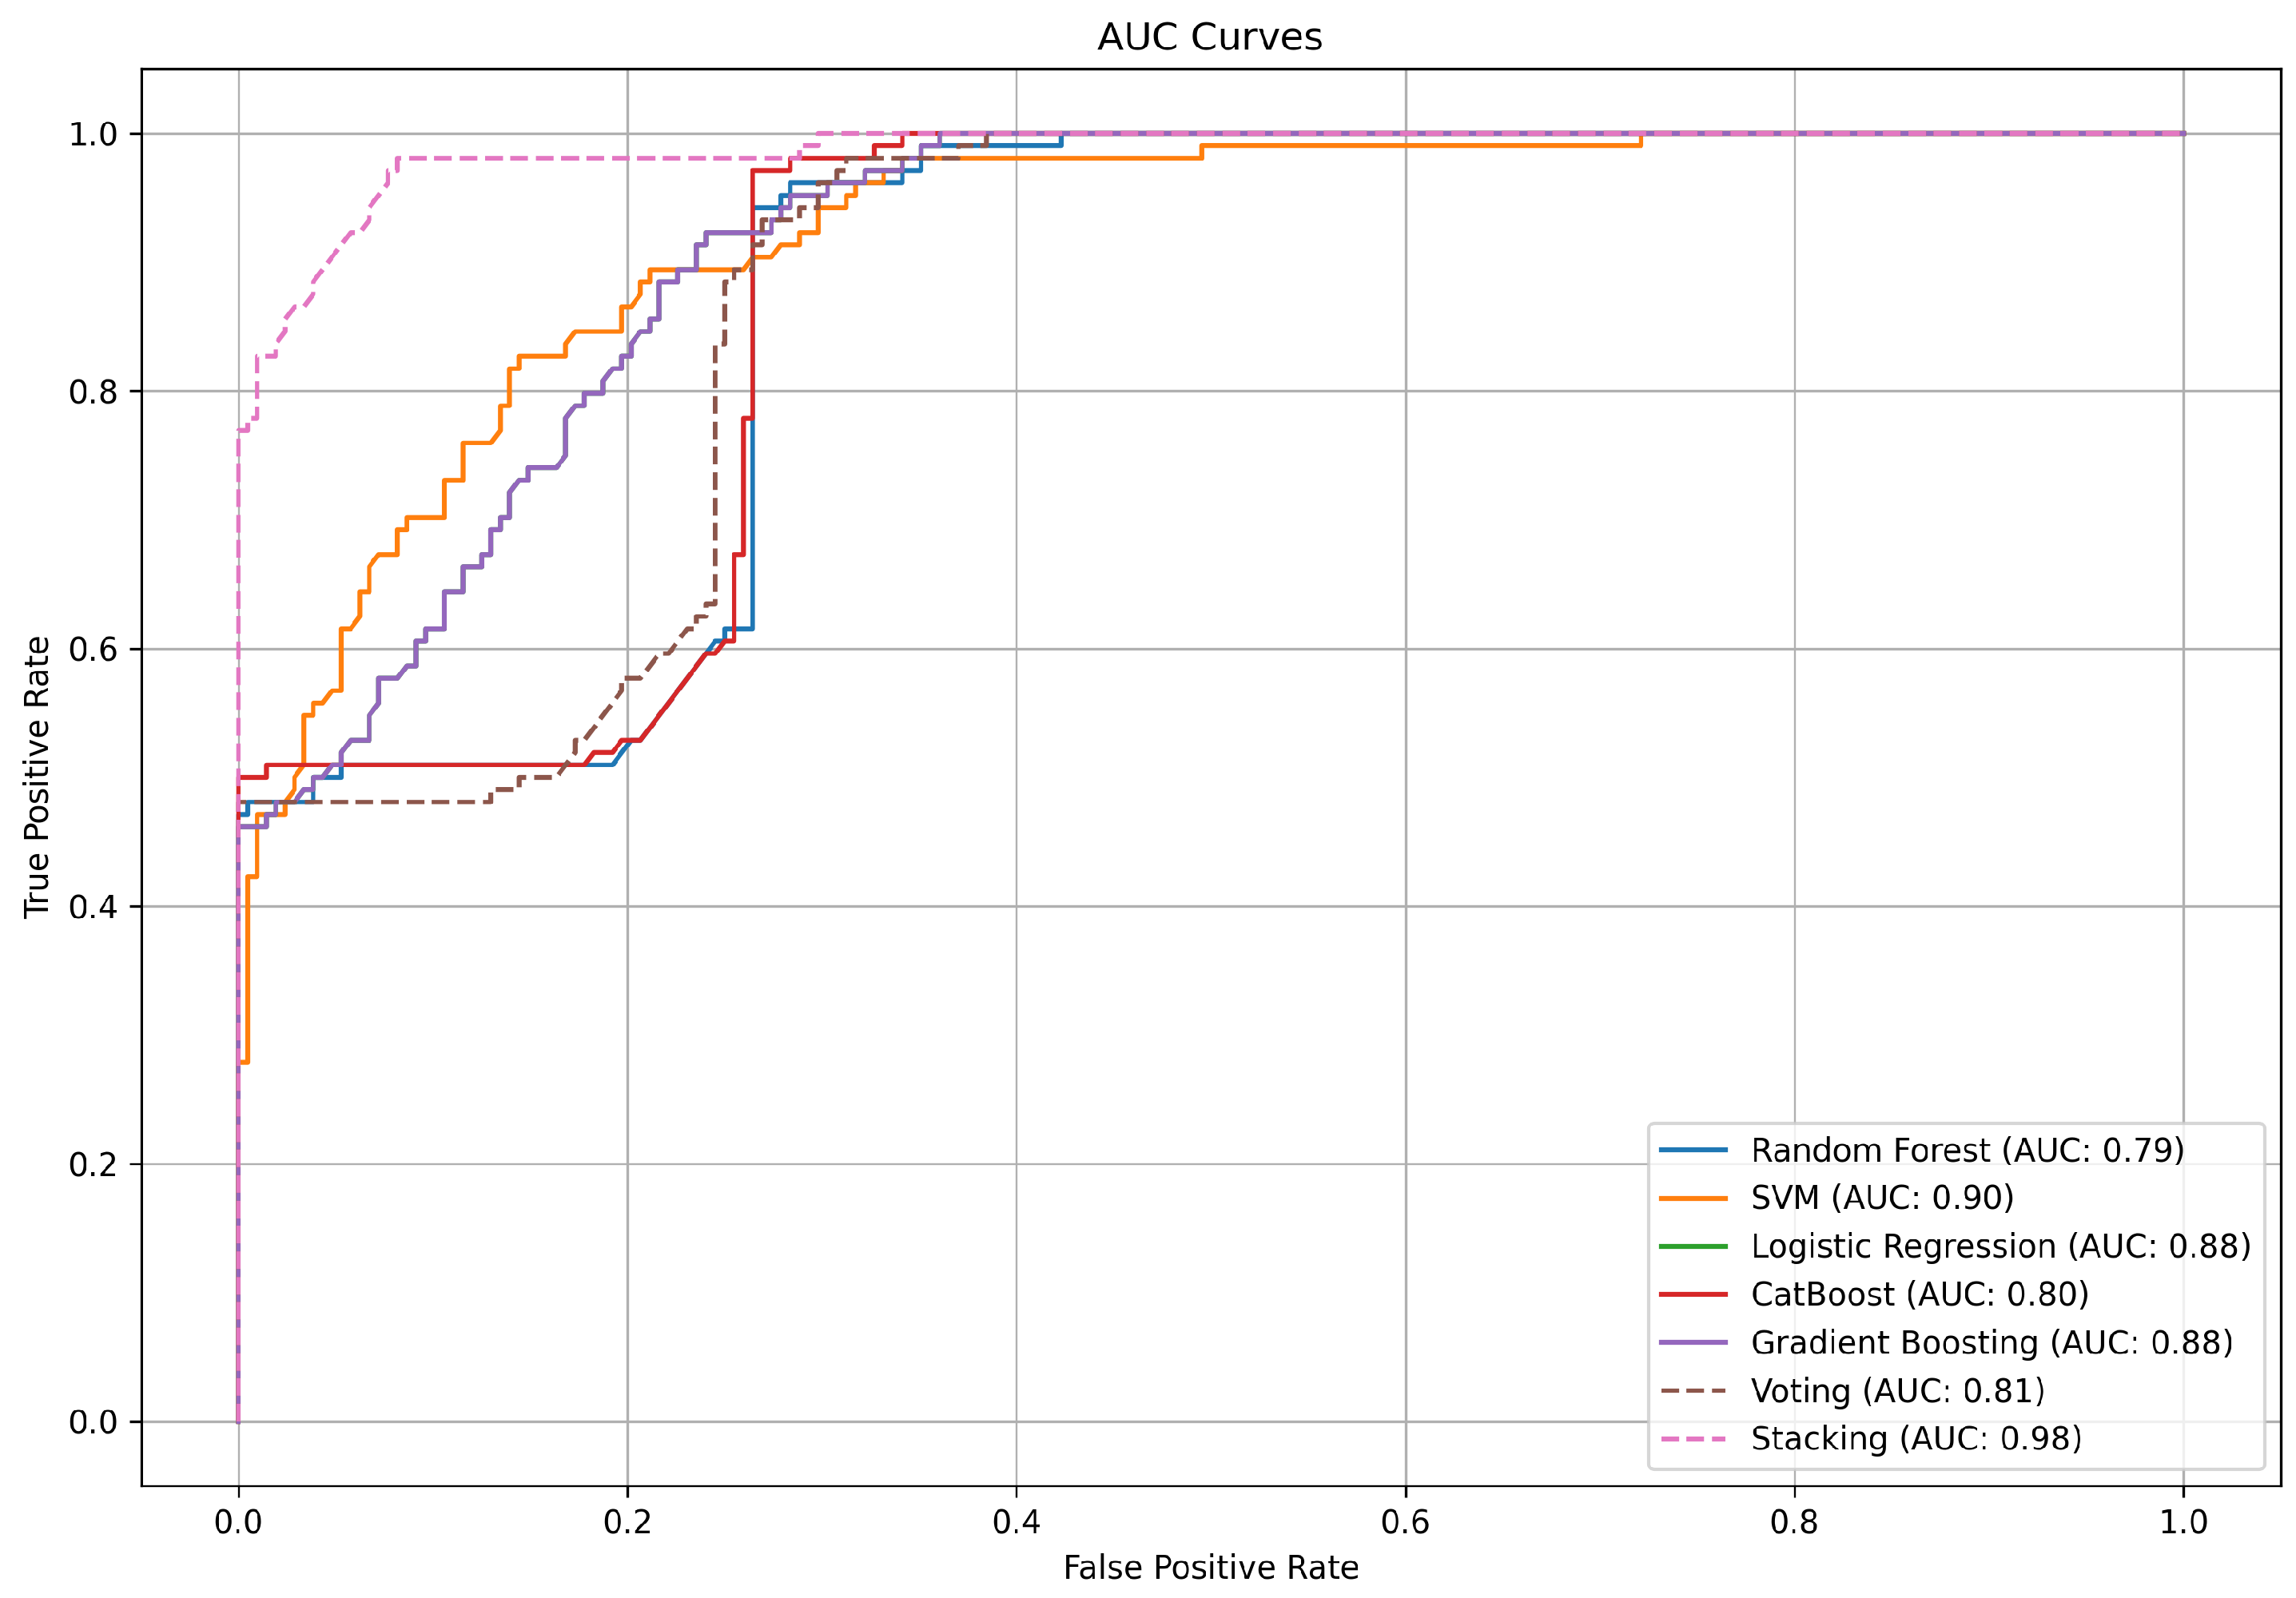
Figure 5 presents the AUC curves comparing the performance of various machine learning classifiers and ensemble learning strategies in predicting pest incidence. The Stacking ensemble method demonstrates the highest discriminative ability, achieving an AUC of 0.98, as evidenced by its near-perfect ROC curve, which closely follows the upper-left boundary of the plot. SVM also performs well with an AUC of 0.90, followed by Logistic Regression and Gradient Boosting, both achieving an AUC of 0.88. In contrast, Random Forest and CatBoost exhibit relatively lower AUC values of 0.79 and 0.80, respectively, indicating moderate classification performance. The Voting ensemble method, though improving upon some individual models, attains an AUC of 0.81, which remains significantly lower than that of Stacking. The sharp incline of the Stacking curve at low false-positive rates highlights its superior ability to minimize misclassification while maximizing true positive predictions. These results visually reinforce the advantage of ensemble learning, particularly Stacking, in enhancing predictive performance for pest incidence forecasting.
5.3. SHAP-Based Explainability
SHAP (SHapley Additive exPlanations) analysis has been effectively utilized in different studies to interpret complex, non-linear relationships within large datasets, enabling more transparent and interpretable models. This approach has been particularly valuable in identifying key features that influence system behavior, providing deeper insights into complex processes [
40,
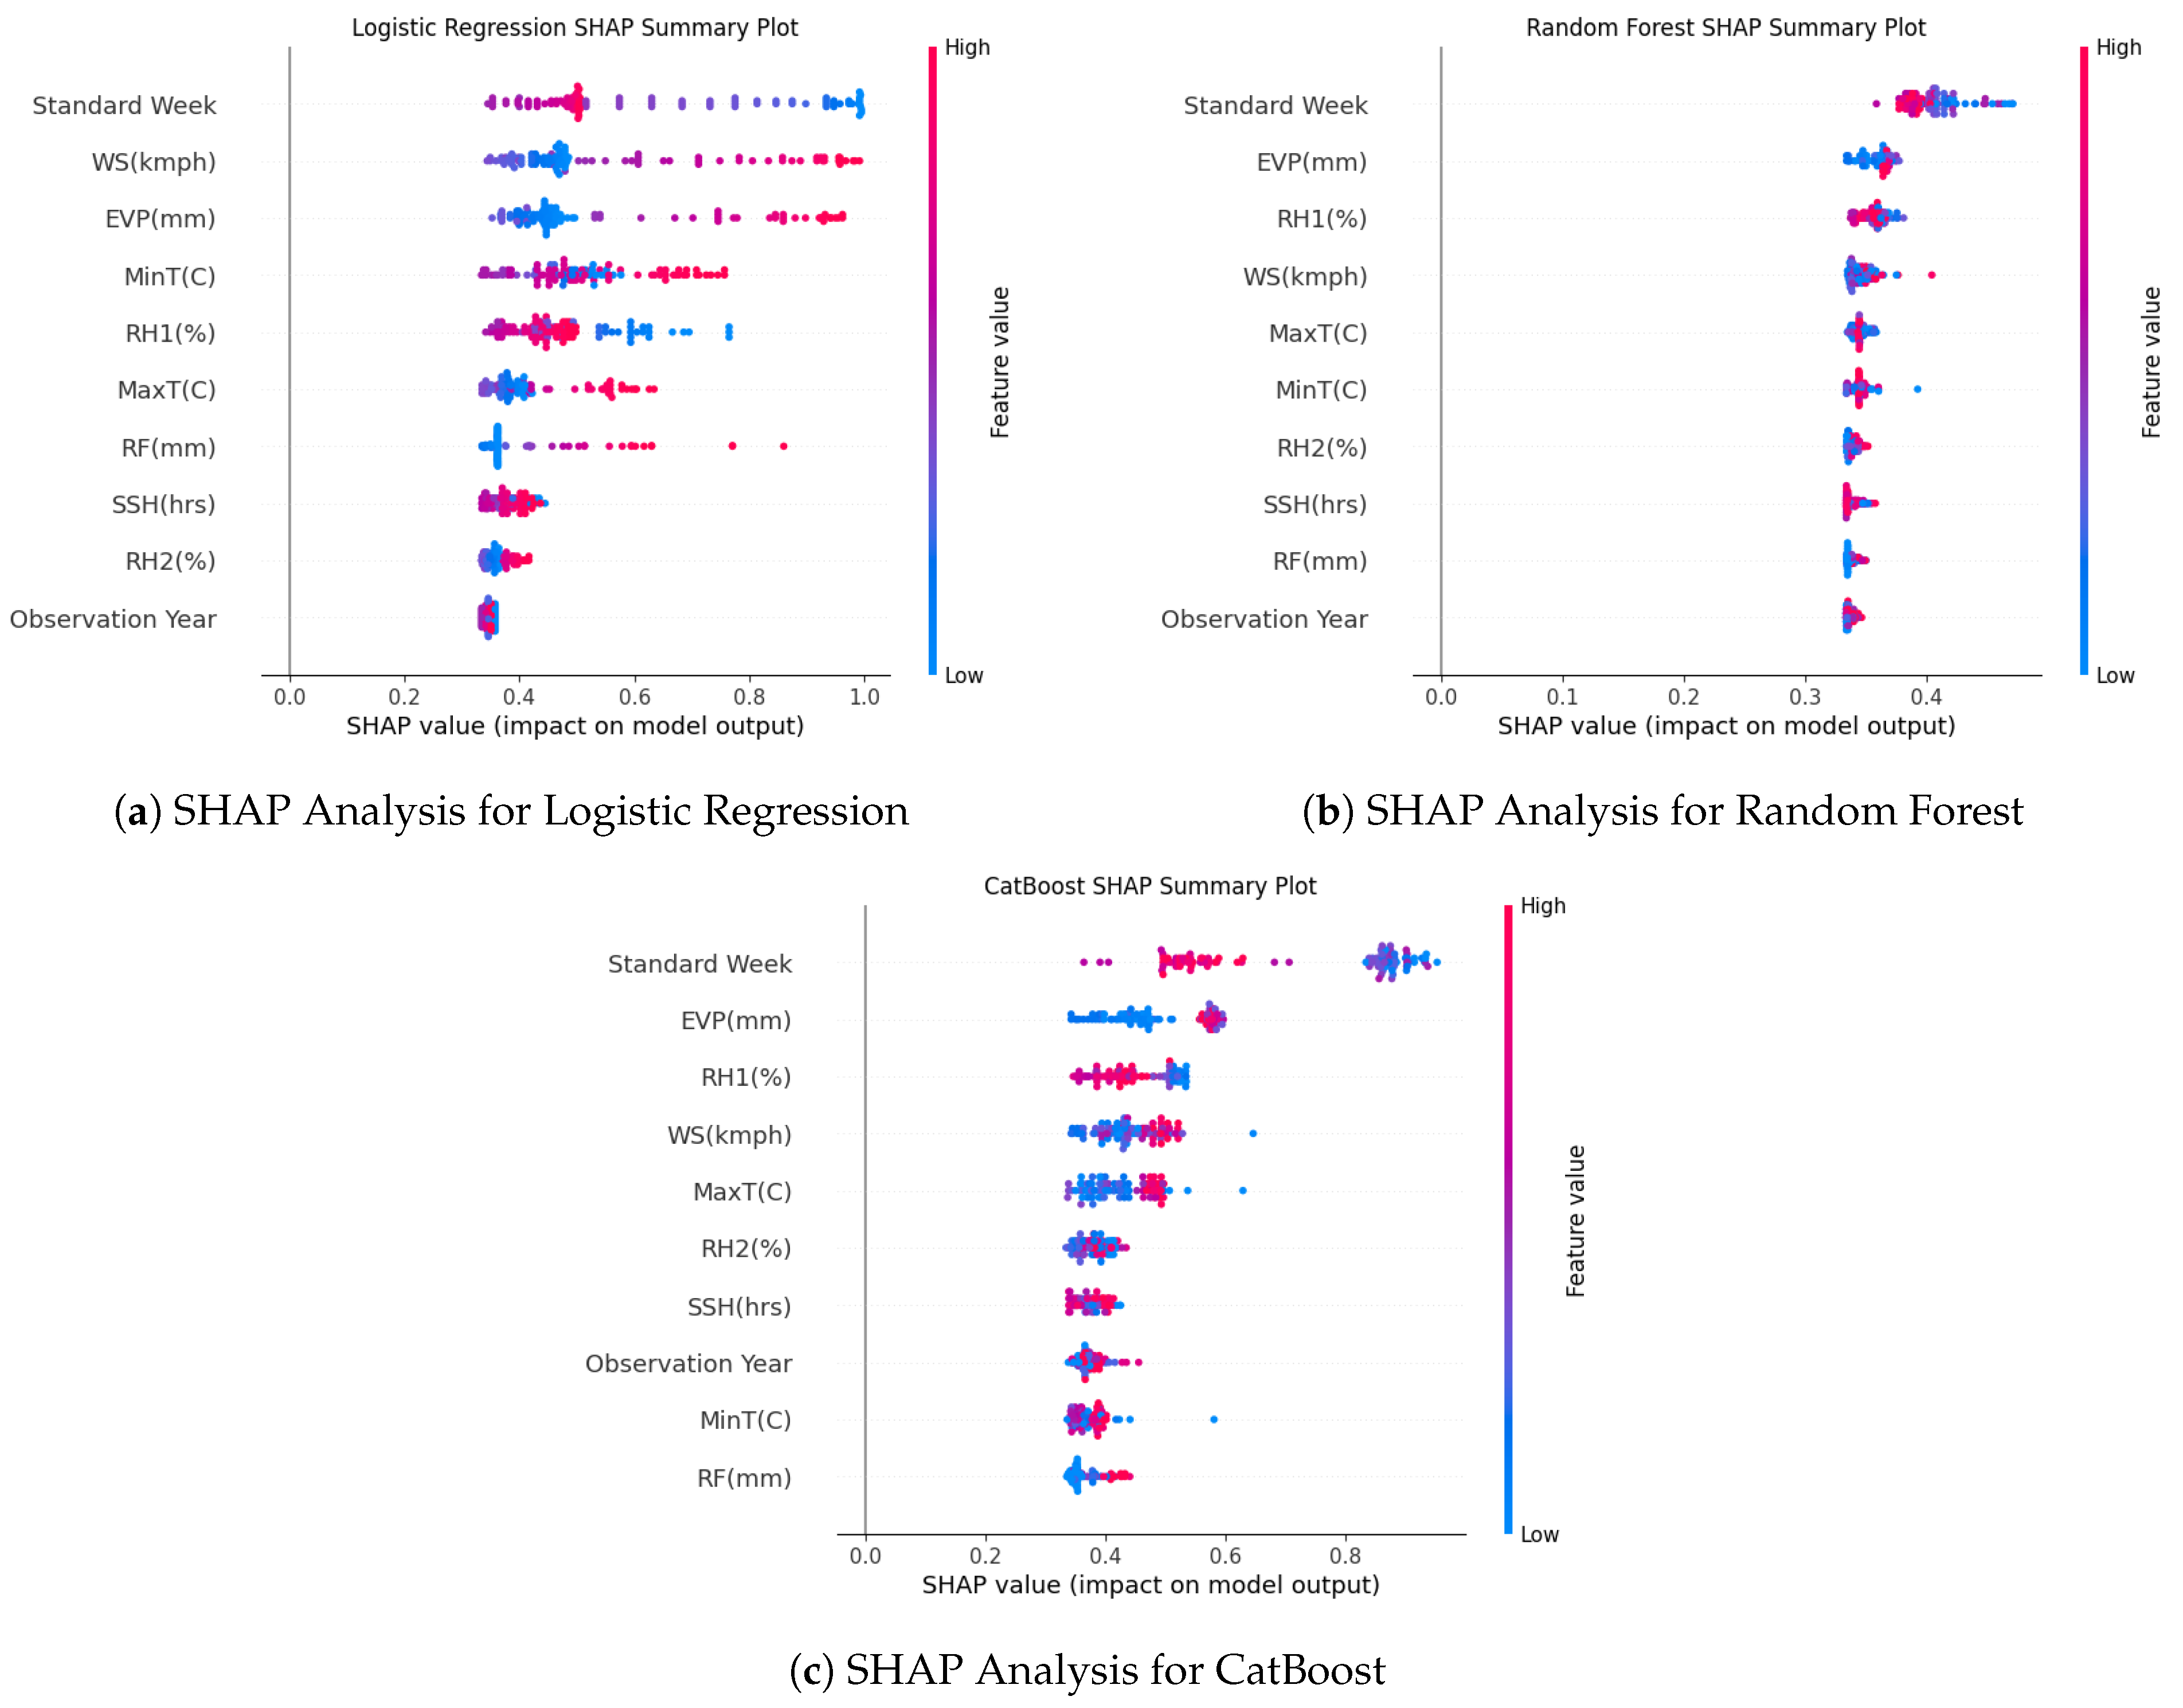
41]. To gain deeper insights into the contribution of individual features to pest predictions, this study used SHAP to generate summary plots for three classifiers: Random Forest, Logistic Regression, and CatBoost, as illustrated in
Figure 6. SHAP is a model-agnostic approach that provides a transparent understanding of how each feature influences a model’s predictions by assigning importance scores to each feature, based on the individual contributions to the overall model output.
Among all three models, SMW emerged as the most influential variable in predicting pest infestations. This finding emphasizes the strong seasonal dependency of pest dynamics. Biological processes, such as pest life cycles and population peaks, are strongly regulated by environmental cues tied to specific times in the growing season. Previous research [
15,
18,
42] corroborates these findings, demonstrating that pest outbreaks, including those of Jassid and Thrips, typically occur during distinct weeks of the growing season, reinforcing the need for timely, targeted interventions during these high-risk periods. These seasonal patterns highlight the importance of understanding the temporal variation of pest behavior and its direct correlation with seasonal climatic changes.
In addition to SMW, several meteorological factors such as evaporation (EVP), morning relative humidity (RH1), wind speed (WS), maximum temperature (MaxT), and minimum temperature (MinT) exhibited strong influence on the model’s predictions. These factors are biologically relevant, as they directly impact pest behavior, survival, and proliferation. For example, evaporation and relative humidity affect the moisture levels in the environment, which are critical for the survival of pests such as Thrips, which thrive in humid conditions [
43]. Similarly, temperature influences pest development rates, with warmer temperatures accelerating pest life cycles [
44]. Notably, CatBoost and Random Forest models displayed distinct clustering ofSMW, evaporation, and relative humidity at higher SHAP values, indicating that increased values of these features consistently heightened the likelihood of pest presence. This suggests that these models are capturing complex, non-linear interactions between environmental variables, which are likely indicative of underlying biological relationships.
In contrast, Logistic Regression, due to its linear nature, exhibited a more dispersed influence across the features, with SMW, wind speed, and evaporation remaining prominent but showing a more uniform distribution in terms of their impact on predictions. This contrast emphasizes the inherent limitations of linear models in capturing non-linear dependencies, which are often present in ecological and biological systems. The ability of ensemble methods (such as CatBoost and Random Forest) and gradient boosting techniques to account for complex interactions between features underscores their effectiveness in predicting pest outbreaks, as they better capture the intricacies of pest-environment interactions. These advanced machine learning techniques, unlike traditional linear models, enable the incorporation of critical environmental factors into pest prediction systems with greater accuracy and precision.
Thus, the SHAP-based analysis reveals the advantages of leveraging advanced machine learning techniques for pest prediction, offering a transparent, interpretable framework that aligns well with biological and ecological theories. By incorporating seasonal patterns and environmental variables that influence pest life cycles, these models contribute significantly to more accurate, timely pest management strategies, particularly for high-risk periods in the growing season. Moreover, this approach promotes the integration of critical environmental factors into decision-making frameworks, supporting the development of more sustainable and data-driven pest management solutions.
6. Limitations and Future Work
This study provides valuable insights into pest prediction, but several limitations must be acknowledged. The dataset used in this research is limited to cotton crops collected over four growing seasons from 2005 to 2009. While this period covers various seasonal and climatic conditions, the data may not fully account for the impacts of climate change or evolving agricultural practices, which could influence pest dynamics over time. Additionally, the dataset is specific to a single geographical region, which limits the generalizability of the findings to other regions with different climatic conditions or agricultural practices.
Looking ahead, future work will aim to address these limitations by expanding the dataset to include additional crops and regions, allowing for broader generalization of the models. Furthermore, the potential impact of climate change will be explored in more depth, with the goal of developing models that can adapt to shifting environmental conditions. Additionally, the application of transfer learning and continuous model updates will help ensure the model’s robustness and applicability in diverse agricultural contexts.
7. Conclusions
This study demonstrates the significant potential of machine learning-based models for predicting pest infestations, specifically Jassid and Thrips, using key meteorological parameters. By leveraging six essential weather features which are maximum and minimum temperature, relative humidity, wind speed, sunshine hours, and evaporation—this research successfully identified the most relevant factors influencing pest dynamics. Through rigorous evaluation of multiple classifiers, this study found that the Stacking ensemble model outperformed individual models, achieving an accuracy of 90.38%. This highlights the robustness and reliability of the proposed framework in pest prediction. Importantly, the incorporation of SHAP (SHapley Additive exPlanations) values enhances the transparency of the model, providing valuable insights into the importance of various weather parameters. The results indicate that relative humidity, temperature, and evaporation significantly affect the presence and behavior of pests, aligning with existing biological research on pest ecology. These findings underscore the critical role of explainability in fostering trust and facilitating the adoption of AI-driven pest management solutions among stakeholders such as farmers, agronomists, and policymakers.
While this study provides a strong foundation for data-driven pest management, it also highlights the limitations inherent in using a dataset from only one crop (cotton) and a single geographic region. Future research could expand this framework to other pest species and crops, and apply the model across different regions with varying climatic conditions. Moreover, integrating real-time weather data, satellite imagery, and adaptive learning techniques could further enhance the model’s predictive accuracy, enabling it to better cope with the uncertainties associated with climate change and dynamic agricultural practices. Ultimately, the proposed AI framework represents a valuable building block towards a more sustainable, precision-based pest management approach, offering promising support for integrated pest management (IPM) strategies.
Author Contributions
Conceptualization, R.S.; Methodology, R.S. and S.H.K.; Software, J.R.; Validation, S.H.K. and J.R.; Formal analysis, R.S., S.H.K. and J.R.; Writing—original draft, R.S. and S.H.K.; Writing—review & editing, J.R. and S.W.L.; Supervision, S.W.L.; Project administration, S.W.L.; Funding acquisition, S.W.L. All authors have read and agreed to the published version of the manuscript.
Funding
This research was supported by the SungKyunKwan University and the BK21 FOUR (Graduate School Innovation) funded by the Ministry of Education (MOE, Korea) and National Research Foundation of Korea (NRF). This work was also supported by National Research Foundation (NRF) grants funded by the Ministry of Science and ICT (MSIT) and Ministry of Education (MOE), Republic of Korea (NRF[2021-R1-I1A2(059735)]; RS[2024-0040(5650)]; RS[2024-0044(0881)]; RS[2019- II19(0421)]).
Institutional Review Board Statement
Not applicable.
Informed Consent Statement
Not applicable.
Data Availability Statement
Data are contained within the article.
Conflicts of Interest
The authors declare no conflicts of interest.
References
- Gupta, S.K.; Yadav, A.K.; Maheshwari, S.; Maurya, P.K.; Kumar, P. Population dynamics of major insect pests of okra in relation to weather parameters. Plant Arch. 2024, 24, 304–308. [Google Scholar]
- Syed, T.; Abro, G.; Khuhro, R.; Dhauroo, M. Relative resistance of cotton varieties against sucking pests. Pak. J. Biol. Sci 2003, 6, 1232–1233. [Google Scholar] [CrossRef]
- Zhou, Y.; Zhou, H.; Chen, Y. An automated phenotyping method for Chinese Cymbidium seedlings based on 3D point cloud. Plant Methods 2024, 20, 151. [Google Scholar] [CrossRef] [PubMed]
- Subedi, B.; Poudel, A.; Aryal, S. The impact of climate change on insect pest biology and ecology: Implications for pest management strategies, crop production, and food security. J. Agric. Food Res. 2023, 14, 100733. [Google Scholar]
- Kaushal, M.; Atieno, M.; Odjo, S.; Baijukya, F.; Gebrehawaryat, Y.; Fadda, C. Nature-Positive Agriculture—A Way Forward Towards Resilient Agrifood Systems. Sustainability 2025, 17, 1151. [Google Scholar] [CrossRef]
- Han, H.; Sha, R.; Dai, J.; Wang, Z.; Mao, J.; Cai, M. Garlic origin traceability and identification based on fusion of multi-source heterogeneous spectral information. Foods 2024, 13, 1016. [Google Scholar] [CrossRef]
- Bale, J.S.; Masters, G.J.; Hodkinson, I.D.; Awmack, C.; Bezemer, T.M.; Brown, V.K.; Butterfield, J.; Buse, A.; Coulson, J.C.; Farrar, J.; et al. Herbivory in global climate change research: Direct effects of rising temperature on insect herbivores. Glob. Chang. Biol. 2002, 8, 1–16. [Google Scholar]
- Kirui, E.C.; Kidoido, M.M.; Akutse, K.S.; Wanyama, R.; Boni, S.B.; Dubois, T.; Dinssa, F.F.; Mutyambai, D.M. Factors Influencing the Adoption of Agroecological Vegetable Cropping Systems by Smallholder Farmers in Tanzania. Sustainability 2025, 17, 1148. [Google Scholar] [CrossRef]
- He, L.; Shan, Y.q.; Liu, C.; Cao, H.; Liu, X.n.; Guo, Y. Prediction of bedload transport inside vegetation canopies with natural morphology. J. Hydrodyn. 2024, 36, 556–569. [Google Scholar]
- Wolfert, S.; Ge, L.; Verdouw, C.; Bogaardt, M.J. Big data in smart farming—A review. Agric. Syst. 2017, 153, 69–80. [Google Scholar]
- Zhuo, T.; He, L.; Chai, B.; Zhou, S.; Wan, Q.; Lei, X.; Zhou, Z.; Chen, B. Micro-pressure promotes endogenous phosphorus release in a deep reservoir by favouring microbial phosphate mineralisation and solubilisation coupled with sulphate reduction. Water Res. 2023, 245, 120647. [Google Scholar] [PubMed]
- Yu, K.; Chai, B.; Zhuo, T.; Tang, Q.; Gao, X.; Wang, J.; He, L.; Lei, X.; Chen, B. Hydrostatic pressure drives microbe-mediated biodegradation of microplastics in surface sediments of deep reservoirs: Novel findings from hydrostatic pressure simulation experiments. Water Res. 2023, 242, 120185. [Google Scholar] [PubMed]
- Lu, S.; Xiao, X. Neuromorphic computing for smart agriculture. Agriculture 2024, 14, 1977. [Google Scholar] [CrossRef]
- Sharma, A.; Tripathi, P. Artificial Intelligence in Agriculture: A Literature Survey. Int. J. All Res. Educ. Sci. Methods 2021, 9, 510–513. [Google Scholar]
- Zhang, D.; Wang, Y.; Gu, Q.; Liu, L.; Wang, Z.; Zhang, J.; Meng, C.; Yang, J.; Zhang, Z.; Ma, Z.; et al. Cotton RLP6 Interacts with NDR1/HIN6 to Enhance Verticillium Wilt Resistance via Altering ROS and SA. Mol. Plant Pathol. 2025, 26, e70052. [Google Scholar]
- Ma, X.; Liu, Y. A Modified Geometrical Optical Model of Row Crops Considering Multiple Scattering Frame. Remote Sens. 2020, 12, 3600. [Google Scholar]
- Yang, X.; Xia, X.; Zhang, Z.; Nong, B.; Zeng, Y.; Wu, Y.; Xiong, F.; Zhang, Y.; Liang, H.; Pan, Y.; et al. Identification of anthocyanin biosynthesis genes in rice pericarp using PCAMP. Plant Biotechnol. J. 2019, 17, 1700. [Google Scholar]
- Chen, S.; Yang, Z.; Sun, W.; Tian, K.; Sun, P.; Wu, J. TMV-CP based rational design and discovery of α-Amide phosphate derivatives as anti plant viral agents. Bioorg. Chem. 2024, 147, 107415. [Google Scholar]
- Huang, X.; Tang, X.; Liao, A.; Sun, W.; Lei, L.; Wu, J. Application of cyclopropane with triangular stable structure in pesticides. J. Mol. Struct. 2024, 1326, 141171. [Google Scholar]
- Demirel, M.; Kumral, N.A. Artificial intelligence in integrated pest management. In Artificial Intelligence and IoT-Based Technologies for Sustainable Farming and Smart Agriculture; IGI Global: Hershey, PA, USA, 2021; pp. 289–313. [Google Scholar]
- Rehman, M.U.; Eesaar, H.; Abbas, Z.; Seneviratne, L.; Hussain, I.; Chong, K.T. Advanced drone-based weed detection using feature-enriched deep learning approach. Knowl.-Based Syst. 2024, 305, 112655. [Google Scholar] [CrossRef]
- Jiang, C.; Wang, Y.; Yang, Z.; Zhao, Y. Do adaptive policy adjustments deliver ecosystem-agriculture-economy co-benefits in land degradation neutrality efforts? Evidence from southeast coast of China. Environ. Monit. Assess. 2023, 195, 1215. [Google Scholar] [PubMed]
- Liakos, K.G.; Busato, P.; Moshou, D.; Pearson, S.; Bochtis, D. Machine learning in agriculture: A review. Sensors 2018, 18, 2674. [Google Scholar] [CrossRef]
- Luo, J.; Zhao, C.; Chen, Q.; Li, G. Using deep belief network to construct the agricultural information system based on Internet of Things. J. Supercomput. 2022, 78, 379–405. [Google Scholar]
- Linardatos, P.; Papastefanopoulos, V.; Kotsiantis, S. Explainable ai: A review of machine learning interpretability methods. Entropy 2020, 23, 18. [Google Scholar] [CrossRef] [PubMed]
- Wang, M.; Lin, H.; Lin, H.; Du, P.; Zhang, S. From species to varieties: How modern sequencing technologies are shaping Medicinal Plant Identification. Genes 2024, 16, 16. [Google Scholar] [CrossRef]
- Asif, M.U.; Muhammad, R.; Khan, M.H.; Sohail, M. Seasonal population dynamics of cotton jassid (Amrasca devastans) in different cotton varieties under field conditions. J. Entomol. Res. 2019, 43, 315–318. [Google Scholar] [CrossRef]
- Durgabai, R.; Bhargavi, P. Pest management using machine learning algorithms: A review. Int. J. Comput. Sci. Eng. Inf. Technol. Res. IJCSEITR 2018, 8, 13–22. [Google Scholar]
- Asif, M.U.; Muhammad, R.; Khan, M.H.; Sohail, M.; Awais, M. Incidence and population dynamics of thrips (Thrips tabaci) on different cotton varieties in Tandojam, Sindh, Pakistan. Int. J. Biol. Biotech 2020, 17, 783–788. [Google Scholar]
- Morsello, S.C.; Groves, R.L.; Nault, B.A.; Kennedy, G.G. Temperature and precipitation affect seasonal patterns of dispersing tobacco thrips, Frankliniella fusca, and onion thrips, Thrips tabaci (Thysanoptera: Thripidae) caught on sticky traps. Environ. Entomol. 2014, 37, 79–86. [Google Scholar] [CrossRef]
- Patil, J.; Mytri, V. A prediction model for population dynamics of cotton pest (Thrips tabaci Linde) using multilayer-perceptron neural network. Int. J. Comput. Appl. 2013, 67, 4. [Google Scholar]
- Xiao, Q.; Li, W.; Kai, Y.; Chen, P.; Zhang, J.; Wang, B. Occurrence prediction of pests and diseases in cotton on the basis of weather factors by long short term memory network. BMC Bioinform. 2019, 20, 688. [Google Scholar]
- Mittal, M.; Gupta, V.; Aamash, M.; Upadhyay, T. Machine learning for pest detection and infestation prediction: A comprehensive review. Wiley Interdiscip. Rev. Data Min. Knowl. Discov. 2024, 14, e1551. [Google Scholar]
- Clark, R.D. Putting deep learning in perspective for pest management scientists. Pest Manag. Sci. 2020, 76, 2267–2275. [Google Scholar] [PubMed]
- Chithambarathanu, M.; Jeyakumar, M. Survey on crop pest detection using deep learning and machine learning approaches. Multimed. Tools Appl. 2023, 82, 42277–42310. [Google Scholar]
- Dwivedi, R.; Dave, D.; Naik, H.; Singhal, S.; Omer, R.; Patel, P.; Qian, B.; Wen, Z.; Shah, T.; Morgan, G.; et al. Explainable AI (XAI): Core ideas, techniques, and solutions. ACM Comput. Surv. 2023, 55, 1–33. [Google Scholar]
- Razak, S.F.A.; Yogarayan, S.; Sayeed, M.S.; Derafi, M.I.F.M. Agriculture 5.0 and Explainable AI for Smart Agriculture: A Scoping Review. Emerg. Sci. J. 2024, 8, 744–760. [Google Scholar]
- Devi, R.S.; Mahadevappa, S. Effect of weather parameters on the incidence of thrips, Thrips tabaci Lindeman on Bt cotton. Int. J. Environ. Clim. Chang. 2021, 11, 107–112. [Google Scholar]
- Soni, R.; Dhakad, N. Seasonal incidence of cotton jassid, Amrasca biguttula biguttula (Ishida) on trasgenic BT cotton and their correlation with weather parameters. Int. J. Agric. Innov. Res. 2016, 4, 2319–1473. [Google Scholar]
- Abbas, Z.; ur Rehman, M.; Tayara, H.; Zou, Q.; Chong, K.T. XGBoost framework with feature selection for the prediction of RNA N5-methylcytosine sites. Mol. Ther. 2023, 31, 2543–2551. [Google Scholar]
- Mir, B.A.; Rehman, M.U.; Tayara, H.; Chong, K.T. Improving enhancer identification with a multi-classifier stacked ensemble model. J. Mol. Biol. 2023, 435, 168314. [Google Scholar]
- Taylor, R.A.; Ryan, S.J.; Lippi, C.A.; Hall, D.G.; Narouei-Khandan, H.A.; Rohr, J.R.; Johnson, L.R. Predicting the fundamental thermal niche of crop pests and diseases in a changing world: A case study on citrus greening. J. Appl. Ecol. 2019, 56, 2057–2068. [Google Scholar] [PubMed]
- Yadav, S.; Korat, J.; Yadav, S.; Mondal, K.; Kumar, A.; Kumar, H.; Kumar, S. Impacts of climate change on fruit crops: A comprehensive review of physiological, phenological, and pest-related responses. Int. J. Environ. Clim. Chang. 2023, 13, 363–371. [Google Scholar]
- Tonnang, H.E.; Sokame, B.M.; Abdel-Rahman, E.M.; Dubois, T. Measuring and modelling crop yield losses due to invasive insect pests under climate change. Curr. Opin. Insect Sci. 2022, 50, 100873. [Google Scholar] [PubMed]
| Disclaimer/Publisher’s Note: The statements, opinions and data contained in all publications are solely those of the individual author(s) and contributor(s) and not of MDPI and/or the editor(s). MDPI and/or the editor(s) disclaim responsibility for any injury to people or property resulting from any ideas, methods, instructions or products referred to in the content. |
© 2025 by the authors. Licensee MDPI, Basel, Switzerland. This article is an open access article distributed under the terms and conditions of the Creative Commons Attribution (CC BY) license (https://creativecommons.org/licenses/by/4.0/).


