Abstract
Irrational land use has triggered many serious ecological problems worldwide, especially in regions where human–land conflicts are prominent. However, the driving mechanisms at different spatiotemporal scales vary and have not been addressed in detail. This study explored the variations of land use and landscape patterns from 1990 to 2020 in the Dongting Lake Ecological Economic Zone (DLEEZ) by land-use transfer matrix, landscape pattern indices methods, etc. We also combined the geographical detector and geographically and temporally weighted regression (GTWR) methods to analyze the spatiotemporal changes in driving forces of land-use changes. The results indicated that forest land, cropland, and wetland were the predominant land-use types, accounting for nearly 90% of the total. Cropland decreased by a total of 1787.55 km2 during the 30-year period, and land-use changes mainly involved the conversion of cropland to other land-use types. The overall fragmentation of the regional landscape increased, with the fragmentation of forest land and cropland increasing. Land-use changes were mainly influenced by human activities like socio-economic and policy factors. Notably, the development of agriculture and aquaculture poses a threat to the maintenance of the area of wetland in the DLEEZ. This study provides a reliable scientific basis for mitigating land-use conflicts and rationally planning land use to formulate a sustainable development strategy for land resources in the DLEEZ.
1. Introduction
Land use and cover change (LUCC) is a result of the interaction between anthropogenic activity and the natural environment [1]. Currently, humans have altered approximately 30–50% of the land area on Earth [2], resulting in great effects on ecosystem services, biodiversity, global climate change, and landscape patterns [3,4,5,6]. In 1995, a research program on LUCC was initiated through a collaboration between the International Geosphere–Biosphere Programme (IGBP) and the International Human Dimensions Programme (IHDP) because LUCC plays a significant role in studies on global climate and environmental change [7]. Therefore, dynamic LUCC monitoring is crucial for sustainable development of land resources, and it has attracted the attention of the public and researchers.
LUCC and its impacts have been extensively studied over the past decades, thereby providing many guiding recommendations for land use management and environmental improvement. For instance, approximately 30% of global wetlands have been lost since 1970, prompting the implementation of various wetland protection and restoration policies worldwide to curb their ongoing loss and degradation [8,9]. Dadashpoor et al. (2019) [10] analyzed LUCC and urbanization in Tabriz metropolitan area (TMA), emphasizing the significant impact of intense human activities on landscape patterns. At the natural geographic scale, Ren et al. (2022) [11] explored driving forces of LUCC in the upper, middle, and lower reaches of the Selenga River Basin, revealing that overgrazing has led to desertification in the upper reach of the watershed. Furthermore, Yu et al. (2023) [12] used multiple models to simulate LUCC in the Western Sichuan Plateau, demonstrating the utility of advanced modeling techniques in predicting future land-use scenarios. However, these studies have primarily focused on administrative units such as countries, provinces, and cities, or natural geographic units such as watersheds and plains. These studies have explored various aspects, including the spatiotemporal evolution of land use, driving mechanisms, landscape patterns, ecological service values, and model simulations. However, past research has paid insufficient attention to areas with frequent human–land interactions. The LUCC and driving mechanisms in these regions are more complex, highlighting the need to strengthen research on LUCC in areas with frequent human–land interactions.
Dongting Lake is the second largest freshwater lake in China and occupies a fragile ecological area in the middle reaches of the Yangtze River [13]. As a wetland of international importance under the Ramsar Convention, Dongting Lake plays an essential role in maintaining regional ecological equilibrium and safeguarding water ecological security [14,15,16]. Additionally, the Dongting Lake area is one of the most important agricultural production bases in China and plays a crucial role in guaranteeing national food security [17]. In 2014, the State Council authorized the “Dongting Lake Ecological Economic Zone Plan” and delineated its geographical boundaries, which brought new opportunities and challenges for the socio-economic growth and ecological preservation of the Dongting Lake area [18]. However, contradictions in human–land relations are still prominent. The GDP of the Dongting Lake area has grown significantly from 374.3 billion yuan in 2010 to 856.4 billion yuan in 2018 [19], which has made human activities such as agricultural reclamation and engineering construction more frequent. The irrational land use has contributed to ecological and environmental issues such as loss of wetlands, frequent flooding, and reduced biodiversity [20]. For example, there is a worrying decrease in the average area of Dongting Lake by 452 km2 (29.6%) from 2002 to 2013 [21]. Moreover, compared to traditional administrative units or natural geographic scales, the Dongting Lake Ecological Economic Zone (DLEEZ) encompasses more diverse and complex ecosystems, such as cities, wetlands, farmlands, and forests. It combines characteristics of both economic development and ecological vulnerability. Owing to rapid environmental changes and complex land use relationships, LUCC are actively occurring in the region. Therefore, it is critical to elucidate the dynamic patterns and driving factors of LUCC in this region.
Previous research predominantly utilized methods such as geographical detector models and Geographically Weighted Regression (GWR) to explore driving forces of LUCC. Geographical detector models assume geographical homogeneity, while GWR accounts for geographical heterogeneity but not temporal changes [22]. The Geographically and Temporally Weighted Regression (GTWR) method was later introduced to address these limitations, capturing both spatial and temporal heterogeneity of driving factors [23]. Therefore, this study first employed geographical detector models to identify the key driving factors of LUCC and then applied the GTWR method to analyze their spatiotemporal heterogeneity. The aims of this research are to: (1) investigate the temporal and spatial changes in land use and landscape patterns in the DLEEZ from 1990 to 2020; (2) identify the core driving factors of LUCC and assess the spatiotemporal variability of the main factors. The results of this study provide a valuable resource for sustainable development and land management in the DLEEZ.
2. Materials and Methods
2.1. Study Area
The DLEEZ(28°30′–30°23′ N, 110°40′–113°10′ E) is situated in the middle reaches of the Yangtze River, with a complex topography, including broad alluvial plains, lake systems, and neighboring mountains and hills. The region features a subtropical monsoon climate, with an average yearly temperature ranging from 16.4 to 17.0 °C and an annual precipitation averaging between 1200 and 1550 mm. The climate and topography provide excellent conditions for agricultural development, and the DLEEZ is an important commodity grain and aquaculture base in China, which is known as the “land of fish and rice” [18]. Moreover, Dongting Lake is the second-largest freshwater lake and a typical river-connected lake in China. Its substantial biodiversity has earned it recognition as one of the 200 global conservation priority eco-regions in the world [24].
In this region, human activity is frequent, balancing both economic development and ecological conservation. The DLEEZ includes most parts of Hunan Province and parts of Hubei Province. The study areas selected for this research are primarily the part of Hunan Province, encompassing Yueyang City, Changde City, Yiyang City, and the Wangcheng District of Changsha City, covering a total area of approximately 46,400 km2 (Figure 1).
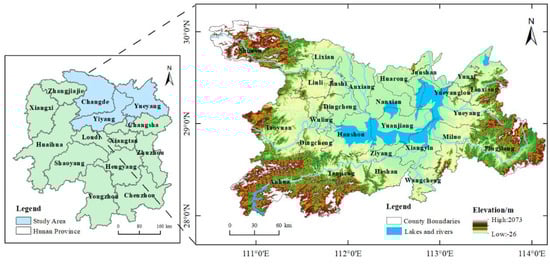
Figure 1.
Location and elevation map of the study area.
2.2. Data Sources and Preprocessing
In this study, remote sensing images at a resolution of 30 m for 1990, 2000, 2010, and 2020 were obtained from the Geospatial Data Cloud website (http://www.gscloud.cn/) (accessed on 20 February 2025), including Landsat-4 TM, Landsat-5 TM, and Landsat-8 OLI images. These images were selected from June to September to ensure the accuracy and comparability of the classification results, and cloud coverage was less than 10% in all images. The remote sensing processing software ENVI 5.1 was used to pre-process the images for radiometric calibration, atmospheric correction, image mosaicking, and cropping. Socio-economic data were obtained from the Hunan Statistical Yearbook (1990–2020) (https://tjj.hunan.gov.cn/tjfx/hntjnj/index.html) (accessed on 20 February 2025), elevation and slope data were acquired from the Geospatial Data Cloud, and temperature, precipitation, and potential evapotranspiration data were sourced from the China Meteorological Data Network (https://data.cma.cn/) (accessed on 20 February 2025).
2.3. Method
2.3.1. Land-Use Classification Method
Based on the national general land-use classification system and the specific conditions of the DLEEZ, six land-use types were selected: cropland, wetland, construction land, forest land, aquaculture ponds, and grassland. Referring to auxiliary information, such as digital elevation models and land-use maps, the support vector machine (SVM) method was employed for land-use classification. The classification results were verified by combining Google Earth high-resolution remote sensing images and field survey data, and the classification accuracy was calculated using a confusion matrix. The overall classification accuracies were greater than 95%, which satisfied the discriminative classification error accuracy requirements.
2.3.2. LUCC Characteristics Indicators
The rate of LUCC can be quantitatively described by the land-use dynamic degree (LUDD) [25]. This method is used to compare regional differences in LUCC and forecast LUCC trends in the future [26]. The following is the formula for LUDD Equation (1):
where Ki is the dynamic degree of LUCC type i; Uai and Ubi denote the area of LUCC type i at the start and the end of the study period, respectively; and T represents the study duration.
LUCC includes quantitative temporal changes and positional spatial changes. The land-use transfer matrix (LUTM), which can intuitively reflect the transformation of each LUCC types within a period, including the direction of the transformation and the size of the information, is the primary technique for quantitatively studying the magnitude and direction of the transformation of various LUCC types. This is helpful for an in-depth analysis of the characteristics of dynamic changes in land use [27]. The formula for LUTM is below in Equation (2):
where S is the variation area of each LUCC type, n is the total number of LUCC types, and i and j are the LUCC types at the start and end of the study period, respectively.
2.3.3. Landscape Pattern Indices
Landscape pattern indices are quantitative measures that can highly condense information on spatial patterns and reflect the characteristics of their structural composition and spatial distribution [28,29]. Popular landscape metric software Fragstats 4.2 (https://fragstats.org/) (accessed on 20 February 2025) computes metrics that characterize the landscape at the patch, class, and landscape levels [30]. Based on the actual conditions in the region, quantitative evaluation of the variations in landscape patterns for different periods at the class and landscape levels. The landscape metrics used in this study are listed in Table S1.
2.3.4. Quantitative Analysis of Drivers
The geographical detector is an analytical method used to identify spatial heterogeneity in the distribution of geospatial factors and their driving forces [31]. It can detect not only the explanatory power (q-value) of a single factor but also the impact of the interaction of several factors [32]. The q-value can be determined using the following formula, Equation (3):
where q represents the explanatory power of the independent variable, with the value range of (0,1); L signifies the stratification of the dependent or independent variable; and Nh and σh2 denote the count of cells and variance of stratum h, respectively.
Interactions were employed to identify whether the explanatory power of the dependent variable was strengthened or weakened when two independent variables acted together [33]. Table 1 provides descriptions of the types of interaction and the criteria upon which the judgment was made.

Table 1.
The interactive effect between two factors.
The main driving factors of typical land-use type and their interactions were analyzed globally using a geographical detector. Considering the actual situation in the DLEEZ and previous research results [34], 18 indicators of socio-economic and natural factors were selected as explanatory variables. Natural factors included precipitation, temperature, elevation, slope, and potential evapotranspiration. Socio-economic factors included population density; urbanization; gross domestic product (GDP); output value of agriculture; output values of primary, secondary, and tertiary industries; output value of fisheries; output value of animal husbandry; output value of forestry; sown area of crops; effective irrigated area of agriculture; and total retail sales of social consumer goods.
Compared with traditional regression models, GTWR can quantify differences in the spatiotemporal effects of drivers. This method builds upon the geographically weighted regression model and is enhanced by introducing a spatiotemporal weighting matrix [35], which is expressed in Equation (4):
where is the dependent variable; is the regression coefficients and the intercept term of the model; denotes the kth regression coefficient of the ith sample point; is the value of the kth independent variable at the ith point; and represents the residual term.
To investigate the spatial and temporal differences in the impact of the core driving factors on typical land-use types separately, the GTWR model was used for local spatial regression analysis. The core driving factors were chosen based on the results from the geographical detector. Following the multicollinearity test, the variance inflation factor (VIF) for each driving factor was less than 5, suggesting that there was no covariance among the chosen factors. The R2 values of the GTWR model for each land-use type were greater than 0.78, indicating a good fit.
3. Results
3.1. Characteristics of LUCC
3.1.1. Spatial and Temporal Variations in LUCC
The land-use pattern of the DLEEZ remained stable during the period 1990–2020, and the LUCC distribution displayed strong spatial differentiation (Figure 2). Cropland was centrally distributed around the lake, mainly in paddy fields. Aquaculture ponds were mainly distributed around the watershed and interspersed between croplands. Forest land was mainly distributed in hilly areas on the eastern and western sides of the study area. The wetland area mainly consisted of rivers, lakes, reservoirs, and shoals in and around Dongting Lake. Construction land was distributed in clusters.
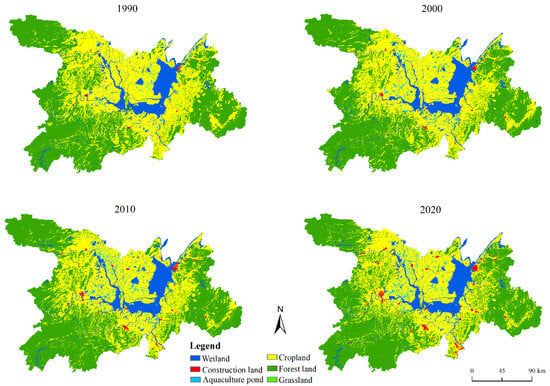
Figure 2.
Spatiotemporal pattern of land use from 1990 to 2020.
From 1990 to 2020, forest land, cropland, and wetland were consistently the main land-use types in the region, accounting for nearly 90% of total area (Table 2). Notably, the area of wetland increased from 1990 to 2020, with a large increase of 226.14 km2 from 1990 to 2010. The cropland area decreased, by a total of 1787.55 km2 over the past 30 years. The area of forest land increased, with a large increase of 564.3 km2 from 2000 to 2010. The area of aquaculture ponds and construction land exhibited increasing trends. In particular, the area of aquaculture ponds increased by 398.01 km2 from 1990 to 2010, and the construction land area increased by 374.29 km2 over the past 30 years.
Table 2.
Change of LUCC area in the DLEEZ from 1990 to 2020.
3.1.2. Land-Use Dynamic Degree
The areas of construction land and aquaculture ponds changed drastically from 1990 to 2020 (Table 3). The construction land area maintained a high rate of growth, particularly with an annual growth rate of 6.63% from 2000 to 2010. The area of aquaculture ponds increased at a rate of 6.74% per year, with the fastest growth rate occurring from 1990 to 2000, followed by a slower growth rate of only 0.26% per year from 2010 to 2020. The wetland area gradually increased from 1990 to 2020, but almost no growth in the last 10 years. The cropland area gradually decreased from 1990 to 2020, with a small and stable annual rate. The area of forest land increased, with the largest annual growth rate of 0.26% occurring from 2000 to 2010.
Table 3.
Land-use dynamic degree (LUDD) for the DLEEZ in 1990–2020 (%).
3.1.3. Land-Use Transfer Matrix
The land-use transfers in the DLEEZ from 1990 to 2020 are shown in Figure 3 and Tables S2–S4. The transformation between cropland and forest land from 1990 to 2020 was the most dramatic change. The wetland was predominantly transferred from cropland, forest land, and aquaculture ponds, among which cropland accounted for the largest proportion, with an input area to the wetland of 378.22 km2, 402.21 km2, and 363.44 km2 in the three periods, respectively (Tables S2–S4). Cropland was mainly converted into other land-use types and more than 70% of transfer-out cropland was converted into forest land. The forest land was mainly transferred from cropland, and the transferred area gradually increased over time, with an area of 2074.88 km2, 2304.02 km2, and 2542.50 km2 in the three periods, respectively (Tables S2–S4). The construction land was mainly transferred from cropland, followed by forest land and wetland, and the area of wetland and cropland transferred to construction land increased over time. The aquaculture ponds were largely transferred from cropland, followed by wetland, of which the largest area of wetland transferred to aquaculture ponds (77.63 km2) was during the period 1990–2000, and the largest area of cropland transferred to aquaculture ponds (395.35 km2) was during the period 2010–2020 (Tables S2 and S4).
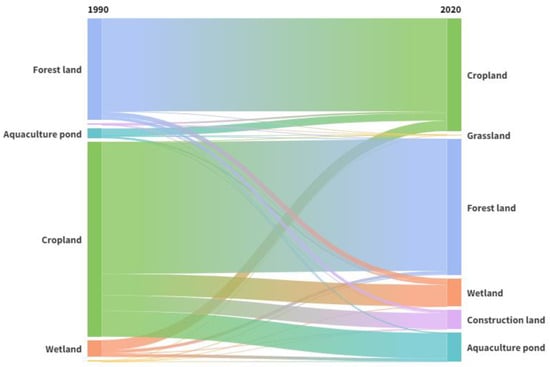
Figure 3.
Sankey map of land-use transfer from 1990 to 2020.
3.2. Landscape Pattern Changes
3.2.1. Characterization of Landscape Pattern Changes at the Class Level
The fluctuation in the Patch density (PD) of forest land and cropland from 1990 to 2020 was larger than that of other land-use types, indicating that the degree of fragmentation of forest land and cropland was more serious (Figure 4). Wetland generally showed a trend of decreasing fragmentation, aquaculture ponds tended show increasing fragmentation, and the PD of construction land and grassland were small, with a small degree of landscape fragmentation. The largest patch index (LPI) of cropland, forest land, and wetland were much larger than those of other land-use types, indicating that these three types were consistently the dominant landscape types in the DLEEZ. The LPI of forest land and cropland fluctuated greatly, with forest land reaching a peak of 9.18% in 2010 and cropland reaching a maximum of 6.44% in 2000. In addition, the LPI of construction land increased over time, and its area expanded, indicating that construction land expanded in an aggregated manner. Forest land, cropland, and wetland had aggregation levels of greater than 99% between 1990 and 2020, indicating that they were highly spatially aggregated with high connectivity. Forest land, cropland, and wetland had larger FRAC_AM values, indicating that they were more irregularly distributed than other land-use types.
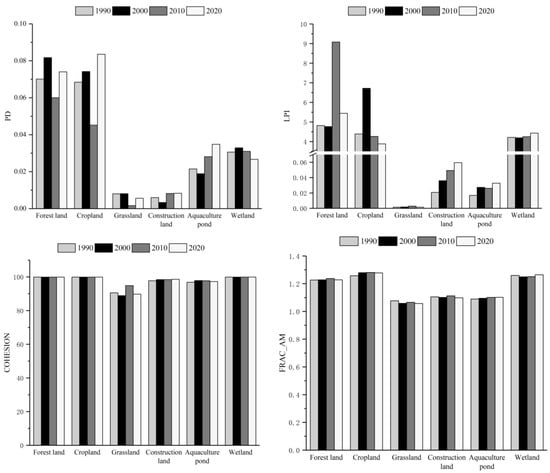
Figure 4.
Landscape pattern index of the DLEEZ at class level from 1990 to 2022.
3.2.2. Characterization of Landscape Pattern Changes at the Landscape Level
At the landscape level, the landscape pattern exhibited fragmentation, heterogeneity, and complexity of shape (Table 4). During the period 1990–2020, the number of patches (NP) and PD increased, and the LPI decreased from 45.58 to 26.11. However, the NP decreased from 2000 to 2010. The contagion index (CONTAG) gradually decreased, indicating that landscape connectivity decreased, and a variety of landscape elements were finely dispersed following anthropogenic disturbance in the study area. Additionally, the Shannon’s diversity index (SHDI) and Shannon’s evenness index (SHEI) both increased slowly, and the landscape types tended to be diverse and balanced. The landscape shape index (LSI) showed an increasing trend, with the largest increase occurring between 2010 and 2020, whereas the fractal dimension mean (FRAC_MN) fluctuated but was generally stable and increased slightly. The increase in both metrics indicates that the landscape shape of the study area became more complex and irregular over time.
Table 4.
Landscape pattern index of the DLEEZ at landscape level from 1990 to 2020.
3.3. Driving Forces of Typical Land-Use Types
3.3.1. Global Driver Effect
From the single-factor perspective (Table S5), the explanatory power of socio-economic factors on the areas of wetland, cropland, and construction land was significantly greater than that of natural factors, which shows that anthropogenic activity posed a greater threat to wetland and cropland than natural factors during the period 1990–2020. Based on the q-value size ranking and p-value significance test (p < 0.05), the main factors affecting wetland were the output value of primary industry and potential evapotranspiration. The factors that had a greater impact on cropland were the output value of primary industry, effective irrigated area of agriculture, sown area of crops, and output value of agriculture. The dominant driving forces of forest land were elevation, slope, temperature, and population density. The factors with the greatest explanatory power for construction land were urbanization, output value of secondary and tertiary industries, population density, GDP, and total retail sales of social consumer goods. The main factors affecting aquaculture ponds were output value of fisheries, slope, and elevation.
From the perspective of the interaction effect (Figure 5), all factor interactions in 2020 were either two-factor or non-linear enhancements, indicating that the effects of all interactions between factors were stronger than the effects of any single factor. The effects of interactions between socio-economic and natural factors on wetland, cropland, construction land, and aquaculture pond were stronger than the effects of other interactions, while the effect of the interaction between natural factors on forest land was the strongest. Moreover, interactions between population density, output value of primary industry, and natural factors had stronger effects on wetland, and their q-values were all greater than 0.7. The interactions of the output value of fisheries, sown area of crops, effective irrigated area, and total retail sales of social consumer goods with other factors had significant effects on cropland area. For construction land, the interaction values of GDP and output value of tertiary industry with other factors were greater than 0.9. Concerning the area of aquaculture ponds, the effects of interactions between the natural and socio-economic factors were prominent, especially those of the interactions between output value of fisheries and other natural factors.
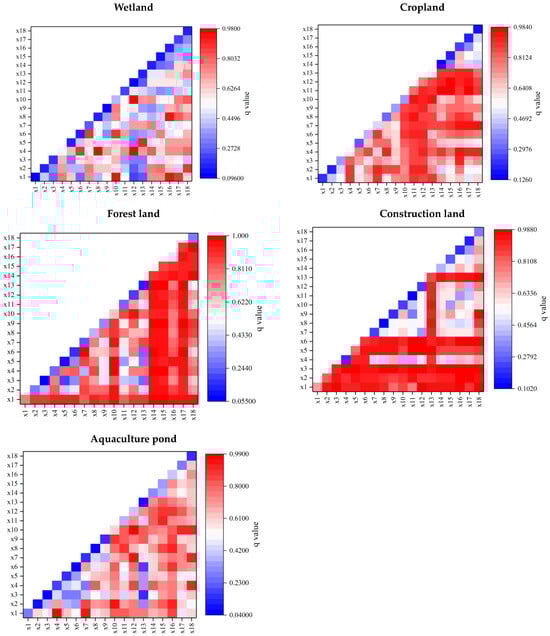
Figure 5.
Interactive exploration of the impact factors of each land use type in 2020. X1 Population density; X2 Urbanization; X3 GDP; X4 Output value of primary industry; X5 Output value of secondary industry; X6 Output value of tertiary industry; X7 Output value of agriculture; X8 Output value of forestry; X9 Output value of animal husbandry; X10 Output value of fisheries; X11 Sown area of crops; X12 Effective irrigated area of agriculture; X13 Total retail sales of social consumer goods; X14 Elevation; X15 Slope; X16 Precipitation; X17 Temperature; X18 Potential evapotranspiration.
3.3.2. Local Driving Effect
Potential evapotranspiration and population density had primarily negative effects on the area of wetland (Figure 6). Furthermore, all counties of Yueyang City had a higher absolute value of regression coefficients for potential evapotranspiration, whereas counties with higher absolute regression coefficients for population density were concentrated in the northeastern area, such as Yuanjiang, Yueyang, Linxiang, Huarong, and Pingjiang. Output values of fisheries had an overall positive effect on the wetland, with larger regression coefficients in areas around the lake, such as Hanshou, Taojiang, Yueyang, Nanxian, and Pingjiang. Output value of primary industries had a large negative effect on wetland in Nanxian and Hanshou but a positive effect on most areas of Yueyang City, especially Miluo. Owing to the lack of data for the output value of primary industries for 1990, only the three periods of 2000, 2010, and 2020 were analyzed. Comparing the regression coefficients in the three periods, the overall positive influence of output value of fisheries decreased, the negative influence of potential evapotranspiration and population density decreased, the negative influence of output value of primary industry weakened, and the influence on wetland area in Yueyang and Linxiang became positive.
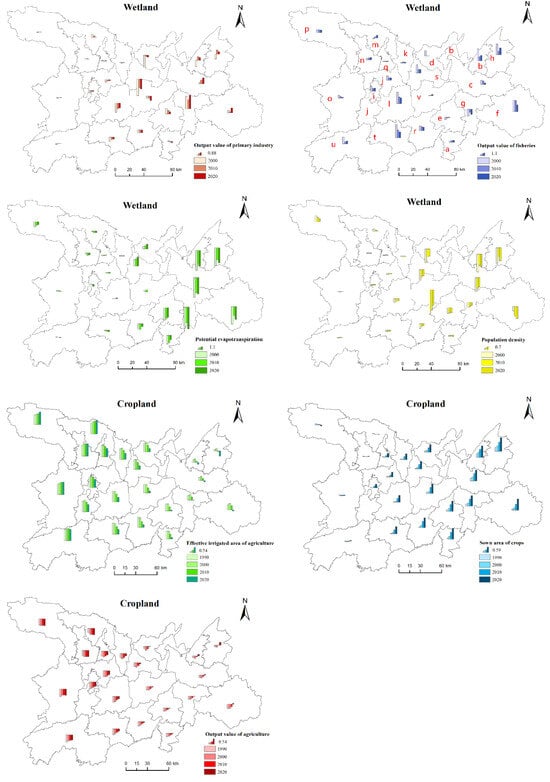
Figure 6.
The mean regression coefficients of core factors for wetland and cropland (Changsha City: a = Wangcheng. Yueyang City: b = Junshan, Yueyanglou, and Yunxi; c = Yueyang; d = Huarong; e = Xiangyin; f = Pingjiang; g = Miluo; h = Linxiang. Changde City: i = Wuling; j = Dingcheng; k = Anxiang; l = Hanshou; m = Lixian; n = Linli; o = Taoyuan; p = Shimen; q = Jinshi. Yiyang City: r = Heshan; s = Nanxian; t = Taojiang; u = Anhua; v = Yuanjiang).
The mean regression coefficient of effective irrigated area of agriculture was the largest (0.594), followed by sown area of crops (0.295) and output value of agriculture (−0.293) (Figure 6). The regression coefficients of the effective irrigated area of agriculture in Changde City and Yiyang City were relatively large, and the areas with large regression coefficients for sown area of crops were mainly in Yiyang City and Yueyang City. The impacts of these two factors on cropland area were positive. However, output value of agriculture and cropland area were mainly negatively correlated, showing that with the development of the economy and advanced agricultural techniques, the area of cropland decreased, but agricultural production increased. From 1990 to 2020, the positive impact of the area of sown crops on cropland increased, and the impact of effective irrigated area of agriculture on cropland spatial variation increased. The positive impact on cropland in the central region decreased, the positive impact in the northwestern region slightly increased, and the positive impact became negative in the eastern region in 2020.
The elevation (0.994) dominated the influence on forest land, and temperature (−0.020) and population density (−0.097) had mainly negative effects on forest land (Figure 7). The areas with larger absolute regression coefficients of population density were mainly Shimen, Taoyuan, and Anhua. Temperature and forest land area showed a positive correlation in Linli, Jinshi, and Dingcheng and a negative correlation in Yiyang, Xiangyin, Miluo, and Wangcheng. The positive effect of elevation and temperature on forest land increased, and the effect of population density decreased from 1990 to 2020. GDP was significantly correlated with construction land with a mean regression coefficient of 8.227. The regression coefficients of all regions were significantly higher in 1990 than in other periods, after which the positive effect of GDP on construction land decreased rapidly with time.
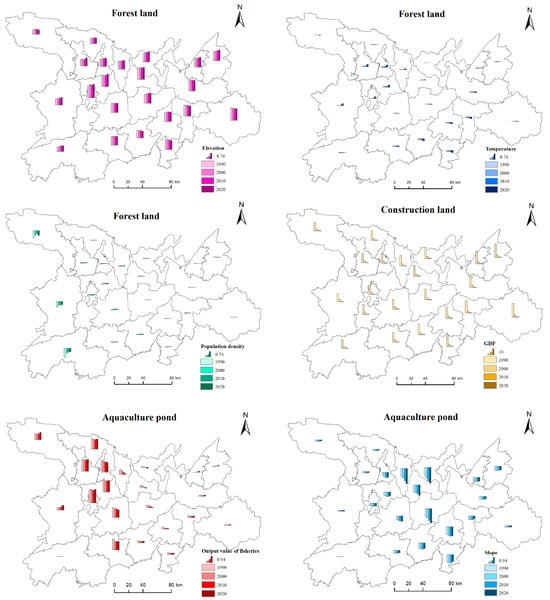
Figure 7.
The mean regression coefficients of core factors for forest land, construction land, and aquaculture pond.
The output value of fisheries (0.607) had a positive effect on aquaculture ponds (Figure 7), while the impact of slope (−0.659) on aquaculture ponds was negative, and the proportion of counties that had significant impacts from these two factors on aquaculture ponds reached 75%. Regression coefficients with high absolute values for slope were primarily in Huarong, Anxiang, Nanxian, and Yuanjiang. Counties in Changde had larger regression coefficients for output value of fisheries. Additionally, the influence of output value of fisheries and slope on aquaculture ponds showed regional variations. The influence of output value of fisheries on aquaculture ponds decreased over time in Taogang, Hanshou, Dingcheng, and Jinshi, and increased in Taoyuan and Shimen. The influence of slope on aquaculture ponds increased in Anxiang, Huarong, Nanxian, Yuanjiang, and Hanshou and slightly decreased in other areas.
4. Discussion
4.1. Spatiotemporal Characteristics of Land Use and Landscape Patterns
Our results indicated that the forest land area in the study region increased by a total of 638.22 km2 during the period 1990–2010. This increase was primarily attributed to the introduction of water-loving and flood-resistant tree species along the levee in combination with the construction of anti-wave forests in 1993 [30]. The area of forest land increased by 564.3 km2 during the period 2000–2010, but only by 105.53 km2 during the period 2010–2020, which was a substantial reduction in the growth rate. This was because large-scale planting of the European and American poplar, referred to as the “wetland water pump”, altered the landscape pattern by making it more terrestrial, reduced biodiversity, and seriously threatened the ecological environment. Consequently, the Central Environmental Protection Inspectorate requested that Hunan remove the poplar trees from the wetland of Dongting Lake in 2017 [36].
Cropland area in the study region substantially decreased during the period 2000–2010, with a total decrease of 935.81 km2, whereas the wetland area gradually increased, with a total increase of 226.14 km2 from 1990 to 2010. These changes mainly resulted from the project of Converting Farmland to Lake (CFTL) [30]. The similar findings have been reported for other regions in China [1]. However, data indicated that from 2010 to 2020, cropland area decreased by only 333.55 km², with a significant reduction in the rate of decrease. This trend can be attributed to the implementation of some policies that alleviated the pressure of large-scale cropland loss. For example, the issuance of the “Reclamation of Rural Construction Land for Cultivated Land Occupancy and Compensation Balance” by the Department of Land and Resources in 2017. Although the total area of wetlands was increasing, there were still some wetlands that have been converted into cropland, aquaculture ponds, and construction land, indicating the existence of encroachment on wetlands for cultivation and aquaculture and the expansion of construction land. Similar results have been reported in other regions, such as Chickahominy River and Sanjiang Plain [37,38].
The area of construction land continued to expand, with a notable increase in the conversion of wetlands and cropland to construction land over time. This suggested that construction land posed a threat to wetlands and cropland with the development of the economy and the growth of population [39,40]. Our study showed that the aquaculture ponds were largely transferred from cropland and wetland. The conversion may be related to the rise of the rice–shrimp aquaculture model in the DLEEZ. The overall fragmentation of the regional landscape increased, with more serious fragmentation of forest land and cropland over time. To a certain extent, this signified an increasing level of disturbance from human activities in the DLEEZ [30].
4.2. Driving Force of LUCC
LUCC is mainly due to the combined effect of climate change and human activities; the key factors influencing LUCC vary in time and space [41,42]. Our results suggested that socio-economic factors played an important role in influencing changes in wetland area, especially in urban areas where human activities are frequent. For example, due to the rapid increase in GDP and population, water consumption could increase, which also requires an expansion of cropland to ensure food supply. The construction of roads and houses can also lead to a reduction in wetland area. Previous study has shown that the impact of human activities on wetland loss is stronger than that of climatic factors [43]. However, the main factors affecting wetlands in the hilly areas of Dongting Lake are climatic factors (e.g., potential evapotranspiration). Previous research in other regions has confirmed that differences in wetland driving forces exist in areas with different levels of anthropogenic disturbance. For instance, lake changes in Mongolia are mainly influenced by precipitation, while Inner Mongolia is mainly affected by coal mining and irrigation [44].
Since the reform and opening up, the influence of natural factors on changes in cropland patterns has gradually weakened, while the influence of human activities has gradually increased [30]. Our study found that the factors that had a greater impact on cropland are mainly agriculture-related factors (e.g., sown area of crops, output value of agriculture, etc.). Notably, the output value of agriculture was negatively correlated with cropland area. With the development of the economy and the advancement of agricultural technology, the efficiency of farming and the quality of cropland have improved [17]; thus the area of cropland has decreased but the output value of agriculture has increased.
In contrast to cropland and wetlands, forest land was mainly affected by natural factors (e.g., elevation, slope, temperature, etc.). Mountainous areas with steeper slopes are less suitable for human habitation and cultivation and are less subject to human disturbance, therefore changes in the area of forested land distributed in mountainous areas are mainly influenced by climate and topography [45].
4.3. Limitations and Future Direction
In summary, policies have greatly influenced LUCC, and the Dongting Lake area has strived to achieve a balance between cropland protection and ecological restoration to promote sustainable development. LUCC was mainly influenced by socio-economic and policy factors, which indicated the dominant role of human activities in LUCC in the DLEEZ. To prevent land-use conflicts from getting worse in the future, scientific planning should be performed and appropriate land-use policies and management strategies need to be formulated. This will contribute to the coordinated and sustainable development of agricultural, ecological, and urban spaces in the DLEEZ.
In this study, the spatial and temporal changes in land use and landscape patterns over three decades were explored, the spatiotemporal heterogeneity of their driving forces in the DLEEZ was evaluated, and some meaningful research conclusions were obtained. These metrics comprehensively reflect the LUCC and driving forces in the Dongting Lake area and its surrounding aquatic and terrestrial environments under human–land interaction. However, this paper had several limitations that need to be considered, due to the images and classification methods, which may affect the accuracy of classification results. Future research should aim to improve the accuracy of classification methods to obtain more precise results. In addition, complex relationships between driving factors and LUCC were identified, but the LUCC trends based on the relationships were not considered. Thus, future LUCC scenarios can be modeled and forecasted in future studies.
5. Conclusions
This study examined the spatiotemporal changes in land use, landscape patterns, and driving forces in the DLEEZ from 1990 to 2020. The findings indicated that forest land, cropland, and wetland were consistently the major land-use types in the region, and LUCC mainly manifested in the conversion of cropland into other land-use types. The overall fragmentation of the regional landscape and the landscape heterogeneity increased. In particular, forest land and cropland were more severely fragmented. Socio-economic factors had a stronger influence than natural factors, and mandatory policies also impacted LUCC; therefore, LUCC was mainly influenced by human activities. Additionally, the development of agriculture and aquaculture threatened wetland to a certain extent. The results of this study assist in deepening the understanding of the effects of spatiotemporal differences of driving factors on LUCC. This study provides a scientific basis for mitigating LUCC conflicts in the DLEEZ and rationally planning the LUCC and development to promote ecological civilizations with a balance between human settlements and natural areas.
Supplementary Materials
The following supporting information can be downloaded at: https://www.mdpi.com/article/10.3390/su17051894/s1. Table S1. Landscape Pattern Indices. Table S2. Land-use transfer matrix of DLEEZ from 1990 to 2000 (km2). Table S3. Land-use transfer matrix of DLEEZ from 2000 to 2010 (km2). Table S4. Land-use transfer matrix of DLEEZ from 2010 to 2020 (km2). Table S5. Typical ground factor detection results.
Author Contributions
Conceptualization, Y.X.; Data curation, Y.Z.; Formal analysis, X.G. and P.Z.; Funding acquisition, Y.X.; Investigation, Y.Z.; Project administration, F.L.; Supervision, Z.D.; Writing—original draft, X.G.; Writing—review & editing, M.G. All authors have read and agreed to the published version of the manuscript.
Funding
This work was supported by the Key Project of Regional Innovation Joint Fund of Hunan Province-Foundation Committee (No. U21A2009), the Science and Technology Cooperation Project of Hunan Innovation Ecological Construction Plan (No. 2023WK2003), the Science and Technology Innovation Platform Project of Hunan Province (No. 2022PT1010).
Institutional Review Board Statement
Not applicable.
Informed Consent Statement
Not applicable.
Data Availability Statement
Data are contained within the article and Supplementary Materials.
Conflicts of Interest
The authors declare no conflict of interest.
References
- Zhou, J.; Gao, P.; Wu, C.; Mu, X. Analysis of Land Use Change Characteristics and Its Driving Forces in the Loess Plateau: A Case Study in the Yan River Basin. Land 2023, 12, 1653. [Google Scholar] [CrossRef]
- Vitousek, P.M.; Mooney, H.A.; Lubchenco, J.; Melillo, J.M. Human Domination of Earth’s Ecosystems. Science 1997, 277, 5325. [Google Scholar] [CrossRef]
- Pielke, R.A. Land Use and Climate Change. Science 2005, 310, 1625–1626. [Google Scholar] [CrossRef] [PubMed]
- Falcucci, A.; Maiorano, L.; Boitani, L. Changes in Land-Use/Land-Cover Patterns in Italy and Their Implications for Biodiversity Conservation. Landscape Ecol. 2007, 22, 617–631. [Google Scholar] [CrossRef]
- Bryan, B.A. Incentives, Land Use, and Ecosystem Services: Synthesizing Complex Linkages. Environ. Sci. Policy 2013, 27, 124–134. [Google Scholar] [CrossRef]
- Xu, X.; Gao, Q.; Peng, C.; Cui, X.; Liu, Y.; Jiang, L. Integrating Global Socio-Economic Influences into a Regional Land Use Change Model for China. Front. Earth Sci. 2014, 8, 81–92. [Google Scholar] [CrossRef]
- Yang, H.Q.; Zhang, J.; Yang, Z.G. Rational Land Planning Utilization Structure Optimization Based on Multi-Objective Linear Programming Model of Foshan. AMR 2012, 616–618, 1243–1248. [Google Scholar] [CrossRef]
- Liu, W.; Guo, Z.; Jiang, B.; Lu, F.; Wang, H.; Wang, D.; Zhang, M.; Cui, L. Improving Wetland Ecosystem Health in China. Ecol. Indic. 2020, 113, 106184. [Google Scholar] [CrossRef]
- Ge, Y.; Sklenička, P.; Chen, Z. Socioeconomic and Climate Effects on Changes in Wetlands in China during a Three-Decade Period of Rapid Growth. Remote Sens. 2023, 15, 1683. [Google Scholar] [CrossRef]
- Dadashpoor, H.; Azizi, P.; Moghadasi, M. Land Use Change, Urbanization, and Change in Landscape Pattern in a Metropolitan Area. Sci. Total Environ. 2019, 655, 707–719. [Google Scholar] [CrossRef]
- Ren, Y.; Li, Z.; Li, J.; Dashtseren, A.; Li, Y.; Altanbagana, M. Comparative Analysis of Driving Forces of Land Use/Cover Change in the Upper, Middle and Lower Reaches of the Selenga River Basin. Land Use Policy 2022, 117, 106118. [Google Scholar] [CrossRef]
- Yu, X.; Xiao, J.; Huang, K.; Li, Y.; Lin, Y.; Qi, G.; Liu, T.; Ren, P. Simulation of Land Use Based on Multiple Models in the Western Sichuan Plateau. Remote Sens. 2023, 15, 3629. [Google Scholar] [CrossRef]
- Cao, S.; Hu, X.; Wang, Y.; Chen, C.; Xu, D.; Bai, T. Understanding Spatial-Temporal Interactions of Ecosystem Services and Their Drivers in a Multi-Scale Perspective of Miluo Using Multi-Source Remote Sens. Data. Remote Sens. 2023, 15, 3479. [Google Scholar] [CrossRef]
- Chen, X.; McGowan, S.; Xu, L.; Zeng, L.; Yang, X. Effects of Hydrological Regulation and Anthropogenic Pollutants on Dongting Lake in the Yangtze Floodplain. Ecohydrology 2016, 9, 315–325. [Google Scholar] [CrossRef]
- Tan, J.; Yu, D.; Li, Q.; Tan, X.; Zhou, W. Spatial Relationship between Land-Use/Land-Cover Change and Land Surface Temperature in the Dongting Lake Area, China. Sci. Rep. 2020, 10, 9245. [Google Scholar] [CrossRef]
- Long, X.; Li, X.; Lin, H.; Zhang, M. Mapping the Vegetation Distribution and Dynamics of a Wetland Using Adaptive-Stacking and Google Earth Engine Based on Multi-Source Remote Sens. Data. Int. J. Appl. Earth Obs. Geoinf. 2021, 102, 102453. [Google Scholar] [CrossRef]
- Yin, G.; Liu, L.; Jiang, X. The Sustainable Arable Land Use Pattern under the Tradeoff of Agricultural Production, Economic Development, and Ecological Protection—An Analysis of Dongting Lake Basin, China. Environ. Sci. Pollut. Res. 2017, 24, 25329–25345. [Google Scholar] [CrossRef]
- Li, Q.; Zheng, B.; Tu, B.; Yang, Y.; Wang, Z.; Jiang, W.; Yao, K.; Yang, J. Refining Urban Built-Up Area via Multi-Source Data Fusion for the Analysis of Dongting Lake Eco-Economic Zone Spatiotemporal Expansion. Remote Sens. 2020, 12, 1797. [Google Scholar] [CrossRef]
- Geng, M.; Niu, Y.; Liao, X.; Wang, K.; Yang, N.; Qian, Z.; Li, F.; Zou, Y.; Chen, X.; Deng, Z.; et al. Inter-Annual and Intra-Annual Variations in Water Quality and Its Response to Water-Level Fluctuations in a River-Connected Lake, Dongting Lake, China. Environ. Sci. Pollut. Res. 2022, 29, 14083–14097. [Google Scholar] [CrossRef] [PubMed]
- Yuan, B.; Fu, L.; Zou, Y.; Zhang, S.; Chen, X.; Li, F.; Deng, Z.; Xie, Y. Patiotemporal Change Detection of Ecological Quality and the Associated Affecting Factors in Dongting Lake Basin, Based on RSEI. J. Clean. Prod. 2021, 302, 126995. [Google Scholar] [CrossRef]
- Li, L.; Xia, H.; Li, Z.; Zhang, Z. Temporal-Spatial Evolution Analysis of Lake Size-Distribution in the Middle and Lower Yangtze River Basin Using Landsat Imagery Data. Remote Sens. 2015, 7, 10364–10384. [Google Scholar] [CrossRef]
- Wu, W.; Zhang, J.; Sun, Z.; Yu, J.; Liu, W.; Yu, R.; Wang, P. Attribution Analysis of Land Degradation in Hainan Island Based on Geographical Detector. Ecol. Indic. 2022, 141, 109119. [Google Scholar] [CrossRef]
- Huang, B.; Wu, B.; Barry, M. Geographically and Temporally Weighted Regression for Modeling Spatio-Temporal Variation in House Prices. Int. J. Geogr. Inf. Sci. 2010, 24, 383–401. [Google Scholar] [CrossRef]
- Geng, M.; Wang, K.; Yang, N.; Qian, Z.; Li, F.; Zou, Y.; Chen, X.; Deng, Z.; Xie, Y. Is Water Quality Better in Wet Years or Dry Years in River-Connected Lakes? A Case Study from Dongting Lake, China. Environ. Pollut. 2021, 290, 118115. [Google Scholar] [CrossRef] [PubMed]
- Li, D.; Wang, X. Land-Use Change and Efficiency in Laos’ Special Economic Zones. Land 2021, 10, 1012. [Google Scholar] [CrossRef]
- Degefu, M.A.; Argaw, M.; Feyisa, G.L.; Degefa, S. Dynamics of Urban Landscape Nexus Spatial Dependence of Ecosystem Services in Rapid Agglomerate Cities of Ethiopia. Sci. Total Environ. 2021, 798, 149192. [Google Scholar] [CrossRef] [PubMed]
- Yao, Z.; Wang, B.; Huang, J.; Zhang, Y.; Yang, J.; Deng, R.; Yang, Q. Analysis of Land Use Changes and Driving Forces in the Yanhe River Basin from 1980 to 2015. J. Sens. 2021, 2021, 1–11. [Google Scholar] [CrossRef]
- Hao, R.; Yu, D.; Liu, Y.; Liu, Y.; Qiao, J.; Wang, X.; Du, J. Impacts of Changes in Climate and Landscape Pattern on Ecosystem Services. Sci. Total Environ. 2017, 579, 718–728. [Google Scholar] [CrossRef] [PubMed]
- Zhang, M.; Wang, J.; Li, S.; Feng, D.; Cao, E. Dynamic Changes in Landscape Pattern in a Large-Scale Opencast Coal Mine Area from 1986 to 2015: A Complex Network Approach. CATENA 2020, 194, 104738. [Google Scholar] [CrossRef]
- Li, J.; Zhou, K.; Dong, H.; Xie, B. Cultivated Land Change, Driving Forces and Its Impact on Landscape Pattern Changes in the Dongting Lake Basin. IJERPH 2020, 17, 7988. [Google Scholar] [CrossRef] [PubMed]
- Song, Y.; Wang, J.; Ge, Y.; Xu, C. An Optimal Parameters-Based Geographical Detector Model Enhances Geographic Characteristics of Explanatory Variables for Spatial Heterogeneity Analysis: Cases with Different Types of Spatial Data. GIScience Remote Sens. 2020, 57, 593–610. [Google Scholar] [CrossRef]
- Wang, J.; Li, X.; Christakos, G.; Liao, Y.; Zhang, T.; Gu, X.; Zheng, X. Geographical Detectors-Based Health Risk Assessment and Its Application in the Neural Tube Defects Study of the Heshun Region, China. Int. J. Geogr. Inf. Sci. 2010, 24, 107–127. [Google Scholar] [CrossRef]
- Deng, X.; Hu, S.; Zhan, C. Attribution of Vegetation Coverage Change to Climate Change and Human Activities Based on the Geographic Detectors in the Yellow River Basin, China. Environ. Sci. Pollut. Res. 2022, 29, 44693–44708. [Google Scholar] [CrossRef]
- An, X.; Zhang, M.; Zang, Z. Driving Mechanisms of Spatiotemporal Heterogeneity of Land Use Conflicts and Simulation under Multiple Scenarios in Dongting Lake Area. Remote Sens. 2023, 15, 4524. [Google Scholar] [CrossRef]
- Wu, J.; Fan, X.; Li, K.; Wu, Y. Assessment of Ecosystem Service Flow and Optimization of Spatial Pattern of Supply and Demand Matching in Pearl River Delta, China. Ecol. Indic. 2023, 153, 110452. [Google Scholar] [CrossRef]
- Li, Y.; Chen, X.; Xie, Y.; Li, X.; Li, F.; Hou, Z. Effects of Young Poplar Plantations on Understory Plant Diversity in the Dongting Lake Wetlands, China. Sci. Rep. 2014, 4, 6339. [Google Scholar] [CrossRef] [PubMed]
- Syphard, A.D.; Garcia, M.W. Human- and Beaver-Induced Wetland Changes in the Chickahominy River Watershed from 1953 to 1994. Wetlands 2001, 21, 342–353. [Google Scholar] [CrossRef]
- Qu, Y.; Luo, C.; Zhang, H.; Ni, H.; Xu, N. Modeling the Wetland Restorability Based on Natural and Anthropogenic Impacts in Sanjiang Plain, China. Ecol. Indic. 2018, 91, 429–438. [Google Scholar] [CrossRef]
- Im, R.-Y.; Kim, T.; Baek, C.-Y.; Lee, C.-S.; Kim, S.-H.; Lee, J.-H.; Kim, J.Y.; Joo, G.-J. The Influence of Surrounding Land Cover on Wetland Habitat Conditions: A Case Study of Inland Wetlands in South Korea. PeerJ 2020, 8, e9101. [Google Scholar] [CrossRef]
- Xie, Y.; Hunter, M.; Sorensen, A.; Nogeire-McRae, T.; Murphy, R.; Suraci, J.P.; Lischka, S.; Lark, T.J. U.S. Farmland under Threat of Urbanization: Future Development Scenarios to 2040. Land 2023, 12, 574. [Google Scholar] [CrossRef]
- Shu, B.; Zhang, H.; Li, Y.; Qu, Y.; Chen, L. Spatiotemporal Variation Analysis of Driving Forces of Urban Land Spatial Expansion Using Logistic Regression: A Case Study of Port Towns in Taicang City, China. Habitat Int. 2014, 43, 181–190. [Google Scholar] [CrossRef]
- Ning, J.; Liu, J.; Kuang, W.; Xu, X.; Zhang, S.; Yan, C.; Li, R.; Wu, S.; Hu, Y.; Du, G.; et al. Spatiotemporal Patterns and Characteristics of Land-Use Change in China during 2010–2015. J. Geogr. Sci. 2018, 28, 547–562. [Google Scholar] [CrossRef]
- Chen, L.; Wang, Y.; Touati, B.; Guan, H.; Leng, G.; Liu, W.; Lv, S.; Huang, S.; Pan, Z. Temporal Characteristics Detection and Attribution Analysis of Hydrological Time-Series Variation in the Seagoing River of Southern China under Environmental Change. Acta Geophys. 2018, 66, 1151–1170. [Google Scholar] [CrossRef]
- Tao, S.; Fang, J.; Zhao, X.; Zhao, S.; Shen, H.; Hu, H.; Tang, Z.; Wang, Z.; Guo, Q. Rapid Loss of Lakes on the Mongolian Plateau. Proc. Natl. Acad. Sci. USA 2015, 112, 2281–2286. [Google Scholar] [CrossRef] [PubMed]
- Zhang, X.; Deng, Y.; Hou, M.; Yao, S. Response of Land Use Change to the Grain for Green Program and Its Driving Forces in the Loess Hilly-Gully Region. Land 2021, 10, 194. [Google Scholar] [CrossRef]
Disclaimer/Publisher’s Note: The statements, opinions and data contained in all publications are solely those of the individual author(s) and contributor(s) and not of MDPI and/or the editor(s). MDPI and/or the editor(s) disclaim responsibility for any injury to people or property resulting from any ideas, methods, instructions or products referred to in the content. |
© 2025 by the authors. Licensee MDPI, Basel, Switzerland. This article is an open access article distributed under the terms and conditions of the Creative Commons Attribution (CC BY) license (https://creativecommons.org/licenses/by/4.0/).