Abstract
Urban community open spaces are external spaces for public use that meet the needs of residents in their daily lives, and which gradually become the basic unit for activities and fitness. The arrival of the era of ‘national fitness’ requires the formation of public activity spaces that benefit all ages. Yet most construction targets of urban community open spaces are homogenised and are not diversified for all age groups. This phenomenon leads to a spatial and temporal mismatch between the allocation of space for community sports activities and the needs of residents. We quantitatively analysed time periods, demanded area and preferred types of activities required by all age groups. We further defined the objectives for the provision of physical activity functions in community open spaces. We also constructed a method for matching and optimising the supply and demand of sports and fitness functions in community open spaces, which was based on the calculation of supply and demand, the matching analysis model and the optimisation of supply and demand gaps. Accordingly, based on the distribution of demand points, we can clarify the amount and radius of each point, and calculate the matching relationship with the Maximum Capacity Limitation Coverage Model. When the implementation rate of demand at the covered points is less than 67%, it means that there is a demand gap. In response to the gap, optimisation has been achieved by establishing a time-sharing utilisation mechanism and using excessive supply space for renovation. The results of the study can help optimise the mismatch and long-term layout of physical activities for all residents in urban communities. The proposed sustainable optimising strategy suggests the importance and necessity of meeting the spatial needs of sports activities for all age groups in high-density cities with insufficient open spaces.
1. Introduction
Globally, 81% of adolescents and 27.5% of adults do not reach the levels of physical activity recommended by World Health Organization, which affects not only individuals and their families but also health services and society [1]. Under the guidance of the Global Action Plan on Physical Activity and Health 2018–2030, the key emphasis in current research is the construction of sports and fitness spaces shared by all ages, following the WHO’s promulgation of more active people for a healthier world. This will lead to more people being more physically active, which will not only benefit the health and well-being of the population but will also have social, environmental and economic co-benefits [2]. However, rapid urbanisation inevitably causes public land tension, and the incremental construction of sports fields makes it challenging to solve this problem. Meanwhile, specialised sports parks are mainly built on the outskirts of cities and suffer from poor accessibility, dilapidated facilities and lack of management, leading to a gradual decrease in the number of residents visiting them, making the optimisation of the city’s internal volume space necessary and urgent. Community open space, on the other hand, is strongly linked to residents’ lives, assuming multiple functions involving daily activities, landscape services, social connections, etc. It has the ability to promote residents’ physiological and psychological health, and is an important way to enhance the level of social public services. Until recently, the motives, forms and contents of residents’ sports and fitness activities have been increasingly diversified in terms of different age groups. However, open spaces in partial communities still maintain a simplified and homogenised configuration standard which is unable to meet the needs of all-age use. Hence, the efficient use and comprehensive design of community open spaces is crucial.
Scholars around the world have gradually learned that community-scale open spaces have become crucial components of urban sports services. The rational planning of the function and layout of community sports spaces is of great significance in promoting the health and well-being of all people and realising urban fairness and justice [3]. Presently, related research has shifted from the configuration of sports facilities to the functional characteristics of public sports spaces and has centred on the supply of public sports spaces [4], the characteristics of residents’ sports demands [5,6] and the matching of sports supply and demand [7].
The supply of public sports services refers to the venues, facilities, fields, funds and other resources [8] provided by the government, market, social organisations and other entities [9] to meet people’s needs for physical fitness and public activities. Linde and Stewart pointed out that the diversity of sports facilities significantly affected residents’ motivation to participate in activities [10]. The types of sports facilities and spaces are closely related to the sports activities provided [11]. On that basis, Shao [12], Zhao and other scholars referred to the National Fitness Guide [13,14], Indicators for the Construction of Urban Community Sports Facilities [15], Indicators for Children’s Outdoor Recreational Site [16] and trail distances to prevent the spread of new coronaviruses [12,17] to analyse the appropriate scales and norms for the construction of physical activity spaces to increase supply. They summarised modes (Table 1) and carriers of supply (Table 2) of sports and fitness activities in communities after considering the different intensities of each activity. Based on qualitative analyses, research on public sports provision has gradually covered areas such as public health [18,19], epidemiology [20] and green space planning [21]. They then explored the method of environmental measurement and assessment using GPS from a previous study [22]. To analyse the level of public sports service provision at stadium venues in each region of China from a spatial data perspective, Shao used the entropy value method to construct the evaluating system for the level of sports ground service supply [12]. The results showed that the supply of sports fields in east China ranked first in terms of the urban–rural scale, the degree of diversification of service modes [23] and the degree of openness of supply, which means that high-density cities are giving more consideration to the expansion of sports fields to meet the growing public demand for exercise and fitness [24].

Table 1.
Forms of supply of basic physical fitness activities in community open spaces.
Table 2.
Community open space sports and fitness function supply carriers.
In terms of the characteristics of residents’ sporting demands, several studies have been conducted to statistically analyse users’ activities and demand characteristics using an International Physical Activity Questionnaire [25] or SOPARC (System for Observing Play and Recreation in Communities) [26,27]. Scholars have tended to use scales, models and principal component analysis [26] to analyse the extent of residents’ demand for sports space facilities and their ability to access them [27]. The regression model has also been used to explore the main factors influencing community residents’ preferences for the use of sports facilities [28]. In Community Sports for the Next Decade [29], the British government has recommended suitable activities to meet the needs of various target groups according to differences in income level, age distribution and social class [30]. The walkability and accessibility of public spaces was improved mainly through satisfying the differences in users’ needs for facilities, green infrastructures and walking tolerance time [31]. Hence, the common, rigid, individual and flexible needs of residents’ demands for the equal allocation of sports and public service facilities [32] have been used to obtain the distinctive characteristics of fitness activities and sports needs of full age groups [33]. The distribution of sports facilities and the layout of functional spaces correspond and are clarified to each age group [34,35]. Currently, combined with the construction plan of a ‘10 min sports and fitness circle’ [36], scholars have tried to summarise the basis for the compilation of public sports planning (Table 3) based on the needs of residents [37].
Table 3.
The demand for sports and fitness activities among all age groups in the community.
Regarding the matching of sports supply and demand, there is a synergistic growth mechanism [38] between public spaces for physical activities and the population’s demand for exercise, including the coordination and clustering development of time, space, elements and functions [39,40]. Spatial analysis models, measurement indicator models, field studies and other methods are applied to analyse the relationship between supply and demand [41] and to advocate for the construction of diversified, multi-functional sports spaces [42]. Additionally, the accessibility and fairness of the sports facilities and spaces in communities have also been evaluated using the GIS analysis model, Gini coefficient, location entropy and network analysis [43,44]. However, scholars have pointed out that the supply of sports functions in community spaces has not met the intergenerational needs of residents. Accordingly, some scholars have focused on the matching of supply and demand and the potential for transformation [45]. Based on the principle of matching supply and demand, Wei and Deng have formulated an optimisation strategy under the balance of ‘self-existence and coexistence’ [46] and proposed an approach for the construction of community space sports services [47]. Higgs, Ashik Fajle and other scholars have successively quantitatively evaluated the coverage of sports function provisions [48] in public spaces through a Two-Step Search Method [49], combined with a global and local autocorrelation analysis to assess and guide the fair layout of community spaces to meet the needs of residents. Chen formed the evaluation system of urban community space sports venues through the ‘4E’ model, which is constructed from the four dimensions of environment, efficiency, fairness and economy [50].
Recently, great importance has been attached to the optimisation of community sports spaces. Ma argues that the layout of government-led spaces and facilities [51] should be based on the accessibility and equity of sports space [52]. The main factors affecting the layout of sports facilities [53] can be listed as population density, coverage of sports service facilities [54], spatial accessibility and regional spatial layout [55], reflecting the necessity of improving spatial patterns of sports infrastructure [56]. With the development of technology and the intersection of multi-disciplinary fields, Arc GIS [57], Location Allocation Model [58] and other methods have gradually been introduced to assist in the site selection of sports facilities. Relying on Arc GIS, the accessibility and fairness indices of public sports spaces were analysed using the Nearest Neighbour Distance Index and Dense Area Algorithm [59], Buffer Analysis, Proximity Distance Calculation and Spatial Integration Management [60]. Hence, strategies for integrating and optimising facilities and spatial resources have been proposed which are intended to strengthen the service capacity [55] and the coverage of community-level sports spaces and build a system of sports space services for young people and the elderly [61].
Currently, there is a growing body of research on the supply of public sports spaces, the characteristics of residents’ sports demand and the matching of the supply and demand between them. The optimisation of the spatial layout of sports is progressing steadily, and the sports and fitness function of community open spaces has also shifted from a single equalisation configuration to an integrated all-age response [62]. However, there is a lack of refined exploration of the actual utilisation rate in matching supply and demand, as well as the optimisation of the spatial layout of sports based on the structure of matching supply and demand. Research on the accessibility of open spaces [41], the types of sports provision [63] and the response of a single opening hour to full-time demand in several types of communities or urban spaces with different population densities [64] are also insufficient.
Accordingly, as an example, we consider two typical urban communities in Nanjing, China, as the study cases, using the SOPARC, interviews, GIS and Maximum Covering Location Model to construct sports function layout units based on the planning map and exploring the relationship between the characteristics of residents’ activity demands, sports–functional supply and open spaces in communities. The following questions are considered: (1) How do the characteristics of physical activity needs differ between all age groups? What are their preferences for activity open spaces? (2) What is the level of the existing provision of physical activity in community spaces? (3) How can the layout of open spaces in communities be optimised to meet the needs and encourage residents to participate in physical activities? We systematically analysed the relationship between the characteristics of residents’ activity demands, sports–functional supply and open spaces in communities. Accordingly, targeted matching and layout optimisation that not only satisfies the relationship between supply and demand in terms of quantity but also enhances the effectiveness of the service and its implementation rate will be conducted.
2. Methods
2.1. Study Area and Data
In this study, we selected Yingtuohuayuan and Dongfangcheng communities in Nanjing as specific research cases (Figure 1). Yingtuohuayuan and Dongfangcheng are located in Xuanwu Lake Street, Xuanwu District, Nanjing, covering an area of approximately 37 ha, with a population of around 11,972. The two selected cases have the following characteristics: (1) They can represent research on the spatial and temporal matching of supply and demand of sports functions in urban community open spaces, which meets the research purpose of this paper. (2) The two communities’ surroundings are resourceful and well-equipped with urban amenities, and the residents have a complete age structure and diverse needs for sports activities. (3) Two cases embody the requirements of the Healthy Cities and Global Action Plan on Physical Activity and Health for the diversity and healthfulness of community open spaces. They also reflect the requirements of improving the quality of spatial environment and human health through the on-demand configuration of various sports and fitness functions.
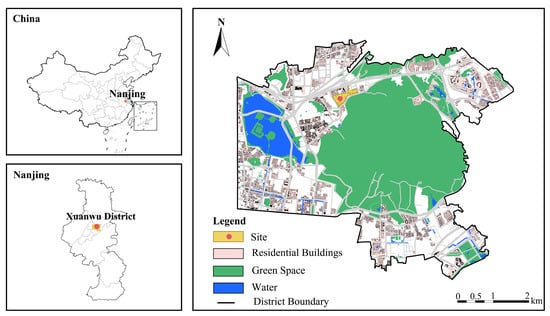
Figure 1.
Community location diagram.
The data required are mainly community, environmental and population, along with the timing and type of activity data. The raw materials were collected through relevant planning data statistics and geographic data public websites. Further refinement and enhancement of the data’s accuracy were performed through field research. We obtained vector data such as the master planning of the main urban area of Nanjing and the community map of two cases. Accordingly, the distribution of current open space points and their respective supply were analysed and generated (Figure 2).
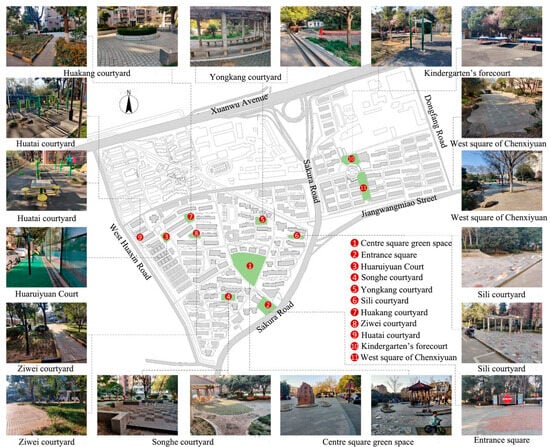
Figure 2.
Distribution of sports and fitness function points in community open spaces.
Through field research and observation, we used the activity path analysis method of time geography to gain an in-depth understanding of the open space layout of the two case communities, the age composition of the community residents and the demand for sports and fitness activities at various times of the day. We collected the research data based on residents’ usage of community open space and their main activity needs. We chose 8 a.m. to 9 p.m. on weekdays and weekends, and observed activity types, locations, paths and frequency carried out in open spaces by different age groups for three consecutive days. Through interviews, we also learnt more about residents’ needs regarding daily activities. Meanwhile, we used ArcGIS for operation and processing to provide data support for subsequent evaluation and analysis.
2.2. Research Design
According to the matching target of the supply and demand for physical fitness in community open spaces, the supply points should not only meet the demand for fitness activities in terms of capacity but also realise the temporal and spatial needs of all age groups and distance accessibility. Based on the matching relationship between the functional supply of community open spaces for sports and the demand for sports and fitness activities from all age groups, we chose the maximum capacity limitation coverage model for analysis. By combining the supply of community open spaces, analysing the demand for residents’ fitness activities, calculating supply and demand and matching the abovementioned results, we try to propose a spatial strategy to optimise the present layout (Figure 3). The first part of this study is the analysis of the physical activity supply in community open spaces, relying on spatial analysis to sort out and analyse the footprint, capacity and layout points of physical fitness space carriers. The residents’ daily physical activities are covered by space carriers of different scales, thus forming a circle-type community open space system (Figure 4). The second part is an analysis of the need for physical activities in all age groups in the community. The SOPARC is applied to track the distribution of each age group and the content of sports activities during different periods throughout the day. Then, the coefficients of sports activities and the amount of demand will be calculated accordingly. The third part is the matching of the supply and demand of physical fitness functions in each open space. Using the maximum capacity limitation coverage model, we can identify the match between the supply and demand for all age groups at peak hours. The traditional model fails to take the possibility of a collaborative supply of resources into account and has certain limitations that may result in inefficient resource allocation and utilisation. This study uses GIS to establish a network model of communities, and adopts the maximum coverage model based on the actual road network, which has practical application significance and credibility. The last part is the optimisation of the layout of sports spaces in the community. Based on the results of the above analyses and the current layout construction of selected case communities, the optimisation strategy for the layout of community sports open spaces is discussed. The discussion includes the optimisation of the coverage of the supply point and the implementation of the demand point from the spatial–temporal perspective.
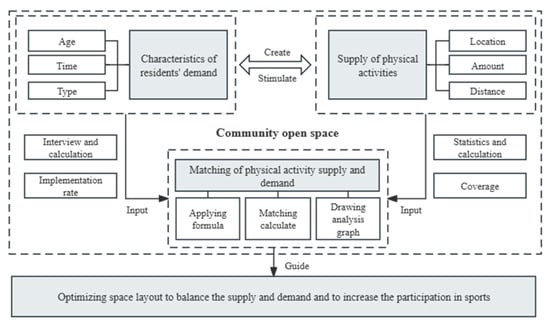
Figure 3.
Analysis and matching model of demand and supply characteristics.
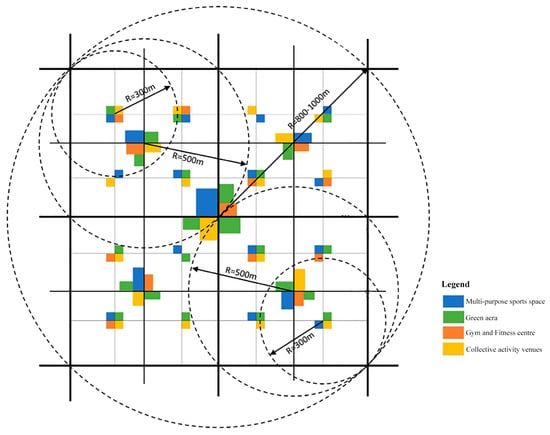
Figure 4.
Diagram of the coverage system of community sports space.
2.3. Analysis
2.3.1. Analysis of the Supply and Demand for Physical Fitness Functions
Physical activity supply refers to the capacity of distinct types of spaces for residents, including squares, fitness trails, fitness equipment venues, play equipment venues, basketball courts, ping-pong courts and badminton courts. We measured and counted the supply in each open space in two communities, including the type and footprint of the area (Table 4).
Table 4.
The supply of sports and fitness functions in each open space of the community.
Since some parts of the square area are meant for access and recreational use, it is appropriate to refer to a ratio of 20% of access area and a coefficient of use area of 0.7 or more in public open spaces. We also tend to reserve more access and recreational spaces in the external square, and only take 60% of the space area for the provision of sports and fitness. Meanwhile, activities or uses occurring in other spaces are included within the physical fitness activities; therefore, the overall space area can be regarded directly as a supply point to calculate and analyse.
2.3.2. Analysis of the Demand for Physical Activities for All Age Groups
- (1)
- Calculation of coefficients of physical fitness activities
The Nanjing National Fitness Implementation Plan calls for the proportion of regular participants in physical fitness to reach more than 44% by 2025 [65]. The State Sport General Administration also points out that only those who participate in sports and fitness with a frequency of three or more times per week are considered to be those who regularly participate in sports activities [66].
This requirement can be seen as the basic guarantee for the general realisation of sporting fitness. Therefore, the coefficient of physical fitness activity is 44% * 3/7, which is about 0.1886. With reference to the construction of 10 min fitness circles and residents’ physical conditions, the distance of all age groups’ needs for fitness activities is further calculated, respectively. This study takes the average value of walking speed of each age group and calculates according to 0.6 m/s for the elderly, 1 m/s for the middle-aged, 1.3 m/s for the young, 1.2 m/s for teenagers and 0.8 m/s for young children. The results show that the radius of the demand for activities is 360 m, 600 m, 780 m, 720 m and 480 m, respectively.
- (2)
- Calculation of demand for each physical fitness activity
All age groups’ demands for physical fitness activities in the community consist of the demands for all types of physical fitness activities under each time period. Physical fitness behaviours of community residents are used to represent and divide time periods of the day. Therefore, the day is divided into the following time periods: time period 1 6:00–8:00 AM, time period 2 8:00–10:00 AM, time period 3 10:00–12:00 AM, time period 4 2:00–5:00 PM, time period 5 5:00–7:00 PM and time period 6 7:00–9:00 PM [67]. Moreover, after calculating the activity demand in each time period, we can identify the peak activity time of the day. This peak period is used as a case to conduct the supply–demand matching analysis and the optimisation of the open space layout.
Considering the distribution of each age group, the peak period and each type of physical fitness activity, the formula below is used to calculate the demand for each type of physical fitness activity at peak hours.
where stands for the serial number of each age group, stands for the serial number of the time period, is the serial number of each physical fitness activity and is the total number of age groups; is the amount of space demanded for types of physical fitness activities in time; is the number of people in age group; represents the coefficient of physical fitness activities; is the proportion of physical fitness activities of age group in time period; is the proportion that age group carries out type of physical fitness activities in time period; and is the per capita area of demanded space of type of physical fitness activity.
and , which are affected by geographic differences, are the specific proportions of each age group and each type of sports activity in each time period, respectively. and will be different in different communities, so it is difficult to accurately fit them with a uniform standard. Therefore, to clarify the specific proportion in a certain community, it is necessary to research, observe and record the behavioural patterns of physical fitness activities of various age groups in the targeted community. Then, the proportion of each time period and the proportion of each type of activity in each time period can be analysed mathematically and statistically to obtain the specific data.
- (3)
- Calculation of demand for physical sports at each active point
To determine residents’ demand for fitness activities at the community level, we can apply the location and area of open spaces, the number of residents and residential households and the walking distance to set up a residential group as a basic unit.
After determining the number of residential households at each demand point by visiting and researching within the range, the demand for each type of physical fitness activity in the peak time can be calculated in proportion to the number of households. The calculation (Formula (2)) is as follows:
where stands for the serial number of the time period, is the serial number of each physical fitness activity and is the number of the demand point; is the amount of space demanded for types of physical fitness activities in time at demand point ; is the number of households at a demand point ; is the total number of households in the community; and stands for the demand space for types of physical fitness activities in period.
2.3.3. Analysis of the Match Between the Supply and Demand for Physical Fitness Functions
Inputting the Radius of Supply and Demand
First, each demand point is inputted based on the demand for each type of physical fitness activity at peak hours. Second, the distance of the demand activities of resident groups is set as the impedance interruption to limit the demand radius of each demand point. The capacity of each supply point is inputted afterwards.
Drawing Analysis Graph of Supply and Demand Matching
The above two formulas and the maximum capacity limitation coverage model are used to generate a supply and demand matching relationship analysis graph to display the layout of the functional space at current peak hours. The matching location between each existing community open space and residents’ fitness demand points in terms of demand point coverage and demand implementation rate of covered points at peak hours are obtained.
Analysing the Results of Supply and Demand Matching
Through the analysis of the results of the coverage rate of demand points and the implementation rate of demand at covered points, the contradictions and gaps between supply and demand are highlighted out to provide a basis for the subsequent optimisation of the spatial layout.
Demand point coverage, within its demanding radius, is the proportion of demand points for fitness activities and the response given by surrounding supply points. When an uncovered demand point occurs, it means that there is a gap in demand distance within that range. The demand implementation rate for covered points refers to the proportion of covered activity demand points whose demand is met by supply points. The presence of a demand overrun unimplemented point represents a gap in demand at that point.
2.3.4. Method for Optimising the Layout of Sports Functions in Community Open Spaces
Object of Optimisation
In terms of the implementation rate of demand at covered points, since the demand is the total amount that needs to be performed cumulatively in a given time period, it is sufficient to satisfy the maximum value of simultaneous performances. According to the calculation method in the Code for the Design of Public Parks (GB51192-2016), those whose visitors stay in parks for an average of 1 h or less, as well as the ratio of the highest number of visitors entering the park compared to the highest number of visitors in the park, is close to 1.5, and this ratio is the conversion factor [68]. Hence, the ratio of the maximum demand to the total demand is 1/1.5, which is approximately 66.67%, i.e., the demand is satisfied when the demand implementation rate at the covered points is ≥66.67%.
After analysing supply and demand matching, the demand point coverage is the basis for the demand to be responded to, as each demand point is covered in terms of distance. Therefore, when the demand point coverage = 100%, and there is a 66.67% ≤ implementation rate of covered demand points ≤100%, this represents that there is a basic balance between supply and demand, and there is no need to optimise for the time being (Figure 5). When 0% < implementation rate of covered demand points <66.67%, this represents that there is an imbalance between supply and demand, and this is the target object of optimisation (Figure 6).
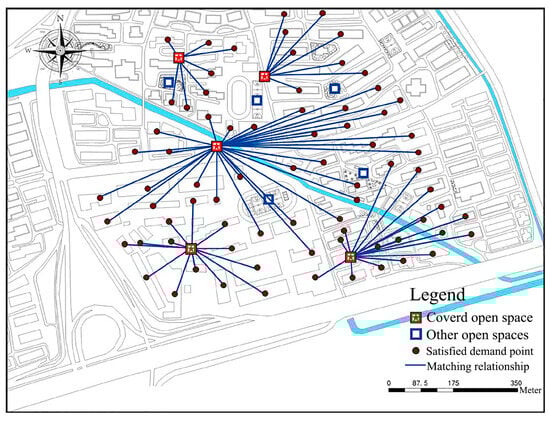
Figure 5.
Diagram for achieving the basic balance between supply and demand.
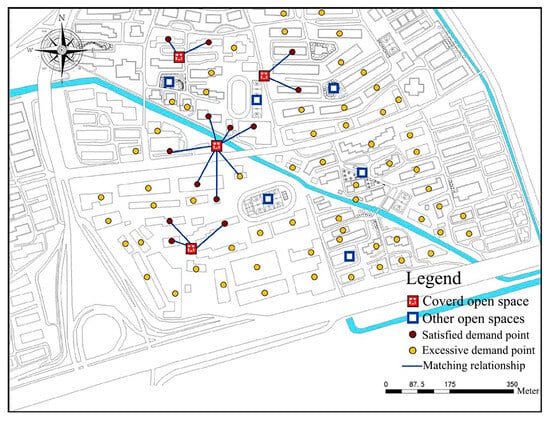
Figure 6.
Diagram of the imbalance between supply and demand.
3. Results
3.1. Results of Supply and Demand Matching
3.1.1. Identifying Supply Points and Fitness Demand Points in Community Open Spaces
There are a total of 11 open space provision points in the community that offer physical fitness activities. Based on a previous analysis of the community’s open space area, capacity and other elements, combined with factors such as the size of the population, walking distance and the number of residential units, the overall community range and the 11 open spaces are divided into six residential clusters (Figure 7). As the basic unit of demand for community sports and fitness activities, the quantitative and spatial relationship between each supply and demand point is clarified.
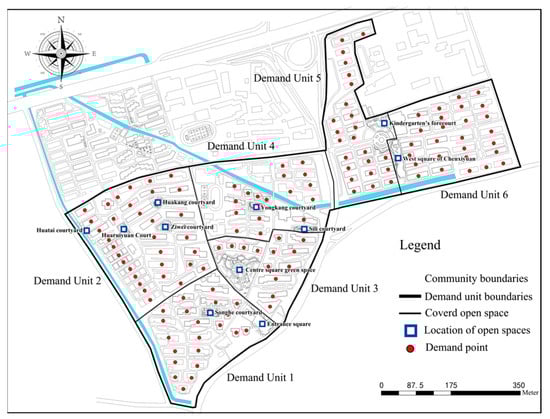
Figure 7.
The location of supply and demand points.
Physical fitness demand points are identified within the level of each demand unit, which sets each residential building as a basic unit. Supply and demand points of physical fitness and other hindering information, such as the information on community roads and the boundaries of residential units, are inputted into the ArcGIS database and form a map with the location of each point.
3.1.2. Analysing Results of the Supply and Demand Match
The analysis was conducted with the Maximum Capacity Limitation Coverage Model and results showed that the supply and demand for community fitness trails, squares and fitness equipment courts were fully met at peak time (Figure 8, Figure 9 and Figure 10). Meanwhile, 100% coverage of demand points was achieved, as well as 100% implementation of demand at covered points, which means that supply and demand are well balanced.
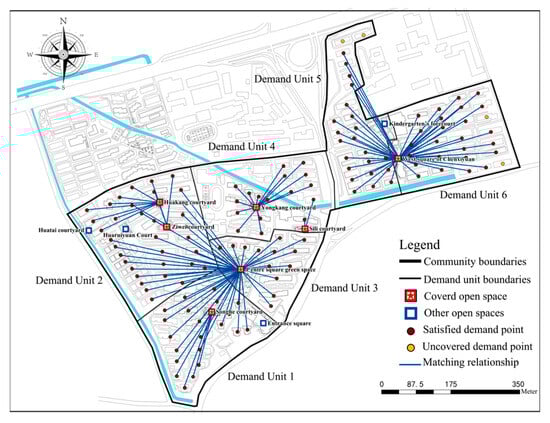
Figure 8.
The matching of supply and demand of fitness trails at peak hours.
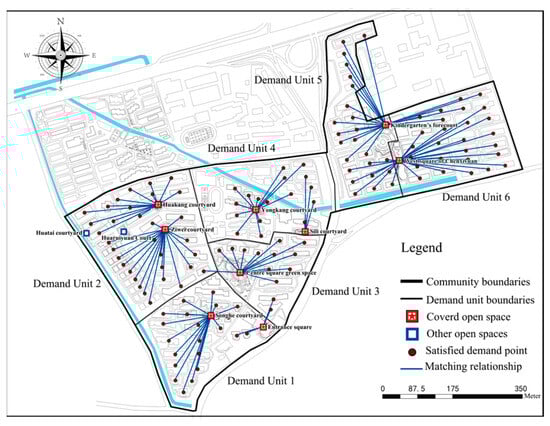
Figure 9.
The matching of supply and demand of squares at peak hours.
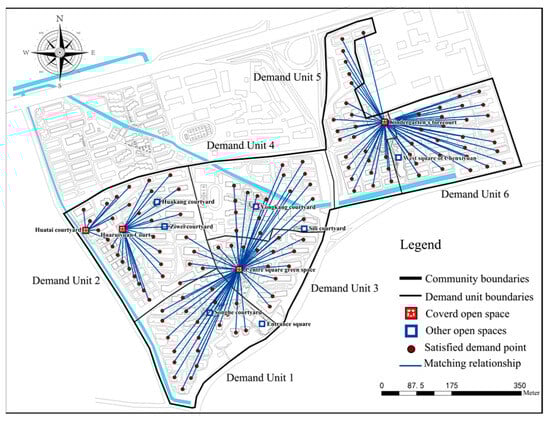
Figure 10.
The matching of supply and demand of fitness equipment venues at peak hours.
However, there is a conflicting imbalance between the supply and demand in amusement facilities and venues, basketball courts, table tennis table courts and badminton courts (Figure 11, Figure 12, Figure 13 and Figure 14).
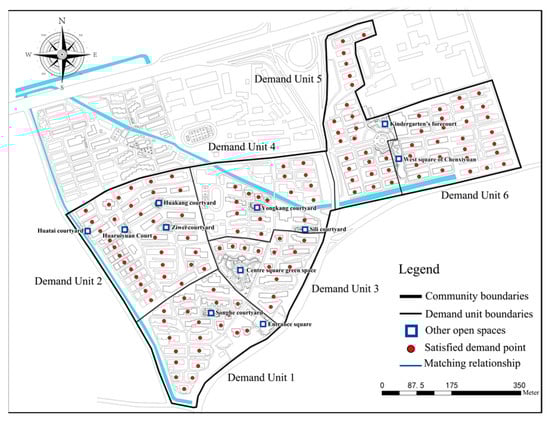
Figure 11.
The matching of supply and demand of amusement facility venues at peak hours.
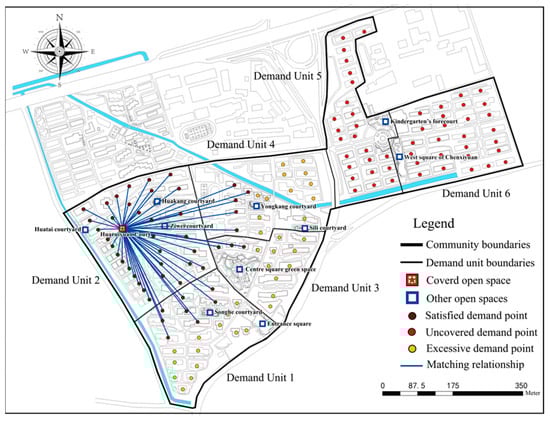
Figure 12.
The matching of supply and demand of basketball courts at peak hours.
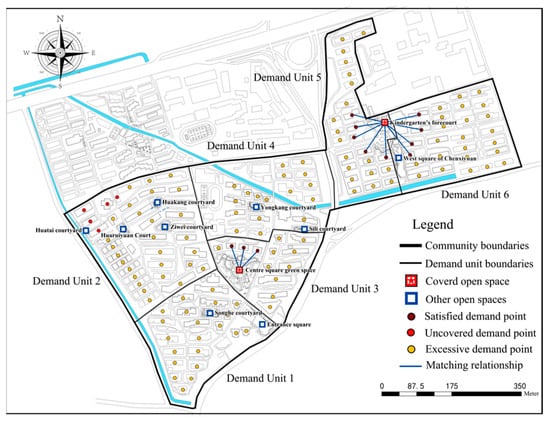
Figure 13.
The matching of supply and demand of table tennis venues at peak hours.
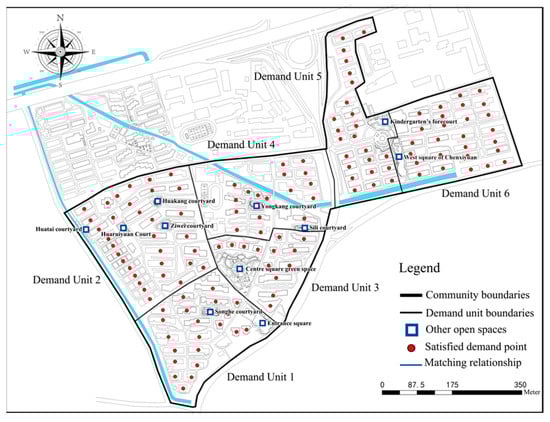
Figure 14.
The matching of supply and demand of badminton courts at peak hours.
The coverage of the demand point for amusement facilities is 0%; the coverage of the demand point for basketball courts is 62.77%, with an implementation rate of 43.43% of the covered point; the coverage of the demand point for table tennis table courts is 96.35%, with an implementation rate of 10.39% of the covered point; and lastly, the coverage of the demand point for badminton courts is also 0%. Thus, all of these sites urgently need to be optimised for the demand and demand distance gap.
After calculations, it has been found that the supply and demand for community open space sports functions in time periods 1, 2, 3, 4, 5 and 6 have different degrees of conflicting supply and demand imbalance and problems. Because the demand for various times of the day needs to be met, and the demand is highest in time period 4, it is set as the peak time of the day. Hence, time period 4 is also used as the case for spatial modification and optimisation (Table 5).
Table 5.
The matching of sports and fitness supply and demand at each point during peak hours.
Required activity space and area are calculated based on the real-time number of people and the activity area per capita mentioned in Table 1.
3.2. The Optimisation of the Layout of Sports–Functional Spaces in the Community
3.2.1. Time-Segmented Utilisation
In terms of the imbalance regarding amusement venues, basketball courts, table tennis courts and badminton courts, we can design an online reservation system for community open and sports–functional spaces on the public service platform for community residents. We designated 1 h before and after the peak time, when the conflict between supply and demand is more prominent, as the reservation time; i.e., 2:00–3:30 PM and 3:30–5:00 PM as the booking time. In this way, the maximum amount of demand can be accommodated and controlled (Figure 15). Residents can access the open space for usage during their booking time through the online reservation system. This method can divert some groups of crowds from the large volume of demand (Table 6).
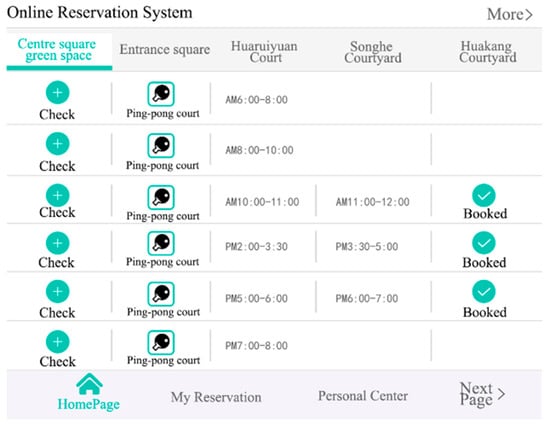
Figure 15.
The online reservation system of time-segmented utilisation for the community sports functional space.
Table 6.
The time-segmented utilisation mechanism of community open space.
3.2.2. Space Transformation
Based on the maximum coverage model, the study was conducted with the goal of achieving full coverage of community sports space resources with limited resource points. According to the demand for space after time-segmented utilisation, the remaining open space that exists within the over-provisioned physical activity spaces can be upgraded and converted into the required play facility venues, basketball courts, table tennis courts and badminton courts (Table 7). In this way, we can not only meet the demands for physical activities for all age groups in the community, but also realise the all-age sharing of physical activity functions (Figure 16, Figure 17, Figure 18 and Figure 19).
Table 7.
Supply of sports and fitness functions after optimising community open spaces.
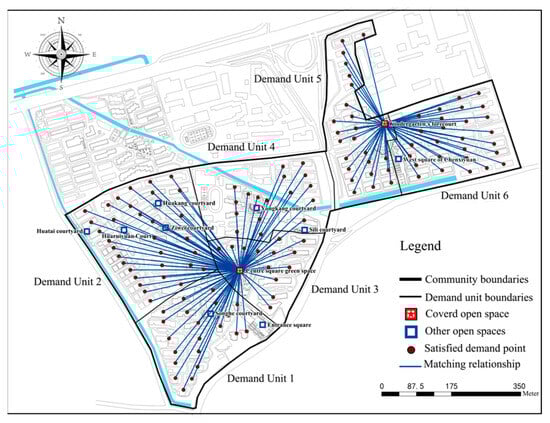
Figure 16.
The matching of supply and demand of amusement facility venues at peak hours after optimisation.
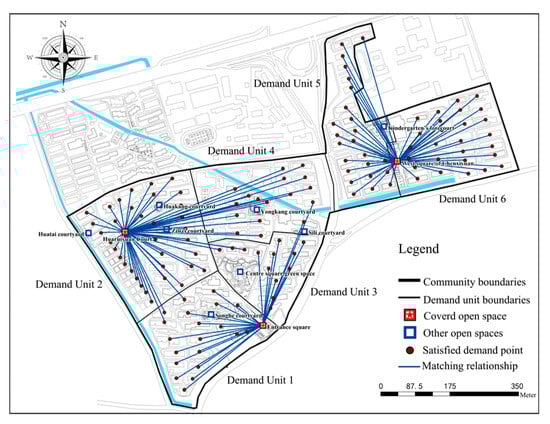
Figure 17.
The matching of supply and demand of basketball court at peak hours after optimisation.
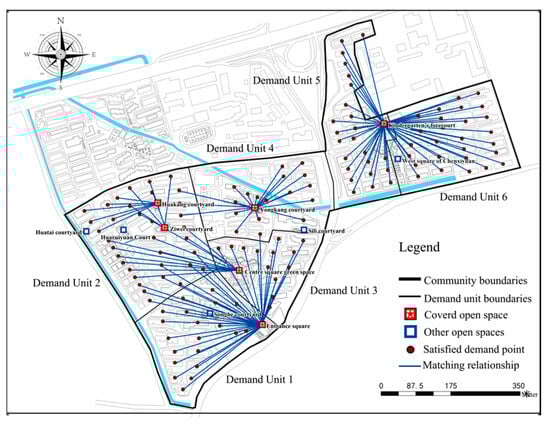
Figure 18.
The matching of supply and demand of table tennis court at peak hours after optimisation.
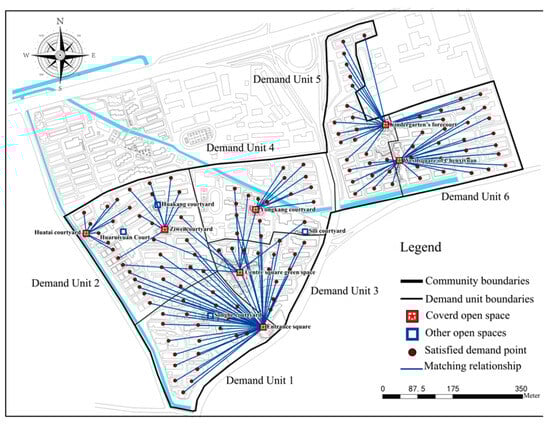
Figure 19.
The matching of supply and demand of badminton courts at peak hours after optimisation.
4. Discussion
The project of building sports–functional open spaces in Chinese urban communities is a major initiative in the implementation of the National Fitness Programme. Based on previous studies, China’s per capita park green space has risen from 13.08 m2 to 14.78 m2 [69]. However, there is still a gap between fewer spaces for public sports activities and insufficient coverage of sports service facilities, which hinders the development of related activities. As a result, residents’ motivation to carry out sporting activities is affected.
Analysis of physical activity supply and demand is the basis for the spatial layout of sports spaces. Scholars have made considerable progress in this field, forming a functional assessment system for community sports spaces, which takes spatial accessibility as the main reference indicator [70]. However, most of the relevant studies focused only on the allocation of sports facilities and spatial accessibility. Therefore, in conjunction with the concept of all-age sharing, we not only emphasise the matching of supply and demand for sports spaces but also pay equal attention to the diversified needs of all age groups and their needs for use at various times of the day.
We chose two communities in Nanjing that are densely populated, well-infrastructured, spatially diverse and rich in sports demand as typical study cases. By analysing the matching of the supply and demand of physical activities for all age groups, we further developed the strategy of optimising the open space layout for community sports activities with time-segmented utilisation, space transformation and addenda at points. The optimisation takes into consideration the diversified needs of residents, the walking-tolerant distance and the supply–demand capacity to realise the full coverage of all-age physical activity needs under all time slots.
4.1. Contributions to Research Analysis Methods
This paper provides a complete method system for the evaluation and analysis of the spatio-temporal supply–demand matching of public sports space. Although recent studies are still using the SOPARC method [25] and principal component analysis [71] to obtain data on residents’ preferences for physical activities offered in the community, we have further refined and integrated the activity demand analysis system. Compared with previous studies, we took the all-age group as the entry point and refined the physical activity demand instead of simply focusing on the demand of the elderly or the youth [55,72]. Meanwhile, demand for physical activity at the community level is often calculated using population density [73]. However, the demand type, distance and time for physical activity vary and are unique to each age group, which can improve the precision and accuracy of matching supply and demand. Moreover, in previous studies, the supply and demand analyses of sports spaces have mostly focused on the macro-city level [74], relying on the accessibility calculations and Gini coefficient evaluations of GIS [44] to guide the evaluation of fairness in using sports facilities and activity spaces [49]; this can be used to compare the spatio-temporal characteristics of the same public open space and has universal application value.
4.2. Contributions to the Optimisation of the Layout and Usage of Public Sports Space
At present, given the differences in age structure, space uprating, fitness reference and other aspects, the space utilisation of urban communities is insufficient and lacking in functionality, which has led to an inevitable contradiction in the mismatch between the supply and demand of physical activity functions of community open spaces. This research also breaks through the single limitation in previous studies on the physical activity function in open spaces, which are mostly based on the perspectives of appropriateness evaluation [75], accessibility analysis [76] and fairness analysis [77]. Previous studies have focused more on the supply and carrying capacity of urban green space [78] and large stadiums, neglecting the open space around residents. In order to accurately analyse the level of supply in spot space, we used 60% of sports space to conduct the calculation. This helps to reduce duplicate coverage and is economical in practice. The maximum capacity limitation coverage model is applied with the ratio of coverage, 66.67%, to match supply and demand in terms of capacity fulfilment and coverage. We present the results visually using ArcGIS and form a matching analysis method that includes the coverage rate of demand points and the implementation rate of demand, which provides an effective basis for optimising the layout of sports and fitness functions in community open spaces. The results show that the existing space for physical activities in Yingtuohuayuan and Dongfangcheng communities can meet residents’ demands, but there is still room for upgrading regarding planning. On the one hand, consistent with previous research, through the analysis of the matching between supply and demand, it can be ensured that the service scope of the sports space [79] is maximised, and visual demonstrations can be provided of whether each demand point is effectively covered. On the other hand, we emphasised the characteristics of the physical needs of different age groups. This breaks through the limitation of merely focusing on spatial accessibility and improves the matching system. Accordingly, we can provide a basis for the subsequent optimisation and improvement of the layout.
4.3. Limitations and Future Research
The basic activity needs of residents have partially been met, but there is still room for further improvement and optimisation. The first major difficulty is how to improve resource coverage and space utilisation given the limited stock space. Although the current configuration of facilities and space planning have improved, it is still difficult to assess whether maximising the use of limited resources can meet the physical activity needs of all-age groups. In addition, this study focuses on all-age groups and pursues the breadth of data collection and survey, but is lacking in specificity.
In the future, detailed methods of optimisation can be proposed and improved in depth. Firstly, to save the buildable space in the community, the time-segmented utilisation mechanism can be established based on the actual duration of residents’ fitness activities. By identifying 1 h or more before and after the peak hours as the booking time, the residents can be diverted so that the demand is subsequently halved. Secondly, for the distribution of uncovered or unresponsive points, it is necessary to use supply points within their distance range. Considering the excess supply points and the amount of unmet demand after diversion, the spatial carriers of demand can be renewed and transformed to achieve a balance between supply and demand. Thirdly, targeted optimisation of the distribution of uncovered or unresponsive points is conducted by referring to the principles of appropriateness at the right time and the right place and to suit the needs of the population. When there are no redundant supply points within the uncovered points’ distance range, new supply points are added to expand the spatial carriers of demand based on the amount of unmet demand after diversion from uncovered points. Moreover, urban design concepts such as child-friendliness and age-friendliness should be introduced to enhance the completeness and comprehensiveness of the study. These results will provide a basis for people-centred planning and more accurately meet the actual physical activity needs of residents.
5. Conclusions
This research focuses on the characteristics of physical activities, the demand for all-age fitness and the functional supply of community open spaces. We recognised that the needs of all age groups for physical activities are diversified in terms of type, full-time accessibility in terms of use and convenience and are comprehensive in terms of spatial carriers. We further clarified the matching relationship between supply and demand from the perspective of ‘the supply of physical activity functions and the demand for physical activities for full-age groups in community open space’. The Yingtuohuayuan and Dongfangcheng communities in Nanjing were selected as study cases to analyse the gaps that exist between the supply and demand of physical activity functions in their open spaces. Through targeted time-segmented utilisation and spatial optimisation, a community open space layout with all-age sharing of sports and fitness functions has been formed.
As with any research, this work is subject to limitations and deficiencies, which provide room for future endeavours. This paper only achieves a basic guarantee of the supply and demand for physical activity functions in terms of the demanded range of distance and the amount of demand. The authors hope that in future research, more liveable community open space environments will be built in conjunction with residents’ order-of-use selection characteristics based on spatial quality preferences.
Author Contributions
Conceptualization, W.H. and W.F.; methodology, W.H. and W.F.; software, W.H. and J.D.; validation, W.H. and J.D.; formal analysis, W.H. and J.D.; investigation, J.D.; resources, J.D. and W.F.; data curation, W.H. and J.D.; writing—original draft preparation, W.H.; writing—review and editing, W.H. and W.F.; visualization, W.H. and J.D.; supervision, W.F.; project administration, W.F. All authors have read and agreed to the published version of the manuscript.
Funding
This research received no external funding.
Institutional Review Board Statement
The study was approved by the College of Landscape Architecture at Nanjing Forestry University.
Informed Consent Statement
Informed consent was obtained from all subjects involved in the study.
Data Availability Statement
Data associated with the study have not been deposited into a publicly available repository. Data will be made available on request.
Acknowledgments
This research did not receive any specific grant from funding agencies in the public, commercial, or not-for-profit sectors.
Conflicts of Interest
The authors declare no conflict of interest.
References
- World Health Organization. Global Action Plan on Physical Activity and Health 2018–2030: More Active People for a Healthier World. Available online: https://www.who.int/publications/i/item/9789241514187 (accessed on 24 March 2021).
- Kong, N. Sound the Trumpet for the Construction of a Strong Sports Country; Beijing Daily: Beijing, China, 2021. [Google Scholar]
- Chen, D.X.; Li, F.Z.; Cheng, X.R. Characteristics and enlightenment of the construction of public sports service system in developed countries in Europe and the United States. J. Phys. Educ. 2020, 36, 42–50. [Google Scholar]
- Yang, J.Y.; Wen, X.L. Research status and hotspots of sports space in China based on CiteSpace. Archit. Cult. 2024, 2, 41–43. [Google Scholar]
- Jin, X.Y.; Jiang, R.; Xue, Y.P. The Sports Idea, the Need and Action of Inhabitants in City Community near the College. J. Sports Res. 2003, 6, 22–25. [Google Scholar] [CrossRef]
- Lei, X.L.; Yu, H.Y. The Quantitative Analysis on the Individual Characteristics of Urban Residents and Their Sport Consumption Motivation. Phys. Procedia 2012, 33, 2055–2063. [Google Scholar] [CrossRef][Green Version]
- Lu, S.; Xue, S.K.; Peng, C. Supply-demand matching assessment of the public service facilities in 15-minute community life circle based on residents’ behaviors. Cities 2024, 144, 104637. [Google Scholar]
- Liu, H.-J.; Sun, Q.-Z. Research on the evaluation index system about Integration Sports public service between Urban and Rural. In Proceedings of the 2010 International Conference on Computer Science and Sports Engineering (CSSE 2010), Hefei, China, 24–27 August 2010; Wuhan Sports University: Wuhan, China; China Institute of Sport Science: Beijing, China; Institute of Electrical and Electronics Engineers: Beijing, China, 2010. [Google Scholar]
- Bayle, E. A model for the multi-centered regulation of world sport. Int. J. Sport Policy Politics 2023, 15, 309–327. [Google Scholar] [CrossRef]
- Van Hecke, L.; Ghekiere, A.; Van Cauwenberg, J.; Veitch, J.; De Bourdeaudhuij, I.; Van Dyck, D.; Clarys, P.; Van De Weghe, N.; Deforche, B. Park characteristics preferred for adolescent park visitation and physical activity: A choice-based conjoint analysis using manipulated photographs. Landsc. Urban Plan. 2018, 178, 144–155. [Google Scholar] [CrossRef]
- Stewart, O.T.; Moudon, A.V.; Littman, A.J.; Seto, E.; Saelens, B.E. Why neighborhood park proximity is not associated with total physical activity. Health Place 2018, 52, 163–169. [Google Scholar] [CrossRef] [PubMed]
- Shao, W.P. Research on the Optimization of Comprehensive Sports Parks in the Central Urban Area of Chongqing Based on Sports Performance. Master’s Thesis, Southwest University, El Paso, TX, USA, 2023. [Google Scholar]
- Zhao, Y.Q. The Influence of Urban Public Space on Residents’ Leisure Lime Physical Activity—Taking Shanghai Yangpu Riverside Greenway as an Example. Master’s Thesis, Shanghai University of Sport, Shanghai, China, 2023. [Google Scholar]
- General Administration of Sport. National Fitness Guide. Available online: https://www.sport.gov.cn/n315/n20067006/c20324479/content.html (accessed on 11 August 2017).
- General Administration of Sport. Land Use Indicators for Urban Community Sports Facilities Construction. Available online: https://www.mnr.gov.cn/gk/bzgf/200805/t20080514_1971630.html (accessed on 1 November 2005).
- Beijing Municipal Bureau of Sports. Guidelines for the Normalization of Prevention and Control of COVID-19 in Sports Fitness Places in Beijing (Revised in September 2021). Available online: http://www.bjft.gov.cn/ftq/fgfc/202206/0a37a4eb8ef34afbaa156b74aa29c921.shtml (accessed on 7 September 2021).
- Stanislav, I. COVID-19 Pandemic and Current Challenges to Global Public Health Governance: Mechanism, Dilemma and Reform Directions. Master’s Thesis, Zhongnan University of Economics and Law, Wuhan, China, 2023. [Google Scholar]
- Shenzhen Education Bureau. Shenzhen Kindergarten Establishment Standards. Available online: http://szeb.sz.gov.cn/home/xxgk/flzy/zcfgjjd/zcfg/content/post_10255961.html (accessed on 14 November 2022).
- Soza-Parra, J.; Kucharski, R.; Cats, O. The Shareability Potential of Ride-pooling Under Alternative Spatial Demand Patterns. Transp. A Transp. Sci. 2022, 20, 2140022. [Google Scholar] [CrossRef] [PubMed]
- Wen, S.Z.; Meng, X.L. Research on the optimization strategy of street space in the post epidemic era. Art Des. Res. 2022, 3. [Google Scholar] [CrossRef]
- Vasu, S.; Raaj, R.; Ronita, B. Geospatial approach for assessing spatiotemporal dynamics of urban green space distribution among neighbourhoods: A demonstration in Mumba. Urban For. Urban Green. 2020, 48, 126585. [Google Scholar]
- Pearson, A.L.; Tribby, C.; Brown, C.D.; Yang, J.A.; Pfeiffer, K.; Jankowska, M.M. Systematic review of best practices for GPS data usage, processing, and linkage in health, exposure science and environmental context research. BMJ Open 2024, 14, e077036. [Google Scholar] [CrossRef] [PubMed]
- Shao, G.H.; Li, H.J. Research on the Evaluation of the Supply Level of Sports Venues from the Perspective of Equalization of Basic Public Services in China. J. Cap. Univ. Phys. Educ. Sports 2020, 32, 55–62. [Google Scholar] [CrossRef]
- Zheng, J.; Hu, M.; Wang, C.; Wang, S.; Han, B.; Wang, H. Spatial patterns of residents’ daily activity space and its influencing factors based on the CatBoost model: A case study of Nanjing, China. Front. Archit. Res. 2022, 11, 1193–1204. [Google Scholar] [CrossRef]
- Evenson, K.R.; Jones, S.A.; Holliday, K.M.; Cohen, D.A.; McKenzie, T.L. Park characteristics, use, and physical activity: A review of studies using SOPARC (System for Observing Play and Recreation in Communities). Prev. Med. 2016, 86, 153–166. [Google Scholar] [CrossRef] [PubMed]
- Wang, S. A Study of Community Sports Public Service Provision in Haidian District, Beijing, China. Master’s Thesis, Capital University of Physical Education and Sports, Beijing, China, 2015. [Google Scholar]
- Hou, Y.; Liu, Y.; Wu, Y.; Zhang, B. Assessment of spatial and socioeconomic disparities in urban green space accessibility based on a Physical Activity Diversity Index (PADI). Ecol. Indic. 2024, 166, 112478. [Google Scholar] [CrossRef]
- Wang, M. Preference Cognition and Influencing Factors about Sports Service Facilities in the City Community. J. Jilin Sport Univ. 2016, 32, 34–38. [Google Scholar] [CrossRef]
- Department for Culture, Media & Sport. Sporting Communities: The Next Decade; Department for Culture, Media & Sport: London, UK, 1982.
- Wolch, J.; Byrne, J.A.; Newell, J.P. Urban green space, public health, and environmental justice: The challenge of making cities ‘just green enough’. Landsc. Urban Plan. 2014, 125, 234–244. [Google Scholar] [CrossRef]
- Shartova, N.V.; Mironova, E.E.; Grischenko, M.Y. Spatial disparities of street walkability in Moscow in the context of healthy urban environment. Cities 2023, 141, 104469. [Google Scholar] [CrossRef]
- Peng, J.; Liu, Y.; Ruan, Z.; Yang, H. Study on the optimal allocation of public service facilities from the perspective of living circle—A case study of Xiangyang High-tech Zone, China. J. Urban Manag. 2023, 12, 344–359. [Google Scholar] [CrossRef]
- Yu, Y.; Wang, H.; Wang, L. Research on Planning Countermeasures for Community Sports Facilities for Children and Youth. In China Society of Urban Planning, Chongqing Municipal People’s Government. Vibrant Urban and Rural Areas Beautiful Habitat—Proceedings of the 2019 China Urban Planning Annual Conference (07 Urban Design); China Architecture Industry Press: Beijing, China, 2019; p. 13. [Google Scholar] [CrossRef]
- Hong, G.; Zhang, Z.; Wang, Z.; Li, H.; Wang, J.; Hu, J. Difficulties and Countermeasures of Community Sports Service in China. Int. J. Educ. Humanit. 2022, 4, 122–124. [Google Scholar] [CrossRef]
- Hjort, M.; Martin, W.M.; Stewart, T.; Troelsen, J. Design of Urban Public Spaces: Intent vs. Reality. Int. J. Environ. Res. Public Health 2018, 15, 816. [Google Scholar] [CrossRef] [PubMed]
- Jiangsu Province Sports Bureau. Jiangsu Province Urban Community “10 Minutes Sports Fitness Circle” Construction Implementation Program; Jiangsu Province Sports Bureau: Rugao, China, 2013.
- Yan, D.Y.; Zhen, L.; Hua, W.L. Selection and Spatial Layout of Urban Sports Facilities Guided by Residents’ Demand. Open House Int. 2019, 44, 9–12. [Google Scholar] [CrossRef]
- Hao, H.T.; Xu, X.M.; Yu, Z.J.; Huo, X.Y. Path of Synergetic Development Between Large Stadiums and City. J. Beijing Sport Univ. 2019, 42, 42–49. [Google Scholar]
- Bian, H.X. The Theory and Practice of Local Collaborative Development of Science and Technology Parks: Case of P District in Shanghai. Master’s Thesis, East China Normal University, Shanghai, China, 2014. [Google Scholar]
- Wang, F. Research on the Governance of Public Sports Service Space in Urban Communities. Master’s Thesis, Shanghai University of Sport, Shanghai, China, 2023. [Google Scholar] [CrossRef]
- Zhang, Z.; Wang, M.; Xu, Z.; Ye, Y.; Chen, S.; Pan, Y.; Chen, J. The influence of Community Sports Parks on residents’ subjective well-being: A case study of Zhuhai City, China. Habitat Int. 2021, 117, 102439. [Google Scholar] [CrossRef]
- Shen, J.; Cheng, J.; Huang, W.; Zeng, F. An Exploration of Spatial and Social Inequalities of Urban Sports Facilities in Nanning City, China. Sustainability 2020, 12, 4353. [Google Scholar] [CrossRef]
- Chen, Y.; Lin, N.; Wu, Y.; Ding, L.; Pang, J.; Lv, T. Spatial equity in the layout of urban public sports facilities in Hangzhou. PLoS ONE 2021, 16, e0256174. [Google Scholar] [CrossRef]
- Tahmasbi, B.; Mansourianfar, M.H.; Haghshenas, H.; Kim, I. Multimodal accessibility-based equity assessment of urban public facilities distribution. Sustain. Cities Soc. 2019, 49, 101633. [Google Scholar] [CrossRef]
- Ni, M.D.; Luo, M.; Chen, Y.F. A Study on Sports Facilities Layout in Open Public Space: Sanjiang District, Ningbo. Planners 2018, 34, 122–127. [Google Scholar]
- Wei, W.; Deng, L. Configuration and Optimization of Community Sports Facilities from the Perspective of ‘Homo Urbanicus’: A Case Study of the Downtown Area of Wuhan. Shanghai Urban Plan. Rev. 2020, 4, 76–83. [Google Scholar]
- Michael, B.E. The role of sport in community capacity building: An examination of sport for development research and practice. Sport Manag. Rev. 2015, 18, 6–19. [Google Scholar]
- Higgs, G.; Langford, M.; Norman, P. Accessibility to sport facilities in Wales: A GIS-based analysis of socio-economic variations in provision. Geoforum 2015, 62, 105–120. [Google Scholar] [CrossRef]
- Ashik, F.; Mim, S.; Neema, M.A. Spatial Accessibility Based Approach for the Assessment of Spatial Equity of Urban Facilities Over Time. In Proceedings of the 1st International Conference on Urban and Regional Planning, Dhaka, Bangladesh, January 2020. [Google Scholar]
- Chen, Y.J.; Lv, T.H.; Pang, J.; Wu, Y.Y. Research on the Allocation Performance of Community Public Sports Facilities Based on the “4E” Model: A Case Study of Hangzhou. J. Guangzhou Sport Univ. 2021, 41, 9–13. [Google Scholar]
- Wang, A.; Ho, D.C.W.; Lai, L.W.C.; Chau, K.W. Public preferences for government supply of public open space: A neo-institutional economic and lifecycle governance perspective. Cities 2023, 141, 104463. [Google Scholar] [CrossRef]
- Zhang, Y.; Yi Ming, Y.; Shi, B. Spatial distribution characteristics and causes of public sports venues in China. Sci. Rep. 2023, 13, 15056. [Google Scholar] [CrossRef] [PubMed]
- Pontin, F.L.; Jenneson, V.L.; Morris, M.A.; Clarke, G.P.; Lomax, N.M. Objectively measuring the association between the built environment and physical activity: A systematic review and reporting framework. Int. J. Behav. Nutr. Phys. Act. 2022, 19, 119. [Google Scholar] [CrossRef] [PubMed]
- Elmose-Østerlund, K.; Iversen, E.B. Do public subsidies and facility coverage matter for voluntary sports clubs? Sport Manag. Rev. 2020, 23, 315–329. [Google Scholar] [CrossRef]
- Kim, H.; Hino, K.; Asami, Y.; Kondo, N. Neighborhood effect of geographical distribution of urban facilities on older adults’ participation in hobby and sports groups. Cities 2022, 131, 103903. [Google Scholar] [CrossRef]
- Wang, J.N.; Li, J.W.; Cheng, J.Q. Spatial Disparity of Sports Infrastructure Development and Urbanization Determinants in China: Evidence from the Sixth National Sports Venues Census. Appl. Spat. Anal. Policy 2023, 17, 573–598. [Google Scholar] [CrossRef]
- Liu, Y.; Wang, H.; Sun, C.; Wu, H. Equity Measurement of Public Sports Space in Central Urban Areas Based on Residential Scale Data. Int. J. Environ. Res. Public Health 2022, 19, 3104. [Google Scholar] [CrossRef] [PubMed]
- Wang, Z.R. Study on Layout Planning of Community Sports Facilities Based on Location-Allocation Model. Master’s Thesis, Chengdu University of Technology, Chengdu, China, 2020. [Google Scholar]
- Xiong, H.M. Research on the Spatial Structure of Sports Venue Resources and Residents’ Sports Activities in Downtown Area of Dali City, Yunnan. Master’s Thesis, Yunnan Normal University, Kunming, China, 2002. [Google Scholar]
- Liu, S.S. GIS-Based Spatial Characterization of Urban Public Sports Venues. Master’s Thesis, Chengdu Sport University, Chengdu, China, 2014. [Google Scholar]
- You, M.L.; Yang, J. Problems and Countermeasures of Youth Sport Spaces Development in Central Urban of Mega-City Based on GIS—A Case Study of Jiang’an District in Wuhan. J. Xi’an Phys. Educ. Univ. 2020, 37, 44–50. [Google Scholar]
- Jiang, L.; Zhang, Y.Y.; Yang, L.H.; Li, P. A Study on the Spatial-Temporal Evolution and Spillover Effects of Youth Public Sports Resource Allocation in China—A Spatial Durbin Model Analysis Based on Inter-Provincial Panel Data. World Geogr. Res. 2023, 33, 167–182. Available online: http://kns.cnki.net/kcms/detail/31.1626.P.20231117.0933.004.html (accessed on 12 December 2023).
- Kumar, H.; Manoli, A.E.; Hodgkinson, I.R.; Downward, P. Sport participation: From policy, through facilities, to users’ health, well-being, and social capital. Sport Manag. Rev. 2018, 21, 549–562. [Google Scholar] [CrossRef]
- Liu, H.Z. A Study on the Architectural Design Strategy of Civic Gymnasium in the Context of National Fitness Program. Master’s Thesis, Qingdao University of Technology, Qingdao, China, 2022. [Google Scholar] [CrossRef]
- Nanjing Municipal People’s Government. Nanjing National Fitness Implementation Plan. Available online: https://www.nanjing.gov.cn/xxgkn/zfgb/202203/t20220328_3328578.html (accessed on 28 January 2022).
- The State Council. Notice of the State Council on Issuing the National Fitness Plan (2021–2025). Available online: http://www.gov.cn/zhengce/content/2021-08/03/content_5629218.htm (accessed on 18 July 2021).
- Qiao, Y.N. A Study on the Whole Age Sharing Strategy of Leisure Activity Space in Existing Residential Areas of Xi’an City from the Perspective of Temporal and Spatial Behavior: Taking Residential Areas of Railway Bureau as an Example. Master’s Thesis, Xi’an University of Architecture and Technology, Xi’an, China, 2020. [Google Scholar]
- Shan, X.G. Research on Evaluation System of Public Service Facilities in Residential Areas Based on Decision Tree Analysis. Master’s Thesis, Hefei University of Technology, Hefei, China, 2014. [Google Scholar]
- Zhou, X.Y. Study on the Evolution of Spatial and Temporal Divergence Patterns of Per Capita Park Green Space Area in Chinese Municipalities. Master’s Thesis, Suzhou University of Science and Technology, Suzhou, China, 2020. [Google Scholar]
- Samjhana, S.; Yan, K.; Frédérique, T. Spatial access to sport facilities from the multiple places visited and sport practice: Assessing and correcting biases related to selective daily mobility. Soc. Sci. Med. 2019, 236, 112406. [Google Scholar]
- Zhang, C.N.; Li, L.L. Construction, and application of Evaluation system of daily outdoor leisure sport space. J. Harbin Inst. Technol. 2017, 49, 173–178. [Google Scholar]
- Takagi, D.; Kondo, N.; Tsuji, T.; Kondo, K. Parks/sports facilities in local communities and the onset of functional disability among older adults in Japan: The J-shaped spatial spillover effects. Health Place 2022, 75, 102801. [Google Scholar] [CrossRef]
- Wu, J.S.; Qian, Y.; Wang, H.L.; Zhu, H.Z.; Wang, H. Research on the supply, demand and influencing factors of public sports facilities in Shenzhen. Acta Sci. Nat. Univ. Pekin. 2022, 58, 1101–1110. [Google Scholar]
- Veitch, J.; Salmon, J.; Abbott, G.; Timperio, A.; Sahlqvist, S. Understanding the impact of the installation of outdoor fitness equipment and a multi-sports court on park visitation and park-based physical activity: A natural experiment. Health Place 2021, 71, 102662. [Google Scholar] [CrossRef]
- Meng, W. Evaluation on the Suitability of Urban Parks and Green Spaces for Leisure and Recreation from the Perspective of Health. Master’s Thesis, Zhejiang A&F University, Hangzhou, China, 2021. [Google Scholar] [CrossRef]
- Luo, H.Y. Accessibility Analysis of Urban Park Sports Space Based on Space Syntax and GIS. Bull. Sport Sci. Technol. 2021, 29, 132–137. [Google Scholar] [CrossRef]
- Rimmer, J.H.; Padalabalanarayanan, S.; Malone, L.A.; Mehta, T. Fitness facilities still lack accessibility for people with disabilities. Disabil. Health J. 2017, 10, 214–221. [Google Scholar] [CrossRef] [PubMed]
- Luo, C.; Yu, H.; Liu, Y.; Yang, W. Supply and demand assessment of physical activity services provided by urban green spaces: A case study of Chongqing, China. Urban For. Urban Green. 2024, 95, 128315. [Google Scholar] [CrossRef]
- Marcos-Pardo, P.J.; Espeso-García, A.; Abelleira-Lamela, T.; Machado, D.R.L. Optimizing outdoor fitness equipment training for older adults: Benefits and future directions for healthy aging. Exp. Gerontol. 2023, 181, 112279. [Google Scholar] [CrossRef] [PubMed]
Disclaimer/Publisher’s Note: The statements, opinions and data contained in all publications are solely those of the individual author(s) and contributor(s) and not of MDPI and/or the editor(s). MDPI and/or the editor(s) disclaim responsibility for any injury to people or property resulting from any ideas, methods, instructions or products referred to in the content. |
© 2025 by the authors. Licensee MDPI, Basel, Switzerland. This article is an open access article distributed under the terms and conditions of the Creative Commons Attribution (CC BY) license (https://creativecommons.org/licenses/by/4.0/).