Article

Spatiotemporal Evolution Characteristics and Influencing Factors of Cross-Regional Tourism Corridors: A Tourism Geography Perspective

1
School of Geography and Tourism, Anhui Normal University, Wuhu 241003, China
2
School of Forestry and Landscape Architecture, Anhui Agricultural University, Hefei 230036, China
*
Author to whom correspondence should be addressed.
Sustainability 2025, 17(3), 1126; https://doi.org/10.3390/su17031126
Submission received: 18 December 2024 / Revised: 26 January 2025 / Accepted: 28 January 2025 / Published: 30 January 2025

Abstract

:
Against the backdrop of rapid global urbanization, studying the spatiotemporal evolution of cross-regional tourism corridors can effectively guide decision-making for sustainable tourism development. However, previous studies have overlooked the role of geographical space in the construction of tourism corridors, particularly the spatiotemporal characteristics of ecological and socio-economic factors. Taking the central region of the Yangtze River Delta (YRD) in China as a case study, this research utilizes remote sensing images, POI data, and other datasets from 2000, 2010, and 2020. Through a combination of landscape value assessment, resistance surface evaluation system, MCR model, and geographical detector, the study examines the spatiotemporal evolution characteristics of cross-regional tourism corridors and their potential influencing factors. The results indicate that (1) between 2000 and 2020, the areas with prominent landscape value in the core region of the YRD decreased, while areas with less prominent landscape value significantly increased. However, the overall distribution became increasingly fragmented. The resistance values in the main low-resistance areas of the study region continuously increased, and the gap between high- and low-resistance areas narrowed. (2) Over the 20-year period, the total length of the corridors in the study area increased by 333.3%, with the number of corridors rising from 91 to 435. The number of source points grew from 14 to 31, and corridor density increased from 0.04% to 0.19%. The growth rate was fastest from 2000 to 2010 and then gradually slowed down. (3) In terms of influencing factors, population density and road length together explained 62.3% of the variation in corridor length evolution. The evolution of corridor number and source points was mainly influenced by public infrastructure levels and road density, while the evolution of corridor density was primarily driven by road length and public infrastructure. In conclusion, we analyze the spatiotemporal evolution characteristics and influencing factors of cross-regional tourism corridors from the perspective of tourism geography at multiple scales. The findings provide significant insights into promoting the integration of cross-regional tourism resources, achieving sustainable development of all-region tourism, and optimizing the spatial allocation of territorial resources.

1. Introduction

With the acceleration of global urbanization, the excessive concentration of population in urban areas has exerted immense pressure on land use and regional economies [1]. To address these challenges and improve both living environments and sustainable economic development, there has been rapid growth in the development of greenways, scenic byways, and cultural heritage corridors. These initiatives provide the most direct solutions for achieving multifunctional landscape planning [2]. For example, the United States developed the National Scenic Byways Program to integrate cultural and aesthetic values into regional development, while Europe has established transnational cultural routes such as the Viking Routes to strengthen cultural connectivity and sustainable tourism [3]. These practices demonstrate how tourism corridors can balance urbanization pressures and regional sustainability goals. As a unique form of linear space, cross-regional tourism corridors consist of a “point-axis” spatial structure formed by tourism resource nodes (tourist attractions of various levels) and existing transportation routes [4]. Since the 1990s, significant attention has been paid domestically and internationally to the development of cross-regional tourism corridors as a means of promoting resource integration and spatial optimization. With the advancement of the Belt and Road Initiative and the successful inscription of the Silk Road and the Grand Canal as UNESCO World Heritage Sites, tourism corridors have increasingly attracted attention from various sectors of society [5]. Therefore, the construction of tourism corridors and urban development are mutually reinforcing. Studying the spatiotemporal evolution characteristics of tourism corridors and their potential influencing factors is of great significance for the sustainable development and planning of urban spatial resources.
Tourism corridors are linear landscape systems built upon transportation routes that facilitate human movement and the flow of goods, integrating natural and cultural landscapes as foundational elements for tourism development [6]. The concept emerged in the 20th century and has evolved through several stages, reflecting the growing emphasis on landscape connectivity and sustainable planning. In the 1930s, the United States was the first to designate certain roads with cultural and aesthetic value as scenic byways [7]. By the mid-20th century, Europe introduced a number of iconic scenic routes, such as Germany’s Castle Road and Romantic Road [8,9]. In the 1960s, growing concerns over the environmental impact of industrialization prompted scholars to prioritize ecological conservation. The concept of greenways was introduced as a strategy for preserving ecological resources [10,11,12]. In 1976, the Scenic and Recreational Roads Act was enacted, providing a legal framework for the standardized development of scenic byways [13]. This marked a shift in focus toward the connection and preservation of landscape features [14,15,16,17]. In the 1980s, as efforts to protect large-scale linear cultural landscapes gained momentum in the United States, scholars expanded their focus from scenic roads to the preservation and development of cultural heritage along these routes, leading to the concept of heritage corridors [4,18,19]. In Europe, similar ideas emerged under the banner of cultural routes, exemplified by paths like the St. Olav Ways and Camino de Santiago, promoting cross-border heritage preservation and tourism collaboration [20,21,22]. In recent years, global scholars have conducted extensive research on tourism corridors, addressing their cultural, ecological, and socio-economic implications. For example, some scholars have further enriched the concept of cultural routes [23,24]. When combined with tourism corridors, these routes are seen as linear landscape systems that integrate both natural and cultural resources. Research on cultural heritage corridors emphasizes their role in preserving intangible cultural heritage, promoting regional branding, and driving economic development. In this context, regional branding strategies play a crucial role in enhancing the global recognition of cultural routes [25,26,27]. Similarly, interdisciplinary research has explored the coupling of corridor functions with biodiversity conservation, using spatial models to optimize their ecological connectivity [28]. Research in the socio-economic aspect has concentrated on the impact of corridors on regional economic development and the improvement of tourist experiences, proposing optimization plans based on visual analysis and cultural functions [29,30]. Additionally, advancements in geospatial technologies have enabled the simulation of spatiotemporal dynamics, revealing the spatiotemporal dynamics of corridors and their application in the optimization of territorial space through model simulation, providing new insights into corridor planning and management across multiple scales [31,32,33].
Unlike general tourism corridors, cross-regional tourism corridors typically connect neighboring urban clusters or entire metropolitan areas, making them a crucial component in the construction of territorial spatial planning systems [34]. Geographically, the term “region” generally refers to a finite and contiguous spatial area defined by specific criteria, while “cross-regional” broadly refers to crossing two or more administrative regions or natural ecological boundaries delineated for ecological protection. Narrowly, it refers to crossing two or more major functional zones designated by national policies [35,36]. Previous studies on tourism corridors have primarily focused on single time points [37] and single-scale analyses [38]. However, findings from single-scale studies often lack cross-scale applicability, being valid only at specific scales and potentially biased or non-generalizable to other contexts [39]. This limits their extrapolative value [40,41]. To address this gap, we investigate cross-regional tourism corridors and explore their multi-scale spatiotemporal dynamics. Such an approach not only enhances spatial applicability but also accounts for the synergistic effects of heterogeneous landscape elements across different regions, offering significant insights into regional geography and sustainable tourism development. China’s Yangtze River Delta (YRD) core area is globally recognized as one of the six major urban agglomerations, known for being one of the most economically advanced and urbanized delta regions in the world [42]. The YRD Economic Zone was officially established in 1992, marking the beginning of an era of integrated development. In 2008, China’s State Council issued policies to coordinate infrastructure development within the region and create a unified and open market system. The national strategy for YRD regional integration entered a phase of accelerated implementation in 2019 [43], and by 2023, its GDP accounted for 3.6% of the global total [44]. Compared to other rapidly urbanizing regions in China, such as the Pearl River Delta and the Beijing–Tianjin–Hebei region, which focus primarily on industrial and trade cooperation, the YRD core area exhibits a higher degree of industrial integration. This makes it an ideal case for studying the evolution of cross-regional tourism corridors, with broader implications for other regions.
Our study takes the YRD core area as an example to construct an evaluation system based on landscape value and resistance surfaces. Using ecological and social data from 2000, 2010, and 2020, it simulates cross-regional tourism corridors to reveal the evolution patterns of high-value tourism areas and their influencing factors more precisely. The findings are expected to provide valuable insights for integrating cross-regional tourism resources, promoting sustainable development of holistic tourism, and optimizing territorial spatial planning. The primary objectives of our study are as follows: (1) to develop an evaluation framework for assessing the landscape value and resistance surface of inter-regional tourism corridors and simulate an inter-regional tourism corridor network based on the evaluation results; (2) to conduct a multi-scale analysis of the spatiotemporal evolution characteristics of inter-regional tourism corridors, focusing on the number, length, density, and source points of the corridors based on the constructed network; and (3) to explore the potential driving factors underlying the spatiotemporal evolution of inter-regional tourism corridors using the Geodetector method and propose corresponding strategies and recommendations.

2. Materials and Methods

2.1. Study Area

We selected the central region of the Yangtze River Delta in China as the research area for cross-regional tourism corridors, enabling a more intuitive multi-scalar analysis at the provincial and municipal levels to reflect the spatiotemporal evolution of corridors in rapidly urbanizing areas. The central Yangtze River Delta, located in East China (Figure 1), encompasses parts of Shanghai, Jiangsu Province, Zhejiang Province, and Anhui Province, with a total area of 358,000 km2 and a permanent population of 227 million. Geographically, the central Yangtze River Delta is adjacent to the Yangtze River and the East China Sea, characterized by a terrain that slopes from higher elevations in the southwest to lower elevations in the northeast, spanning latitudes 28°45′ to 33°25′ N and longitudes 118°20′ to 123°25′12″ E. This region centers around 27 cities, including Nanjing, Hangzhou, and Wuhu, driving high-quality development across the Yangtze River Delta. It is also home to numerous UNESCO World Heritage Sites, such as the Ming Xiaoling Mausoleum in Nanjing, the Humble Administrator’s Garden in Suzhou, and West Lake in Hangzhou.

2.2. Data Sources and Preprocessing

To investigate the spatiotemporal evolution characteristics of inter-regional tourism corridors in the Yangtze River Delta of China, our study integrates ecological–geographical and socio-economic datasets and identifies three critical time points to elucidate their interrelationships. The ecological–geographical datasets include land use, terrain elevation, and vegetation coverage data, while the socio-economic datasets encompass POI data, road transportation, and GDP information. Additionally, administrative boundary vector maps at the provincial and municipal levels within the Yangtze River Delta core area were obtained from the Resource and Environment Science and Data Center of the Chinese Academy of Sciences (Table 1) [45]. Land use and vegetation coverage data for 2000, 2010, and 2020 were classified into six categories—cropland, forest, grassland, water bodies, built-up land, and unused land—based on the Chinese Land Use/Land Cover Remote Sensing Detection Data Classification System. Due to the fact that the data in this study were obtained from various sources, some of the data exhibit varying resolutions. This study utilized ArcGIS 10.8 to display partition statistical sampling down to a 30-m fishing net grid. The selection of the research years for data is based on the key policy implementation time points mentioned in the introduction, specifically for the YRD region. However, since elevation data and administrative boundary data did not change across the three years, only the most recent year’s data were used in the subsequent calculations. Notably, land use, terrain elevation, and road transportation data were clipped to the study area using ArcGIS 10.8. Slope and aspect data were derived from the clipped elevation data using the Slope and Aspect tools in ArcGIS, respectively.
To analyze the influencing factors of inter-regional tourism corridors, the study enhanced the original transportation dataset by incorporating road length and road density metrics. Moreover, GDP and population data were newly added. Urban economic density was calculated as the ratio of regional GDP to the regional area, while the proportion of the secondary industry in GDP was used to represent industrial structure. Public facility levels were measured as the ratio of fixed asset investment to GDP.

2.3. Methodology

This study consists of four main steps. Firstly, data collection and preprocessing; secondly, simulation of the inter-regional tourism corridor network; then, investigation of the factors influencing the evolution of inter-regional tourism corridors; and finally, result analysis and discussion (Figure 2).

2.3.1. Construction of the Evaluation System for Inter-Regional Tourism Corridors

  • Construction of the Landscape Value Evaluation System
The purpose of landscape value evaluation is to analyze and quantify the degree to which ecological and topographic elements within a specific region support the construction of cross-regional tourism corridors [46,47,48]. In order to evaluate the value of a landscape more comprehensively, according to the planning objectives and construction characteristics of cross-regional tourism corridors, five criterion layers were selected: vegetation density, land use, elevation, slope, and aspect, and the evaluation system was structured according to the target layer, criterion layer, and index layer [49] (Table 2).
In terms of ecological value, vegetation density reflects the greening and ecological quality of an area, while land use indicates the current utilization of land and its tourism potential. Regarding topographical value, slope affects terrain walkability and visual appeal, elevation largely determines the visibility of scenic landscapes and attractions, and aspect influences environmental factors (i.e., sunlight and wind direction). The calculated results provide the natural environmental factors for the subsequent resistance surface.
  • Resistance Surface Evaluation System Construction
In the process of tourist movement between tourism resource points, resistance factors form what is known as the resistance surface, which significantly influences tourist flow and satisfaction [50]. Based on a comprehensive assessment of the current situation in the central region of the YRD, our study selects two primary resistance factors, namely, transport accessibility (distance from national roads and provincial roads) and landscape resource characteristics (distance from primary, secondary, and tertiary resource points and landscape value). For an accurate assessment of the route selection for cross-regional tourism corridors, we establish a resistance evaluation model and employ a hierarchical assignment approach (as shown in Table 2).
Firstly, by reviewing and synthesizing previous research on resistance surface evaluation, we identify transportation accessibility as a key resistance factor in the construction of tourism corridors [51]. Higher transportation accessibility, meaning closer proximity to roads, facilitates the connectivity of cross-regional tourism corridors, making destinations more accessible and positively contributing to the development of the tourism corridor. This includes national highways, provincial roads, and urban roads at various levels, where national highways serve a broader area compared to provincial roads to some extent [52]. Furthermore, determining the starting point or “source” is a crucial step in the planning of cross-regional tourism corridors [53]. The source is typically an important node that attracts tourists, and national-level scenic areas, as nationally representative tourist attractions [54], can enhance the connectivity of various nodes and moderate cultural diffusion. Based on selecting national-level scenic areas as the source, our study classifies these tourist attractions into different levels and systematically considers their influence on the corridor network. The specific grading standards are as follows. Level 1 Resource Points: simultaneously recognized as a 5A-level scenic area in China and a national-level scenic area; Level 2 Resource Points: 5A-level scenic area in China; Level 3 Resource Points: 4A-level and below scenic areas in China. Finally, to present the evaluation results more intuitively while maintaining overall coherence and systematic structure, the natural breaks method is used to divide the value landscape evaluation results into three levels: prominent areas, notable areas, and moderate areas. The zoning results fully consider factors such as vegetation coverage, land use status, and topography, serving as an important basis for evaluating the tourism value in the central region of China’s Yangtze River Delta.

2.3.2. Analytic Hierarchy Process

Our study employs the Analytic Hierarchy Process (AHP) to construct judgment matrices through pairwise comparisons of the evaluation indicators for landscape value and resistance surface. Expert scoring is used to quantify the relative importance of each indicator. Yaahp software V.10 is then used to calculate the weights and perform consistency checks. If the consistency index is less than or equal to 0.1, it generally indicates that the matrix results are within an acceptable range. However, if the index exceeds 0.1, adjustments to the evaluation results are required. In our study, the results of the judgment matrices for both the landscape value evaluation system and the resistance surface evaluation system were all below the threshold, achieving satisfactory consistency. Therefore, the weights of each factor in the indicator hierarchy can be determined. Finally, the relative weights of factors in the indicator layer are multiplied by the weights in the standard layer to derive the composite weights for each factor (as shown in Table 2).
Each individual evaluation result of the indicators needs to be standardized to eliminate the influence of differing units, ensuring comparability across the various indicators. After standardization, the score for each indicator is multiplied by its corresponding weight, and the sum of these products yields the comprehensive landscape value score for each region. The calculation formula is as follows:
S = i = 1 m w i l i
where S represents the final score of the Landscape Value Assessment (LVA) for environmental resources; wi is the weight of each indicator, ui is the score for each indicator, i is the index for evaluating environmental resources (topographical conditions), and m is the total number of environmental resource (topographical condition) evaluation indicators. To more intuitively present the evaluation results while maintaining overall consistency and systematic representation, this study uses the natural breaks method to classify the landscape value results into three levels.

2.3.3. MCR Model

The minimum cumulative resistance (MCR) model refers to the model that calculates the least cost of overcoming resistance during the movement of entity A from its source to its destination. It consists of three components: the source, the resistance surface, and the resistance coefficient [55]:
M C R = f m i n ( H i j × R i )
In the formula, M C R represents the minimum cumulative resistance value of the inter-regional tourism corridor, f is the positive correlation function between the minimum cumulative resistance and variable ( H i j × R i ) ; H i j denotes the spatial distance from the source to a specific point passing through a particular unit; R i is the resistance of a unit to the diffusion direction of source i ; and m i n represents the minimum cumulative resistance from unit i to any source j . The smaller the value of M C R , the easier the expansion of source j .
This method optimizes the path based on the overall cost of constructing a cross-regional tourism corridor, considering various cost factors from the specified source to the target area, ensuring the economic viability and feasibility of the path. Here, the cost distance tool in ArcGIS 10.8 software was used to evaluate the cost distance from the source point to any given point [56]. Then, the cost back-linking technique was applied to trace the direction of the minimum cost path, determining the actual route from any point to the source. Finally, the cost path tool was used to identify the optimal tourism corridor path.

2.3.4. Geodetector

To quantify the influencing factors of the cross-regional tourism corridor’s evolution, this study employs the Geographical Detector model, which is a variance-based spatial statistical model [57]. The choice to use the Geographical Detector to analyze the factors affecting corridor characteristics is based on several reasons. First, as a linear model, it is not affected by multicollinearity issues [58]. Second, unlike traditional regression models, it can separately quantify the impact of individual factors and the interactive effects between pairs of factors, making it well-suited for small sample studies [59]. Currently, this model has been widely applied in related research within the field of landscape ecology and has demonstrated its validity [60,61]. In this study, we utilize two sub-models.
First, the Factor Detector is used to assess the independent explanatory power (q value) of each influencing factor on the corridor characteristics. The q value ranges from 0 to 1, with higher values indicating stronger explanatory power; a detailed calculation formula is as follows:
q = 1 h = 1 L N h σ h 2 N σ 2 = 1 S S W S S T
S S W = h = 1 L N i σ h 2
S S T = N σ 2
In the formula, SSW and SST represent the total variance within the region and the overall variance for the entire area, respectively. h = 1, 2, …, L denotes the stratification of the dependent variable factors; N and Nh are the total number of units in the entire area and in the stratum; σ 2 and σ h 2 are the variances of the dependent variable for the entire area and for the stratum.
Second, the Interaction Detector is employed to assess the interactive explanatory power of each pair of influencing factors on the corridor characteristics. By comparing the independent explanatory power of two influencing factors and their interactive explanatory power, the interaction relationship between the two factors is determined. This relationship can be classified into five types (Table 3).
We establish four sets of models for corridor characteristics, including corridor number, corridor length, corridor density, and the number of source points, by applying the geographic detector method. Through a comparative analysis of the model results, the study aims to understand the differences in influencing factors for various corridor characteristics and propose corresponding strategies.

3. Results

3.1. Cross-Regional Tourism Corridor Evaluation System Results

3.1.1. Evaluation Results of Landscape Value

As shown in Figure 3, we analyze the landscape value of cross-regional tourism corridors primarily based on three factors: land use intensity, vegetation coverage, and topographic elevation. The key findings are as follows.
The scores for land use intensity are relatively high (Figure 3a–c), showing a general trend of higher values in the north and lower values in the south, with uneven spatial distribution. However, this disparity has gradually narrowed over the past 20 years. The lowest levels of land use are associated with natural water systems. On a provincial scale, southern Anhui and southern Zhejiang have relatively higher land use indices, predominantly consisting of forested areas. In contrast, northern Zhejiang, northern Anhui, and Jiangsu exhibit lower land use indices, with artificial surfaces, grasslands, and croplands dominating. On a municipal scale, regions influenced by Hefei, Nanjing, and Hangzhou exhibit higher land use classification indices, with construction land covering approximately 21.2 ± 9.52% of the area.
Vegetation coverage is derived from the Normalized Difference Vegetation Index (NDVI) levels based on remote sensing data. At a cross-regional scale within the YRD, the NDVI classification index is slightly higher within areas radiating from major water bodies such as the Yangtze River and Taihu Lake. From 2000 to 2020, the trend of higher vegetation coverage in the south and lower coverage in the north became more pronounced. On a provincial scale, southern regions of Jiangsu along the Yangtze River have higher vegetation coverage, while Anhui Province exhibits relatively lower coverage overall. However, both Anhui and Zhejiang Provinces have shown significant increases in vegetation coverage over the 20-year period, whereas Jiangsu has experienced a continuous decline. Further spatial analysis at the municipal level reveals a strong correlation between vegetation coverage and urbanization intensity. Highly urbanized centers maintain lower NDVI values compared to developing cities.
In terms of topographic characteristics, the elevation and slope classifications are lower in the northern and coastal areas of the research region, while the southern areas feature higher elevations and steeper slopes (Figure 3g–i). Both Anhui and Jiangsu Provinces exhibit relatively high elevation and slope classification levels, while Zhejiang, particularly southern Zhejiang, is predominantly composed of plains and, thus, has lower classification levels. Within Zhejiang, cities such as Wenzhou and Jinhua demonstrate lower elevation and slope classifications.
We utilize the natural breaks method to classify landscape evaluation results, obtaining three levels (high, medium, and low) of environmental resource characteristics and topographical conditions. In terms of environmental resource characteristics, a general trend of higher values in the north and lower values in the south is observed (Figure 4a–c). From 2000 to 2020, most areas in Anhui Province and nearly the entirety of Jiangsu Province exhibited relatively low values, with high-value areas accounting for approximately 21.31% of the total area. In contrast, Zhejiang Province showed generally higher values, with high-value areas covering about 44.3% of its total area. At the municipal scale, cities such as Hefei, Nanjing, and Hangzhou, along with most cities in Jiangsu Province, demonstrated relatively low values (high-value areas = 25.3 ± 0.55%).

3.1.2. Resistance Surface Evaluation Results

The integrated landscape value zoning results, derived through weighted calculations, are classified into three levels based on the natural breaks (Jenks) classification method, which divides the 1–5 scoring range into three categories. Specifically, prominent value refers to areas with the highest scores, representing exceptional landscape prominence and value. Notable value represents areas with moderate scores, indicating significant but not outstanding value. Moderate value includes areas with the lowest scores, reflecting relatively limited landscape prominence and value. The classification aims to reflect natural groupings within the data and ensure meaningful differentiation between the three levels (Figure 5).
According to Table 4, the area of distinct value zones exhibited an overall shrinking trend over the 20-year period. The prominent value zones showed an increasing trend between 2000 and 2010 but experienced a decrease between 2010 and 2020. Meanwhile, the plain value zones expanded significantly, increasing by 1.13 times from 2000 to 2020, with their overall distribution gradually exhibiting a fragmented trend.
By calculating the sub-resistance surface and utilizing the AHP to obtain the composite cost grid, we observed that over the 20-year period from 2000 to 2020, the high values of the cost grid consistently reached 5, while the low values ranged between 1.7032 and 2.1276 (Figure 6). Notably, the resistance values in the primary low-resistance areas have been rising, leading to a diminishing overall difference, which indicates a shift in the overall cost raster values toward higher resistance levels.

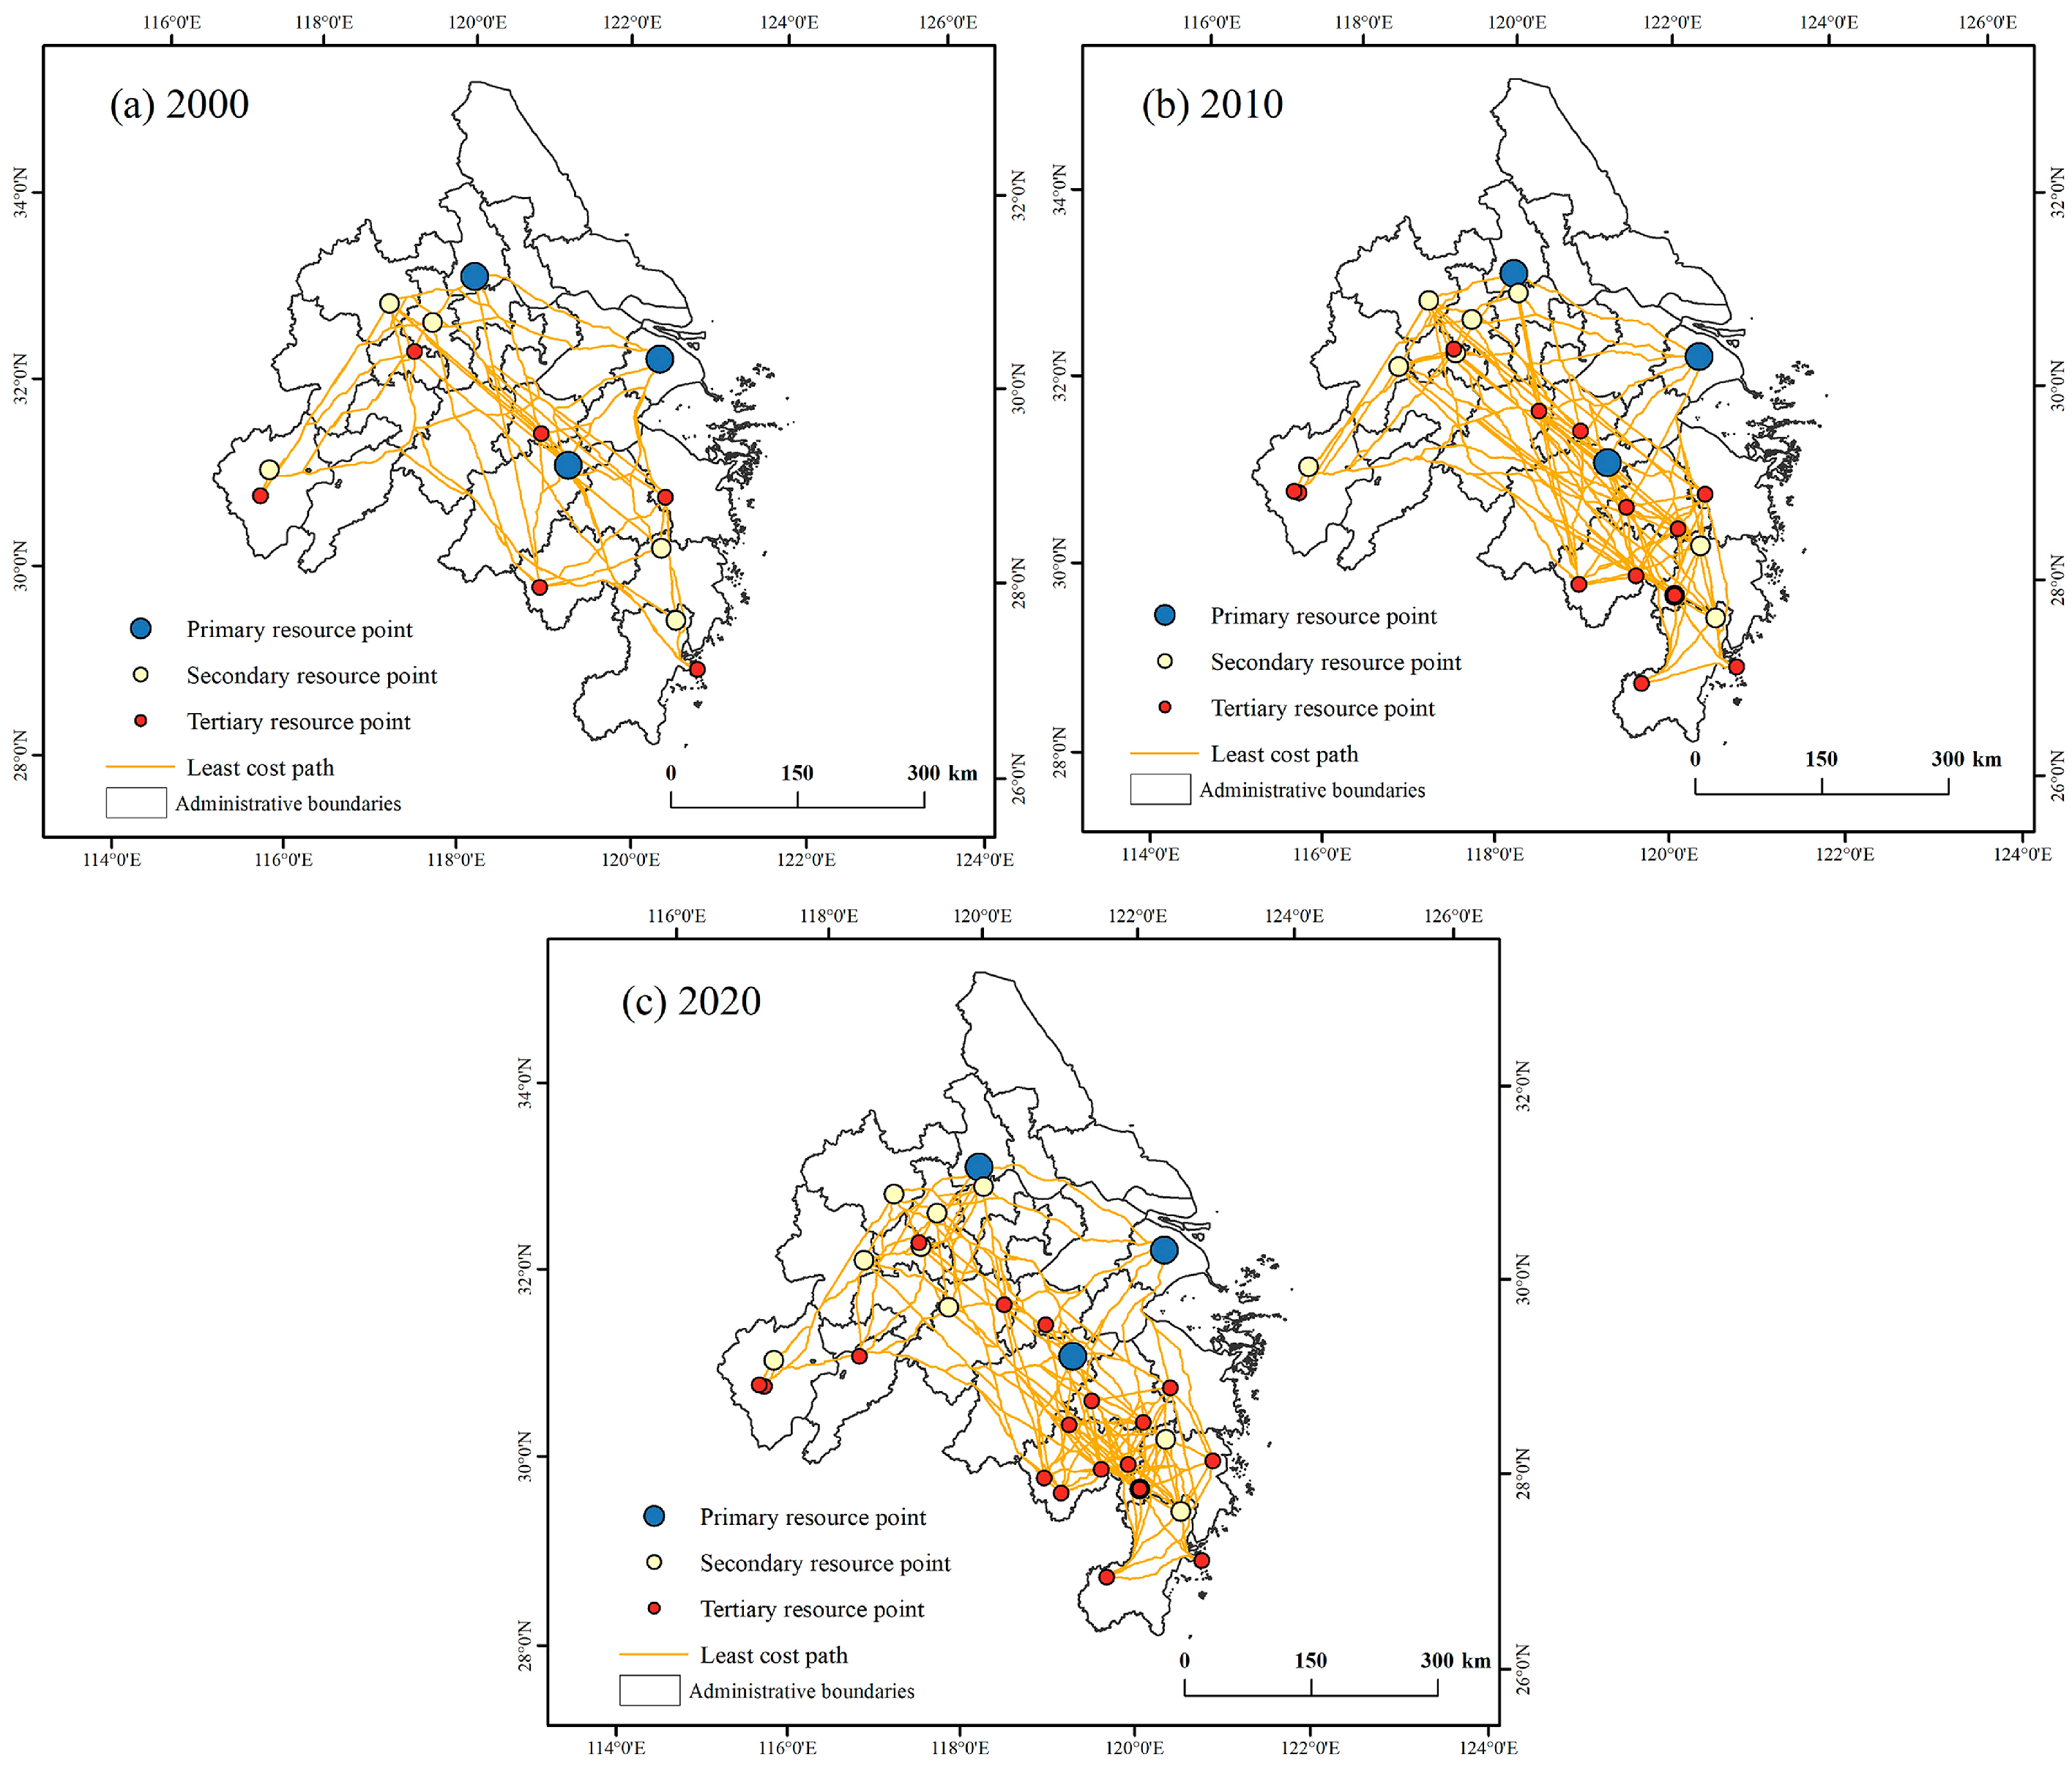
3.2. Simulation of Inter-Regional Tourism Corridor Network

We employ the minimum cumulative resistance model to simulate the least-cost path network for the construction of inter-regional corridors in the central Yangtze River Delta region in 2000, 2010, and 2020 (Figure 7). At the inter-regional scale of the Yangtze River Delta, the number of corridors increased from 91 in 2000 to 435 in 2020, showing an increase of 378.02%. The total length of the corridors grew by more than tenfold, indicating a rising demand for inter-regional communication. The corridor density increased from 0.04% to 0.19%, with the fastest growth occurring between 2000 and 2010, followed by a gradual slowdown. The number of source points rose from 14 in 2000 to 25 in 2010 and further to 31 by 2020. This trend reflects the government’s high enthusiasm for discovering and developing tourism resource points, although overall, resources remain limited, leading to a slower construction pace in the subsequent decade (Table 5).
At the provincial scale, Zhejiang Province has the highest number of source points, and Anhui Province has the fastest growth rate, showing an increase of 150%. Jiangsu Province saw an increase of one source point, while Shanghai showed no increase. The growth rate of corridor numbers was highest in Jiangsu and lowest in Zhejiang. The longest corridor length was found in Zhejiang, with a low growth rate of corridor density. At the municipal scale, the highest number of source points is found in cities such as Jinhua and Taizhou in Zhejiang, which also experienced the fastest growth rates. Jinhua increased from 1 source point in 2000 to 5 in 2020, and Taizhou increased from 1 to 4. However, some cities still have zero source points, including Tongling and Wuhu in Anhui, Changzhou, Nantong, Suzhou, and Taizhou in Jiangsu, and Jiaxing and Zhoushan in Zhejiang. In terms of corridors, the growth rate is uniform across cities, with Hangzhou having the most, which is related to its location in the central Yangtze River Delta region. Regarding corridor density, due to the small administrative area of Ma’anshan, it has the highest corridor density with a total of 99 corridors.

3.3. Factors Influencing the Evolution of Inter-Regional Tourism Corridors

To comprehensively analyze the underlying factors driving the evolution of inter-regional tourism corridors, we select six variables: population density (X1), urban economic density (X2), industrial structure (X3), public facility level (X4), road length (X5), and road density (X6). The evolution of four corridor characteristics—number of corridors, corridor length, corridor density, and number of origin points—are considered dependent variables. Here, we apply geographic detectors to construct four models.

3.3.1. Impact of Individual Factors on Corridor Evolution

The factor detection results are shown in Figure 8, where the model reveals the independent influences of various factors on the evolution of inter-regional tourism corridors. Among them, the level of public facilities and road density significantly impact multiple characteristics of the corridor’s evolution. Specifically, the evolution of corridor number, corridor length, and the number of source points is primarily influenced by road density, with q-values of 0.366, 0.409, and 0.334, respectively. The level of public facilities plays a key role in the evolution of corridor density, followed by road length. The industrial structure has the least influence, similar to the case of corridor number. Notably, for both corridor number and length, in addition to road density, the level of public facilities also plays an important role. Overall, the factors infx1uencing corridor number, corridor length, corridor density, and source points are consistent. The level of public facilities, road length, and road density have significant effects on the evolution of inter-regional tourism corridors, while population density, urban economic density, and industrial structure have less significant impacts.

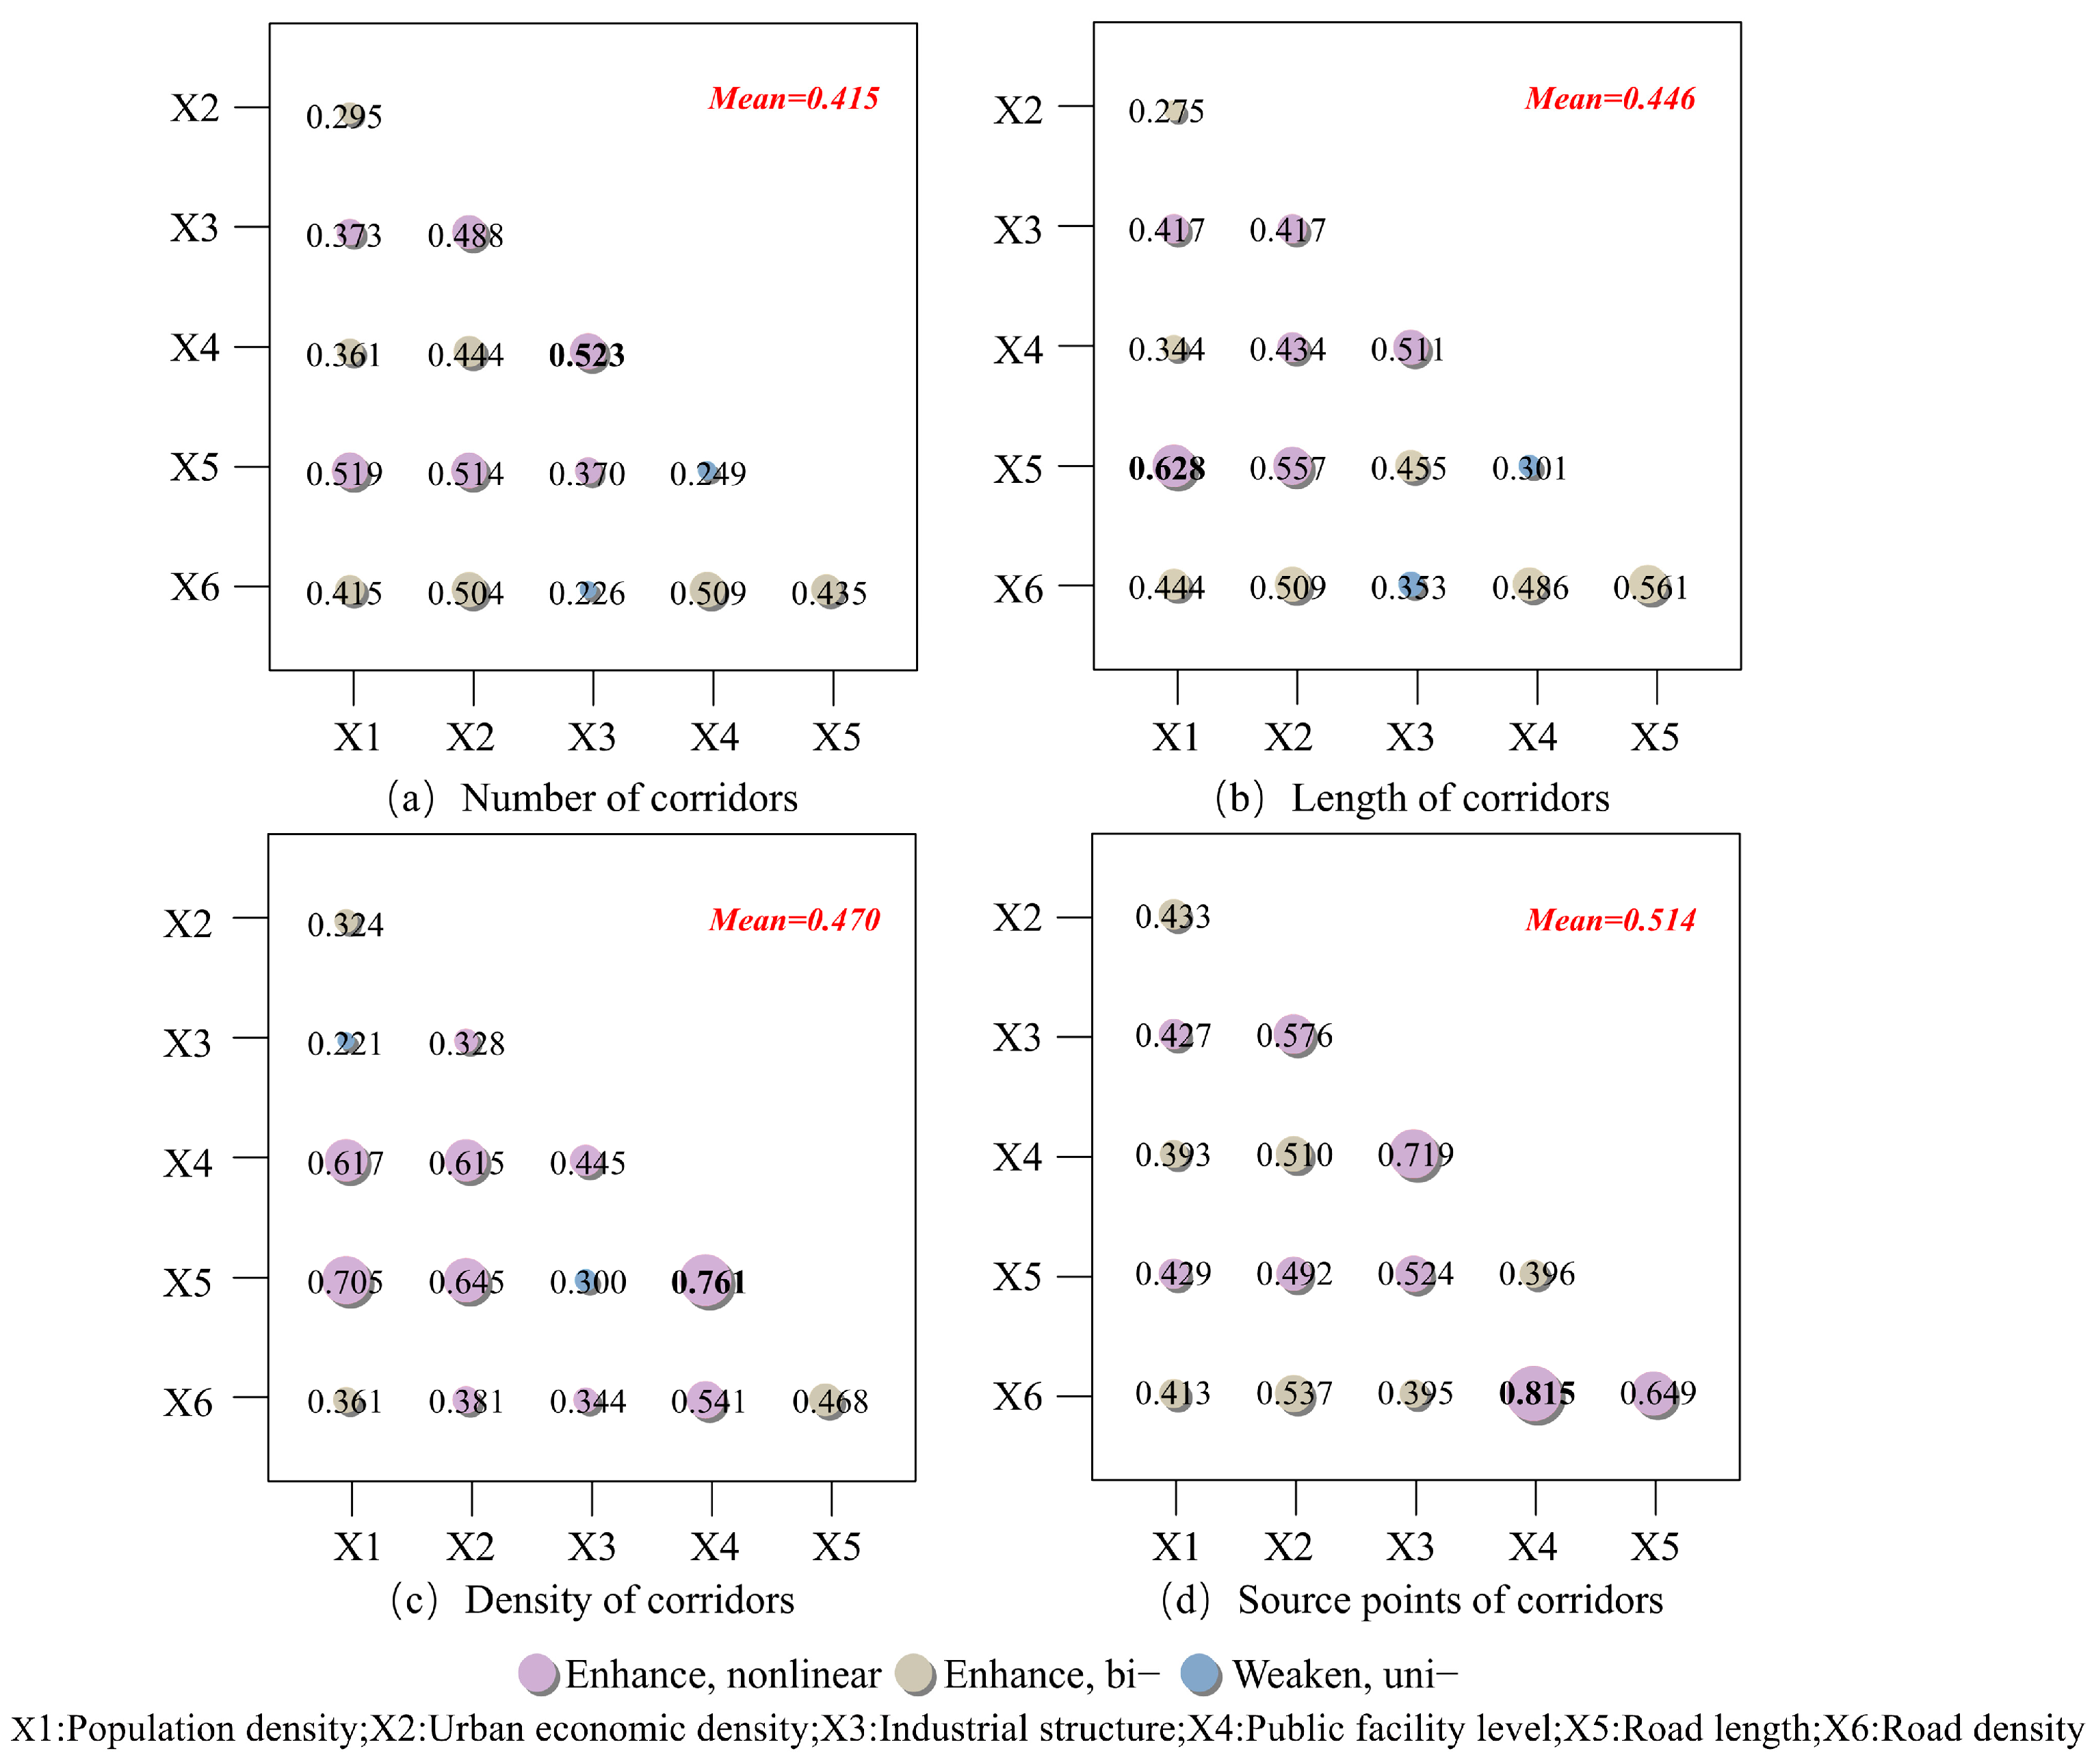
3.3.2. Interaction Effects of Multiple Factors on Corridor Evolution

The interaction detection results are shown in Figure 9 The model reveals the interactive effects of each pair of factors on the evolution of cross-regional tourism corridors. The average interaction q-values across the four sets of models are higher than those of single-factor influences, indicating that the interactive effects of each pair of factors on tourism corridor evolution are significantly stronger than the individual effects of each factor.
In the four interaction analyses, corridor source points are most influenced by the interaction of the six key factors. The average interaction q-value of these interactions reaches 0.514, with each pair of factors exhibiting either bivariate enhancement or nonlinear enhancement on the evolution of the corridor source points. Notably, the interaction between public facility level and road density explains up to 81.5% of the evolution of corridor source points, with an explanatory power of 0.815. The remaining three interaction analyses generally show enhancement effects. The average interaction q-value for corridor quantity analysis is 0.415, with the strongest interaction between industrial structure and public facility level, which has an interaction q-value of 0.523. For corridor length, the average interaction q-value is 0.446, and the interaction between population density and road length, with an interaction q-value of 0.628, explains 62.8% of the evolution of corridor length. In the corridor density analysis, the average interaction q-value is 0.470, with the interaction between public facility level and road length showing the highest explanatory power for corridor source point evolution.

4. Discussion

4.1. Spatiotemporal Characteristics of Cross-Regional Tourism Corridor

Global experience shows that the evolving functions and spatial patterns of tourism corridors often undergo significant changes [62], particularly in the case of cross-regional tourism corridors in China [63]. Existing studies have demonstrated that the increasing multifunctionality of cities drives demand for cross-regional tourism corridors. In turn, improvements in corridor conditions enhance the accessibility between urban clusters, thereby fostering the spatial integration of land resources and accelerating outward urban development [6].
We use the YRD core area of China as an example to analyze the spatiotemporal evolution characteristics of cross-regional tourism corridors. Using data from the years 2000, 2010, and 2020, we simulate and examine the spatiotemporal changes in the region’s cross-regional tourism corridors (Figure 10). Overall, the YRD core area’s cross-regional corridors exhibit a growing trend, with an increase in the number of source points and higher density of path networks. However, the total coverage area of corridors remains relatively stable, as corridor coverage is jointly determined by edge source points and resistance surfaces [64]. This finding aligns with previous research, which suggests that an increase in source points leads to a corresponding growth in corridor numbers [65].
As one of the most economically dynamic regions in China, the YRD region faces relatively high construction costs for tourism corridors. Although tourism resources in the YRD core area are unevenly distributed, the cost differences between regions have gradually decreased over time, closely linked to the region’s urbanization levels [66,67]. Our result found that the densest corridor areas have shifted southwest over the past 20 years, while the central region’s density first increased and then declined. This differs from earlier findings that suggest central corridor areas become denser and expand outward [68]. This variation could be attributed to the relatively flat terrain, dense water networks, and central location of the YRD core area, which facilitates rapid urbanization but also increases the comprehensive resistance value of corridor construction, thereby negatively affecting network development.
At the provincial scale, Zhejiang Province consistently had the highest number of tourism resource points in all three years. Jiangsu Province had the fewest resource points and the slowest growth, with an increase of only 50%, while Shanghai remained limited to a single resource point due to its scale. Although the number of corridors generally increases with the number of resource points, Jiangsu Province, despite having fewer resource points, achieved the highest corridor growth rate—over sevenfold—with predominantly short corridors. This indicates a strong demand for corridor development, likely driven by the high number of cities in the central area. Zhejiang Province accounted for more than 48.5% of the total corridor length each year, with long but sparse corridors, a characteristic heavily influenced by the region’s mountainous terrain, as corridors are distributed along valleys. This finding aligns with previous research conclusions [69,70].
At the municipal scale, Zhejiang and Anhui saw significant growth in tourism resource points, transitioning from none or few to many, while in Jiangsu, only Zhenjiang achieved a breakthrough from “0 to 1”. Most corridors in these regions are concentrated in urban centers. The size of a municipality significantly affects corridor density. For example, Ma’anshan had the highest corridor density in 2020, though not the highest number of corridors that year. Among cities with areas larger than 10,000 km2, only Hangzhou, Xuancheng, Jinhua, and Taizhou achieved corridor densities exceeding 1%, indicating a higher demand for tourism in these areas. Notably, some cities, such as Yancheng and Nantong in Jiangsu, lacked corridor coverage, likely due to their peripheral locations and, more importantly, the absence of tourism resource points.
In summary, due to factors such as geographic conditions, spatial distances, and stages of development, cross-regional tourism corridors in the YRD core area exhibit distinct spatial development characteristics. Employing multi-dimensional indicators and multi-scale research frameworks can more effectively analyze the spatiotemporal characteristics of cross-regional tourism corridors.

4.2. Detection and Analysis of the Factors Influencing the Evolution of Tourism Corridors

In recent years, the rapid expansion of China’s tourism industry has exerted pressure on the environmental and cultural resources it relies on, hindering its sustainable development. However, sustainable tourism plays a critical role in balancing and coordinating the interests of various stakeholders in the process of tourism development [71]. Therefore, finding ways to promote the efficient and sustainable use of resources through tourism activities while meeting economic development needs without compromising the natural and social resources that tourism depends on is of paramount importance [72]. Cross-regional tourism corridors face greater challenges related to land availability and environmental constraints, necessitating more efficient and targeted sustainable development standards [73]. As key linear tools connecting urban clusters, understanding the factors influencing the evolution of these corridors becomes crucial. Quantifying such a complex process, however, is a challenge. Our study establishes a framework composed of tourism corridor indicators and influencing factors, using geographic detectors to quantify the potential drivers of cross-regional tourism corridor evolution. The results reveal that six key indicators jointly influence the evolution of cross-regional tourism corridors to varying degrees. These include the direct impacts of individual factors on corridor evolution and interactions between factors that result in direct or indirect effects. This highlights the complex internal drivers of tourism corridor evolution, necessitating multi-scale and multi-dimensional analysis.
We found that road infrastructure is a significant supporting factor in the formation of tourism corridors, with road density reflecting the level of regional road development and coverage. For instance, Zhejiang Province, rich in mountainous tourism resources, has added 10 scenic areas over the past two decades through resource integration and development. With continuous improvements in road infrastructure, Zhejiang’s share of cross-regional tourism corridors has steadily increased. This demonstrates that increased road density promotes the integration of resource points, enhances tourism accessibility, and optimizes tourism routes [74]. From 2000 to 2020, the permanent population of the study area increased from 87.43 million to 235 million, with rapid population clustering in Jiangsu and Zhejiang provinces [75]. To accommodate this population growth, road length within the study area increased 2.9 times over the two decades, with an additional 26 thousand km of roads built and tourism corridor length increasing 2.33 times. These three indices exhibited positive correlations. Furthermore, recent government policies, such as the creation of “1-2 h transportation circles” and the “integration of basic service facilities”, have effectively driven infrastructure development across regions. These initiatives have promoted the coordinated development of public infrastructure across provinces and cities, including transportation, energy supply, information systems, and living environments. We found in our research that although Nanjing has fewer large-scale tourism resources, its high level of public infrastructure has consistently kept its corridor density above average. This suggests that improved public infrastructure—including enhancements to living environments, supporting tourism facilities, and sanitation systems—plays a significant role in promoting corridor density [76]. Enhancing infrastructure levels has supported the development of cross-regional tourism corridors, improved the accessibility of scenic areas, and ensured essential functions like water supply, flood safety, power, and recreational amenities. These improvements provide a comfortable environment for visitors and contribute to the development of scenic areas [77].
Notably, the results show that population density, urban economic density, and industrial structure have less significant impacts. The insignificant influence of population density may be due to ecological corridor planning relying more on natural geographic conditions and urban planning policies rather than direct population distribution. Moreover, the effect of population density may be overshadowed by other factors, such as land use types and topographic conditions. The negligible impact of urban economic density could result from a lag effect between economic density and corridor planning, which may not be reflected in current cross-sectional data. Similarly, the limited impact of industrial structure may be attributed to the relative homogeneity of local industrial structures within the research area, making significant differences difficult to capture.

5. Conclusions

In this study, cross-regional tourism corridors are examined from the perspective of tourism geography, integrating both ecological and social indicators, which address the limitations of previous research that only considered single-dimensional indicators. A multi-scale analysis of the spatiotemporal evolution characteristics of cross-regional tourism corridors in the core area of the Yangtze River Delta from 2000 to 2020 was conducted, focusing on corridor quantity, length, density, and the number of origin points. The study utilized geographical detectors to explore the potential influencing factors that shape these spatiotemporal characteristics and provided corresponding management recommendations. The results contribute to a more precise understanding of the evolutionary patterns of high-value tourist areas and offer new insights for sustainable tourism planning and geospatial optimization management in rapidly urbanizing regions worldwide. The study reached the following conclusions:
  • Between 2000 and 2020, the areas with prominent landscape value in the core region of the YRD showed a decreasing trend. Prominent areas increased in the first decade; however, they declined in the second decade, while less prominent areas grew significantly, and the overall distribution became increasingly fragmented. The resistance values in the primary low-resistance areas continued to rise, and the gap between high- and low-resistance areas narrowed.
  • Over the 20-year period, the number of corridors, corridor length, corridor density, and resource point quantity all increased to varying degrees across different regions of the YRD. These changes were influenced by factors such as geographic location and economic development. Among the regions, Zhejiang Province saw the largest increase in resource points, Hangzhou experienced the greatest growth in the number of corridors, and Ma’anshan had the highest increase in corridor density.
  • The evolution of the number of corridors and resource points was mainly influenced by public infrastructure levels and road density, with road length having a secondary effect on the number of resource points. Population density and road length together explained the main causes of corridor length evolution, while corridor density evolution was primarily influenced by public infrastructure levels and road length.
Based on relevant planning and the implementation of the regional coordinated development strategy “One-Four-Five” key tasks, future actions should first focus on building tourism spaces that promote high-quality development within planned areas, with classifications for protection and phased development. Second, the construction results of corridors should be further refined by removing homogeneous corridors and categorizing them based on different tourism needs and visitor pressures. Finally, a regular or real-time monitoring and feedback system should be established, where corridor management boundaries are not defined by administrative borders. This will facilitate cross-regional integration of tourism resources, strengthen the construction of cross-regional special tourism functional zones, and encourage differentiated development tailored to local conditions.

Author Contributions

Conceptualization, W.L. and H.T.; methodology, W.L. and H.T.; validation, W.L. and H.T.; writing—original draft preparation, W.L. and X.Y.; writing—review and editing, H.T. and X.Y. All authors have read and agreed to the published version of the manuscript.

Funding

This research was funded by the General Project on Educational and Teaching Reform Research for the Quality Project of New Era Training (Postgraduate Education) in Anhui Province, grant number 2023jyjxggyjY077.

Institutional Review Board Statement

Not applicable.

Informed Consent Statement

Not applicable.

Data Availability Statement

The data for this study are available upon request from the authors.

Conflicts of Interest

The authors declare no conflicts of interest.

References

  1. Sampson, L.; Ettman, C.K.; Galea, S. Urbanization, urbanicity, and depression: A review of the recent global literature. Curr. Opin. Psychiatry 2020, 33, 233–244. [Google Scholar] [CrossRef] [PubMed]
  2. Jiao, G.; Lu, L.; Chen, G.; Huang, Z.; Cirella, G.T.; Yang, X. Spatiotemporal Characteristics and Influencing Factors of Tourism Revenue in the Yangtze River Delta Urban Agglomeration Region during 2001–2019. Sustainability 2021, 13, 3658. [Google Scholar] [CrossRef]
  3. Prokkola, E.K.; Andersen, D.J.; Jakola, F.; Nilson, T.; Svensson, S.M.H. Multilayered Borders as a Method for Studying Tourism Destinations: A Case of Northern European Border Regions. J. Borderl. Stud. 2024, 31, 1–21. [Google Scholar] [CrossRef]
  4. Sun, Y.; Wang, Y.; Liu, L.; Wei, Z.; Li, J.; Cheng, X. Large-scale cultural heritage conservation and utilization based on cultural ecology corridors: A case study of the Dongjiang-Hanjiang River Basin in Guangdong, China. Herit. Sci. 2024, 12, 44. [Google Scholar] [CrossRef]
  5. Chen, Z.; Wang, H. Research on the impact of the Belt and Road Initiative on the sustainability of the resource-based economy of participating countries. Environ. Sci. Pollut. Res. 2022, 29, 91139–91154. [Google Scholar] [CrossRef]
  6. Li, Z.; Ye, S.; Xi, J. Assessing Risks in Cross-Regional Tourism Corridors: A Case Study of Tibetan Plateau Tourism. ISPRS Int. J. Geo-Inf. 2024, 13, 171. [Google Scholar] [CrossRef]
  7. Draper, R.; Petty, K. The National Scenic Byways Program: On the road to recreation. J. Phys. Educ. Recreat. 2001, 72, 27–31. [Google Scholar] [CrossRef]
  8. Hee-Soo, C. A Study on the Direction of Development Theme Road Examined the Case of German Old Castle Road. Acad. Assoc. Glob. Cult. Contents 2014, 14, 21–41. [Google Scholar]
  9. Sipes, J.L.; James, A.P.; Lindley, J.; Campbell, T.; Gragg, R.; Harbert, C. Scenic Byways A Review of Processes, Administration, and Economic Impacts. Transp. Res. Rec. 1997, 1559, 96–103. [Google Scholar] [CrossRef]
  10. Ahern, J. Greenways as a planning strategy. Landsc. Urban Plan. 1995, 33, 131–155. [Google Scholar] [CrossRef]
  11. Searns, R.M. The evolution of greenways as an adaptive urban landscape form. Landsc. Urban Plan. 1995, 33, 65–80. [Google Scholar] [CrossRef]
  12. Conine, A.; Xiang, W.; Young, J.; Whitley, D. Planning for multi-purpose greenways in Concord, North Carolina. Landsc. Urban Plan. 2004, 68, 271–287. [Google Scholar] [CrossRef]
  13. Eby, D.W.; Molnar, L.J. Importance of scenic byways in route choice a survey of driving tourists in the United States. Transport Res. A-POL 2002, 36, 95–106. [Google Scholar] [CrossRef]
  14. Fábos, J.G. Greenway planning in the United States: Its origins and recent case studies. Landsc. Urban Plan. 2004, 68, 321–342. [Google Scholar] [CrossRef]
  15. Asakawa, S.; Yoshida, K.; Yabe, K. Perceptions of urban stream corridors within the greenway system of Sapporo, Japan. Landsc. Urban Plan. 2004, 68, 167–182. [Google Scholar] [CrossRef]
  16. Toccolini, A.; Fumagalli, N.; Senes, G. Greenways planning in Italy: The Lambro River Valley Greenways System. Landsc. Urban Plan. 2006, 76, 98–111. [Google Scholar] [CrossRef]
  17. Perkl, R.M. Geodesigning landscape linkages: Coupling GIS with wildlife corridor design in conservation planning. Landsc. Urban Plan. 2016, 156, 44–58. [Google Scholar] [CrossRef]
  18. Yue, F.; Li, X.; Huang, Q.; Li, D. A Framework for the Construction of a Heritage Corridor System: A Case Study of the Shu Road in China. Remote Sens. 2023, 15, 4650. [Google Scholar] [CrossRef]
  19. Kurdoglu, O.; Kurdoglu, B.C. Determining recreational, scenic, and historical–cultural potentials of landscape features along a segment of the ancient Silk Road using factor analyzing. Environ. Monit. Assess. 2010, 170, 99–116. [Google Scholar] [CrossRef] [PubMed]
  20. Ballard, G.; Reiser, P. The St. Olaf College Fieldhouse Project: A Case Study in Designing to Target Cost. In Proceedings of the 12th Annual Conference of the International Group for Lean Construction, Elsineor, Denmark, 3–5 August 2004. [Google Scholar]
  21. Baker, K.; Verstockt, S. Cultural Heritage Routing: A Recreational Navigation-based Approach in Exploring Cultural Heritage. J. Comput. Cult. Herit. 2017, 10, 1–20. [Google Scholar] [CrossRef]
  22. Dušek, J. The Past, Present, and Future of Cross-Border Cooperation between Municipalities in the South Bohemian Region: A Case Study. Adm. Sci. 2024, 14, 134. [Google Scholar] [CrossRef]
  23. Thiele, J.; Schuckert, U.; Otte, A. Cultural landscapes of Germany are patch-corridor-matrix mosaics for an invasive megaforb. Landsc. Ecol. 2008, 23, 453–465. [Google Scholar] [CrossRef]
  24. Spencer, A. Library and Information Sciences in Arctic and Northern Studies; Springer International Publishing: Berlin/Heidelberg, Germany, 2024. [Google Scholar] [CrossRef]
  25. Qiu, L.; Rahman, A.R.A.; Dolah, M.S.B. The Role of Souvenirs in Enhancing Local Cultural Sustainability: A Systematic Literature Review. Sustainability 2024, 16, 3893. [Google Scholar] [CrossRef]
  26. Lin, Y.-H.; Chen, C.-L. The Service Experience Innovation Model of Cultural Tourism in Historic Districts: A Case Study on Zhongshan Road in Quanzhou, Fujian Province of China. Sustainability 2024, 16, 3567. [Google Scholar] [CrossRef]
  27. Han, Y.; Lin, Z.; Peng, H.; Chen, J.; Peng, D. Public Participation in Architectural Heritage Conservation—The Case of Wooden Arch Corridor Bridge “Qiansheng Bridge”. Sustainability 2024, 16, 1581. [Google Scholar] [CrossRef]
  28. Nagkoulis, N.; Papazekou, M.; Katsanevakis, S.; Mazaris, A. Spatial conservation planning: Proposing clustering methods to improve connectivity protection. Methods Ecol. Evol. 2024. [Google Scholar] [CrossRef]
  29. Zorpas, A.A.; Voukkali, I.; Pedreño, J.N. Tourist area metabolism and its potential to change through a proposed strategic plan in the framework of sustainable development. J. Clean. Prod. 2018, 172, 3609–3620. [Google Scholar] [CrossRef]
  30. Li, Y.; Liao, C.; Li, X.; Guo, R. Understanding regional structure through spatial networks: A simulation optimization framework for exploring balanced development. Habitat. Int. 2024, 152, 103155. [Google Scholar] [CrossRef]
  31. Wu, B.; Bao, Y.; Wang, Z.; Chen, X.; Wei, W. Multi-temporal evaluation and optimization of ecological network in multi-mountainous city. Ecol. Indic. 2023, 146, 109794. [Google Scholar] [CrossRef]
  32. Yang, X.; Chen, X.; Qiao, F.; Che, L.; Pu, L. Layout optimization and multi-scenarios for land use: An empirical study of production-living-ecological space in the Lanzhou-Xining City Cluster, China. Ecol. Indic. 2022, 145, 109577. [Google Scholar] [CrossRef]
  33. Chen, S.; Qiu, J.; Yang, M.; Li, J. A Synergetic Perspective on the Planning of the “City in a Park”: A Case Study of the Sichuan Tianfu New Area, China. Buildings 2024, 14, 1542. [Google Scholar] [CrossRef]
  34. Wang, Z.; Zhao, S. Research on the spatial consistency of tourism resources and environmental carrying capacity and land space function in urban agglomeration in the middle reaches of the Yangtze River. Resour. Environ. Yangtze River Basin 2021, 30, 1027–1039. [Google Scholar]
  35. Ren, Z. Evaluation of the value of cross-regional linear cultural heritage tourism resources: A case study of the Chinese section of Chang’an-Tianshan corridor road network. Sci. Sin. 2017, 37, 1560–1568. [Google Scholar] [CrossRef]
  36. Xie, X.; Shi, P. Dynamic Evolution and Collaborative Development Model of Urban Agglomeration in Hexi Corridor from the Perspective of Economic Flow. Land 2023, 12, 274. [Google Scholar] [CrossRef]
  37. Carlier, J.; Moran, J. Hedgerow typology and condition analysis to inform greenway design in rural landscapes. J. Environ. Manage 2019, 247, 790–803. [Google Scholar] [CrossRef]
  38. Hay, G.J.; Blaschke, T.; Marceau, D.J.; Bouchard, A. A comparison of three image-object methods for the multi-scale analysis of landscape structure. ISPRS J. Photogramm. Remote Sens. 2003, 57, 327–345. [Google Scholar] [CrossRef]
  39. Li, X.; Zhang, J.; Yu, W.; Liu, L.; Wang, W.; Cui, Z.; Wang, R.; Li, Y. How Landscape Patterns Affect River Water Quality Spatially and Temporally: A Multi-scale Geographically Weighted Regression Approach. J. Environ. Inform. 2023, 42. [Google Scholar] [CrossRef]
  40. Vogt, P.; Riitters, K.H.; Iwanowski, M.; Estreguil, C.; Kozak, J.; Soille, P. Mapping landscape corridors. Ecol. Indic. 2007, 7, 481–488. [Google Scholar] [CrossRef]
  41. Díaz-Varela, E.; Álvarez-López, C.J.; Marey-Pérez, M.F. Multi-scale delineation of landscape planning units based on spatial variation of land-use patterns in Galicia, NW Spain. Landsc. Ecol. Eng. 2008, 5, 1–10. [Google Scholar] [CrossRef]
  42. Institute of Urban Science, Shanghai Jiaotong University. China Urban Agglomeration Development Report 2014; Oriental Publishing Center: Shanghai, China, 2015. [Google Scholar]
  43. Chen, W.; Lan, M.; Sun, W.; Liu, W.; Liu, C. Integrated high-quality development of the Yangtze River Delta: Connotation, current situation and countermeasures. Econ. Geogr. 2021, 41, 127–134. [Google Scholar] [CrossRef]
  44. Bi, X.; Ning, Y. Spatial econometric analysis of spatial spillover and urban agglomeration diffusion in the Yangtze River Delta metropolitan area. Econ. Geogr. 2013, 33, 46–53. [Google Scholar] [CrossRef]
  45. Solecka, I. The use of landscape value assessment in spatial planning and sustainable land management-a review. Landsc. Res. 2018, 44, 966–981. [Google Scholar] [CrossRef]
  46. Gómez-Sal, A.; Belmontes, J.A.; Nicolau, J.M. Assessing landscape values: A proposal for a multidimensional conceptual model. Ecol. Model. 2003, 168, 319–341. [Google Scholar] [CrossRef]
  47. Fan, Q. Research on the Evaluation of Tourism Resource Development Potential and Development Strategy of Zixi County Under the Background of all-for-One Tourism. Ph.D. Dissertation, Jiangxi Normal University, Nanchang, China, 2023. [Google Scholar]
  48. Wang, X.; Huang, Z.; Yuan, L.; Yu, Z. A Study on Potential Assessment of Ecotourism Resources: A Case of Coastal Wetlands in Yancheng. Econ. Geogr. 2007, 27, 830–834. [Google Scholar] [CrossRef]
  49. Kurttila, M.; Pesonen, M.; Kangas, J.; Kajanus, M. Utilizing the analytic hierarchy process (AHP) in SWOT analysis—A hybrid method and its application to a forest-certification case. For. Policy Econ. 2000, 1, 41–52. [Google Scholar] [CrossRef]
  50. Yeung, K.W.K.; Poon, R.W.Y.; Liu, X.Y.; Ho, J.P.Y.; Chung, C.Y.; Chu, P.K.; Cheung, K.M.C. Corrosion resistance, surface mechanical properties, and cytocompatibility of plasma immersion ion implantation-treated nickel-titanium shape memory alloys. J. Biomed. Mater. Res. Part A 2010, 75A, 256–267. [Google Scholar] [CrossRef] [PubMed]
  51. Zong, H.; Du, Y.; Huang, Y. Accessibility of land transportation and urban spatial connection pattern between southwest China and Southeast Asian countries. Econ. Geogr. 2020, 40, 90–98. [Google Scholar] [CrossRef]
  52. Hao, C.; Wu, S.; Cheng, W.; Chen, M.; Ren, Y.; Chang, X.; Zhang, L. Spatiotemporal Relationship Between Landscape Pattern and Ecosystem Service Connectivity in Wetland Environment: Evidence from Yellow River Delta, China. Land 2025, 14, 273. [Google Scholar] [CrossRef]
  53. Li, F.; Ye, Y.; Song, B.; Wang, R. Evaluation of urban suitable ecological land based on the minimum cumulative resistance model: A case study from Changzhou, China. Ecol. Model. 2015, 318, 194–203. [Google Scholar] [CrossRef]
  54. Gavrilaș, S.; Brînzan, O.; Tigan, E.; Blaga, R.L.; Iancu, T. Assessing Urban Agriculture’s Potential for Biodiversity Conservation, Carbon Sequestration, and Community Development: A Comparative Study of Residents’ Perceptions in Three Western Romanian Cities. Land 2025, 14, 271. [Google Scholar] [CrossRef]
  55. Zhang, R.; Martí Casanovas, M.; Bosch González, M.; Sun, S. Public Value in Historic Environment Regeneration in China: A Public Perception Perspective on Spatial Form, Urban Governance, and People’s Experience (2000–2020). Land 2025, 14, 267. [Google Scholar] [CrossRef]
  56. Kim, K.; Kang, J.-Y.; Hwang, C. Identifying Indicators Contributing to the Social Vulnerability Index via a Scoping Review. Land 2025, 14, 263. [Google Scholar] [CrossRef]
  57. Wang, J.; Li, X.; Christakos, G.; Liao, Y.; Zhang, T.; Gu, X.; Zheng, X. Geographical detectors-based health risk assessment and its application in the neural tube defects study of the Heshun Region, China. Int. J. Geogr. Inf. Sci. 2010, 24, 107–127. [Google Scholar] [CrossRef]
  58. Song, X.P.; Richards, D.R.; He, P.; Tan, P.Y. Does geo-located social media reflect the visit frequency of urban parks? A city-wide analysis using the count and content of photographs. Landsc. Urban Plan. 2020, 203, 103908. [Google Scholar] [CrossRef]
  59. Gao, F.; Li, S.; Tan, Z.; Wu, Z.; Zhang, X.; Huang, G.; Huang, Z. Understanding the modifiable areal unit problem in dockless bike sharing usage and exploring the interactive effects of built environment factors. Int. J. Geogr. Inf. Sci. 2021, 35, 1905–1925. [Google Scholar] [CrossRef]
  60. Guo, H.; Sun, Y.; Wang, Q.; Wang, X.; Zhang, L. Construction of greenspace landscape ecological network based on resistance analysis of GeoDetector in Jinan. Stoch. Environ. Res. Risk Assess. 2023, 37, 651–663. [Google Scholar] [CrossRef]
  61. Wang, C.; Wang, Q.; Liu, N.; Sun, Y.; Guo, H.; Song, X. The impact of LUCC on the spatial pattern of ecological network during urbanization: A case study of Jinan City. Ecol. Indic. 2023, 155, 111004. [Google Scholar] [CrossRef]
  62. Esenarro, D.; Cho, A.; Vargas, N.; Calderon, O.; Raymundo, V. Chinchero as Tourism Hub and Green Corridor as a Social Integrator in Cusco Peru 2023. Sustainability 2024, 16, 3068. [Google Scholar] [CrossRef]
  63. Zhang, Y.; Gong, Y.; Ha, L. Research on the construction of integrated collaborative development mechanism of tourism corridors. Tour. Overv. 2024, 95–97. [Google Scholar]
  64. Li, T.; Jia, B.; Liu, W.; Zhang, Q.; Jiang, S. Spatio-temporal dynamics and influencing factors of ecological security network elements in Yichang, Hubei Province. Acta Ecol. Sin. 2023, 43, 6154–6169. [Google Scholar] [CrossRef]
  65. Huang, L.; Wang, J.; Cheng, H. Spatiotemporal changes in ecological network resilience in the Shandong Peninsula urban agglomeration. J. Clean. Prod. 2022, 339, 130681. [Google Scholar] [CrossRef]
  66. Huang, T.; Wei, M.; Xi, J. Evolution and Spillover Effect of Urban Ecotourism Amenity Spatial Pattern in Suzhou. Econ. Geogr. 2023, 43, 210–219. [Google Scholar] [CrossRef]
  67. Su, Y.; Chen, X.; Liao, J.; Zhang, H.; Wang, C.; Ye, Y.; Wang, Y. Modeling the optimal ecological security pattern for guiding the urban constructed land expansions. Urban. For. Urban. Greeg. 2016, 19, 35–46. [Google Scholar] [CrossRef]
  68. Wang, Y. Study on the harnessing measures of Hetian River basin based on the spatial and temporal change pattern of ecological corridor. Water Resour. Dev. Manag. 2021, 12, 53–58+72. [Google Scholar] [CrossRef]
  69. Adriaensen, F.; Chardon, J.P.; Blust, G.D.; Swinnen, E.; Villalba, S.; Gulinck, H.; Matthysen, E. The application of ‘least-cost’ modeling as a functional landscape model. Landsc. Urban Plan. 2023, 64, 233–247. [Google Scholar] [CrossRef]
  70. Tian, B.; Wang, J.; Wang, M.; Shi, N.; Luo, D.; Zhang, L.; Zhu, N.; Zhang, N.; Wu, N.; Gai, A. Potential habitat distribution, ecological corridors and influencing factors of Tibetan antelope in the pan-Himalayan region. Pratacultural Sci. 2024, 41, 1788–1801. [Google Scholar]
  71. Arya, V.; Auruskeviciene, V.; Agarwal, S.; Kokatnur, P.; Kumar, H.; Verma, R. Let us take a walk to the sustainable tourism practices: A qualitative study through the lens of tourism experts. Environ. Sci. Pollut. Res. 2024, 31, 12892–12915. [Google Scholar] [CrossRef]
  72. Guo, Y.; Jiang, J.; Li, S. A Sustainable Tourism Policy Research Review. Sustainability 2019, 11, 3187. [Google Scholar] [CrossRef]
  73. Roblek, V.; Drpić, D.; Meško, M.; Milojica, V. Evolution of Sustainable Tourism Concepts. Sustainability 2021, 13, 12829. [Google Scholar] [CrossRef]
  74. Wang, X.W.; Chen, Y. Research on the interaction between transportation infrastructure and tourism economic growth in Northwest China: An empirical analysis based on PVAR model. J. Lanzhou Univ. (Soc. Sci.) 2020, 48, 31–38. [Google Scholar]
  75. Cai, H.; Liu, M.W. Agglomeration and Differentiation: Trends in Population Structure Changes in the Yangtze River Delta Region. J. Southwest Pet. Univ. (Soc. Sci. Ed.) 2023, 25, 31–39. [Google Scholar]
  76. Maleki, M.; Mohammadpour, S.; Azadeh, S.R. The effect of infrastructural integration of regional transport on tourism promotion: The case of guilan province, iran. J. Urban. Reg. Anal. 2020, 12, 217–231. [Google Scholar] [CrossRef]
  77. Ming, Q.Z.; Zou, J.Q. Nonlinear effects and spatial spillover effects of infrastructure in border areas on high-quality tourism development: Empirical analysis based on dynamic spatial Durbin model. Guangxi Soc. Sci. 2022, 8, 9–21. [Google Scholar]
Figure 1. Study area.
Sustainability 17 01126 g001
Figure 2. Flowchart of research methodology.
Sustainability 17 01126 g002
Figure 3. Evaluation of Landscape Value Scores.
Sustainability 17 01126 g003
Figure 4. Comprehensive Landscape Value Scores.
Sustainability 17 01126 g004
Figure 5. Landscape Value Zoning.
Sustainability 17 01126 g005
Figure 6. Comprehensive cost raster for cross-regional tourism corridor construction.
Sustainability 17 01126 g006
Figure 7. Minimum cost path for the construction of eco-social composite tourism corridor.
Sustainability 17 01126 g007
Figure 8. Factor Detection Analysis of Influencing Factors on Corridor Evolution Characteristics.
Sustainability 17 01126 g008
Figure 9. Interaction Detection Analysis of Influencing Factors on Corridor Evolution Characteristics.
Sustainability 17 01126 g009
Figure 10. Changes in cross-regional tourism corridor indicators from 2000 to 2020. The bar chart represents quantity, and the line chart represents growth rate.
Sustainability 17 01126 g010
Table 1. Data sources.
Data TypeYearResolutionFormatData Source
Ecological–Geographical DataVegetation Coverage2000
2010
2020
30 mRasterResource and Environment Science and Data Center, CAS (https://www.resdc.cn/, accessed on 15 January 2024)
Land Use
Terrain Elevation 1202012.5 mRasterGeospatial Data Cloud
(https://www.gscloud.cn/, accessed on 15 January 2024)
Socio-economic DataRoad Transportation
Data
2000
2010
2020
10 mVectorOpenStreetMap
(https://www.openstreetmap.org/, accessed on 12 March 2024)
POI 230 mVectorChinese Government Website
(https://www.gov.cn/, accessed on 3 May 2024)
Ministry of Culture and Tourism of China (https://www.mct.gov.cn/, accessed on 3 May 2024)
GDP1 kmRasterNational Bureau of Statistics (https://www.stats.gov.cn/, accessed on 12 August 2024)
Population
Administrative Boundary Data for Yangtze River Delta202030 mVectorResource and Environment Science and Data Center, CAS
(https://www.resdc.cn/, accessed on 15 January 2024)
1 Terrain elevation data include aspect and slope data; 2 POI data include national scenic spots and A-rated scenic areas data.
Table 2. Evaluation system and index weights.
TargetCriterionsIndexGrading StandardWeight Value
12345
Landscape prominence value evaluation indicator systemEcological valueVegetation DensityLevel 1Level 2Level 3Level 4Level 50.18750.75
Land UseDeveloped LandGrasslands CroplandsShrublandsForestsWater Bodies0.5625
Topographical valueSlope>35°25–35°15–25°8–15°0–8°0.15830.25
Elevation>800 m600–800 m200–400 m200–400 m<200 m0.0651
AspectNorthNorthwest, NortheastEast, WestSoutheast, SouthwestSouth0.0266
Resistance surface evaluation index systemTransport accessibilityDistance from national roads0–50 m50–100 m100–200 m200–500 m>500 m0.20830.25
Distance from provincial roads0–30 m30–50 m50–100 m100–200 m>200 m0.0417
Landscape resource characteristicsDistance from primary resource points (National Scenic Areas)0–1.5 km1.5–2.5 km2.5–3.5 km3.5–10 km>10 km0.19750.75
Distance from secondary resource points (5A Scenic Spots)0–0.8 km0.8–1.5 km1.5–2.5 km2.5–3.5 km>3.5 km0.0914
Distance from tertiary resource points (4A and below)0–0.5 km0.5–0.8 km0.8–1.5 km1.5–2.5 km>2.5 km0.0427
Landscape Prominence valueDistinct zone-Protruding area-Flat zone0.4184
Table 3. Interaction Types.
Interaction TypeDescription
Enhanced, nonlinearq(x1 ∩ x2) > q(x1) + q(x2)
Independentq(x1 ∩ x2) = q(x1) + q(x2)
Enhanced, bilinearq(x1 ∩ x2) > Max(q(x1), q(x2))
Weakened, uniqueMin(q(x1), q(x2)) < q(x1 ∩ x2) < Max(q(x1), q(x2))
Weakened, nonlinearq (x1 ∩ x2) < Min(q(x1), q(x2))
Table 4. Area of zoning with outstanding landscape value from 2000 to 2020.
Landscape ValueArea (km2) in 2000Area (km2) in 2010Area (km2) in 2020
Prominent Value120,339.09110,589.63104,288.78
Notable Value87,298.2388,478.7886,688.82
Moderate Value14,612.0923,026.4231,100.16
Table 5. Statistics of cross-regional tourism corridor indicators (rapidly urbanizing areas, provincial level).
ProjectCorridor Number (Count)Corridor Length (km)Corridor Density (%)Source Points (Count)
Year200020102020200020102020200020102020200020102020
Anhui531692649641.128,373.0842,589.390.07%0.23%0.37%4810
Jiangsu422153534567.7410,882.6414,472.310.06%0.32%0.53%233
Zhejiang7211413114,749.0542,953.6969,961.580.09%0.14%0.16%71317
Shanghai132329101.921238.041681.120.16%0.29%0.36%111
YRD’s
Central Region
9127643529,659.8183,447.45128,704.40.04%0.12%0.19%142531
Disclaimer/Publisher’s Note: The statements, opinions and data contained in all publications are solely those of the individual author(s) and contributor(s) and not of MDPI and/or the editor(s). MDPI and/or the editor(s) disclaim responsibility for any injury to people or property resulting from any ideas, methods, instructions or products referred to in the content.

