Abstract
To meet the sustainable development goals of the aviation industry, promoting digitalized all-electric aircraft (AEA) is a critical path. However, during the dynamic popularization process of digitalized AEA, the interests among manufacturers, airlines, and governments vary, coupled with a notable time delay in digitalized technological R&D and market promotion. Therefore, this study establishes differential game models for popularizing AEA and investigates dynamic optimal strategies of potential benefits, levels of digitalized R&D, consumer preferences, and market demand, under three game modes: Nash non-cooperative, cost-sharing, and collaborative cooperation. The research finds that: (1) When the promotion cost of AEA is lower than a certain threshold, the cost-sharing model can effectively enhance digital R&D. (2) In the case of ignoring time lag, the initial value of the battery life level and consumer preference becomes the decisive factor that significantly affects its dynamic evolution trajectory. Under the cost-sharing model, the battery life level and consumer preference reached 107.13 and 15.26, respectively. This is significantly higher than the collaborative model and the NASH non-cooperative model. (3) When the delay effect exceeds the thresholds of 4.58 and 5.49, respectively, the Nash non-cooperative model becomes the most effective promotion model. This paper provides an important decision-making reference for promoting the digital transformation and sustainable development of the aviation industry.
1. Introduction
As the airline industry continues to thrive, its environmental impact has become a pressing global concern, making the pursuit of sustainable development an urgent necessity. Nevertheless, in regions where the civil aviation sector is advanced, traditional fuel-powered aircraft (FPA) serve as significant contributors to local air pollution, thereby heightening the need for environmentally sustainable aircraft alternatives. To mitigate carbon emissions and move towards the sustainable development of the aviation sector, the International Civil Aviation Organization (ICAO) established a fresh regulatory objective for reducing greenhouse gases in the aviation industry by 2016, aiming to halve emissions by 2050 compared with the levels recorded in 2005 (International Air Transport Association (International Air Transport Association, 2023. Executive Summar Net Zero Roadmaps. https://www.iata.org/en/programs/environment/roadmaps/, 9 October 2023). The current policy of exclusively relying on carbon taxes to augment fuel levies in the airline industry constrains the potential of conventional fuel-powered aircraft (FPA) to accomplish this objective []. Consequently, Ref. [] argue for the urgent promotion of all-electric aircraft (AEA) development within the aviation sector.
In this context, digitalization emerges as a powerful engine driving the popularization of AEA and the sustainable transformation of aviation. Digital technologies are not only integral to the aircraft’s design and manufacturing, such as using digital twins for simulation and AI for optimizing battery management [], but also crucial for the supporting ecosystem. This includes the development of smart charging infrastructures and the use of big data for fleet management by airlines. The integration of these digital elements is essential for overcoming the challenges associated with AEA promotion.
In fact, in the studies of Refs. [,], it was pointed out that the battery structure of AEA is similar to that of new energy vehicles and is the most valuable part of the overall body of AEA. In the early stage of the development of new energy vehicles, the battery’s driving range, battery quality and safety, and cost issues were the main problems faced during promotion. The battery requirements for AEA are even higher. According to a report (Maintenance, Repair & Overhaul. (2019). How Batteries Need To Develop To Match Jet Fuel. Available at: https://aviationweek.com/mro/aircraft-propulsion/how-batteries-need-develop-match-jet-fuel (accessed on 6 July 2025)), the current state-of-the-art lithium-ion battery exhibits a capacity ranging from 250 to 300 watt-hours per kilogram, rendering it suitable for powering compact AEA. However, achieving a comparable range to that of small-scale AEA in commercial AEA necessitates the utilization of a battery pack with an energy density of 500 Wh/kg. This presents significant challenges for battery technology research and development efforts undertaken by AEA manufacturers (hereinafter, as manufacturers). Moreover, promoting the development of AEA and expanding its market share in the digital context is a long-term, complex and continuous process. The development and market demand of AEA are mainly influenced by two aspects. The influence of the battery life level (referred to as the technical level) of AEA and consumer preferences. Because these two factors will evolve over time, thereby increasing the complexity of decision-making. Because the improvement of technological level and consumer preferences does not produce immediate effects, they usually have a delayed effect on the market [,]. These delay effects will have an impact on the decisions of manufacturers, airlines and governments. If these delay effects are ignored, it may lead to deviations in decision-making results and weaken the effectiveness of AEA promotion. To analyze the complex dynamic game decisions of manufacturers, airlines and governments in the process of promoting digital AEA, we have constructed a dynamic differential game model that simultaneously incorporates the delay effect and real-time changes. This model aims to solve the equilibrium solution to characterize the optimal strategies of each game participant in both competitive and cooperative environments. This equilibrium solution provides a crucial foundation for analyzing the development of AEA and its applications in the market [].
The lifecycle of lithium battery technology associated with All-Electric Aircraft (AEA) development presents multifaceted environmental risks []. Research by Ref. [] identifies upstream hard-rock lithium mining as a critical source of environmental burden, where diesel-powered extraction and processing not only generate a significant carbon footprint but also pose toxic risks to terrestrial ecosystems and human health through polluted dust, tailings, and heavy metal leaching. Further amplifying these concerns [], in an empirical study of China’s largest lithium extraction area, demonstrated that lithium mining is the primary industrial source of riverine lithium pollution, leading to bioaccumulation in aquatic organisms and posing potential non-carcinogenic health risks to local residents through contaminated drinking water and vegetables. At the end-of-life stage, the disposal of spent batteries presents another significant challenge. As emphasized by Ref. [], recycling technologies are crucial for handling the impending wave of battery waste; they note that emerging direct recycling methods, which aim to rejuvenate rather than break down electrode materials, require a deep understanding of material failure mechanisms to prevent secondary pollution from improper handling. In summary, the entire lithium-ion battery industry chain, as reviewed by Ref. [], faces sustainability challenges across the entire material lifecycle, necessitating an integrated chemistry, environment, and policy framework for systematic risk assessment and management to ensure the truly green transition of AEA. Despite this, traditional aircraft still face more environmental and operational risks than electric aircraft during the manufacturing and operation process. According to research by Ref. [], traditional aircraft pose significant environmental risks due to their hydraulic and pneumatic systems, which are prone to leaks and require high maintenance, and their fossil fuel combustion, which emits large amounts of CO2 and NOx. Ref. [] further highlight, life cycle assessments confirm their high global warming potential and ecotoxicity. In contrast, electric aircraft produce zero direct emissions during operation. Their life cycle carbon emissions can be about 55% lower, with substantial reductions in other pollutants. Their electric propulsion systems are more reliable, and they exhibit better life cycle cost economics. In conclusion, electric aircraft demonstrate superior environmental performance, reliability, and cost-effectiveness, making them a more suitable and promising solution for greening the aviation industry.
The promotion of AEA presents a complex landscape of risks and rewards for stakeholders. Manufacturers face significant costs when driving research and development (R&D) and implementing core AEA technology. As AEA emerges, immature key R&D technologies may lead to frequent operational failures in aviation, thereby reducing AEA utilization. Therefore, intensifying R&D efforts is crucial. Ongoing innovation and breakthroughs in R&D technology require substantial investments. However, Ref. [] argue that excessive spending can inflate the initial cost of AEA, potentially dampening the short-term investment enthusiasm of manufacturers and airlines. The study conducted by Ref. [] concurrently demonstrates that lithium-ion batteries are widely recognized as the optimal energy source for electric aircraft due to their exceptional energy density and extended lifespan. However, potential safety concerns may arise during battery utilization due to variations in operational temperature and charging status. Although Ref. [] suggests that increasing the utilization of AEA has the potential to contribute towards mitigating greenhouse gas emissions and noise pollution, thereby assisting the airline industry in achieving their carbon reduction targets, it is imperative to acknowledge that conventional fuel-powered aircraft still offer superior short-term economic advantages. Based on the study conducted by Ref. [], it is suggested that achieving long-term economic sustainability with AEA would require battery costs to reach or fall below $100 per kilowatt-hour. With immature core technology and low consumer preference, hasty implementation poses risks to operational safety and revenue stability. Airlines have adopted a cautious approach to AEA. As the government holds operational and ownership rights over most airports, it plays a pivotal role in promoting AEA adoption. Ref. [] contend that to ensure the endurance level of AEA, it is imperative for the government to allocate investments towards bolstering airport charging infrastructure and optimizing existing power grids. This mitigates the variable operational costs and encourages airline and consumer adoption. Manufacturers must enhance battery technology R&D to optimize endurance, reduce costs, and boost consumer preferences. The government must formulate effective incentive policies while balancing its fiscal budget with necessary investments in charging infrastructure.
Considering current AEA R&D maturity and consumer preferences, a critical question emerges: Which model should AEA market promotion underline? Because the battery—the core component of AEA directly determines performance, its R&D is highly dynamic and costly. Therefore, battery innovation is pivotal to AEA’s widespread diffusion and long-term profitability. This poses a shared challenge for manufacturers, airlines, and the government. Airlines must carefully evaluate AEA endurance, safety, and market demand. They must also consider the availability of airport charging infrastructure. Inadequate facilities can cause operational delays, erode consumer confidence, and suppress demand. Accordingly, before selecting a collaboration model, manufacturers, airlines, and the government should comprehensively assess AEA endurance and the current state of airport infrastructure. Given current market conditions, an important choice arises: should stakeholders share costs or act independently? For independent decision-making, we model behavior using the Nash non-cooperative framework. If the manufacturer’s R&D capability falls short of the minimum requirements for commercial AEA, airlines and the government should proceed cautiously and avoid immediate collaboration. This situation yields a Nash non-cooperative equilibrium, in which each stakeholder acts independently to maximize its own utility. Under cost-sharing arrangements, as the manufacturer’s R&D level improves, airline–manufacturer willingness to cooperate increases, which stimulates AEA procurement. This, in turn, raises demand for airport charging infrastructure and incentivizes government investment. The high operating costs of first-generation AEA may dampen airline and government enthusiasm. Large manufacturers often pursue cost-sharing arrangements with airlines and the government to set standards and strengthen market influence. This manufacturer-led approach protects airline and government interests but increases the manufacturer’s burden. Once technical and cost challenges are resolved, airlines and the government can proactively advance emissions reduction and infrastructure development, enabling closer collaboration. Within a collaborative framework, we analyze a model in which decision-makers share information and resources and jointly optimize decisions. Although idealized in practice, this model serves as a benchmark. Accordingly, we study three game models for AEA promotion: Nash non-cooperative, cost-sharing, and collaborative cooperation. To analyze AEA promotion, we develop a dynamic game model that incorporates delay effects and real-time adjustments. The model identifies optimal strategies for all parties and supports long-term, stable AEA deployment.
Draw on the similarities between AEA and the research on the promotion of new energy vehicles. This paper employs dynamic optimal control and a differential game model including delay effects. Under the NASH non-cooperative mode, cost-sharing mode and collaborative mode, respectively. Study the optimal decision-making paths for manufacturers, airlines and the government in terms of enhancing technological levels and increasing consumer investment strategies. This study primarily addresses the following four aspects: (1) The extent of the influence exerted by different cost coefficients on the selection of popularization models for AEA. (2) The reciprocal impact of the chosen promotion model on technological advancement and consumer preferences for AEA. (3) How government initiatives in charging infrastructure, manufacturers’ efforts in digitalized R&D, and the airline’s marketing promotion dynamically popularize the all-electric aircraft. (4) The influence of varying delayed effects on the optimal strategic decisions made by the manufacturer, airline, and government.
The remaining part of this article is arranged as follows: In Section 2 provides a review of the relevant literature. In Section 3, the construction of a differential game model is discussed that considers the delayed effects of technology R&D and consumer preferences for AEA. Subsequently, equilibrium strategies under various game models are compared and analyzed. In Section 4, numerical simulations are carried out to demonstrate the impact of various factors on AEA promotion. Section 5 summarizes the study and proposes future research directions.
2. Literature Review
The promotion of the all-electric aircraft (AEA) market is a continuous dynamic process, and the key to its success is strategic decision-making by manufacturers, airlines, and governments in response to concurrent changes in the endurance level of AEA and consumer preferences. Most existing literature frames this challenge within the context of energy transition and carbon reduction. However, a broader perspective of sustainable development, which encompasses economic viability and social acceptance, is crucial. Furthermore, the role of digitalization as a key enabler for both technological breakthroughs and market promotion has not been sufficiently explored in current models. Based on the literature review, research on policies promoting AEA remains limited. Given the inherent similarities between electric vehicles and AEA, this study presents an overview of research related to their promotion, while also examining the significant influence of government policies in driving the adoption of electric aircraft. Furthermore, the incorporation of delayed effects can enhance the accuracy of reflecting the influence of the endurance level of AEA and consumer preferences on the promotion of the AEA market. Therefore, this study analyzes the promotion of AEA by examining three aspects: the influencing factors driving the development of AEA, policy incentives and delayed effects, and the application of differential games in promotion.
2.1. Influencing Factors of AEA Development
Currently, the key factors driving the development of AEA are battery technology research and cost-related issues which resemble the challenges faced by the early stage of the sector of electric vehicles. Ref. [] noted that battery costs are considered a main hurdle for widespread electric vehicle (EV) adoption and for overcoming generation variability from renewable energy sources. Ref. [] believed that the need for high-performance and low-cost batteries is driven by the growing market of electro-mobility, to fulfill key requirements, such as a sufficient driving range and fast charging ability, for achieving broad consumer acceptance. Ref. [] revealed that government subsidies have an incentive effect on the R&D activities of new energy vehicle (NEV) listed companies. From the perspective of the industry chain, it is specifically reflected in three aspects: promoting R&D investment and non-invention patent output, having the greatest incentive effect on R&D investment in midstream companies, and significantly increasing innovation output when it exceeds the threshold. Ref. [] found that the credit system governing electric vehicles effectively regulates the advancement of battery technology, thereby anticipating a reduction in overall costs and providing enhanced credit incentives for businesses. Ref. [] and Ref. [] have identified and underscored the potential of government subsidy policies in augmenting the efficacy of research and development for new energy technologies within enterprises. New energy technology fundamentally requires funding and loan support; once the government withdraws these measures of support, it will lead to a lack of technological innovation in businesses.
Incentives for manufacturers can accelerate the adoption of electric vehicles, as suggested by Ref. [] research, which highlights the slow pace of battery cost reduction and the need for policy subsidies. Moreover, government subsidies may indirectly influence the financial limitations faced by electric vehicle companies and have decreased the R&D investment of electric vehicle companies. Regarding R&D collaboration modes, Ref. [] investigated four distinct collaboration modes in research and development between automobile manufacturers as marketing players and battery manufacturers as innovation providers. The findings suggest that marketers exhibit preferences for specific collaboration modes based on the trade-off between research and development efficiency, as well as sales efficiency for both marketers and innovators. Consequently, it can be inferred that the collaborative R&D mode is not always the exclusive choice []. Additionally, policies within the charging station industry exert considerable influence on the advancement of electric vehicles. The study conducted by Ref. [] demonstrated, through a comparative analysis of charging infrastructure frameworks across various countries, that an enhanced charging infrastructure can bolster consumer acceptance during the promotion of electric vehicles. Moreover, they emphasized the paramount significance attributed to charging infrastructure. For electric aircraft, Ref. [] found that battery development, particularly improving usable specific energy rather than cost, is the central challenge for electric aircraft. While EV battery research prioritizes cost reduction, aviation demands much higher energy density and extreme safety, necessitating a dedicated R&D focus. Ref. [] emphasized that battery technology is a critical factor determining the performance and feasibility of all-electric aircraft, as its energy density directly impacts flight range and payload capacity.
Existing research on the development of electric vehicle technology primarily focuses on investigating the influence of technological advancements on the growth of the electric vehicle industry, with an emphasis on financial subsidies and policy support. It highlights how green energy technology relies on these forms of assistance and explores how collaborative modes can yield optimal benefits in terms of new technology R&D. However, there is a lack of analysis pertaining to technical level R&D costs and risks. Nonetheless, it still offers valuable insights into technological R&D as well as cooperative models for AEA.
2.2. Policy Incentives and Delayed Effects
The impact of various policy measures on manufacturers’ decision-making behavior has attracted considerable scholarly attention in the face of diverse preferential government policies, leading to extensive research in this field. Ref. [] suggest that policymakers can develop targeted incentive strategies based on factors influencing the intention to adopt electric aircraft to enhance consumer trust and adoption willingness. They emphasize that policies, through educational campaigns and risk communication, can effectively promote the market acceptance of electric aircraft. Ref. [] simulated the behavior of automated transportation systems in various policy situations. The analysis results showed that the implementation of most individual policies alone is not sufficient to achieve the CO2 target of ‘The Road to Flight’ by 2050, but a strong policy combination is needed. Specifically, the combination of electricity subsidies and kerosene taxes has a higher adoption rate for electric aircrafts than other combinations. Ref. [] demonstrated through a system dynamics model that financial incentives for electric vehicles, such as tax credits and charging infrastructure subsidies, significantly enhance consumers’ purchase intention and accelerate market adoption. Moreover, the study highlights synergistic effects among policies: renewable energy incentives indirectly promote EV adoption by lowering electricity prices, while the expansion of charging infrastructure further amplifies the effectiveness of these incentives. Ref. [] demonstrated through a system dynamics model that policy incentives significantly promote consumer adoption of electric vehicles by reducing costs and enhancing technological credibility. Furthermore, Ref. [] conducted a study on the impact mechanism of new energy vehicle incentive policies in promoting technological innovation rate. Their findings revealed that while these policies did contribute to the technological innovation level of new energy vehicle companies in these cities and offered government subsidies, they were not successful in significantly improving the efficiency of technological innovation.
In the context of delay effects, Ref. [] demonstrated that policy incentives for EV adoption are subject to significant delay effects, including the construction period of charging infrastructure and the lag in consumer response. Their findings emphasize that such delays moderate the ultimate effectiveness of incentive policies, thereby influencing the actual pace of electric vehicle adoption. Ref. [] examine how delays in implementing government subsidies, such as green technology or fund transfers, can dynamically impact firms’ emission reduction decisions and efficiency. Their study further highlights that technological adoption delays, affected by cost thresholds and subsidy coverage, may alter firms’ preferences between green funds and technologies, potentially deferring environmental benefits. Similarly, Ref. [] analyze the repercussions of policy and technology delays on achieving zero emissions in global tourism, demonstrating that postponements in adopting zero emission aircraft or sustainable aviation fuels could significantly impede emission reduction targets and increase carbon budget risks. Through the system dynamics model, they emphasize that delays in infrastructure investments or international agreements, such as slot capacity restrictions, may exacerbate climate impacts and undermine the sector’s economic stability.
By studying policy incentives and delay-related articles, it was found that government preferential policies have an important impact on promoting the development of electric aircraft, but policymakers must carefully design a policy mix to achieve long-term promotion goals. In addition, little research has been conducted on incorporating delayed effects into the factors that affect policies. To make the game model more realistic, this study added delayed effects based on previous research.
2.3. Application of Differential Game in Promotion
Ref. [] believed that the tripartite evolutionary game model effectively analyzes the dynamic interactions among the government, enterprises, and consumers in the promotion of new energy vehicles. The introduced dynamic reward-punishment mechanisms, especially the nonlinear dynamic mechanism, provide insights for policy design in electric aircraft promotion, particularly in achieving system stability. Ref. [] used a differential game model to study manufacturers’ carbon emission reduction competition under government intervention, emphasizing the importance of dynamic strategies in long-term emission reduction processes. This model can be extended to analyze the technology R&D and market competition strategies of electric aircraft manufacturers under policy guidance. According to Ref. [] in their study on energy management of flying car hybrid electric propulsion systems, they effectively coordinated multiple generator units through a data-driven cooperative differential game, achieving optimization of fuel consumption and emissions. This research demonstrates the effectiveness of differential games in dynamic energy allocation and multi-objective optimization. Ref. [] employed a differential game model to examine the optimal pricing and promotion issues in dual-channel supply chains. Ref. [] established a non-cooperative equilibrium of a differential game employing Markov strategies and investigated a cooperative game, in which participants made coordinated promotion decisions. They also explored whether manufacturers could devise an incentive strategy to persuade retailers to adhere to agreed-upon solutions. Ref. [] conducted a comprehensive analysis on the promotional strategies adopted by retailers and manufacturers across both traditional brick-and-mortar stores and online platforms. By employing differential game theory, they successfully model the competitive dynamics between these two entities, ultimately deriving the feedback Nash equilibrium of this strategic interaction. Ref. [] proposed an optimal strategy for manufacturers and retailers to innovate and promote technology in a dual-market supply chain, considering the potential impact of government intervention on joint promotional efforts. Ref. [] adopt a governmental environmental supervision perspective to examine the impact of innovation efficiency on carbon emission reduction technology within enterprises. By employing a differential game model, they establish a bilateral interactive mechanism and uncover a mutually beneficial relationship between government environmental supervision and enterprise innovation in mitigating carbon emissions. This study offers strategic recommendations for fostering closer collaboration between both parties in achieving carbon emission reductions. The utilization of differential game offers advantages in addressing dynamic decision-making, considering intricate interactions, and determining optimal strategies. This provides a theoretical foundation for the model selection undertaken in this study. Ref. [] discovered that differential games can model dynamic strategic interactions between governments and enterprises in electric aircraft promotion, optimizing subsidy policies and infrastructure investment decisions. Their study further emphasizes that this approach simulates technology diffusion pathways, supporting the design of coordinated sustainable promotion mechanisms.
In summary, current scholars’ technological R&D, policy incentives, and delay and promotion strategies are primarily based on static game models, case studies, or empirical analyses. Although some scholars have analyzed the level of technology development, effectiveness of policy incentives, and promotion issues from a dynamic perspective using game theory, most of them start from an immediate perspective. Most importantly, few scholars have studied the impact of delayed effects. Therefore, this study introduces the delayed effects to improve electric aircraft battery technology and consumer preferences. Based on a differential game model and taking manufacturers, airlines, and governments in the electric aircraft market business ecosystem as the research objects, this study examines the equilibrium strategies of different subjects under Nash non-cooperative, cost-sharing, and collaborative cooperation mechanisms to explore the optimal strategy for promoting electric aircraft in a dynamic framework.
3. Construction of Differential Game Models
3.1. Problem Description and Analysis
Considering the realistic background of promoting electric aircraft for the sustainable development of aviation, we constructed a set of dynamic differential game models consisting of manufacturers, airlines, and the government. Manufacturers are responsible for conducting technological R&D and promoting products, with a growing focus on digital technologies such as AI-powered battery management and digital twin simulations. The airline is responsible for integrating electric aircraft into its fleets to enhance the proportion of sustainable aviation and mitigate greenhouse gas emissions. Governments play a crucial role in investing in infrastructure development, such as establishing smart charging infrastructures at airports. The choice of a promotion model for all-electric aircraft is determined by factors such as the level of AEA technology, the airline’s revenue situation, and policy orientation, which involves collaboration among manufacturers, stakeholders in the airline, and the government. Due to the time lag between technology R&D and the actual commercial achievements, there will be a delayed effect in promoting AEA technology. Similarly, as indicated by Ref. [], consumers require a certain period to assimilate advertising information, leading to a delay in promoting AEA. Considering these delayed effects, this study employs differential game equations to simulate the promotional scenarios of the three entities in the Nash non-cooperative, cost-sharing, and collaborative cooperation modes. Figure 1 illustrates a game logic diagram.
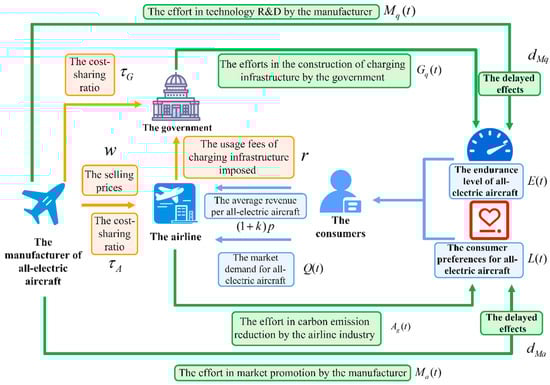
Figure 1.
Logic diagram of the Differential Game.
In the initial stage of promoting AEA, the airline and the government adopt a cautious approach before deciding whether to proceed based on their own interests and AEA R&D. Manufacturers engage in promotional efforts only if they can establish industry benchmarks and enhance their market value. However, owing to the current limited level of R&D technology for AEA batteries as well as the high associated costs, all three parties involved will employ a Nash non-cooperative mode that prioritizes maximizing their individual interests during promotion.
If the government implements incentive policies, such as providing subsidies for the research and development of new energy technologies or procuring AEA and offers funding subsidies to promote collaboration between the airline and the government, a three-party game will emerge, with manufacturers taking the lead in cost sharing. The allocation of subsidies among manufacturers, the airline, and the government is determined based on their respective effort levels.
The collaborative promotion of AEA through a cooperative mode that maximizes collective benefits will be facilitated if there is a breakthrough in the endurance level of AEA, and incentive policies can effectively mitigate technological R&D as well as procurement costs for manufacturers and the airline while ensuring that social welfare is not compromised.
3.2. Model Assumptions and Parameter Description
The differential game model considered in this study comprises manufacturers (), airline (), and government (). The manufacturer supplies the aviation company with AEA at a unit price of . The average revenue generated by each AEA for the airline is , where represents the benchmark factor of AEA endurance levels falling within the numerical range of . The infrastructure usage fee levied on airlines by the government was . In a cost-sharing mode, manufacturers as leaders contribute to the costs with the airline and government in proportions denoted by and , respectively, falling within the numerical ranges of and . The values of and are mutually dependent on the airline’s efforts to reduce emissions and government initiatives aimed at establishing a charging infrastructure. Table 1 summarizes the key notation used in this study.

Table 1.
Parameters description.
According to Ref. [], the successful commercialization of AEA hinges upon advancements in battery technology, which dictate its endurance level, while a well-established charging infrastructure ensures sustainable utilization of AEA in commercial operations. Technological progress and a well-developed infrastructure lay a solid foundation for the widespread adoption of AEA. The research conducted by Ref. [] indicates that batteries themselves demonstrate power degradation characteristics, which may result in a reduction in the endurance level of AEA if continuous technological advancements or proper infrastructure maintenance are lacking. Furthermore, according to the study conducted by Ref. [], it has been observed that the investment made by manufacturer in R&D does not directly result in an enhancement of AEA’s endurance level. Hence, a delayed effect exists when it comes to augmenting AEA endurance level capability. The statement is based on the model proposed by Ref. [], which serves as the fundamental framework for our research, the delay differential equation governing the temporal evolution of the endurance level in AEA can be expressed as follows:
where represents the initial value of the AEA endurance level and denotes the rate of change in this level over time.
In response to the increasing consumer preference for sustainable travel, manufacturers and the airlines are making efforts to enhance product quality and reduce emissions to gain favor from consumers and expand their market share. This will be demonstrated through adjustments in the composition of airline fleets towards incorporating more environmentally friendly aircraft (e.g., AEA), while manufacturers will promote their products through comprehensive marketing strategies, including advertising and other promotional activities. However, the effectiveness of these marketing efforts in influencing consumer preferences may vary depending on factors such as market demand responsiveness, acceptance levels, and the accurate prediction of consumer preferences. Revisiting the research conducted by Ref. [], it is evident that there exists a delayed effect between manufacturer marketing endeavors and the actual translation of consumer preferences. The delay differential equation governing the temporal evolution of consumer preference levels in AEA can be expressed as follows:
where represents the initial value of consumer preference for the AEA, and denotes the temporal dynamics of consumer preference.
We evaluate the investments made by electric aircraft manufacturers, airlines, and governments in promoting electric aviation based on their level of commitment. Following the approach of Ref. [] and adopting the assumption of convexity for effort costs from Ref. [], the cost functions are defined. Specifically, the manufacturer’s effort in technology R&D, , is defined to include both hardware innovation and investment in digital technologies. Similarly, their market promotion effort, , encompasses digital marketing strategies. The government’s effort, , is focused on the construction of a smart charging infrastructure. The cost function for the airline’s carbon emission reduction efforts is ; the manufacturer’s R&D and promotion costs are and , respectively; and the government’s infrastructure cost is .
The market demand for AEA is influenced by multiple factors, including product quality, marketing strategies, carbon reduction potential, and availability of supporting infrastructure. Furthermore, consumers prefer environmentally friendly and low-carbon products that are competitively priced. Considering the combined impact of these factors, we assume that the demand function for the AEA is
This represents the discount rate. The objective function expressions for manufacturers, airlines, and governments in an infinite planning horizon are as follows:
3.3. Model Solving
This section examines the optimal strategies and revenues of manufacturers, the airline, and the government across three modes (the Nash non-cooperative mode, cost-sharing mode, and collaborative cooperation mode), exploring variations in AEA endurance levels and consumer preferences to determine the circumstances under which stakeholders can reach optimal decisions. Furthermore, it aims to ascertain the ideal trajectory for AEA endurance levels and consumer preferences while evaluating the market demand for AEA.
3.3.1. Nash Non-Cooperative Mode
Under the Nash non-cooperative mode (superscript N), the manufacturer, the airline, and the government independently determine their respective optimal strategy levels and bear their own costs. The best strategies, maximum profits, AEA durability, consumer preferences, and market demand must be determined for all three parties. In this mode, the objective functions of the manufacturer, the airline, and the government are, respectively, denoted by , and . The objective function of the manufacturer is composed of the selling price of each all-electric aircraft () multiplied by the AEA market demand quantity (), minus the costs in AEA research and development and promotion (), as shown in Formula (7); the objective function of the airline is composed of the average revenue per all-electric aircraft () multiplied by the AEA market demand quantity (), minus the cost that airlines incur to reduce carbon emissions (), as shown in Formula (8); while the objective function of government is composed of usage fees for charging infrastructure charged by it () multiplied by AEA market demand quantity (), minus costs incurred in building charging infrastructure (), as shown in Formula (9).
Result 1.
In the Nash non-cooperative mode, we derived it based on the principle of dynamic programming. The optimal decision-making trajectories and optimal profits for manufacturers, airlines and the government. And the optimal time trajectory of the battery life level of AEA and consumer preferences as well as market demand. Its specific expression is as follows.
The optimal equilibrium strategy for the airline is:
The optimal equilibrium strategy for the government is:
Under the Nash non-cooperative mode, the optimal return for the manufacturer is:
The optimal return for the airline is:
The optimal return for government is
Under the Nash non-cooperative mode, the total revenue is denoted by :
Under the Nash non-cooperative mode, the optimal time trajectory for the AEA endurance level and consumer preferences are
where
- ,
- .
Under the Nash non-cooperative mode, the market demand function for AEA is
Related proofs are shown in Appendix A.
3.3.2. Cost-Sharing Mode
When electric aircraft manufacturers attain a leading position, changes in crucial factors such as electric aircraft design, performance, technological innovation, and pricing have profound implications on the aviation market. Airlines and governments should adapt their decision-making processes to these transformative developments. A Stackelberg game is established, with the manufacturer assuming the role of the leader, and the airline and government acting as followers. To foster cooperation from these followers, the manufacturer demonstrates a willingness to share costs proportionally with both the airline and the government . Under the cost-sharing mode (superscript S), the objective functions for manufacturers. In this mode, the objective functions of the manufacturer, the airline, and the government are, respectively, denoted by , and . The objective function of the manufacturer is composed of the selling price of each all-electric aircraft () multiplied by the AEA market demand quantity (), minus the costs in AEA research and development and promotion () minus the costs shared by the manufacturer with airlines and governments (), as shown in Formula (21); the objective function of the airline is composed of the average revenue per all-electric aircraft () multiplied by the AEA market demand quantity (), minus the cost that airlines incur to reduce carbon emissions (), as shown in Formula (22); while the objective function of government is composed of usage fees for charging infrastructure charged by it () multiplied by AEA market demand quantity (), minus costs incurred in building charging infrastructure (), as shown in Formula (23).
Result 2.
Under the cost sharing model, we derived based on the principle of dynamic programming: the optimal decision trajectory and optimal profit of manufacturers, airlines and governments, as well as the optimal time trajectory and market demand of AEA’s endurance level and consumer preference. Its specific expression is as follows.
The optimal equilibrium strategy for the airline is
The optimal equilibrium strategy for the government is
where the manufacturer offers the airline and government, and the optimal cost-sharing ratios are
- ,
- .
Under the cost-sharing mode, the optimal return for the manufacturers is
The optimal return for the airline is
The optimal return for government is
Under the cost-sharing mode, the total revenue is denoted by
Under the cost-sharing mode, the optimal time trajectory for the AEA endurance level and consumer preferences are
where
- ,
- .
Under the cost-sharing mode, the market demand function for AEA is
3.3.3. Collaborative Cooperation Mode
Under the collaborative cooperation mode (superscript C), the three parties pursue the maximization of their collective interests. The decision goals of electric aircraft manufacturers, airlines, and governments can be simplified. In this mode, the objective functions of the manufacturer, the airline, and the government are denoted by . The overall objective function is composed of the total revenue from AEA promotion () multiplied by the AEA market demand quantity () minus the total expenditure incurred in promoting AEA (), as shown in Formula (35).
Result 3.
In the collaborative cooperation model, we derived based on the principle of dynamic programming: the optimal decision trajectory and optimal profit of manufacturers, airlines and governments, as well as the optimal time trajectory and market demand of AEA’s battery life level and consumer preferences. Its specific expression is as follows.
The optimal equilibrium strategy for the airline is
The optimal equilibrium strategy for the government is
Under the collaborative cooperation mode, the optimal return (total revenue) is
Under the collaborative cooperation mode, the optimal time trajectories for the AEA endurance level and consumer preferences are
where
Under the collaborative cooperation mode, the market demand function for AEA is
3.4. Analysis and Comparison of the Results
By conducting a comparative analysis of optimal strategies and correlations among different coefficients of manufacturers, the airline, and government efforts across the three modes, this study aims to investigate the extent to which various influencing factors impact the promotion of electric aircraft. Furthermore, through a comparative analysis of emission reduction initiatives undertaken by the airline and government to enhance the charging infrastructure within these three modes, we aim to determine the most effective mode for promoting electric aircraft.
Result 4.
The optimal strategy exhibits a negative correlation with the cost coefficient (,,,), endurance level decay coefficient (), consumer preference decay coefficient (), discount rate (), manufacturers, airline, and government. The endurance level is influenced by the quality R&D coefficient () and charging infrastructure improvement coefficient (). Promotion affects consumer preferences through the influence coefficient (), whereas emissions reduction efforts affect consumer preferences through the influence coefficient (). The impact coefficients of endurance level on market demand quantity are represented by (), consumer preference impact coefficients on market demand quantity are denoted by (), the elements that influence the responsiveness of market demand towards quality R&D efforts are indicated as (), and the elements that influence the responsiveness of market demand towards charging infrastructure improvement are denoted as (). Finally, a positive correlation exists between the delay time (,) and these factors.
Related proofs are shown in Appendix B.
Result 5.
Under the cost-sharing mode, electric aircraft manufacturers can facilitate the sharing of measures to conserve energy and reduce emissions as well as infrastructure development costs between airlines and governments. This approach has the potential to augment airlines’ contributions to emission reduction initiatives while bolstering the government’s commitment to charging infrastructure development, which is contingent upon the extent of cost-sharing undertaken by electric aircraft manufacturers (,). The subsidies provided by manufacturers can effectively incentivize the airline and government. However, as the endurance level capability of the AEA declines () and the consumer preference coefficient () increases, there will be a reduction in the proportion of cost-sharing borne by manufacturers with the airline () and governments ().
Related proofs are shown in Appendix C.
Result 6.
Under the cost-sharing mode, the endurance level of the AEA , consumer preference level , and market demand for the AEA exhibited higher values than those observed under the collaborative cooperation and Nash non-cooperative modes.
Related proofs are shown in Appendix D.
Result 7.
Thresholds exist for both technology development and marketing delay times. When the technology delay time is and the marketing delay time is , the marketing of electric aircraft under the cost-sharing mode can maximize the benefits for all three parties, while there are two thresholds for the delay time of technology development and marketing in this mode, when the delay time is less than the 1st threshold the manufacturer has the highest benefit, when the delay time is between the 1st and 2nd thresholds the manufacturer’s benefits are less than those of airlines and more than those of the government, and when the delay time is greater than the 2nd threshold airlines have the highest benefits and manufacturers have the lowest benefits.
Related proofs are shown in the Appendix E.
4. Numerical Analysis
At present, the parameters used in this paper are derived from existing literature and reports, or derived from them. The influence coefficient in the cost decision variable is , , , []. The coefficient in the influence on the state variable , , , []. The default values of the remaining parameters are set to , , , , , , , , , , , , , , , , and . More detailed parameter sources and Settings are shown in Table 2. The remaining parameters are randomly initialized within the preset reasonable range to ensure the validity of the Settings and the relative stability of the results. The following analysis will simulate how stakeholders choose the optimal cooperation mode to promote digitalized AEA, thereby advancing the sustainable development of the aviation industry.
Table 2.
Parameter Sources.
Figure 2 describes how the overall benefits to the manufacturer, airline, and government vary with the delayed effects in different game modes (For the sake of convenience, in this chapter, Mode-N represents the Nash non-cooperative mode in the graph, Mode-S denotes the cost-sharing mode, and Mode-C signifies the collaborative cooperation mode.). These benefits are a direct result of their respective investments in digitalized R&D, sustainable operations, and smart infrastructure. The overall gain in the Nash non-cooperative and cost-sharing modes exhibits a negative correlation with the delayed effects , . As , increases, both the gain in the Nash non-cooperative mode and the gain in the cost-sharing mode gradually decrease. Meanwhile, the rate of decrease is higher for the gain in the cost-sharing mode, resulting in a smaller gain than that of the Nash non-cooperative mode. Conversely, in the collaborative cooperation mode, the overall gain gradually increases as and increase. However, the overall benefits of the Nash non-cooperative and cost-sharing modes are strictly higher than those of the collaborative cooperation mode. Therefore, the manufacturer, airline, and government make various optimal decisions at different delay ranges. When , is small, and the cost-sharing mode is the best choice. When , is large, and the Nash non-cooperative mode is the best choice.
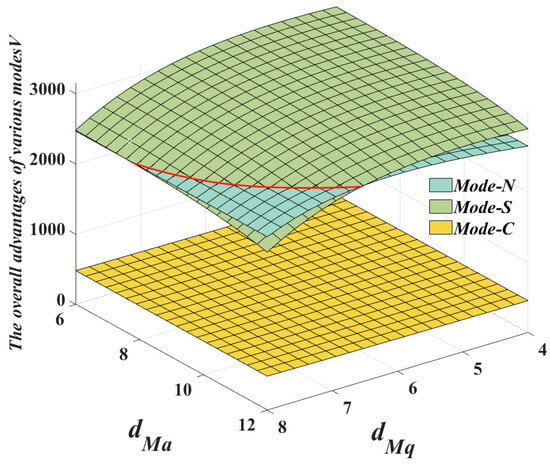
Figure 2.
The impact of and on overall revenue.
According to Figure 1 and the previous deduction, the delayed effects have threshold values. When there are delays in technological upgrading by the manufacturer and delays in promotion by the manufacturer , the airline and government are increasingly inclined to adopt a cost-sharing mode to alleviate cost pressures, foster collaboration with manufacturers, facilitate promotion of AEA, and maximize overall revenue. Prior to finalizing the commencement of cooperation, the manufacturer must fully clarify the delayed effects of its technology development and marketing to ensure that it is within the minimum threshold range. When and are used, although the cost-sharing mode can maintain higher revenues compared to the collaborative cooperation mode, the manufacturer is unable to assist the airline and the government in sharing additional costs owing to the difficulties associated with technology development and promotion. At this point, implementing a cost-sharing mechanism cannot enhance overall revenues but instead results in losses. Therefore, the manufacturer, airline, and government are inclined to prefer the Nash non-cooperative mode. In conclusion, the manufacturer, airline, and government should choose either a cost-sharing mode or a Nash non-cooperative mode based on different delayed effects. This decision is crucial as it determines the collective capacity to fund and sustain the long-term digital R&D and infrastructure investments necessary for a successful transition.
The impact of delayed effects on the revenue of the manufacturer, airlines, and government entities in the Nash non-cooperative and cost-sharing modes is illustrated in Figure 3a,b. As depicted in Figure 3a, the airline consistently generates higher revenue than both the manufacturer and the government. Moreover, as the delayed effects increase, there is a gradual decrease in the revenue of the manufacturer relative to that of the government. The cost-sharing mode, illustrated in Figure 3b, demonstrates that the manufacturer garners the greatest benefit, followed by the airline; whereas the government achieves the least. Initially, this mode enables the manufacturer to attain optimal profitability when faced with minimal delayed effects. However, as the delayed effects increase, their revenues start to decline and fall below those of airlines, before gradually dropping even further below government revenues. These findings depicted in Figure 3a,b, demonstrate that an increase in delayed effects benefits airlines and the government, while adversely affecting the manufacturer. Moreover, it is evident that the benefits to the manufacturer diminish as the delayed effects increase.
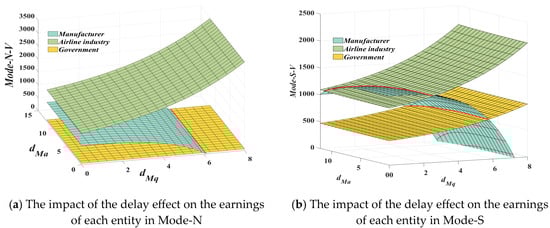
Figure 3.
The impact of and on the profits of each entity.
The above analysis, combined with the previous formula derivation, reveals the existence of a threshold for delayed effects in the Nash non-cooperative mode. When and occur, the revenue of the manufacturer is lower than that of the airline but higher than that of the government; whereas and demonstrate that manufacturers earn less than the airline and the government. This is because an increase in the delayed effects will increase the efforts of electric aircraft manufacturers in technology development and marketing to mitigate the adverse impacts, which will have a positive effect on the revenue of airlines and governments. This implies that longer R&D cycles for complex digital technologies might, counter-intuitively, benefit other stakeholders in the short term. In cost-sharing mode, appropriate delayed effects are beneficial for the electric aircraft to improve its endurance level and promotion. However, prolonged delays can adversely affect manufacturer revenue. When and are used, the revenue of the manufacturer is lower than that of airlines, but higher than that of governments. However, when and are used, the manufacturer gains relatively less than the government. This is because the delayed effects in implementation allow manufacturers to enhance their technological R&D and marketing efforts. However, the benefits of excessively long delayed effects cannot compensate for the costs incurred by the manufacturer to support airlines and the government regarding energy conservation, emissions reduction, and infrastructure construction. Consequently, returns decrease persistently.
Figure 4a,b are divided into three regions respectively (Region I indicates that the manufacturer does not undertake cost-sharing.), describing the trend of the endurance level of AEA change with the increase in the cost coefficient of the charging infrastructure by the government and the cost coefficient of promotion for the manufacturer . Due to the cost-sharing mode, the manufacturer should bear a portion of the airline and government costs; the initial value in this mode is determined by factors denoted as and . Consequently, with the increase of and , showed a steady upward trend in both Nash non-cooperative mode and collaborative mode. Moreover, in the collaborative cooperation mode is always higher than Nash non-cooperative mode. Although decays in the collaborative cooperation mode, in region II of Figure 3a (entering region II when ), it is higher than the Nash non-cooperative mode and the cost-sharing mode, while in region III (entering region III when ), it is lower than both. In Figure 3b, when is in region II, the cost-sharing mode is higher than the cooperative mode and the Nash non-cooperative mode. When (entering region III), the cooperative mode still maintains its advantage. It can be seen that the cost-sharing mode has a high in the early stage of cooperation, but it needs to help the airline and the government share part of the cost; the high research and development cost leads to the negative return of the mode to .
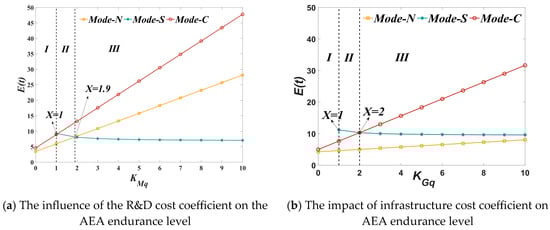
Figure 4.
Influence of and on (β = 0.3).
Figure 5a,b are obtained by adjusting the impact of the government’s efforts on the endurance of AEA (change to ). By comparing Figure 4a,b, it can be observed that the cost-sharing mode is more effective in enhancing the research and development level of AEA when the promotion cost pressure is low (when and , in region I). However, as the promotion cost increases to a threshold and exceeds ( and in region III), Nash non-cooperative mode and collaborative cooperation mode will exceed the cost-sharing mode. The cost threshold will move backward with the increase in the impact of the government’s efforts on the endurance of all-electric aircraft , thus expanding the advantage range of cost-sharing mode.
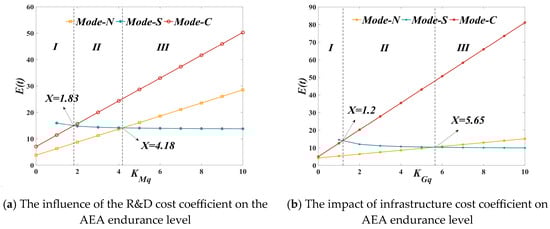
Figure 5.
Influence of and on ().
Figure 6a is partitioned into four distinct regions, whereas Figure 6b can be divided into three regions (Region I indicates that the manufacturer does not undertake cost-sharing), as shown in Figure 6. In the cost-sharing mode, the manufacturer assumes a portion of the costs incurred by both the airline and government entities; thus, the initial value of the mode commences at and . In Figure 6a, despite a high level of consumer preferences in the cost-sharing mode, an increase in the cost coefficient of promotion for the manufacturer leads to a gradual decline in consumer preferences (when enters area II). This decline is slower compared to the collaborative cooperation mode in region III (when ), but greater than that observed in the Nash non-cooperative mode. Eventually, it reaches its lowest level in region IV (when ). In Figure 6b, in cost-sharing mode exhibits a gradual decrease in region II (when ), which is less pronounced than that observed in collaborative cooperation mode. Furthermore, the level of continuously decreases in region III (when ), albeit at a slower rate compared with the Nash non-cooperative mode. This is attributed to the imperative for manufacturers to actively promote their products, as the impact on remains relatively gradual despite potential increases in . However, if the cost coefficient of carbon emission reduction for the airline continues to escalate, it will exert greater cost pressure on the manufacturer. In cost-sharing mode, declines faster. Under the collaborative cooperation mode, the three parties form a community of shared interests, enabling them to bear costs collectively and leverage resources and information. This collaboration facilitates economies of scale and scope, enhances product R&D efficiency, and boosts market competitiveness, even in scenarios with increasing cost coefficients.
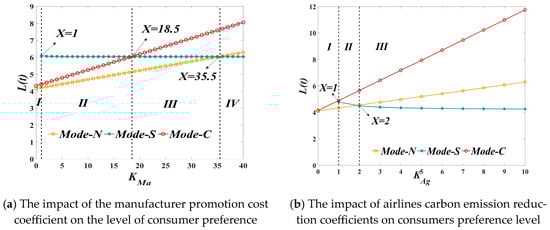
Figure 6.
Influence of and on ().
The influence coefficient of airline carbon reduction efforts on consumer preferences for AEA (adjusted from to ) is shown in Figure 7. By comparing it with Figure 6, we observe that the selection rate of the collaborative cooperation mode and Nash non-cooperative mode is influenced by this coefficient. As the coefficient increases, the evolution rates of both modes accelerate. However, the cost-sharing mode mitigates the interference effect caused by an increase in this coefficient and exhibits the greatest stability among the three modes.
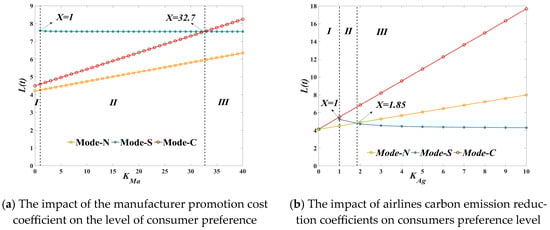
Figure 7.
Influence of and on ().
The results presented in Figure 8 demonstrate that across various cooperative modes, the AEA exhibits optimal steady-state values for both the endurance level of the AEA and consumer preferences of the AEA . Notably, the cost-sharing mode exhibits higher optimal steady-state values than both the Nash non-cooperative and collaborative cooperation modes. The decay rate of the cost-sharing mode exhibited a significantly lower magnitude than that of the Nash non-cooperative mode before reaching the steady state. The evolution trend of and over time, under the three modes, was influenced by the initial values of and , as depicted in Figure 8. Higher values of and exhibited a decay with time, whereas lower values increased over time, eventually converging to the steady-state level. The steady-state values of and are independent of their initial values and , but solely determined by the cooperative mode. Specifically, in the cost-sharing mode, the steady-state values of and reach their maximum, whereas in the Nash non-cooperative mode, they reach their minimum. Compared with the cost-sharing mode, and of electric aircraft in the Nash non-cooperative and collaborative cooperation modes declined the fastest and grew the slowest. The lack of formal commercial use, coupled with uncertain safety and market demand, has led airlines and governments to adopt a cautious approach towards AEA adoption and airport infrastructure redevelopment. Within the framework of the Nash non-cooperative mode, manufacturers, airlines, and governments prioritize their own interests without establishing trust or effective communication channels, resulting in a prisoner’s dilemma. In the collaborative cooperation mode, although these three parties can be considered part of the same department, their costs and revenues differ, leading to a free-rider mentality. However, by implementing the cost-sharing mode, in which the manufacturer provides subsidies to the airline and the government as followers while assuming leadership roles, the investment risks for both parties are reduced to some extent. This approach also enhances the motivation of airlines and governments to promote green emission-reduction initiatives and the development of charging infrastructure.
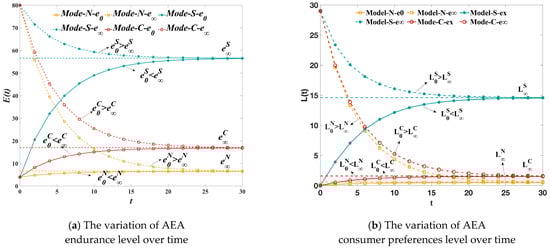
Figure 8.
Time trajectory of and under three mechanisms.
The endurance level of the AEA in the three modes gradually increases over time and eventually stabilizes at a consistent value, as shown in Figure 9a (Mode-N = 15.17, Mode-C = 31.30, Mode-S = 107.13). The endurance level of AEA gradually increased as the delayed effects were extended. Compared to the impact of delay, there was an improvement in the final stability value of the endurance level of the AEA. In Figure 9b, the level of consumer preference in both the Nash non-cooperative mode and cost-sharing mode gradually decreases and approaches a stable value (Mode-N = 1.38, Mode-C = 2.65, Mode-S = 15.26). As shown in Figure 8, the level of consumer preference exhibits an upward trend only in the cost-sharing mode. Consistent with the conclusions, the superiority of cost-sharing mode was confirmed. Moreover, as the delayed effects of consumer preference increases, its degree shows a slowly increasing trend.
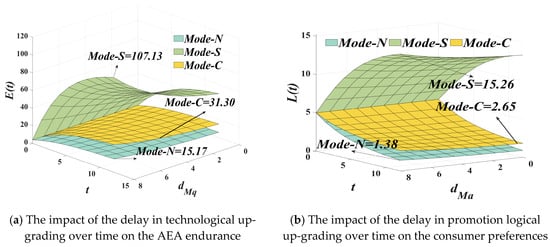
Figure 9.
Influence of and on and optimal trajectories.
The evolution trend of the endurance level of AEA with the initial value and time under delay and immediate effects is illustrated in Figure 10a,b. Similarly, the evolution trends of with and under delay and immediate effects are shown in Figure 11b. This can be observed in Figure 10 and Figure 11; across all three modes, when falls below the equilibrium value, initially increases before stabilizing over time. Conversely, when exceeded the equilibrium value, it first decreased before reaching a stable state at the equilibrium value. Furthermore, a larger gap between the initial and equilibrium values results in faster growth (or decline).
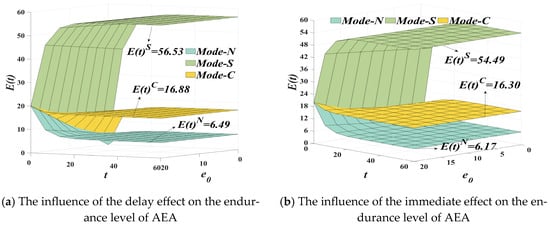
Figure 10.
Comparison of changes under delayed effects and timely effects.
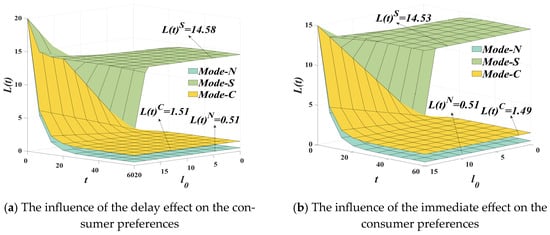
Figure 11.
Comparison of changes under delayed effects and timely effects.
According to Figure 10a and Figure 11a, in the Nash non-cooperative mode, and reach equilibrium at 6.49 and 0.51, respectively. In the cost-sharing mode, the equilibrium values increase to 56.53 for and 14.58 for , whereas in the collaborative cooperation mode, they stabilize around 16.88 for and 1.51 for . It is evident that when both and are low, adopting the Nash non-cooperative mode can enhance these factors. When and are at moderate levels, the adoption of a collaborative cooperation mode can effectively facilitate the enhancement of both and . This suggests that collaborative cooperation can moderately incentivize manufacturers, airlines, and governments to make concerted efforts. When the initial values for and are high, it is imperative to implement a cost-sharing mode to further elevate both and . As depicted in Figure 10b and Figure 11b, the immediate impact leads to the attainment of equilibrium between and in Nash non-cooperative mode, with values stabilizing at 6.17 and 0.51, respectively; similarly, in cost-sharing mode, their equilibrium values converge at 54.49 and 14.53. The state of equilibrium is achieved at levels of 16.30 and 1.49.
By comparing Figure 10 and Figure 11, it can be seen that compared with the immediate effect, the existence of a delayed effects can promote and , but the is less than the of an electric aircraft. This is because the delayed effects may have allowed the manufacturer to achieve technological breakthroughs, thereby enhancing . Consumer acceptance of AEA is determined by factors such as safety, endurance, cost-effectiveness, and environmental awareness. After a prolonged observation period, the consumer preference shows a slight increase owing to the influence of delayed effects. In summary, compared to the immediate effects, although the improvement brought about by the delayed effects has a small degree of improvement in consumer preferences, it can also help the promotion of the manufacturer and the effort to reduce carbon emissions of airlines to a certain extent, expand market demand, and help the promotion of AEA.
5. Conclusions
With the continuous advancement of airlines and the subsequent expansion of transportation, the widespread utilization of FPA has significantly increased greenhouse gas emissions. In the face of global warming and the urgent need for sustainable development, mitigating these emissions within the airline sector has become a shared challenge for AEA manufacturers, airlines, and governments. This study argues that digitalization is a key enabler in this transition, while acknowledging that the popularization of digitalized AEA is a complex game-theoretic process. The endurance and performance of AEA, as well as the decision-making changes in stakeholders, are significantly influenced by the level of R&D undertaken by manufacturers in this field. The endurance of AEA and market preference towards AEA are determined by factors such as the level of digitalized R&D, carbon emission reduction efforts, and improvements in charging infrastructure. This study established a dynamic differential game model with delayed effects, the game process of a manufacturer, airline, and government is numerically simulated in Nash non-cooperative, cost-sharing, and collaborative cooperation modes. The results highlight the critical impact of time delays, inherent in digital technology development and market adoption, on the strategic choices of all parties. In our simulation results, the cost-sharing mode achieved the highest level of battery life and the steady-state value of consumer preference. They were 107.13 and 15.26, respectively, significantly higher than 31.30 and 2.65 of the collaborative cooperation model or 15.17 and 1.38 in the non-cooperative mode with NASH. Correspondingly, the battery life is approximately 7.06 times higher than that of the NASH non-cooperative mode. It is approximately 3.42 times higher than the collaborative mode. Consumer preferences have increased by approximately 11.06 times compared to the NASH non-cooperative model. It is approximately 5.76 times higher than the collaborative cooperation model. Based on the above results, this study further clarifies the optimal mode selection under different scenarios: When the delay effect is small and the government’s willingness to invest in infrastructure construction is high, the adoption of the cost-sharing model can effectively increase the steady-state values of the endurance level and consumer preference level of AEA, and improve the overall performance of AEA promotion. When the delay effect is high, the coordination cost of cooperation is high, and the uncertainty of returns is large, the NASH non-cooperative model is actually the best decision-making model, and in the short term, airlines will be the biggest beneficiaries. Furthermore, when the three parties do not have the conditions for cost-sharing due to their respective decision-making choices, the collaborative model can make the benefits of all parties more balanced and is suitable as a transitional choice towards a collaborative cooperation model.
For manufacturers of AEA, the adoption of a cost-sharing mode can effectively capitalize on their market dominance. In contrast, airlines can ensure stable profits by embracing the Nash non-cooperative mode. However, the government can achieve stable revenue growth by choosing any promotional model, but it cannot ensure their optimal benefits in the process of promoting AEA. Without considering the delayed effects of strategy implementation, the cost-sharing mode is the most preferred option. However, the Nash non-cooperative mode would become more advantageous when the delay time is significant.
The introduction of the delayed effects led to a gradual increase in the overall revenue generated under the Nash non-cooperative mode. When the marketing and R&D delays exceed approximately 4.58 and 5.49 model-time units, respectively (under the benchmark setting), the Nash non-cooperative mode becomes the optimal choice for AEA promotion; under smaller delays, the cost-sharing mode remains superior. The increase in delayed effects, although detrimental to the interests of the manufacturer, can enhance the endurance capabilities of AEA—potentially due to more mature digital technologies after a longer R&D period—and improve the steady-state value of consumer preferences. Moreover, it can also facilitate expeditious decision-making processes for both airlines and government entities. In Nash non-cooperation mode, airlines emerge as primary beneficiaries, whereas in cost-sharing mode with minimal delayed effects, manufacturers reap greater benefits.
This research carries out thorough deductions and simulation experiments under various scenarios; however, certain limitations that require further exploration should be noted. The model proposed in this study encompasses a business ecosystem that includes the manufacturer, airline, and government. However, the resistance arising from competition among the AEA, FPA and high-speed rail is not considered. Furthermore, AEA manufacturers could establish strategic alliances with companies or institutions other than the airlines, which may also have significant impacts on promoting AEA. Future research should also investigate the role of data as a strategic asset within this game, as digitalized aircraft will generate vast amounts of operational data that could create new value and influence stakeholder bargaining power. Future research should further investigate the collaborative optimization of digital R&D investment and market pricing of AEA with more intricate market competition and policy environments to enhance the applicability of the model in the context of the industry’s digital and sustainable transformation.
Author Contributions
Conceptualization and Design, L.T. and Q.W.; methodology, software, X.W. and K.W.; data collection, J.D.; writing—original draft, L.T.; writing—review and editing, Q.W. and K.W.; supervision, X.W. and J.D. All authors have read and agreed to the published version of the manuscript.
Funding
No funds were available for this study.
Institutional Review Board Statement
Not applicable.
Informed Consent Statement
Not applicable.
Data Availability Statement
No new data were created or analyzed in this study. Data sharing is not applicable to this article.
Conflicts of Interest
The authors declare no conflicts of interest.
Appendix A
According to the sufficient condition of static feedback equilibrium, it can be deduced that an optimal differential benefit function exists, satisfying the Hamilton–Jacobi–Bellman (HJB) equation. Consequently, the optimal control function for manufacturers, airline, and government can be formulated as:
Based on the findings of Ref. [], it is deducible that: , .
Where , , and are the optimal value functions of the three members in the Nash non-cooperative mode, using first-order optimality conditions at the right end of the Equations (A1)–(A3) we can get
By substituting (A4) into (A1)–(A3), we can get
Based on the structural characteristics of differential equation (, , ), it can be deduced that the bivariate linear equation represents a solution to the aforementioned Hamilton–Jacobi–Bellman (HJB) equation. Let us assume
By substituting (A8)–(A10) into (A5)–(A7), we can get
The parameters , , , , , , , , and can be calculated to be, respectively
By substituting (A14)–(A16) into (A11)–(A13), we can get Equations (14)–(16). Substituting (A14)–(A16) into (A4) we can get the manufacturers, airline, government and the overall benefits of the alliance under the mechanism as shown in Equations (14)–(16), respectively.
Substituting the (A14)–(A16) into Equations (1)–(3), we can get the technology level, standard market share and market demand of alliance products in the standard alliance under this mechanism as shown in Equations (18)–(20).
Appendix B
Table A1.
The first-order derivatives of the optimal strategy parameters for participants in a cost-sharing mode to be calculated.
Table A1.
The first-order derivatives of the optimal strategy parameters for participants in a cost-sharing mode to be calculated.
| Participant | Parameters | Calculated Results | Participant | Parameters | Calculated Results |
|---|---|---|---|---|---|
| The manufacturer | The manufacturer | ||||
| The airline | The government | ||||
Appendix C
Table A2.
Comparison of strategies under different game models.
Table A2.
Comparison of strategies under different game models.
| Strategy Selection | Participant | Calculated Results |
|---|---|---|
| Comparison of Nash non-cooperation mode and cost-sharing mode | Manufacturer | |
| Airline | ||
| Government | ||
| Comparison of Nash non-cooperation mode and cooperative cooperation mode | Manufacturer | |
| Airline | ||
| Government | ||
| Comparison of cost sharing mode and collaborative cooperation mode | Manufacturer | |
| Airline | ||
| Government |
Appendix D
Table A3.
Comparison of and under different game models.
Table A3.
Comparison of and under different game models.
| Strategy Selection | Parameters | Calculated Results |
|---|---|---|
| Comparison of Nash non-cooperation mode and cost-sharing mode | The endurance level | |
| The consumer preferences | ||
| Comparison of Nash non-cooperation mode and cooperative Cooperation mode | The endurance level | |
| The consumer preferences | ||
| Comparison of cost Sharing mode and collaborative cooperation mode | The endurance level | |
| The consumer preferences |
Based on the comparison results from the table, we can get , , combined with result 5, because , so , due to ,, the reason why . So is an increasing function of , which leads to . The same reasoning applies, ; assume , due to , , the reason why , so is an increasing function of which leads to , combined with the relevant conclusions of result 5, this shows that, , so .
Appendix E
To compare the overall returns of manufacturers, airline and the government under different models, one can calculate the difference in and then solve for the delay time by subtracting Equations (17) and (31) correspondingly to get
The condition for ensuring that the benefit under the cost-sharing mode exceeds the benefit under Nash’s non-cooperative mode is that each component must be greater than 0, we can get
To demonstrate the comparative advantages between the manufacturer and the government in the Nash non-cooperative mode, one can calculate the disparity of and subsequently determine the delay time by subtracting Equations (14) and (16) correspondingly
The condition for ensuring that the manufacturer’s revenue exceeds the airline’s revenue in the cost-sharing mode is to ensure that each component is greater than 0, we can get
To demonstrate the comparability between the manufacturer, airline, and government respective benefits in the cost-sharing mode with respect to and , as well as analyze their respective delays for comparison, we do the following. By subtracting Equations (28)–(30), we can obtain the corresponding results.
To satisfy that the manufacturer’s benefit is greater than the airline’s benefit in the cost-sharing mode, it is necessary to satisfy that each component is greater than 0, we can get:
Thresholds for manufacturer-airline delay times in a cost-sharing mode
Thresholds for manufacturer-government delay times under a cost-sharing mode
References
- Zhu, P.; Chen, X.; Zhang, Z.; Li, P.; Cheng, X.; Dai, Y. AI-driven hypergraph neural network for predicting gasoline price trends. Energy Econ. 2025, 151, 108895. [Google Scholar] [CrossRef]
- Buticchi, G.; Wheeler, P.; Boroyevich, D. The more-electric aircraft and beyond. Proc. IEEE 2023, 111, 356–370. [Google Scholar] [CrossRef]
- Zhu, P.; Hu, J.; Li, X.; Zhu, Q. Using blockchain technology to enhance the traceability of original achievements. IEEE Trans. Eng. Manag. 2023, 70, 1693–1707. [Google Scholar] [CrossRef]
- Brelje, B.J.; Martins, J.R. Electric, hybrid, and turboelectric fixed-wing aircraft: A review of concepts, models, and design approaches. Prog. Aerosp. Sci. 2019, 104, 1–19. [Google Scholar] [CrossRef]
- Baumeister, S.; Simić, T.K.; Ganić, E. Emissions reduction potentials in business aviation with electric aircraft. Transp. Res. Part D Transp. Environ. 2024, 136, 104415. [Google Scholar] [CrossRef]
- Blind, K.; Lorenz, A.; Rauber, J. Drivers for companies’ entry into standard-setting organizations. IEEE Trans. Eng. Manag. 2020, 68, 33–44. [Google Scholar] [CrossRef]
- Nadar, E.; Kaya, B.E.; Güler, K. New-product diffusion in closed-loop supply chains. Manuf. Serv. Oper. Manag. 2021, 23, 1413–1430. [Google Scholar] [CrossRef]
- Feichtinger, G.; Jørgensen, S. Differential game models in management science. Eur. J. Oper. Res. 1983, 14, 137–155. [Google Scholar] [CrossRef]
- Setu, S.; Strezov, V. Environmental impact assessment of α-spodumene production from Lithium mining in Australia. Resour. Conserv. Recycl. 2026, 225, 108601. [Google Scholar] [CrossRef]
- Yang, X.; Wen, H.; Liu, Y.; Huang, Y.; Zhang, Q.; Wang, W.; Zhang, H.; Fu, J.; Li, G.; Liu, Q.; et al. Lithium pollution and its associated health risks in the largest lithium extraction industrial area in China. Environ. Sci. Technol. 2024, 58, 11637–11648. [Google Scholar] [CrossRef] [PubMed]
- Ji, H.; Wang, J.; Ma, J.; Cheng, H.-M.; Zhou, G. Fundamentals, status and challenges of direct recycling technologies for lithium ion batteries. Chem. Soc. Rev. 2023, 52, 8194–8244. [Google Scholar] [CrossRef]
- Yang, X.; Zhang, H.; Liu, Q.; Jiang, G. The Li-ion battery industry and its challenges. Nat. Rev. Chem. 2025, 9, 497–498. [Google Scholar] [CrossRef]
- Liang, Y.; Zhang, W.; Li, C. Assessing the Deployment of Electric Aircraft from Energy, Environmental, and Economic Perspectives. Sustainability 2025, 17, 5453. [Google Scholar] [CrossRef]
- Viswanathan, V.; Knapp, B.M. Potential for electric aircraft. Nat. Sustain. 2019, 2, 88–89. [Google Scholar] [CrossRef]
- Hashemi, S.R.; Bahadoran Baghbadorani, A.; Esmaeeli, R.; Mahajan, A.; Farhad, S. Machine learning-based mode for lithium-ion batteries in BMS of electric/hybrid electric aircraft. Int. J. Energy Res. 2021, 45, 5747–5765. [Google Scholar] [CrossRef]
- Schäfer, A.W.; Barrett, S.R.H.; Doyme, K.; Dray, L.M.; Gnadt, A.R.; Self, R.; O’sullivan, A.; Synodinos, A.P.; Torija, A.J. Technological, economic and environmental prospects of all-electric aircraft. Nat. Energy 2019, 4, 160–166. [Google Scholar] [CrossRef]
- Talwar, C.; Joormann, I.; Ginster, R.; Spengler, T.S. How much can electric aircraft contribute to reaching the Flightpath 2050 CO2 emissions goal? A system dynamics approach for european short haul flights. J. Air Transp. Manag. 2023, 112, 102455. [Google Scholar] [CrossRef]
- Hızarcı, H.; Arifoğlu, U. Challenges with the electrification of aircraft for a sustainable and greener aviation. Int. J. Sustain. Aviat. 2023, 9, 58–72. [Google Scholar] [CrossRef]
- Mauler, L.; Duffner, F.; Zeier, W.G.; Leker, J. Battery cost forecasting: A review of methods and results with an outlook to 2050. Energy Environ. Sci. 2021, 14, 4712–4739. [Google Scholar] [CrossRef]
- Dühnen, S.; Betz, J.; Kolek, M.; Schmuch, R.; Winter, M.; Placke, T. Toward green battery cells: Perspective on materials and technologies. Small Methods 2020, 4, 2000039. [Google Scholar] [CrossRef]
- Wu, Y.; Li, X.; Zhang, C.; Wang, S. The impact of government subsidies on technological innovation of new energy vehicle enterprises: From the perspective of industry chain. Environ. Dev. Sustain. 2024, 26, 25589–25607. [Google Scholar] [CrossRef]
- Zhao, F.; Chen, K.; Hao, H.; Wang, S.; Liu, Z. Technology development for electric vehicles under new energy vehicle credit regulation in China: Scenarios through 2030. Clean Technol. Environ. Policy 2019, 21, 275–289. [Google Scholar] [CrossRef]
- Wang, K.H.; Umar, M.; Akram, R.; Caglar, E. Is technological innovation making world “Greener”? An evidence from changing growth story of China. Technol. Forecast. Soc. Change 2021, 165, 120516. [Google Scholar] [CrossRef]
- Han, J.; Guo, J.-E.; Cai, X.; Lv, C.; Lev, B. An analysis on strategy evolution of research & development in cooperative innovation network of new energy vehicle within policy transition period. Omega-Int. J. Manag. Sci. 2022, 112, 102686. [Google Scholar]
- Santos, G.; Rembalski, S. Do electric vehicles need subsidies in the UK? Energy Policy 2021, 149, 111890. [Google Scholar] [CrossRef]
- Yu, X.; Lan, Y.; Zhao, R. Strategic green technology innovation in a two-stage alliance: Vertical collaboration or co-development? Omega-Int. J. Manag. Sci. 2021, 98, 102116. [Google Scholar] [CrossRef]
- Li, H.; Li, Z.; Zhu, P. Digital platforms as enablers of circular economy practices: Insights from a Chinese province? Technol. Soc. 2026, 84, 103075. [Google Scholar] [CrossRef]
- Funke, S.Á.; Sprei, F.; Gnann, T.; Plötz, P. How much charging infrastructure do electric vehicles need? A review of the evidence and international comparison. Transp. Res. Part D Transp. Environ. 2019, 77, 224–242. [Google Scholar] [CrossRef]
- Barzkar, A.; Ghassemi, M. Components of electrical power systems in more and all-electric aircraft: A review. IEEE Trans. Transp. Electrif. 2022, 8, 4037–4053. [Google Scholar] [CrossRef]
- Fard, M.T.; He, J.B.; Huang, H.; Cao, Y. Aircraft distributed electric propulsion technologies—A review. IEEE Trans. Transp. Electrif. 2022, 8, 4067–4090. [Google Scholar] [CrossRef]
- Bakır, M.; Itani, N. Modelling behavioural factors affecting consumers’ intention to adopt electric aircraft: A multi-method investigation. Sustainability 2024, 16, 8467. [Google Scholar] [CrossRef]
- Esmaeili, M.; Anvari-Moghaddam, A.; Muyeen, S.M.; Peric, V.S. On the role of renewable energy policies and electric vehicle deployment incentives for a greener sector coupling. IEEE Access 2022, 10, 53873–53893. [Google Scholar] [CrossRef]
- Feng, R.; Liu, Y.; Li, M.; Zhou, F. Research on Autonomous Vehicle Technology Innovation Ecosystem in China Based on System Dynamics. Systems 2025, 13, 269. [Google Scholar] [CrossRef]
- Jiang, Z.; Xu, C. Policy incentives, government subsidies, and technological innovation in new energy vehicle enterprises: Evidence from China. Energy Policy 2023, 177, 113527. [Google Scholar] [CrossRef]
- Chen, Y.; Li, L. Incentive Contracts and Optimal Green Technology Choice: A Differential Game Analysis. J. Compet. 2025, 17, 285–309. [Google Scholar]
- Peeters, P.; Papp, B. Pathway to zero emissions in global tourism: Opportunities, challenges, and implications. J. Sustain. Tour. 2024, 32, 1784–1810. [Google Scholar] [CrossRef]
- Cai, R.; Zhang, T.; Wang, X.; Jia, Q.; Zhao, S.; Liu, N.; Wang, X. Evolutionary Game and Simulation Analysis of New-Energy Vehicle Promotion in China Based on Reward and Punishment Mechanisms. Mathematics 2024, 12, 2900. [Google Scholar] [CrossRef]
- Sun, H.; Liu, J.; Zhang, L. Differential game analysis of carbon emission reduction effect and price strategy considering government intervention and manufacturer competition. Manag. Decis. Econ. 2025, 46, 1146–1166. [Google Scholar] [CrossRef]
- Ruan, S.; Ma, Y.; Wei, Z.; Zhang, C.; Xiang, C. Data-Driven Cooperative Differential Game Based Energy Management Strategy for Hybrid Electric Propulsion System of a Flying Car. IEEE Trans. Intell. Transp. Syst. 2024, 25, 14770–14784. [Google Scholar] [CrossRef]
- Li, Z.; Yang, W.; Si, Y. Dynamic pricing and coupon promotion strategies in a dual-channel supply chain based on differential game. Kybernetes 2022, 51, 3201–3277. [Google Scholar] [CrossRef]
- Jørgensen, S.; Zaccour, G. A differential game of retailer promotions. Automatica 2003, 39, 1145–1155. [Google Scholar] [CrossRef]
- Xia, L.; Bai, Y.; Ghose, S.; Qin, J. Differential game analysis of carbon emissions reduction and promotion in a sustainable supply chain considering social preferences. Ann. Oper. Res. 2022, 310, 257–292. [Google Scholar] [CrossRef]
- Huang, X. Dynamic analysis of dual-market low-carbon supply chain: Considering government intervention and joint promotion. J. Clean. Prod. 2023, 411, 137361. [Google Scholar] [CrossRef]
- Wei, J.; Wang, C. Improving interaction mechanism of carbon reduction technology innovation between supply chain enterprises and government by means of differential game. J. Clean. Prod. 2021, 296, 126578. [Google Scholar] [CrossRef]
- Eisend, M.; Langner, T. Immediate and delay advertising effects of celebrity endorsers’ attractiveness and expertise. Int. J. Advert. 2010, 29, 527–546. [Google Scholar] [CrossRef]
- Zhou, Q.; Zhang, Y.; Yang, W.; Ren, L.; Chen, P. Value co-creation in the multinational technology standard alliance: A case study from emerging economies. Ind. Manag. Data Syst. 2022, 122, 2121–2141. [Google Scholar] [CrossRef]
- Nerlove, M.; Arrow, K.J. Optimal advertising policy under dynamic conditions. Economica 1962, 29, 129–142. [Google Scholar] [CrossRef]
- Ghosh, D.; Shah, J. A comparative analysis of greening policies across supply chain structures. Int. J. Prod. Econ. 2012, 135, 568–583. [Google Scholar] [CrossRef]
- Li, D. Dynamic optimal control of firms’ green innovation investment and pricing strategies with environmental awareness and emission tax. Manag. Decis. Econ. 2022, 43, 920–932. [Google Scholar] [CrossRef]
- Guo, H.; Zhang, L.; Zhang, Y.; Ren, Y.; Lian, X.; Zhang, R.; Ding, N. A differential game-based approach for school-enterprise collaborative R&D strategy on digital twin technology. IEEE Access 2020, 8, 188688–188698. [Google Scholar]
- Mei, Q.; Liu, S.; Zhang, J. Decision model for binary safety management behavior in a supply chain under digital scenarios: A study based on differential game theory. Heliyon 2024, 10, e26471. [Google Scholar] [CrossRef] [PubMed]
- Nair, A.; Narasimhan, R. Dynamics of competing with quality-and advertising-based goodwill. Eur. J. Oper. Res. 2006, 175, 462–474. [Google Scholar] [CrossRef]
- Andre, F.J.; Sokri, A.; Zaccour, G. Public disclosure programs vs. traditional approaches for environmental regulation: Green goodwill and the policies of the firm. Eur. J. Oper. Res. 2011, 212, 199–212. [Google Scholar] [CrossRef]
- Avogadro, N.; Redondi, R. Demystifying electric aircraft’s role in aviation decarbonization: Are first-generation electric aircraft cost-effective? Transp. Res. Part D Transp. Environ. 2024, 130, 104191. [Google Scholar] [CrossRef]
- Helmchen, F.; Armanini, S.F.; Hupfer, A. Exploring the design space for battery-electric aircraft for regional air transportation. CEAS Aeronaut. J. 2025, 1–17. [Google Scholar] [CrossRef]
- Zhao, C.; Ding, J.; Taghizadeh-Hesary, F.; Sun, H. Bilateral cooperation or complete autonomy? Research on the trade-in of NEV battery using a differential game with delay effect. Energy Sustain. Dev. 2025, 85, 101644. [Google Scholar] [CrossRef]
- Basin, M.; Rodriguez-Gonzalez, J.; Martinez-Zuniga, R. Optimal control for linear systems with time delay in control input. J. Frankl. Inst. 2004, 341, 267–278. [Google Scholar] [CrossRef]
Disclaimer/Publisher’s Note: The statements, opinions and data contained in all publications are solely those of the individual author(s) and contributor(s) and not of MDPI and/or the editor(s). MDPI and/or the editor(s) disclaim responsibility for any injury to people or property resulting from any ideas, methods, instructions or products referred to in the content. |
© 2025 by the authors. Licensee MDPI, Basel, Switzerland. This article is an open access article distributed under the terms and conditions of the Creative Commons Attribution (CC BY) license (https://creativecommons.org/licenses/by/4.0/).