Abstract
Clean air is listed by the United Nations under several Sustainable Development Goals. Particulate matter (PM2.5) and ground-level ozone (O3) are pollutants with severe public health and environmental impacts. In China, multiple fine-scale datasets integrating ground monitors, satellites, and chemical transport models have been developed to estimate PM2.5 and O3 concentrations, but differences between the fine-scale datasets complicate applications in exposure and policy research. This study presents the first systematic intercomparison of five PM2.5 datasets (V5.GL.03, Ma et al. 2021, Huang et al. 2021, CHAP, TAP) and two O3 datasets (CHAP, TAP) from 2014 to 2023, evaluated against ground-based observations at national, regional, and provincial levels. We present both operational (single time point) and dynamic (change over time) evaluations to understand how model results compare with observations for each year, and quantify the performances of the models in assessing long term changes in air quality. Results show nationwide declines in PM2.5 (by 22.1 µgm−3; regional range: 8.4–30.1 µgm−3) and O3 (by 28.5 µgm−3; regional range: 19.3–34.3 µgm−3). Operational and dynamic evaluation shows that CHAP consistently has higher R2 (greater than 0.7 in all regions) and lower errors (less than 3.7 µgm−3 in all regions) compared to other datasets across most years and regions for PM2.5. The same is true for TAP for O3 (R2 greater than 0.3 and ME less than 28.6 µgm−3 in all regions). However, the model performances vary spatially and temporally in alignment with several factors ranging from the number of observational monitors in a location, to recent changes in pollutant concentration levels, to extreme meteorological conditions. For example, higher predictive errors (>3.6 µgm−3) in operational evaluations are observed in all datasets for PM2.5 in the sparsely monitored northwest region. Similarly, we find higher errors (ME > 28.5 µgm−3) in all O3 datasets in the densely populated northern region, especially in the heavily industrialized Beijing–Tianjin–Hebei (BTH) area.
1. Introduction
Air pollution poses a significant environmental challenge that affects human health and ecosystems worldwide. Particulate matter with a diameter of 2.5 μm or less (PM2.5) and ground-level ozone (O3) are two major air pollutants of concern due to their detrimental effects on health [1,2,3]. The adverse impacts of PM2.5 and O3 have prompted extensive research to understand their spatial and temporal variations, with a particular focus on identifying trends to evaluate and inform public health research and air quality management decision-making [4,5,6]. To achieve this, reliable and accurate data products are required, which can be obtained through varied methods such as satellite measurements, chemical transport models, and ground-based observations.
In China, rapid industrialization and urbanization in the 1990s and 2000s resulted in severe air pollution [7], making it a region of great interest for studying PM2.5 and O3 trends. In recent years, significant advancements have been made in the development of data products for studying PM2.5 and O3 air quality trends [8,9,10,11]. Several monitoring networks and satellite-based remote sensing platforms have been deployed to collect air quality data across China [12,13].
Researchers have combined concentrations from ground-based monitors with satellite observations, chemical transport model output, land-use, and other spatial–temporal data to estimate PM2.5 and O3 concentrations on fine spatial and temporal scales. These products have been used in exposure and health impacts studies in China [14,15]. The datasets combine multiple inputs using varied approaches, including geographic regression, machine learning, and downscaling, but the precise input methods used differ between datasets [16]. In addition, temporal and spatial scales vary between datasets. With differences between values being reported by the products and via the approaches used to develop and evaluate them, it is difficult to identify which product is most appropriate for a given application.
To inform future research in this domain, we present a quantitative comparison of publicly available, fine-scale-modeled pollutant concentration datasets. While each dataset has previously been evaluated independently by its respective developers, to our knowledge, no evaluation has been conducted under a consistent framework. A prior study [17] evaluated the TAP and CHAP products for PM2.5; however, our analysis spans a longer time period and incorporates dynamic evaluation (i.e., the ability of the products to assess concentration changes across years). By comparing annually averaged modeled PM2.5 and O3 concentrations against observations at national, regional, and provincial levels, we have identified biases and factors contributing to the inconsistencies across datasets. The annual evaluation is designed to provide evidence to support annual epidemiological studies and annual ambient air quality standard assessments. By evaluating the strengths and limitations of these different data products, public health researchers and policymakers can make informed decisions regarding air quality management strategies and policies [18]. In the subsequent sections, we describe the materials and methods, results and discussions, limitations, and conclusions of our study.
2. Materials and Methods
2.1. PM2.5 and O3 Observations
The total number of observation monitors throughout the country has increased over time, with 937 monitors operating in 2014, 1486 in 2016, 1690 in 2020, and 2366 in 2023 (Figure S1). Hourly observations of PM2.5 and O3 were collected from China National Air Quality Monitoring Network [19] for the 2014–2023 period across all monitors nationwide and were averaged to create annual metrics.
2.2. Exposure Datasets
We investigate the following five fine-scale PM2.5 exposure datasets (Table 1): the Global/Regional estimates (V5.GL.03) (van Donkelaar et al. 2019) [20], the full-coverage 1 km daily ambient concentrations (Runmei Ma et al. 2021) [21], the high-resolution Spatiotemporal Modeling for Ambient PM2.5 Exposure Assessment dataset (Huang et al. 2021) [22], the CHAP (China High Air Pollutant (Wei et al. 2022) [23] dataset, and the TAP (Tracking Air Pollution) [24] dataset. The temporal resolution of the PM2.5 exposure datasets used for this evaluation study is annual. However, it is to be noted that TAP is also available at daily and monthly temporal resolutions for PM2.5. Two products (CHAP and TAP) estimated O3 concentrations (Table 2), and both products are at 10 × 10 km2 spatial resolution.

Table 1.
Description of PM2.5 concentration datasets used for intercomparison.

Table 2.
Description of O3 concentration datasets used for intercomparison. Summertime is defined as April–September.
The V5.GL.03 dataset features a spatial resolution of 0.1° × 0.1° and utilizes geographically weighted regression to integrate ground-based measurements, satellite data for aerosol optical depth (AOD), and simulation outputs from the GEOS-Chem chemical transport model. Ma et al. (2021) used a resolution of 1 km and employed a random forest model to merge ground-based measurements, satellite AOD data, GEOS-Chem simulation results, as well as meteorological, population, and economic data. Huang et al. (2021) used machine learning and downscaling techniques to combine ground-based measurements, satellite AOD data, and population and economic data. The CHAP dataset uses the “extra trees” machine learning model to combine ground-based observations, satellite data, and population and economic information. TAP employs a three-step data-fusion algorithm—random forest, elastic net, and spatiotemporal Kriging interpolation for estimating PM2.5 and O3 concentrations, with observations, satellite measurements, and CMAQ model output as inputs.
2.3. Geographical Provinces and Regions
2.4. Methods
We evaluate the annual average concentrations from each exposure dataset by comparing them against the observed pollutant concentrations in grid cells that contain monitors. We calculated normalized mean bias (NMB), normalized mean error (NME), mean bias (MB), mean error (ME), root mean squared error (RMSE), and correlation coefficient (R2). These metrics were chosen as they are the metrics used in the air quality model evaluation literature [25] (evaluation metric definition in Supplementary Materials).
We perform both operational and dynamic evaluation. For the former, we directly compare modeled results against corresponding observations in each year from 2014 to 2023 (some datasets do not extend to 2023). In the dynamic evaluation, we quantify how well the models capture the changes in pollutant concentrations over the study period. To perform the dynamic evaluation for the PM2.5 concentration, we have considered the change in PM2.5 concentrations between the starting year, 2014, and 2023. For each dataset, the difference in PM2.5 and O3 concentrations between these two years is compared against the observed difference in monitors operating in both years.
3. Results and Discussions
Across all monitors, the annually averaged daily PM2.5 decreased from 55.9 μgm−3 in 2014 to 32.8 μgm−3 in 2023. Summertime (April–September) MDA8h O3 concentrations decreased from 109.4 μgm−3 in 2014 to 85.1 μgm−3 in 2023. The two pollutants show slightly different trends, with O3 showing an increase of 7 μgm−3 from 2021 to 2023 (Figure 1).
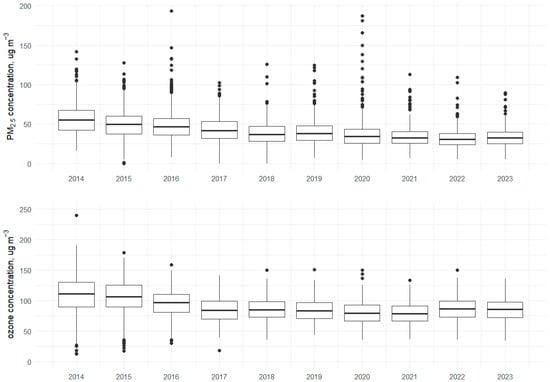
Figure 1.
Box plots showing observed annually averaged daily PM2.5 and annually averaged daily summertime MDA8h O3 concentrations over the study period (2014–2023).
In this section, we described the operational and dynamic evaluation. In each subsection, we first discuss PM2.5 evaluation, followed by the O3 evaluation.
3.1. Operational Evaluation
3.1.1. PM2.5
Across all exposure datasets, there is year-to-year variability in performance (Figure 2). Most datasets exhibit low bias and high correlation in 2016 and 2019–2022. CHAP consistently outperforms other models, showing a lower root mean square error (RMSE) and higher R2 (describing ability to capture spatial variability) across most years. Annual comparisons (Figure 2) indicate that predictive performance was notably worse in 2017 and 2018 compared to other years, except for that of TAP in 2023.
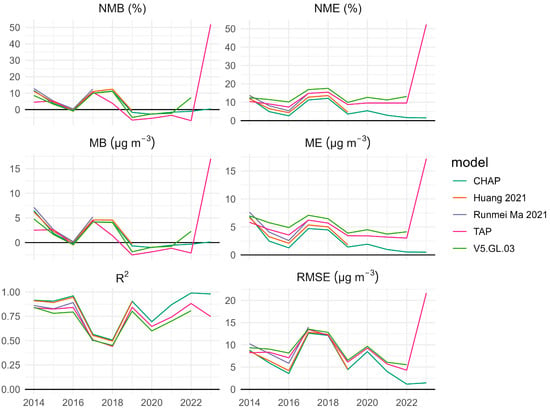
Figure 2.
Nationwide predictive performances of the modeled PM2.5 datasets across the study period against observations.
In average regional evaluations (Figure 3), CHAP consistently has the lowest error among the four datasets for all seven regions. The highest errors occur in the less populated desert regions of the northwest, while the lowest errors are observed in the densely populated southern region. Since 2014, all models have generally improved their predictive performance nationwide, with the only exception being TAP in 2023.
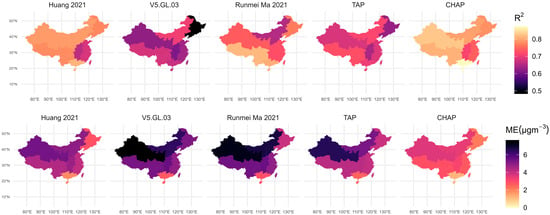
Figure 3.
Spatial plot showing predictive performance of the modeled PM2.5 datasets averaged across monitors in each region across the study period. Spatial plot showing predictive performance of the modeled PM2.5 datasets at for each province across the study period is provided in Supplementary Materials (Figure S2).
In northern China, Huang et al. (2021), Ma et al. (2021), and CHAP datasets demonstrate strong predictive performance with higher correlations and lower errors in the heavily populated industrious provinces of Beijing and Hebei (Figure S2). All datasets perform well in the Hebei province, with V5.GL.03 and TAP datasets demonstrating better performance in this province compared to their effectiveness in other regions. However, V5.GL.03 and TAP are still outperformed by Huang et al. (2021), Ma et al. (2021), and CHAP in Hebei. Tianjin province consistently ranks among the lowest-performing provinces across all datasets (Figure S2). This is because the predictive performance of the models varies widely across monitors in Tianjin. Poor predictive performance is observed throughout the years in Tianjin, with R2 values below 0.15 in 2015 and below 0.1 in 2018 for all datasets except TAP (Figure 3).
In the south, the Huang et al. (2021), Ma et al. (2021), and CHAP datasets exhibit the best predictive performance for Guangxi (Figure S2). While Huang et al. (2021), Ma et al. (2021), and TAP perform well in Hainan, V5.GL.03 shows a notably low average correlation coefficient (0.24), with R2 values below 0.1 from 2014 to 2018, although with a low average observed mean error (2.04 µg/m3). This suggests that while the dataset can predict average PM2.5 concentrations, it is less able to represent temporal variations in these regions.
In northwestern provinces such as Hebei and Shaanxi, V5.GL.03 and TAP datasets yield lower errors and higher correlations than they do in most other provinces, although they do not outperform the other datasets. Xinjiang stands out by having higher mean errors and higher correlations across all datasets (Figure 3). This implies that although the models can capture relative spatial variations in pollutant concentrations, they are less adept at predicting absolute magnitudes of PM2.5 concentrations. The limited number of observation stations (≤175) and their sparse distribution in the northwest region may have contributed to poor performances in this region.
Both Henan in central China and Zhejiang in the east appear as low-performing regions in multiple datasets (Figure 3). In Henan, northern cities face heavy primary PM2.5 pollution, while southern areas show more secondary aerosols; ozone peaks in summer, and winter stagnation worsens PM2.5 levels [26]. Zhejiang’s air quality is similarly affected by emissions and meteorology, with pollutants showing time lags and strong correlations with temperature, humidity, and wind [27]. Both provinces exhibit spatial heterogeneity and dynamic pollutant behavior, making modeling difficult.
3.1.2. Ozone
Annual comparisons (Figure 4) indicate that the bias and error of both O3 datasets compared to observations increased over time, particularly since 2017. Despite a considerable increase in the mean error for both models—22.77 µg/m3 for TAP (2014–2023) and 27.52 µg/m3 for CHAP (2014–2020)—TAP’s correlation coefficients remain relatively stable (0.7 < R2 < 0.8), while CHAP’s correlation improved from 0.47 in 2014 to 0.69 in 2020. The lowest errors for both datasets occurred in 2016, while TAP recorded its highest error in 2019 and CHAP in 2020.
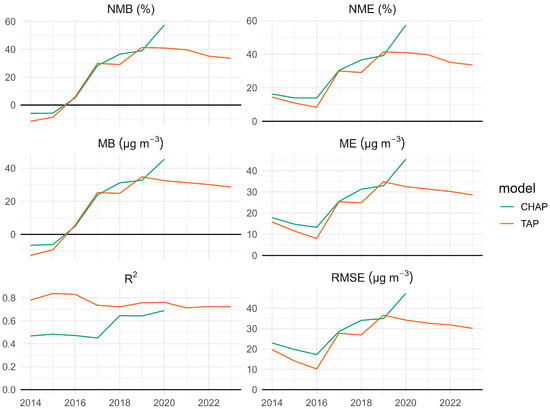
Figure 4.
Nationwide predictive performances of the modeled ozone datasets across the study period.
Averaged across regions, TAP exhibits lower errors and higher correlations in each region compared to CHAP (Figure 5). Both TAP and CHAP exhibit higher mean errors but also higher correlations relative to other regions in the Xinjiang province in the northwest (Figure S3), potentially due to the low number of available monitors (53 monitors in 2023). Contrarily, in the southwest, both datasets show relatively low errors and high correlations in the provinces of Tibet (22 monitors in 2023) and Yunnan (52 monitors in 2023), although their year-to-year performance fluctuates. However, both datasets record lower correlations in Guizhou (40 monitors in 2023).
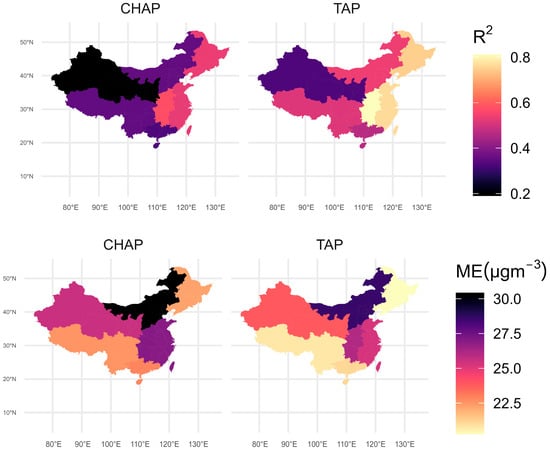
Figure 5.
Spatial plot depicting the predictive performance of modeled ozone datasets for each region across the study period. The spatial plot showing the predictive performance of the modeled O3 datasets at for each province across the study period is provided in Supplementary Materials (Figure S3).
In the northern region, both TAP and CHAP exhibit high errors and low correlation in the province of Beijing, which has 12–24 monitors (Figure S3), particularly after 2017. The average mean error for TAP increases from 17.24 µg/m3 (2014–2016) to 41.46 µg/m3 (2017 onward). The mean error for CHAP also increases, from 17.74 µg/m3 (2014–2016) to 48.14 µg/m3 (2017 onward). TAP’s spatial correlation in Beijing is <0.1 for all years except 2015, 2016, and 2020. Similar trends are also observed in Hebei, with a sharp increase in mean error after 2017—an increase of 24.97 µg/m3 for TAP and 27.33 µg/m3 for CHAP from the 2014–2016 baseline.
In the province of Shanghai in the east (N = 19 monitors in 2023), CHAP has low correlation coefficients (R2 ≤ 0.1) in six of the seven years of the study period. The same is observed for TAP, with R2 ≤ 0.1 for 2021–2023. Like the trends observed in other densely populated regions, higher errors and lower R2 values are also seen in Zhejiang in the east and Henan in the central region, across both TAP and CHAP (Figure S3).
3.2. Dynamic Evaluation
Below, we present evaluations of the models to capture changing concentrations between two years. This is a stringent but worthwhile test. While the results may differ across different years, the selected years capture a span of large changes in China’s air quality. Evaluation is performed only for monitors in 2014 and 2023 for PM2.5, and 2014 and 2020 for O3. The results of this evaluation can inform research into the changing concentrations and their root causes.
3.2.1. PM2.5 Concentration Changes from 2014 to 2023
Between 2014 and 2023, PM2.5 concentrations decreased across most of China (Figure 6), with reductions exceeding 85 µgm−3 observed in monitoring stations in Shandong (east) and Hebei (north). The reduction in PM2.5 concentrations can be attributed to the implementation of several policies by the Chinese government, including the Air Pollution Prevention and Control Action plan (APPCAP) implemented in 2013 and the Beijing–Tianjin–Hebei Cooperative Development of Eco-environmental Protection Planning implemented in 2015 [28]. However, some areas in the country experienced increases, with monitors in Shaanxi (northwest) recording rises as high as 18.5 µgm−3 (here, possibly attributable to expansion of coal power plants [29], in contrast to stricter air pollution regulations in industrial provinces like Beijing and Hebei.
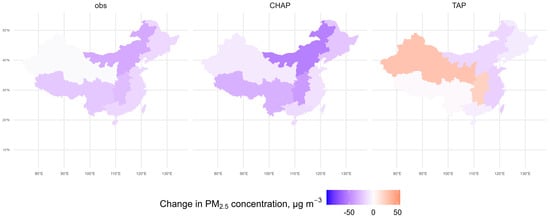
Figure 6.
Change in observed and modeled PM2.5 concentrations (µgm−3) between 2014 and 2023.
Regionally, the largest PM2.5 reductions occurred in the north (30 µg/m3), central (28 µg/m3), and east (25.7 µg/m3). The northwest saw the smallest reduction (8.4 µg/m3). The densely populated and industrial Beijing–Tianjin–Hebei (BTH) region recorded the most substantial decline, with each district showing reductions of over 37 µg/m3. In contrast, the island province of Hainan (south) experienced the smallest decrease at 4.8 µg/m3.
Nationwide, 0.98 µg/m3. At the provincial level (Figure S4), CHAP outperforms TAP in every province, achieving very high correlation (R2 > 0.9) in nine provinces, regardless of geographic location, emission sources, or population density. Both TAP and CHAP capture observed changes more accurately in the southwest. In Henan (central) and Chongqing (southwest), TAP incorrectly predicts PM2.5 decreases instead of the observed increases.
CHAP shows the highest correlation (0.92) for the northern region, accurately reflecting the significant PM2.5 decline there (Figure 7). Both TAP and CHAP accurately capture PM2.5 changes in Inner Mongolia, making it one of the best-performing provinces for both models. The central region also saw a huge PM2.5 reduction (28 µg/m3), but dataset performance varies. CHAP maintains a high correlation, while TAP struggles in some provinces. CHAP achieves a high correlation (>0.9) for several provinces in the eastern region, with TAP and CHAP both performing particularly well in Shanghai, accurately capturing the observed PM2.5 changes.
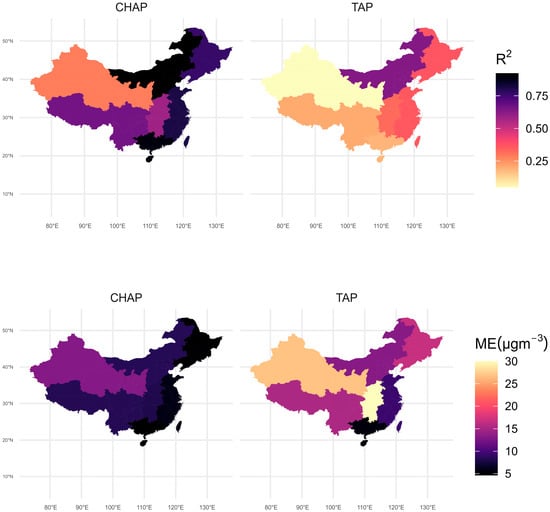
Figure 7.
Spatial plot showing mean error (µgm−3) and correlation coefficients of modeled PM2.5 datasets capturing the change in PM2.5 concentration between the years 2014 and 2023 for each region.
In contrast, in the northwest region, where the PM2.5 concentration reduction was minimum, both datasets exhibit the highest errors and lowest correlation with observations (change from 2014 to 2023). Both CHAP and TAP underestimate the PM2.5 increases in Shaanxi, with biases of 16.7 µg/m3 (CHAP) and 14.6 µg/m3 (TAP), respectively. Additionally, TAP incorrectly predicts PM2.5 decreases in the provinces of Xinjiang and Ningxia rather than the observed increases. However, both datasets show high accuracy in predicting PM2.5 trends in Hainan in the south, which also recorded a minimal PM2.5 decrease.
3.2.2. O3 Concentration Changes from 2014 to 2020
Between 2014 and 2020, annual average O3 concentrations decreased by 28.5 µg/m3 across China (Figure 8). Despite the overall decline, the changes in O3 concentrations were highly non-uniform. Regionally, O3 concentrations decreased the most in the south (34.5 µg/m3) and the least in the central region (19.3 µg/m3). Among provinces, the largest reduction occurred in Beijing (65.47 µg/m3), while the largest increase was recorded in Anhui (15.42 µg/m3). Qinghai remained relatively stable. Significant reductions (>90 µg/m3) were also observed in Jiangsu, Liaoning, and Shandong. In contrast, Anhui and Shanxi experienced increases of over 60 µg/m3. Some monitors in Shaanxi, Zhejiang, and Xinjiang recorded almost no change (<±0.3 µg/m3).
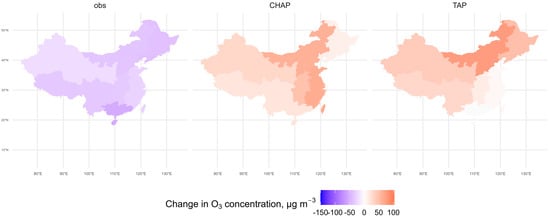
Figure 8.
Change in observed and modeled O3 concentrations (µgm−3) between 2014 and 2020.
Both TAP and CHAP are highly biased in their changes from 2014 to 2020 at monitor locations, with mean errors of 48.1 µg/m3 and 54.7 µg/m3, respectively. TAP exhibited a higher correlation coefficient (R2 = 0.46) and a lower mean error (47.61 µg/m3) compared to CHAP in detecting nationwide O3 concentration changes from 2014 to 2020. Across individual regions, TAP generally had higher correlation coefficients, except in the southwest, where CHAP had a lower mean error, though both models had comparable correlations (Figure 9). In Fujian (east) and Hunan (central), where O3 trends were inconsistent—with some stations recording increases and others decreases—TAP demonstrated a high correlation in predicting concentration changes (Figure S5). Although TAP showed consistent positive bias in O3 concentration changes at all monitors, the average mean bias was lower for stations showing an increase than for those showing a decrease.
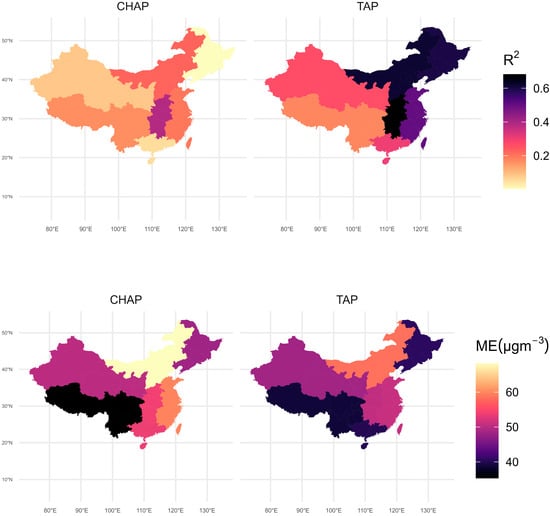
Figure 9.
Spatial plot showing mean error (µgm−3) and correlation coefficients of modeled O3 datasets capturing the change in O3 concentration between the years 2014 and 2020 for each region.
In northern China, the Beijing–Tianjin–Hebei (BTH) area saw substantial O3 reductions from 2014 to 2020. Instead of detecting the observed decrease, both models incorrectly predicted an increase in O3 concentrations (Figure 9). This overprediction is true for 2018 and 2019 as well. Both TAP and CHAP also overpredicted O3 concentrations in the remote provinces of Hainan in the south, and Tibet and Yunnan in the southwest. However, the mean error remained low in these provinces due to the limited number of operational monitors (<10) in both 2014 and 2020. Similarly, in the northwest, despite an overall overprediction, CHAP exhibited higher correlation in Ningxia and Qinghai, where the number of operational monitors were only seven and three, respectively (Figure S5).
4. Limitations
This study has a few limitations. The model evaluations use ground observations, but certain regions have very few monitors. Most public observation stations are primarily grouped in economically developed and densely populated areas like the BTH area [17]. Satellite data for aerosol optical depth (AOD) is important for assimilating data in places where ground observations are unavailable [17,30]. However, severe pollution episodes like sandstorms might hinder accurate AOD estimations [30]. We find that the regional medians of error metrics (MB, ME, RMSE, R2) for operational and dynamic evaluations are moderately correlated (R2 ≤ 0.3 for both PM2.5 and O3) with the number of observations in each region), suggesting that future efforts for developing these products should explore model improvements in regions with few monitors.
Without the underlying models and their input datasets, we cannot ascertain reasons behind the superior or poor performances of the models in specific regions with certainty. However, previous research has shown that the accuracy and uncertainty of model performances vary with spatial resolution and that an increase in the spatial density of monitoring stations and data samples leads to the enhanced accuracy of model predictions [23,30]. Other factors affecting model performances are spatial heterogeneity and biases in supplementary input variables like meteorological, vegetation, and population data [17,30]. The higher accuracy exhibited by CHAP in predicting PM2.5 concentrations in China has been previously attributed to its machine learning algorithm as compared to other models that use meteorological-input-driven numeric models (like TAP) [17]. However, it has also been discussed that machine learning based algorithms benefit from dense measurement networks, potentially pointing to impacts on the prediction accuracy of CHAP in areas with few ground observations or biased AOD measurements [23,30].
To overcome the challenges in making accurate predictions, previous studies have suggested a few solutions, which include improving the accuracy and spatial coverage of AOD datasets [17], increasing the spatial scale from station-based validation studies to regional or national, such that the sample size is larger [30], and incorporating ensemble model learning [23].
5. Conclusions
Operational evaluation for PM2.5 shows that CHAP consistently outperforms other datasets across most years and regions, demonstrating lower errors (less than 3.7 µgm−3 in all regions) and higher correlations (greater than 0.7 in all regions). However, regional variations exist, with the highest predictive errors in the sparsely populated northwest and the lowest in the densely populated south. This result aligns with previous studies [17,30] completed for the years 2017–2022 at monthly scale and 2000–2020 across all temporal scales (daily to annual), respectively. While datasets generally perform well in Beijing, Hebei, Shaanxi, and Guangxi, challenges remain in Tianjin, Henan, and Zhejiang. Certain dataset limitations, such as GWR’s spatial smoothing in V5.GL.03, limit the ability to identify localized air quality variations [20].
Operational evaluation for O3 shows that TAP demonstrates lower errors (less than 28.6 µgm−3) and higher correlations (greater than 0.3) compared to CHAP, across all regions. While CHAP’s correlation improves in some regions (e.g., central China), this comes at the cost of increased errors. Both datasets have higher correlation coefficients and lower errors for the lesser populated provinces of Tibet and Yunnan. The opposite is seen for the heavily populated provinces of Beijing, Hebei, Guizhou, and Shanghai, where both datasets exhibit high errors and low correlations. We also find that, since 2017, mean errors have increased across all provinces, significantly impacting Beijing and Hebei. TAP remains the most reliable model nationwide, with its lowest error in Tibet (10.74 µg/m3) and highest in Beijing (34.19 µg/m3).
Overall, PM2.5 concentrations declined in most of China from 2014 to 2023, with the largest reductions in the north, central, and east regions, and the smallest decrease in the northwest. Dynamic evaluation for PM2.5 shows that CHAP consistently outperforms TAP, with higher correlation and lower errors across all regions. The northern region experienced the largest PM2.5 drop (30 µg/m3), and CHAP achieved the highest correlation (0.92) here. The northwest saw the smallest reduction (8.4 µg/m3) and exhibited the highest dataset errors and lowest correlations. Alternative datasets like V5.GL.03 perform best in stable regions (e.g., northwest) but struggle to capture rapid changes elsewhere. We also find that TAP struggles to capture dynamic changes in PM2.5 concentrations in certain provinces (e.g., Shaanxi, Xinjiang, Chongqing, Ningxia, and Henan) by incorrectly predicting PM2.5 decreases where increases were observed. Contrary to PM2.5, the dynamic evaluation of O3 shows that TAP more accurately captured changes in O3 concentrations across most geographical regions in China, except in the southwest, where CHAP had a lower error.
Previous research [31] has shown that reducing bias in air pollution exposure products are unlikely to reduce bias substantially in derived large-scale air pollution health effects. Having more training than prediction monitors in urban areas (or fewer) often leads to increased differential errors in model exposure products, which leads to stronger bias in health effect estimates derived from these products [31]. However, as data products are widely used in epidemiological and risk assessment studies [32,33], as well as for policy analysis [34], researchers seeking to reduce bias particularly in local scale exposures and health outcomes should be aware of their limitations, in order to minimize uncertainties in their analyses. By improving understanding of uncertainties in air pollution models, our study contributes to more accurate exposure assessments and policy evaluations, thereby supporting sustainability goals through targeted emission controls, public health protection, and evidence-based environmental management.
Supplementary Materials
The following supporting information can be downloaded at: https://www.mdpi.com/article/10.3390/su172210059/s1. Figure S1. No. monitors in the years 2014-2023; Table S1. Total number of observation monitors located in each province by year; Table S2. Description of geographical regions by provinces in each region; Table S3. Model evaluation metrics for operational evaluation. P represents predicted exposure, O represents observations, and N represents the number of comparisons; Table S4. Model evaluation metrics for dynamic evaluation. P represents predicted exposure, O represents observations, and N represents the number of comparisons. Δ denotes the dynamic version of each metric; Figure S2: Spatial plot for operational evaluation showing predictive performance of the modeled PM2.5 datasets for each province level across the study period; Figure S3: Spatial plot for operational evaluation depicting predictive performance of modeled ozone datasets for each province across the study period; Figure S4. Spatial plot for dynamic evaluation showing mean error (µgm−3) and correlation coefficients of modeled PM2.5 datasets capturing the change in PM2.5 concentration between the years 2014 and 2023 for each province; Figure S5. Spatial plot for dynamic evaluation showing mean error (µgm−3) and correlation coefficients of modeled O3 datasets capturing the change in O3 concentration between the years 2014 and 2020 for each province.
Author Contributions
S.G.: Writing—original draft, Visualization, Validation, Methodology, Investigation, Formal analysis, Data curation. L.R.F.H.: Writing—review and editing, Supervision, Resources, Project administration, Methodology, Investigation, Funding acquisition, Conceptualization. All authors have read and agreed to the published version of the manuscript.
Funding
Research described in this article was conducted under contract to the Health Effects Institute (HEI), an organization jointly funded by the United States Environmental Protection Agency (EPA) (Assistance Award No. CR 83998101) and certain motor vehicle and engine manufacturers. The contents of this article do not necessarily reflect the views of HEI, or its sponsors, nor do they necessarily reflect the views and policies of the EPA or motor vehicle and engine manufacturers.
Institutional Review Board Statement
Not applicable.
Informed Consent Statement
Not applicable.
Data Availability Statement
Data will be made available on request.
Conflicts of Interest
The authors declare no conflicts of interest. The funders had no role in the design of the study; in the collection, analyses, or interpretation of data; in the writing of the manuscript; or in the decision to publish the results.
References
- Schwartz, J.; Laden, F.; Zanobetti, A. The concentration-response relation between PM(2.5) and daily deaths. Environ. Health Perspect. 2002, 110, 1025–1029. [Google Scholar] [CrossRef] [PubMed]
- Atkinson, R.W.; Yu, D.; Armstrong, B.G.; Pattenden, S.; Wilkinson, P.; Doherty, R.M.; Heal, M.R.; Anderson, H.R. Concentration–Response Function for Ozone and Daily Mortality: Results from Five Urban and Five Rural U. K. Populations. Environ. Health Perspect. 2012, 120, 1411–1417. [Google Scholar] [CrossRef] [PubMed]
- Ren, M.; Fang, X.; Li, M.; Sun, S.; Pei, L.; Xu, Q.; Ye, X.; Cao, Y. Concentration-Response Relationship between PM2.5 and Daily Respiratory Deaths in China: A Systematic Review and Metaregression Analysis of Time-Series Studies. BioMed Res. Int. 2017, 2017, 5806185. [Google Scholar] [CrossRef]
- Lang, P.E.; Carslaw, D.C.; Moller, S.J. A trend analysis approach for air quality network data. Atmos. Environ. X 2019, 2, 100030. [Google Scholar] [CrossRef]
- Wolf, M.J.; Esty, D.C.; Kim, H.; Bell, M.L.; Brigham, S.; Nortonsmith, Q.; Zaharieva, S.; Wendling, Z.A.; de Sherbinin, A.; Emerson, J.W. New Insights for Tracking Global and Local Trends in Exposure to Air Pollutants. Environ. Sci. Technol. 2022, 56, 3984–3996. [Google Scholar] [CrossRef] [PubMed]
- Tu, P.; Tian, Y.; Hong, Y.; Yang, L.; Huang, J.; Zhang, H.; Mei, X.; Zhuang, Y.; Zou, X.; He, C. Exposure and Inequality of PM2.5 Pollution to Chinese Population: A Case Study of 31 Provincial Capital Cities from 2000 to 2016. Int. J. Environ. Res. Public Health 2022, 19, 12137. [Google Scholar] [CrossRef]
- Mou, Y.; Song, Y.; Xu, Q.; He, Q.; Hu, A. Influence of Urban-Growth Pattern on Air Quality in China: A Study of 338 Cities. Int. J. Environ. Res. Public. Health 2018, 15, 1805. [Google Scholar] [CrossRef]
- Yu, J.; Song, C.H.; Lee, D.; Lee, S.; Kim, H.S.; Han, K.M.; Park, S.; Im, J.; Park, S.-Y.; Jeon, M.; et al. Synergistic combination of information from ground observations, geostationary satellite, and air quality modeling towards improved PM2.5 predictability. npj Clim. Atmos. Sci. 2023, 6, 41. [Google Scholar] [CrossRef]
- Li, T.; Yang, Q.; Wang, Y.; Wu, J. Joint estimation of PM2.5 and O3 over China using a knowledge-informed neural network. Geosci. Front. 2023, 14, 101499. [Google Scholar] [CrossRef]
- Li, T.; Cheng, X. Estimating daily full-coverage surface ozone concentration using satellite observations and a spatiotemporally embedded deep learning approach. Int. J. Appl. Earth Obs. Geoinf. 2021, 101, 102356. [Google Scholar] [CrossRef]
- Wang, W.; Zhao, S.; Jiao, L.; Taylor, M.; Zhang, B.; Xu, G.; Hou, H. Estimation of PM2.5 Concentrations in China Using a Spatial Back Propagation Neural Network. Sci. Rep. 2019, 9, 13788. [Google Scholar] [CrossRef]
- Ma, Z.; Dey, S.; Christopher, S.; Liu, R.; Bi, J.; Balyan, P.; Liu, Y. A review of statistical methods used for developing large-scale and long-term PM2.5 models from satellite data. Remote Sens. Environ. 2022, 269, 112827. [Google Scholar] [CrossRef]
- Wang, Z.; Ma, P.; Zhang, L.; Chen, H.; Zhao, S.; Zhou, W.; Chen, C.; Zhang, Y.; Zhou, C.; Mao, H.; et al. Systematics of atmospheric environment monitoring in China via satellite remote sensing. Air Qual. Atmos. Health 2021, 14, 157–169. [Google Scholar] [CrossRef]
- Wang, C.; Wang, Y.; Shi, Z.; Sun, J.; Gong, K.; Li, J.; Qin, M.; Wei, J.; Li, T.; Kan, H.; et al. Effects of using different exposure data to estimate changes in premature mortality attributable to PM2.5 and O3 in China. Environ. Pollut. 2021, 285, 117242. [Google Scholar] [CrossRef]
- Wang, Q.; Wang, J.; He, M.Z.; Kinney, P.L.; Li, T. A county-level estimate of PM2.5 related chronic mortality risk in China based on multi-model exposure data. Environ. Int. 2018, 110, 105–112. [Google Scholar] [CrossRef] [PubMed]
- Berrocal, V.J.; Guan, Y.; Muyskens, A.; Wang, H.; Reich, B.J.; Mulholland, J.A.; Chang, H.H. A comparison of statistical and machine learning methods for creating national daily maps of ambient PM2. 5 concentration. Atmos. Environ. 2020, 222, 117130. [Google Scholar] [CrossRef]
- Di, Y.; Gao, X.; Liu, H.; Li, B.; Sun, C.; Yuan, Y.; Ni, Y. Accuracy assessment on eight public PM2.5 concentration datasets across China. Atmos. Environ. 2024, 338, 120799. [Google Scholar] [CrossRef]
- O’Dell, K.; Kondragunta, S.; Zhang, H.; Goldberg, D.L.; Kerr, G.H.; Wei, Z.; Henderson, B.H.; Anenberg, S.C. Public Health Benefits from Improved Identification of Severe Air Pollution Events with Geostationary Satellite Data. GeoHealth 2024, 8, e2023GH000890. [Google Scholar] [CrossRef]
- Real-time data-China National Environmental Monitoring Center. China National Air Quality Monitoring Network. Available online: https://quotsoft.net/air/ (accessed on 10 July 2024).
- van Donkelaar, A.; Martin, R.V.; Li, C.; Burnett, R.T. Regional Estimates of Chemical Composition of Fine Particulate Matter Using a Combined Geoscience-Statistical Method with Information from Satellites, Models, and Monitors. Environ. Sci. Technol. 2019, 53, 2595–2611. [Google Scholar] [CrossRef] [PubMed]
- Ma, R.; Ban, J.; Wang, Q.; Zhang, Y.; Li, T. Full-coverage 1 km daily ambient PM2.5 and O3 concentrations of China in 2005–2017 based on multi-variable random forest model. Earth Syst. Sci. Data 2022, 14, 943–954. [Google Scholar] [CrossRef]
- Huang, C.; Hu, J.; Xue, T.; Xu, H.; Wang, M. High-Resolution Spatiotemporal Modeling for Ambient PM2.5 Exposure Assessment in China from 2013 to 2019. Environ. Sci. Technol. 2021, 55, 2152–2162. [Google Scholar] [CrossRef]
- Wei, J.; Li, Z.; Li, K.; Dickerson, R.R.; Pinker, R.T.; Wang, J.; Liu, X.; Sun, L.; Xue, W.; Cribb, M. Full-coverage mapping and spatiotemporal variations of ground-level ozone (O3) pollution from 2013 to 2020 across China. Remote Sens. Environ. 2022, 270, 112775. [Google Scholar] [CrossRef]
- TAP. Dataset. Available online: http://tapdata.org.cn/?page_id=127&lang=en (accessed on 17 November 2024).
- Henneman, L.R.F.; Liu, C.; Hu, Y.; Mulholland, J.A.; Russell, A.G. Air quality modeling for accountability research: Operational, dynamic, and diagnostic evaluation. Atmos. Environ. 2017, 166, 551–565. [Google Scholar] [CrossRef]
- Shen, F.; Ge, X.; Hu, J.; Nie, D.; Tian, L.; Chen, M. Air pollution characteristics and health risks in Henan Province, China. Environ. Res. 2017, 156, 625–634. [Google Scholar] [CrossRef] [PubMed]
- Chen, Y.; Zang, L.; Du, W.; Xu, D.; Shen, G.; Zhang, Q.; Zou, Q.; Chen, J.; Zhao, M.; Yao, D. Ambient air pollution of particles and gas pollutants, and the predicted health risks from long-term exposure to PM2.5 in Zhejiang province, China. Environ. Sci. Pollut. Res. 2018, 25, 23833–23844. [Google Scholar] [CrossRef]
- Zheng, H.; Li, S.; Jiang, Y.; Dong, Z.; Yin, D.; Zhao, B.; Wu, Q.; Liu, K.; Zhang, S.; Wu, Y.; et al. Unpacking the factors contributing to changes in PM2.5-associated mortality in China from 2013 to 2019. Environ. Int. 2024, 184, 108470. [Google Scholar] [CrossRef]
- Cui, R.Y.; Hultman, N.; Cui, D.; McJeon, H.; Yu, S.; Edwards, M.R.; Sen, A.; Song, K.; Bowman, C.; Clarke, L.; et al. A plant-by-plant strategy for high-ambition coal power phaseout in China. Nat. Commun. 2021, 12, 1468. [Google Scholar] [CrossRef]
- Xun, N.; Zhang, X.; Zhang, H.; Su, C.; Liu, Y.; Guo, H.; Hou, X. Multiscale applicability assessment of PM2.5 datasets in Chinese urban agglomerations: Accuracy, spatiotemporal variability, and uncertainty. Environ. Pollut. 2025, 383, 126810. [Google Scholar] [CrossRef]
- Vlaanderen, J.; Portengen, L.; Chadeau-Hyam, M.; Szpiro, A.; Gehring, U.; Brunekreef, B.; Hoek, G.; Vermeulen, R. Error in air pollution exposure model determinants and bias in health estimates. J. Expo. Sci. Environ. Epidemiol. 2019, 29, 258–266. [Google Scholar] [CrossRef] [PubMed]
- Evaluating the Impact of Long-Term Exposure to Fine Particulate Matter on Mortality Among the Elderly|Science Advances. Available online: https://www-science-org.mutex.gmu.edu/doi/10.1126/sciadv.aba5692 (accessed on 17 November 2024).
- Di, Q.; Wang, Y.; Zanobetti, A.; Wang, Y.; Koutrakis, P.; Choirat, C.; Dominici, F.; Schwartz, J.D. Air Pollution and Mortality in the Medicare Population. N. Engl. J. Med. 2017, 376, 2513–2522. [Google Scholar] [CrossRef]
- Gilmore, E.A.; Heo, J.; Muller, N.Z.; Tessum, C.W.; Hill, J.D.; Marshall, J.D.; Adams, P.J. An inter-comparison of the social costs of air quality from reduced-complexity models. Environ. Res. Lett. 2019, 14, 074016. [Google Scholar] [CrossRef]
Disclaimer/Publisher’s Note: The statements, opinions and data contained in all publications are solely those of the individual author(s) and contributor(s) and not of MDPI and/or the editor(s). MDPI and/or the editor(s) disclaim responsibility for any injury to people or property resulting from any ideas, methods, instructions or products referred to in the content. |
© 2025 by the authors. Licensee MDPI, Basel, Switzerland. This article is an open access article distributed under the terms and conditions of the Creative Commons Attribution (CC BY) license (https://creativecommons.org/licenses/by/4.0/).