Abstract
Sustainable practices are increasingly recognized as critical drivers of business performance in contemporary markets. This study examines the influence of Circular Economy (CE), Eco-Innovation (EI), and Sustainable Marketing (SM) on Business Performance (BP) among micro, small, and medium-sized enterprises (MSMEs) located in Aguascalientes, Mexico, a representative emerging-economy context within Latin America. The relationships among these constructs were analyzed using Partial Least Squares Structural Equation Modeling (PLS-SEM) in SmartPLS 4.0. Results show that CE significantly drives both EI and SM, and that EI positively influences BP. However, the direct effect of SM on BP was marginal, indicating that its contribution to business performance is weaker than that of circular and eco-innovative practices in the analyzed sample. Among CE dimensions, enablers were the strongest driver of circular adoption, while in EI, adoption incentives exerted the greatest influence. This research contributes to the sustainability and management literature by rigorously analyzing and comparing the relative impact of different sustainability-oriented strategies—circular, innovative, and marketing-based—on business performance. By examining how these strategies interact and differ in their effects, the study offers evidence-based guidance for MSMEs with limited resources to prioritize initiatives with greater potential to enhance competitiveness. The proposed integrated CE–EI–SM–BP framework, validated through a predictive PLS-SEM approach (PLSpredict), provides robust empirical evidence from an underexplored emerging-economy context. The results also open avenues for future research to examine contextual or temporal factors influencing the effectiveness of sustainability-based strategies.
1. Introduction
The involvement of companies in the climate crisis is far from negligible, as is their influence on global climate policies to serve their own interests. However, the international climate paradigm decentralizes governance and grants firms a more proactive role in driving sustainable transitions. Achieving the goal of limiting the global temperature increase to below 2 °C relative to pre-industrial levels largely depends on political will and institutional capacity, which vary widely across nations [].
Improving the business environment can enhance carbon efficiency by promoting green technology innovation and fostering new ventures. Governments play a crucial role by providing fiscal incentives, improving financing channels, and establishing fast-track procedures for green technology implementation, enabling the rapid application of innovative solutions to improve carbon efficiency []. Such technological progress reduces fossil energy consumption, optimizes pollution control, and contributes directly to firms’ energy efficiency [,].
The Circular Economy (CE) has gained prominence as a model that is more efficient and sustainable in the long term compared to the traditional linear “take–produce–dispose” approach []. At the micro level, various Circular Business Models (CBMs) help firms integrate circular principles into production and operational processes []. At the meso level, inter-firm collaboration occurs through the exchange of residual materials that become inputs for other companies—a practice referred to as industrial ecology or industrial symbiosis [,].
Investment in Eco-Innovation (EI) represents a key strategy for advancing the transition toward a circular economy and contributing to climate-mitigation goals. EI enhances resource-use efficiency, reduces costs, and strengthens firms’ environmental reputation. However, the adoption of such practices can be limited by financial, regulatory, and cultural barriers, as well as by institutional and market pressures that determine the speed and scope of implementation [,].
Meanwhile, Sustainable Marketing (SM) encompasses practices aimed at creating value for environmentally conscious consumers while generating social and environmental benefits. This discipline seeks to educate customers and stakeholders, foster continuous improvement, and consolidate a sustainable corporate culture that reflects political, cultural, environmental, and social considerations [].
Business Performance (BP) captures firms’ internal and external outcomes, reflecting both operational efficiency and their capacity to adapt to regulatory, technological, and market changes. Effective adoption of CE, EI, and SM has the potential to strengthen BP, generating sustainable competitive advantages and organizational resilience.
Despite extensive literature addressing sustainability-oriented strategies, prior studies have often analyzed CE, EI, and SM separately, providing limited understanding of their combined and comparative influence on BP. Research on the Circular Economy remains fragmented across disciplines and lacks integrative approaches that connect it with innovation and management perspectives []. Likewise, studies on Circular Economy and innovation have largely focused on technological and operational aspects, with limited consideration of broader strategic functions such as marketing or stakeholder engagement []. This gap is particularly relevant for micro, small, and medium-sized enterprises (MSMEs) operating in emerging economies, where limited resources require careful prioritization of sustainability investments.
Accordingly, this research contributes to the sustainability and management literature by rigorously analyzing the joint and relative effects of CE, EI, and SM on BP, providing empirical evidence from MSMEs located in Aguascalientes, Mexico. The proposed framework is empirically tested through a quantitative modeling approach that evaluates the relationships among these sustainability-oriented strategies and their influence on business performance. This analysis provides a robust basis for identifying which practices most effectively enhance competitiveness and long-term performance in resource-constrained business environments.
The involvement of companies in the climate crisis is far from negligible, as is their influence on global climate policies to serve their own interests. However, the international climate paradigm decentralizes global governance, granting firms a more proactive role. Achieving the goal of limiting the global temperature increase to below 2 °C relative to pre-industrial levels largely depends on state political will, as countries differ in capacities, resources, cultures, and commitment to environmental preservation [].
Improving the business environment can enhance carbon efficiency by promoting green technology innovation and fostering new ventures. In this context, governments play a crucial role by providing fiscal incentives, improving financing channels, and establishing fast-track procedures for green technology implementation, enabling the rapid application of innovative solutions to improve carbon efficiency []. Such technological progress can reduce fossil energy consumption, optimize pollution control, and directly contribute to firms’ energy efficiency [,].
CE has gained prominence as a model that is more efficient and sustainable in the long term compared to the traditional linear “take-produce-dispose” approach []. At the micro level, various Circular Business Models (CBM) have been developed to assist firms in integrating circular principles into their production and operational processes []. At the meso level, inter-firm collaboration is analyzed through the exchange of residual materials, which are reused as inputs by other companies—a practice referred to as industrial ecology or industrial symbiosis [,].
Therefore, investment in EI represents a key strategy to lead the transition toward a circular economy and contribute to climate mitigation goals. Eco-innovation enhances resource-use efficiency, reduces costs, and strengthens firms’ environmental reputation. However, the adoption of these practices can be limited by financial, regulatory, and cultural barriers, which affect companies’ proactivity in addressing environmental challenges [].
Meanwhile, SM encompasses practices aimed at creating value for conscious consumers, while delivering societal and environmental benefits. This discipline seeks to educate customers and stakeholders, foster continuous improvement, and consolidate a sustainable corporate culture, taking into account political, cultural, environmental, and social factors [].
Finally, BP constitutes a comprehensive measure of firms’ internal and external outcomes, reflecting both operational efficiency and the capacity to adapt to regulatory, technological, and market changes. Effective adoption of CE, EI, and SM has the potential to strengthen BP, generating sustainable competitive advantages and organizational resilience.
Overall, this study aims to identify and analyze gaps in the adoption of CE, EI, and SM strategies in the business sector and their impact on BP. These gaps represent critical points that can be addressed to optimize decision-making, mitigate climate change effects, and maximize positive socio-economic outcomes. The research proposes an analytical framework to facilitate the implementation of sustainable practices and contribute to the development of more resilient and environmentally responsible business models.
2. Theoretical Framework and Hypotheses
2.1. Circular Economy (CE) and Eco-Innovation (EI)
CE represents a systemic production and consumption model that promotes resource efficiency, waste reduction, and the regeneration of materials through reuse, recycling, and remanufacturing []. This transition from linear to circular systems inherently stimulates innovation by requiring the redesign of products, processes, and organizational structures to close material loops and achieve sustainability objectives [,].
EI emerges as a natural outcome of circular practices, as firms adopting CE principles must develop technological and managerial innovations to minimize waste and optimize resource use [,]. The integration of CE and EI enhances firms’ adaptability and environmental performance by fostering continuous improvement, efficiency, and cleaner production []. Moreover, external institutional and market pressures—such as regulatory frameworks, customer expectations, and cultural norms—can amplify this relationship by incentivizing innovation and accelerating the adoption of circular practices [,].
Thus, based on this theoretical reasoning, the following is proposed as the first hypothesis of this study:
H1.
CE positively and significantly influences EI.
2.2. Eco-Innovation (EI) and Business Performance (BP)
EI is increasingly recognized as a dynamic capability that enables firms to achieve both environmental excellence and superior financial outcomes. By fostering technological advancement, process optimization, and product redesign, EI enhances operational efficiency, reduces costs, and opens new market opportunities—ultimately improving overall BP [,]. From a strategic standpoint, EI also strengthens firms’ adaptive capacity and promotes knowledge creation and organizational learning, which are essential for sustaining competitive advantage in turbulent environments [,].
Empirical research consistently supports the positive association between EI and BP across diverse contexts. Majid et al. [] demonstrated that eco-efficiency and environmental innovation significantly enhance profitability and growth among European SMEs, while Pyagay et al. [] found that eco-innovative strategies contribute to resilience and long-term competitiveness in resource-constrained firms. Beyond operational outcomes, EI enhances corporate reputation, legitimacy, and stakeholder trust—intangible assets that strengthen firms’ market positioning and profitability []. Institutional and market pressures, including environmental regulations, industry standards, and growing consumer awareness, further reinforce this relationship by compelling firms to innovate and align sustainability with competitiveness [].
However, the strength of the EI–BP relationship remains context-dependent. In MSMEs, where financial and technological resources are limited, EI typically results in incremental rather than radical gains. Nevertheless, these cumulative improvements contribute meaningfully to productivity, competitiveness, and the integration of environmental and economic objectives [,].
Accordingly, and grounded in the preceding theoretical and empirical discussion, the following hypothesis is formulated:
H2.
EI positively and significantly influences BP.
2.3. Circular Economy (CE) and Sustainable Marketing (SM)
CE provides a systemic foundation for integrating sustainability into firms’ strategic and communicative functions. By promoting resource regeneration, waste minimization, and value retention, CE drives firms to reconsider not only their production processes but also how they deliver and communicate value to stakeholders [,]. This shift from a linear to a circular mindset requires transparent communication of environmental practices, product life cycles, and recycling initiatives, positioning marketing as a key mechanism to reinforce sustainability-oriented behavior [].
SM translates the operational principles of CE into strategies that foster consumer awareness, trust, and engagement. Firms implementing CE are encouraged to adopt marketing practices that highlight environmental performance and circular commitment, thereby differentiating themselves in increasingly sustainability-driven markets [,]. By linking marketing with CE, organizations can enhance brand legitimacy and reputational capital, creating long-term value for both customers and society. Furthermore, external factors such as environmental labeling systems, supply chain audits, and institutional regulations amplify this alignment by rewarding firms that credibly communicate their environmental contributions [].
Drawing upon the conceptual arguments presented above, the study posits the following hypothesis:
H3.
CE positively and significantly influences SM.
2.4. Sustainable Marketing (SM) and Business Performance (BP)
SM plays a pivotal role in translating environmental and social values into business outcomes. By integrating ethical principles, transparency, and stakeholder engagement into marketing practices, firms strengthen their legitimacy and long-term reputation, which are essential drivers of BP [,]. SM enables organizations to differentiate themselves in competitive markets by aligning their communication and brand identity with sustainability values, thereby enhancing consumer trust and loyalty [,].
Empirical research has demonstrated that sustainability-oriented marketing strategies foster reputational capital and stakeholder satisfaction, which in turn contribute to superior performance outcomes [,]. Firms that authentically communicate their sustainability initiatives often achieve improved customer retention, employee commitment, and access to new market segments []. However, the tangible impact of SM on BP may be contingent upon contextual variables such as industry type, market maturity, and the degree of institutional support []. In markets where sustainability awareness remains limited, SM tends to generate reputational rather than immediate financial benefits, reinforcing its role as a long-term rather than a short-term performance driver.
In light of the preceding discussion and supporting evidence, the following hypothesis is suggested:
H4.
SM positively and significantly influences BP.
2.5. Circular Economy (CE) and Business Performance (BP)
CE serves as a strategic framework that enhances both environmental and economic performance by promoting efficiency, innovation, and value retention throughout the production and consumption cycles. By reducing resource dependency, minimizing waste, and stimulating closed-loop processes, CE directly improves operational productivity and cost effectiveness, leading to superior BP [,]. From a strategic perspective, CE fosters long-term competitiveness by encouraging firms to innovate across supply chains, strengthen collaboration, and develop adaptive business models that align sustainability with profitability [,].
Empirical studies have consistently reported the positive influence of CE adoption on BP. Firms that integrate circular practices achieve not only economic gains but also intangible benefits such as enhanced brand reputation and stakeholder trust [,]. By embedding CE principles into their core strategies, organizations can improve market resilience, comply with environmental regulations, and anticipate shifts in consumer behavior []. Nonetheless, the magnitude of CE’s contribution to BP may depend on contextual factors, particularly regulatory support, technological readiness, and consumer engagement, that condition the effectiveness of circular initiatives [].
Consequently, considering the integrated framework and theoretical rationale, the following hypothesis is proposed:
H5.
CE positively and significantly influences BP.
2.6. Research Model and Hypotheses
As shown in Figure 1, the Theoretical Model illustrates the hypothesized relationships between Circular Economy, Eco-Innovation, Sustainable Marketing, and Business Performance.
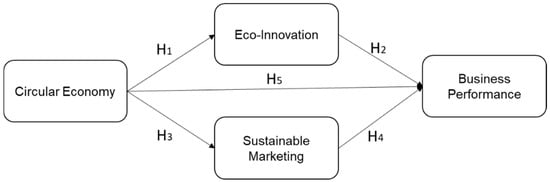
Figure 1.
Theoretical Model. Source: Authors’ own elaboration.
In summary, the theoretical and empirical evidence presented supports the proposed model, linking Circular Economy, Eco-Innovation, and Sustainable Marketing to firm performance. This integration provides a structured framework for analyzing how strategic circular practices, eco-innovations, and sustainable marketing contribute to business competitiveness and environmental responsibility, offering a comprehensive basis for testing the research hypotheses.
3. Methods, Materials, and Data Sources
3.1. Research Design
The methodology is based on a scientific procedure designed to generate consistent and relevant data, which strengthens the understanding of the phenomenon under study, validates results, refines theoretical constructs, and facilitates the practical application of knowledge [].
3.2. Population and Sampling
The sectors included in this study are wholesale trade, manufacturing, and the food and beverage industry. These sectors were chosen because they represent economic activities with significant environmental impact and, according to the Ellen MacArthur Foundation [], require prioritized adaptation to circular economy models.
The geographic scope of the analysis unit corresponds to the state of Aguascalientes, Mexico. To determine the population of the sectors under study, data from the most recent official records of companies in the region were used, classified by size, sector, and commercial activity. A finite population formula was applied to calculate the sample, as the total number of units in the three subdivisions forming the analysis unit was available, with the following characteristics.
Based on the contextualization presented, the population comprises three subdivisions determined according to the National Statistical Directory of Economic Units []. The first includes 5823 SMEs in the manufacturing sector; the second comprises 2298 SMEs in wholesale trade; and the third consists of 405 SMEs in accommodation and food and beverage services. Together, these three categories constitute a total population of 8526 economic units.
With a 95% confidence level and a 5% margin of error, the corresponding sample was calculated, resulting in a total of 368 sampling units, as shown in Table 1.

Table 1.
Sample Calculation Using the Finite Population Formula.
Since the analysis unit is composed of three subdivisions, the obtained sample was proportionally stratified across the selected sectors to ensure greater data consistency and guarantee the coherence of the results (see Table 2).
Table 2.
Proportional Stratification of the Analysis Unit.
The number of firms selected from each sector was determined by applying the corresponding percentage of participation shown in Table 2 to the total sample size (n = 368). Accordingly, 182 firms were drawn from the manufacturing industry (49.45%), 100 from wholesale trade (27.17%), and 86 from accommodation and food & beverage services (23.36%). This proportional allocation ensured that the representation of each sector in the sample accurately reflected its relative weight in the total population of 8526 economic units.
3.3. Data Collection Procedures
The data collection followed a multistage process to ensure methodological rigor and data quality. First, the questionnaire was designed using validated scales identified in prior studies, organized by construct, and coded by dimension. A pilot test with 15 entrepreneurs and 5 academic or industry experts was conducted to refine wording, clarify instructions for the 5-point Likert scale, and adjust terminology. After validation, a professional agency carried out the survey. Using the National Statistical Directory of Economic Units (DENUE) as the sampling frame, a proportionally stratified random sampling technique was applied to select firms from manufacturing, wholesale trade, and food and beverage sectors, according to their relative representation. Surveys were administered via face-to-face and telephone interviews with owners, directors, or senior managers. Participation was voluntary and confidential. The data collection took place during the third quarter of 2023, over a period of three months.
3.4. Measurement Instrument
The instrument measured the four variables of the research model: CE, EI, SM, and BP. Table 3 presents the structure of the questionnaire, including the variables, their dimensions, and the total number of items.
Table 3.
Structure of the Data Collection Instrument.
Subsequently, two analytical procedures were performed. The first focused on verifying the validity and reliability of the questionnaire, essential aspects for ensuring the methodological robustness of the measurement instrument []. The second involved the application of Structural Equation Modeling (SEM), a statistical technique that enables the simultaneous estimation of multiple dependency relationships, making it an appropriate approach for the purposes of this study [].
The complete list of measurement items used in the questionnaire is presented in Appendix A.
3.5. Reliability and Validity Assessment
To ensure the quality of the collected data, reliability and validity tests were conducted, as these constitute essential indicators for evaluating measurement instruments. The most commonly applied indices include Cronbach’s alpha, the Composite Reliability Index (CRI), and the Average Variance Extracted (AVE). For data obtained via Likert-type scales, the ordinal alpha method is considered one of the most accurate approaches, as it improves the reliability estimation for polytomous variables [].
All Cronbach’s alpha (α) values were higher than 0.70, confirming the internal consistency of the scales []. Likewise, the CR values exceeded 0.70, indicating measurement stability and surpassing the thresholds recommended in the recent literature []. Regarding convergent validity, all AVE values were greater than 0.50, confirming that the constructs explained an adequate proportion of variance in their indicators. All factor loadings were statistically significant (p < 0.001), confirming the validity of the measurement model (Table 4).
Table 4.
Summary of Reliability and Validity Indices.
Discriminant validity was assessed following the procedures recommended by Fornell and Larcker [] and Henseler et al. [], using the Fornell–Larcker criterion and the Heterotrait–Monotrait (HTMT) ratio. These analyses were performed to ensure that each construct was empirically distinct from the others and that the measurement model satisfied discriminant validity requirements. Additionally, the model’s predictive relevance was evaluated through the PLSpredict procedure to assess out-of-sample predictive power [].
The detailed results of the discriminant validity analysis, including the Fornell–Larcker and HTMT matrices, are presented in Appendix B (Table A5 and Table A6).
4. Results
4.1. Measurement Model Assessment
The measurement model was evaluated using Partial Least Squares Structural Equation Modeling (PLS-SEM) in SmartPLS 4.1.1.4 (SmartPLS GmbH, Bönningstedt, Germany). Following the procedures recommended by Hair et al. [], the model’s reliability, convergent validity, and discriminant validity were assessed.
All Cronbach’s alpha (α) and Composite Reliability (CR) values exceeded 0.70, confirming the internal consistency of the scales. Similarly, all Average Variance Extracted (AVE) values were above 0.50, indicating satisfactory convergent validity. These results confirm that the measurement model meets the accepted standards for reliability and validity [,].
Discriminant validity was evaluated using the Fornell–Larcker criterion and the Heterotrait–Monotrait (HTMT) ratio. As shown in Table A5 and Table A6, the square roots of the AVE values (bolded on the diagonal) were greater than the inter-construct correlations, and all HTMT values were below the conservative threshold of 0.85. These results indicate that each construct shares more variance with its indicators than with other constructs, confirming that discriminant validity is established for the measurement model [,,].
4.2. Structural Model Results
The structural model was evaluated to test the hypothesized relationships among the constructs. The analysis considered the standardized path coefficients (β), their corresponding t-values, and the coefficient of determination (R2) for each endogenous variable. These indicators provide an overview of the strength and significance of the hypothesized effects within the model.
As presented in Table 5, the results show that CE has a strong and significant positive influence on both EI (β = 0.655, t = 20.399, R2 = 0.429) and SM (β = 0.643, t = 18.426, R2 = 0.413), supporting H1 and H3. Similarly, EI has a positive and significant effect on BP (β = 0.327, t = 6.193, R2 = 0.527), confirming H2.
Table 5.
Results of Hypothesis Testing.
The relationship between SM and BP, although positive (β = 0.110, t = 1.948, p = 0.051, R2 = 0.318), is only marginally significant, providing limited support for H4. This finding suggests that while sustainable marketing initiatives contribute positively to performance, their direct effect is relatively weak compared with that of circular and eco-innovative practices.
Finally, CE demonstrates a positive and significant direct impact on BP (β = 0.389, t = 6.931, p < 0.001, R2 = 0.318), supporting H5. Together, these findings indicate that CE acts as a central driver influencing both sustainability-oriented practices (EI and SM) and business outcomes (BP).
The model explains 52.7% of the variance in BP, 42.9% in EI, and 41.3% in SM, reflecting a satisfactory level of explanatory power. The path model (Figure 2) summarizes these relationships and their relative strength. The results highlight the pivotal role of CE as a key enabler of sustainability-oriented strategies, influencing both innovation and marketing practices.
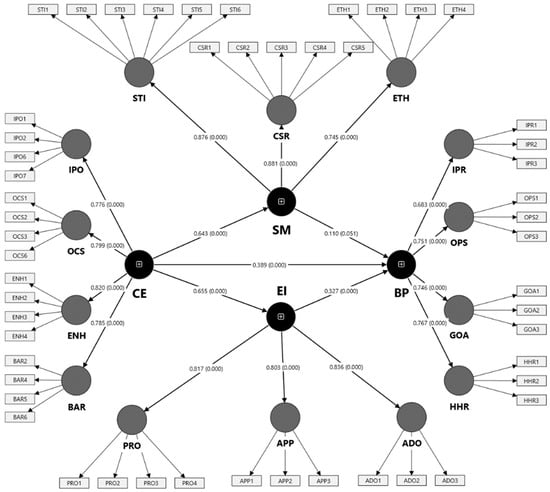
Figure 2.
Path Model. Source: Authors’ own elaboration based on SmartPLS 4.1.1.4 (SmartPLS GmbH, Bönningstedt, Germany) output of the structural model with path coefficients and significance levels.
4.3. Path Model
Figure 2 presents the final structural model, illustrating the standardized path coefficients and the strength of the relationships among the constructs. The outcomes reveal that the strongest relationships in the model are those linking CE with both EI and SM, as evidenced by their high standardized coefficients and robust significance levels. EI also acts as a relevant predictor of BP, showing a solid contribution to the model’s explanatory power. In contrast, the direct effect of SM on BP is weaker and only marginally significant, indicating that this pathway contributes less to explaining firm performance compared with the other relationships.
These findings visually confirm the results presented in Table 5, emphasizing the central role of CE as the key enabler of sustainability-oriented business performance. The codes displayed in Figure 2 represent the observed variables retained in the final measurement model, each corresponding to a specific indicator that operationalizes its respective latent construct. The numbering of these indicators follows the sequence used in the original instrument; non-consecutive codes indicate that some low-loading items were removed during the purification process to enhance the model’s reliability and validity, following the recommendations of Hair et al. [].
4.4. Predictive Power Assessment
To evaluate the model’s out-of-sample predictive performance, the PLSpredict procedure was conducted in SmartPLS 4 using a 10-fold, 10-repetition configuration, following the guidelines of Hair et al. []. The analysis assessed each endogenous construct’s ability to predict new observations based on the Q2_predict values and the difference in prediction errors between the PLS model and a linear benchmark (LM).
As shown in Table 6, all Q2_predict values are positive, confirming that the model possesses predictive relevance. The differences in RMSE (ΔRMSE = LM − PLS) are positive for all constructs, indicating that the PLS model outperforms the linear benchmark in predictive accuracy. CE exhibits the highest predictive capability, followed by EI, SM, and BP, confirming that the model provides consistent predictive power beyond explanatory analysis.
Table 6.
PLSpredict Results and Predictive Relevance.
Overall, the model demonstrates satisfactory predictive capability, as all Q2_predict values exceed zero and the prediction errors of the PLS model are consistently lower than those of the linear benchmark. These results confirm that the proposed structural model not only explains the relationships among CE, EI, SM, and BP but also provides robust predictive power for assessing sustainability-oriented business performance.
5. Discussion
5.1. Overview of Findings
The findings highlight a distinctive pattern among sustainability-oriented strategies. Although CE, EI, and SM share the ultimate goal of improving business sustainability, their impacts on BP unfold through different mechanisms and time horizons. CE and EI display immediate and significant effects, as their implementation directly enhances operational efficiency, resource optimization, and innovation-driven competitiveness. In contrast, SM shows a weaker and marginal relationship with BP, suggesting that its benefits materialize more gradually through long-term processes of brand consolidation, customer engagement, and stakeholder trust.
This distinction reinforces the idea that sustainability strategies differ not only in scope but also in the temporality of their outcomes. CE and EI deliver tangible short-term results by transforming production systems and technologies, whereas SM represents a relational and perception-based capability that requires time to translate into measurable performance improvements. Such temporal differentiation helps explain why MSMEs—often constrained by limited resources and short-term objectives—prioritize CE and EI initiatives over marketing-based strategies, even when the latter can strengthen resilience and market positioning in the long run.
5.2. Implications
The findings of this study provide relevant implications for theory and context. From a theoretical perspective, the results reinforce previous evidence positioning CE as a systemic paradigm that enhances firm performance through improved resource efficiency and circular production systems [,]. The significant influence of CE on both EI and BP supports the argument that circular strategies not only optimize material flows but also foster innovation-oriented learning processes that strengthen competitiveness in MSMEs [,]. Similarly, the positive relationship between EI and BP confirms that eco-innovation remains a key mechanism linking environmental performance and economic outcomes, consistent with the findings of Demirel and Kesidou [] and Janahi et al. [].
In contrast, the marginal effect of SM on BP diverges from results observed in studies conducted in developed markets [,]. This difference may stem from contextual and temporal factors. From a contextual perspective, MSMEs in emerging economies face resource limitations, limited sustainability awareness, and weaker institutional pressures, which constrain the immediate effect of marketing-based sustainability strategies [,]. From a temporal perspective, SM may generate its greatest impact over time, as it involves cumulative processes of brand development, customer engagement, and stakeholder trust—dimensions that require longer time horizons to translate into measurable business performance.
While the sample is geographically limited to the state of Aguascalientes, this region represents a typical industrial cluster within Mexico’s emerging economy, characterized by a strong manufacturing base, a high concentration of MSMEs, and growing integration into global supply chains. These features reflect conditions common to many emerging economies, where industrial dynamism coexists with financial, technological, and institutional constraints. The analytic generalization achieved in this study rests on a statistically rigorous sampling design that ensures representativeness within the target population while providing theoretical transferability to comparable contexts where similar institutional and resource conditions shape sustainability adoption [].
5.3. Limitations and Future Research
Although this study provides valuable insights into the relationships among CE, EI, SM, and BP in MSMEs, several limitations should be acknowledged. First, the research focuses on a single region—Aguascalientes, Mexico—whose characteristics, while typical of emerging economies, may limit the generalization of the findings to other geographical contexts. Future research should replicate this model in different industrial clusters and countries to assess its applicability across diverse institutional and cultural settings.
Second, the cross-sectional nature of the data restricts the ability to capture the temporal dynamics of sustainability strategies. Longitudinal designs would allow researchers to observe how the effects of CE, EI, and particularly SM evolve over time, potentially confirming the delayed impact of SM on BP suggested by this study.
Third, the model focuses on internal firm-level factors and does not explicitly incorporate external influences such as regulatory frameworks, market turbulence, or technological change. Future studies could extend the model by including moderating or mediating variables—such as institutional pressures, environmental uncertainty, or digital maturity—to better understand the boundary conditions of sustainability-driven performance.
Finally, expanding the dataset to include qualitative evidence, such as interviews or case studies, could enrich the understanding of how firms perceive and operationalize sustainability practices. Such mixed-methods approaches would strengthen the explanatory and predictive capacity of future research in this field.
6. Conclusions and Strategic Implications
The findings highlight that integrating sustainability into business strategies not only supports environmental stewardship but also enhances organizational performance and stakeholder engagement. Although each sustainability strategy demands different levels of resources and commitment, even incremental actions can yield tangible benefits such as greater efficiency, stronger brand trust, and more resilient organizational culture.
For MSMEs, the results confirm that CE and EI represent the most effective short-term strategies to improve BP and resilience. Accordingly, firms should prioritize initiatives that enhance resource efficiency, reduce waste, and embed eco-innovation into production and process design. These actions can deliver faster and more visible outcomes, consolidating competitiveness while advancing sustainability.
Based on these findings, strategic recommendations are proposed for the wholesale trade and food and beverage service sectors in Aguascalientes. In wholesale trade, it is essential to adopt circular logistics and traceability systems that enable packaging recovery, optimize transportation routes, and leverage digital platforms for efficiency and transparency. Complementarily, responsible marketing campaigns should promote sustainable consumption and highlight products with lower environmental impact, while strategic alliances with manufacturers and retailers can help integrate sustainability criteria into supplier selection. In the food and beverage services sector, priority should be given to waste reduction and by-product utilization through practices such as composting or bioenergy generation, alongside the adoption of eco-technologies that improve energy and water efficiency. These measures can strengthen corporate reputation and consumer trust through certification programs and environmental standards.
Finally, business sustainability decisions rest on three fundamental pillars: goals, stakeholders, and capital []. Goals encompass economic, environmental, and social objectives that seek to balance profitability, environmental care, and social well-being. Stakeholders—governments, organizations, and citizens—must interact in a coordinated manner to promote sustainable development. Capital comprises human, natural, financial, institutional, and technological resources, all of which are essential to sustaining a comprehensive and balanced sustainability model over time. Achieving equilibrium among these pillars ensures that sustainability efforts are both strategic and enduring.
Author Contributions
Data curation, M.E.R.M.; Formal analysis, M.E.R.M.; Investigation, A.A.D.D.; Methodology, A.A.D.D.; Project administration, A.A.D.D.; Resources, A.A.D.D. and M.E.R.M.; Software, M.E.R.M.; Validation, G.P.-C.; Visualization, G.P.-C.; Writing—original draft, A.A.D.D.; Writing—review and editing, G.P.-C. and M.E.R.M. All authors have read and agreed to the published version of the manuscript.
Funding
This research received no funding.
Institutional Review Board Statement
This study is waived for ethical review as according to the institutional policies of Universidad Panamericana, this type of anonymous, minimal-risk survey research does not involve sensitive ethical issues by Institution Committee.
Informed Consent Statement
Informed consent for participation was obtained from all subjects involved in the study.
Data Availability Statement
The data presented in this study are available on request from the corresponding author. The data are not publicly available due to privacy restrictions.
Conflicts of Interest
The authors declare no conflicts of interest.
Appendix A. Measurement Items
Table A1.
Sustainable Marketing (SM) Measurement Items.
Table A1.
Sustainable Marketing (SM) Measurement Items.
| Construct | Dimension | Code | Item (Statement) | Scale |
|---|---|---|---|---|
| Sustainable Marketing (SM) | Strategic Integration | STI1 | Success is measured by combining financial, environmental, and social indicators. | 5-point Likert scale (1 = strongly disagree, 5 = strongly agree) |
| STI2 | Sustainable development is considered part of the organization’s corporate values. | |||
| STI3 | Employees are motivated to achieve environmental and social goals, in addition to financial ones. | |||
| STI4 | We are committed to measuring customer satisfaction. | |||
| STI5 | We monitor the environmental impact of our products or services. | |||
| STI6 | We monitor the social impact of our products or services on the community. | |||
| Social Commitment | CSR1 | We work with multiple stakeholders to understand their expectations toward the organization. | 5-point Likert scale (1 = strongly disagree, 5 = strongly agree) | |
| CSR2 | We select suppliers based on environmental, social, and economic criteria. | |||
| CSR3 | We encourage employees’ personal and professional development through training and career plans. | |||
| CSR4 | We participate in the development and preservation of local cultural heritage. | |||
| CSR5 | We prefer to purchase and use environmentally friendly products and services. | |||
| Ethical Capabilities | ETH1 | Number of changes introduced in management or administrative systems. | 5-point Likert scale (1 = strongly disagree, 5 = strongly agree) | |
| ETH2 | Novelty of the management or administrative systems adopted by the company. | |||
| ETH3 | Employees’ initiative to apply new management or administrative systems. | |||
| ETH4 | Entrepreneurial orientation of the firm to introduce new management or administrative systems. |
Table A2.
Circular Economy (CE) Measurement Items.
Table A2.
Circular Economy (CE) Measurement Items.
| Construct | Dimension | Code | Item (Statement) | Scale |
|---|---|---|---|---|
| Circular Economy (CE) | Internal Processes and Operations | IPO1 | Our facilities have an Environmental Management System (e.g., environmental policies, impact assessment, environmental) | 5-point Likert scale (1 = strongly disagree, 5 = strongly agree) |
| IPO2 | We have implemented practices aimed at improving water-use efficiency (e.g., ecological toilets, water reuse, low-flow faucets or showers, rainwater) | |||
| IPO6 | We have implemented a waste separation system with containers for safe disposal and recycling of materials, products, and equipment (e.g., separate collection of paper, glass, metal, plastic, batteries, and organics). | |||
| IPO7 | We have implemented practices that promote digitalization and remote work (e.g., cloud storage for documents, virtual meetings, teleworking). | |||
| Organizational Changes and Strategies | OCS1 | The term ‘Circular Economy’ is included in internal documents such as policies, action plans, programs, or internal. | 5-point Likert scale (1 = strongly disagree, 5 = strongly agree) | |
| OCS2 | Managers or employees demonstrate and communicate circular practices (e.g., minimizing personal consumption or reusing products), promoting sustainability. | |||
| OCS3 | The organization provides training workshops or presentations on topics related to the circular economy for both. | |||
| OCS6 | Collaborative working groups are established across departments to address circular economy issues within the organization. | |||
| Adoption Enablers | ENH1 | The commitment of managers and directors is a driver for adopting circular economy practices in my company. | 5-point Likert scale (1 = strongly disagree, 5 = strongly agree) | |
| ENH2 | Government laws and regulations that encourage businesses act as a driver for adopting circular economy practices. | |||
| ENH3 | Competitive pressure is a driver for adopting circular economy practices in my company. | |||
| ENH4 | Customer pressure is a driver for adopting circular economy practices in my company. | |||
| Adoption Barriers | BAR2 | The lack of financial and economic resources is a barrier to adopting circular economy practices in my company. | 5-point Likert scale (1 = strongly disagree, 5 = strongly agree) | |
| BAR4 | The lack of cooperation, dialogue, and exchange of experiences is a barrier to adopting circular economy practices in my company. | |||
| BAR5 | Process rigidity is a barrier to adopting circular economy practices in my company. | |||
| BAR8 | The lack of adequate advisory support for decision-making based on circular economy indicators is a barrier in my company. |
Note: This appendix includes only the items retained in the final validated model. Items removed during the purification process due to low loadings were excluded to improve the model’s reliability and validity (Hair et al., 2022) [].
Table A3.
Business Performance (BP) Measurement Items.
Table A3.
Business Performance (BP) Measurement Items.
| Construct | Dimension | Code | Item (Statement) | Scale |
|---|---|---|---|---|
| Business Performance (BP) | Internal Processes | IPR1 | Quality of marketed products. | 5-point Likert scale (1 = very unfavorable, 5 = very favorable) |
| IPR2 | Efficiency of internal operational processes. | |||
| IPR3 | Organization of staff tasks. | |||
| Open Systems | OPS1 | Customer satisfaction. | 5-point Likert scale (1 = very unfavorable, 5 = very favorable) | |
| OPS2 | Speed of adaptation to market needs. | |||
| OPS3 | Company and product image. | |||
| Rational Goals | GOA1 | Increase in market share. | 5-point Likert scale (1 = very unfavorable, 5 = very favorable) | |
| GOA2 | Increase in profitability. | |||
| GOA3 | Increase in productivity. | |||
| Human Relations | HHR1 | Employee motivation and satisfaction. | 5-point Likert scale (1 = very unfavorable, 5 = very favorable) | |
| HHR2 | Reduction of employee turnover (voluntary resignations). | |||
| HHR3 | Reduction of absenteeism. |
Table A4.
Eco-Innovation (EI) Measurement Items.
Table A4.
Eco-Innovation (EI) Measurement Items.
| Construct | Dimension | Code | Item (Statement) | Scale |
|---|---|---|---|---|
| Eco-Innovation (EI) | Processes | PRO1 | The company has its own R&D institution, or one established jointly, that considers eco-innovation. | 5-point Likert scale (1 = strongly disagree, 5 = strongly agree) |
| PRO2 | The company has incentive mechanisms for technical staff related to eco-innovation. | |||
| PRO3 | The company promotes the transformation of R&D achievements in eco-innovation into productive capacities. | |||
| Applications | APP1 | The company pays attention to emerging environmental and social challenges to stimulate innovation in technologies, products, and services. | 5-point Likert scale (1 = strongly disagree, 5 = strongly agree) | |
| APP2 | The company has introduced new or improved products or services to reduce environmental impact in the past three years. | |||
| APP3 | The company has implemented innovations and improvements in production, logistics, or distribution to reduce environmental impact. | |||
| Adoption | ADO1 | The company has introduced innovations in information and communication technologies to reduce environmental impact. | 5-point Likert scale (1 = strongly disagree, 5 = strongly agree) | |
| ADO2 | The company has implemented green marketing innovations through product design, channels, promotion, and marketing policies. | |||
| ADO3 | The company fully understands the importance of eco-innovation for its survival and growth. |
Appendix B. Discriminant Validity Results
Table A5.
Fornell–Larcker Criterion.
Table A5.
Fornell–Larcker Criterion.
| ADO | APP | BAR | BP | CE | CSR | EI | ENH | ETH | GOA | HHR | IPO | IPR | OCS | OPS | PRO | SM | STI | |
|---|---|---|---|---|---|---|---|---|---|---|---|---|---|---|---|---|---|---|
| ADO | 0.854 | |||||||||||||||||
| APP | 0.569 | 0.819 | ||||||||||||||||
| BAR | 0.410 | 0.401 | 0.738 | |||||||||||||||
| BP | 0.476 | 0.467 | 0.535 | 0.638 | ||||||||||||||
| CE | 0.493 | 0.537 | 0.785 | 0.673 | 0.557 | |||||||||||||
| CSR | 0.323 | 0.381 | 0.484 | 0.462 | 0.558 | 0.738 | ||||||||||||
| EI | 0.836 | 0.803 | 0.527 | 0.639 | 0.655 | 0.478 | 0.665 | |||||||||||
| ENH | 0.376 | 0.429 | 0.527 | 0.509 | 0.820 | 0.447 | 0.517 | 0.801 | ||||||||||
| ETH | 0.284 | 0.361 | 0.469 | 0.423 | 0.543 | 0.534 | 0.421 | 0.419 | 0.743 | |||||||||
| GOA | 0.306 | 0.321 | 0.386 | 0.746 | 0.465 | 0.348 | 0.427 | 0.325 | 0.251 | 0.848 | ||||||||
| HHR | 0.409 | 0.363 | 0.333 | 0.767 | 0.441 | 0.350 | 0.543 | 0.343 | 0.275 | 0.491 | 0.870 | |||||||
| IPO | 0.334 | 0.359 | 0.524 | 0.467 | 0.776 | 0.417 | 0.467 | 0.555 | 0.382 | 0.298 | 0.274 | 0.753 | ||||||
| IPR | 0.348 | 0.330 | 0.490 | 0.683 | 0.581 | 0.368 | 0.448 | 0.474 | 0.423 | 0.315 | 0.337 | 0.397 | 0.878 | |||||
| OCS | 0.397 | 0.455 | 0.480 | 0.516 | 0.799 | 0.407 | 0.529 | 0.633 | 0.369 | 0.375 | 0.377 | 0.586 | 0.427 | 0.752 | ||||
| OPS | 0.338 | 0.362 | 0.373 | 0.751 | 0.502 | 0.297 | 0.461 | 0.361 | 0.301 | 0.409 | 0.409 | 0.410 | 0.382 | 0.344 | 0.872 | |||
| PRO | 0.494 | 0.458 | 0.472 | 0.603 | 0.571 | 0.460 | 0.817 | 0.457 | 0.383 | 0.407 | 0.534 | 0.445 | 0.409 | 0.443 | 0.423 | 0.775 | ||
| SM | 0.361 | 0.427 | 0.545 | 0.531 | 0.643 | 0.881 | 0.526 | 0.497 | 0.745 | 0.386 | 0.382 | 0.475 | 0.433 | 0.461 | 0.369 | 0.493 | 0.617 | |
| STI | 0.296 | 0.338 | 0.428 | 0.451 | 0.523 | 0.651 | 0.423 | 0.389 | 0.467 | 0.352 | 0.327 | 0.395 | 0.322 | 0.384 | 0.328 | 0.398 | 0.876 | 0.719 |
Table A6.
Heterotrait–Monotrait Ratio (HTMT).
Table A6.
Heterotrait–Monotrait Ratio (HTMT).
| ADO | APP | BAR | BP | CE | CSR | EI | ENH | ETH | GOA | HHR | IPO | IPR | OCS | OPS | PRO | SM | STI | |
|---|---|---|---|---|---|---|---|---|---|---|---|---|---|---|---|---|---|---|
| ADO | ||||||||||||||||||
| APP | 0.725 | |||||||||||||||||
| BAR | 0.537 | 0.548 | ||||||||||||||||
| BP | 0.567 | 0.577 | 0.684 | |||||||||||||||
| CE | 0.577 | 0.652 | 0.972 | 0.767 | ||||||||||||||
| CSR | 0.406 | 0.496 | 0.649 | 0.561 | 0.663 | |||||||||||||
| EI | 0.989 | 0.997 | 0.674 | 0.743 | 0.744 | 0.587 | ||||||||||||
| ENH | 0.458 | 0.544 | 0.691 | 0.607 | 0.924 | 0.565 | 0.617 | |||||||||||
| ETH | 0.368 | 0.488 | 0.655 | 0.535 | 0.675 | 0.709 | 0.535 | 0.542 | ||||||||||
| GOA | 0.377 | 0.408 | 0.509 | 0.893 | 0.550 | 0.433 | 0.514 | 0.401 | 0.327 | |||||||||
| HHR | 0.495 | 0.455 | 0.432 | 0.889 | 0.509 | 0.431 | 0.645 | 0.413 | 0.353 | 0.593 | ||||||||
| IPO | 0.429 | 0.480 | 0.715 | 0.582 | 0.924 | 0.547 | 0.585 | 0.710 | 0.516 | 0.381 | 0.346 | |||||||
| IPR | 0.417 | 0.411 | 0.627 | 0.806 | 0.658 | 0.450 | 0.524 | 0.568 | 0.531 | 0.380 | 0.397 | 0.496 | ||||||
| OCS | 0.520 | 0.619 | 0.663 | 0.647 | 0.957 | 0.537 | 0.671 | 0.812 | 0.509 | 0.486 | 0.481 | 0.783 | 0.537 | |||||
| OPS | 0.409 | 0.454 | 0.481 | 0.873 | 0.582 | 0.368 | 0.545 | 0.432 | 0.386 | 0.493 | 0.487 | 0.519 | 0.445 | 0.434 | ||||
| PRO | 0.624 | 0.597 | 0.640 | 0.747 | 0.682 | 0.595 | 1.013 | 0.579 | 0.515 | 0.523 | 0.681 | 0.584 | 0.508 | 0.591 | 0.528 | |||
| SM | 0.428 | 0.524 | 0.690 | 0.610 | 0.727 | 1.044 | 0.608 | 0.591 | 0.942 | 0.455 | 0.443 | 0.586 | 0.499 | 0.579 | 0.431 | 0.601 | ||
| STI | 0.370 | 0.429 | 0.561 | 0.536 | 0.618 | 0.792 | 0.509 | 0.486 | 0.601 | 0.433 | 0.393 | 0.506 | 0.385 | 0.504 | 0.397 | 0.500 | 1.030 |
References
- Iglesias, D. Businesses, human rights and the international climate change regime: The emergence of climate obligations for corporations. Anu. Mex. Derecho Int. 2020, 20, 85–134. [Google Scholar] [CrossRef]
- Li, M.; Liu, J.; Gong, N.; He, S. Unintended environmental gains: How can a favorable business environment promote the low-carbon transition? J. Environ. Manag. 2024, 366, 121892. [Google Scholar] [CrossRef]
- Xu, L.; Fan, M.; Yang, L.; Shao, S. Heterogeneous green innovations and carbon emission performance: Evidence at China’s city level. Energy Econ. 2021, 99, 105269. [Google Scholar] [CrossRef]
- Nikolaou, I.E.; Tsagarakis, K.P. An introduction to circular economy and sustainability: Some existing lessons and future directions. Sustain. Prod. Consum. 2021, 28, 600–609. [Google Scholar] [CrossRef]
- Kristensen, H.S.; Mosgaard, M.A. A review of micro level indicators for a circular economy: Moving away from the three dimensions of sustainability? J. Clean. Prod. 2020, 243, 118531. [Google Scholar] [CrossRef]
- Saavedra, Y.M.; Iritani, D.R.; Pavan, A.L.; Ometto, A.R. Theoretical contribution of industrial ecology to circular economy. J. Clean. Prod. 2018, 170, 1514–1522. [Google Scholar] [CrossRef]
- Domenech, T.; Bahn-Walkowiak, B. Transition towards a resource efficient circular economy in Europe: Policy lessons from the EU and the member states. Ecol. Econ. 2019, 155, 7–19. [Google Scholar] [CrossRef]
- González-Bravo, M.I. Cultural and social factors as determinants of the commitment to invest in eco-innovation activities in the EU. Adv. Environ. Res. 2024, 101, 109–144. [Google Scholar]
- Jugend, D.; Fiorini, P.D.C.; Fournier, P.L.; Latan, H.; Jabbour, C.J.C.; Scaliza, J.A.A. Industry 4.0 technologies for the adoption of the circular economy: An analysis of institutional pressures and the effects on firm performance. J. Environ. Manag. 2024, 370, 122260. [Google Scholar] [CrossRef]
- Rodríguez, A.S. Responsabilidad social empresarial y el marketing sostenible: Una ruta hacia el desarrollo sustentable. Rev. Venez. Gerenc. 2024, 29, 1059–1071. [Google Scholar] [CrossRef]
- Geissdoerfer, M.; Vladimirova, D.; Evans, S. Sustainable business model innovation: A review. J. Clean. Prod. 2018, 198, 401–416. [Google Scholar] [CrossRef]
- Bocken, N.M.P.; de Pauw, I.; Bakker, C.; van der Grinten, B. Product design and business model strategies for a circular economy. J. Ind. Prod. Eng. 2023, 40, 371–389. [Google Scholar] [CrossRef]
- Korhonen, J.; Honkasalo, A.; Seppälä, J. Circular economy: The concept and its limitations. Ecol. Econ. 2018, 143, 37–46. [Google Scholar] [CrossRef]
- Shkarupeta, E.; Babkin, A. Eco-innovative development of industrial ecosystems based on the quintuple helix. Int. J. Innov. Stud. 2024, 8, 273–286. [Google Scholar] [CrossRef]
- Janahi, N.A.; Durugbo, C.M.; Al-Jayyousi, O.R. Eco-innovation strategy in manufacturing: A systematic review. Clean. Eng. Technol. 2021, 5, 100343. [Google Scholar] [CrossRef]
- Demirel, P.; Kesidou, E. Sustainability-oriented capabilities for eco-innovation: Meeting the regulatory, technology, and market demands. Bus. Strategy Environ. 2019, 28, 847–857. [Google Scholar] [CrossRef]
- Majid, S.; Zhang, X.; Khaskheli, M.B.; Hong, F.; King, P.J.H.; Shamsi, I.H. Eco-efficiency, environmental and sustainable innovation in recycling energy and their effect on business performance: Evidence from European SMEs. Sustainability 2023, 15, 9465. [Google Scholar] [CrossRef]
- Pyagay, A.; Tatikova, A.; Medeni, T. Contradictions and patterns of eco-innovative strategies of SMEs in Central Asian countries: Ambivalent dynamics of Kazakhstan. J. Innov. Entrep. 2025, 14, 22. [Google Scholar] [CrossRef]
- Dore, S.; Gallo, A. Circular economy and reverse logistics: An analysis of sustainable business models. In International Conference on Computational Science and Its Applications; Springer: Cham, Switzerland, 2023; pp. 495–511. [Google Scholar]
- Huang, L.; Solangi, Y.A.; Magazzino, C.; Solangi, S.A. Evaluating the efficiency of green innovation and marketing strategies for long-term sustainability in the context of environmental labeling. J. Clean. Prod. 2024, 450, 141870. [Google Scholar] [CrossRef]
- Nascimento, J.; Loureiro, S.M.C. Mapping the sustainability branding field: Emerging trends and future directions. J. Prod. Brand Manag. 2024, 33, 234–257. [Google Scholar] [CrossRef]
- Kumar, S.; Sharma, C.; Mishra, M.K.; Sharma, S.; Bhardwaj, V. Smart, sustainable, and green: The digital transformation of green marketing. Discov. Sustain. 2025, 6, 388. [Google Scholar] [CrossRef]
- Rakić, B.; Rakić, M. Holistic management of marketing sustainability in the process of sustainable development. Environ. Eng. Manag. J. 2015, 14, 887–900. [Google Scholar] [CrossRef]
- Agrawal, S.; Jain, V.K.; Verma, H. Circular economy, sustainable growth and achieving zero net emissions: A way ahead for building a sustainable tomorrow by optimizing consumption. Int. J. Sustain. Agric. Manag. Inform. 2025, 11, 72–96. [Google Scholar] [CrossRef]
- Lozano, N.S.M.; Baque, D.L.Z.; Terán, A.B.I.; Parrales, R.A.Á.; Alcívar, H.A.G.; Bravo, H.M.T.; Robles, N.A.P. Metodología de la Investigación Científica: Diseño de Investigaciones Cuantitativas; Editorial Internacional Alema: Guayaquil, Ecuador, 2025; ISBN 978-9942-623-01-0. [Google Scholar]
- Ellen MacArthur Foundation. Impact Report Summary 2024; Ellen MacArthur Foundation: Cowes, UK, 2024; Available online: https://content.ellenmacarthurfoundation.org/m/6b9b37a53360393e/original/Impact-Report-Summary-2024.pdf (accessed on 1 October 2025).
- Instituto Nacional de Estadística y Geografía (INEGI). Directorio Estadístico Nacional de Unidades Económicas (DENUE). 2021. Available online: https://www.inegi.org.mx/programas/denue/ (accessed on 10 September 2025).
- Hair, J.F.; Hult, G.T.M.; Ringle, C.M.; Sarstedt, M. A Primer on Partial Least Squares Structural Equation Modeling (PLS-SEM), 3rd ed.; Sage Publications: Thousand Oaks, CA, USA, 2022. [Google Scholar]
- Kline, R.B. Principles and Practice of Structural Equation Modeling; Guilford Press: New York, NY, USA, 2023. [Google Scholar]
- Idaka, I.E.; Okarefe, O.A.; Adeleke, J.O. Efficacy of ordinal alpha reliability method using teacher literacy and practice of school-based assessment data. Afr. J. Behav. Scale Dev. Res. 2020, 2, 21–29. [Google Scholar] [CrossRef]
- Henseler, J. Composite-Based Structural Equation Modeling: Analyzing Latent and Emergent Variables; Springer: Cham, Switzerland, 2021. [Google Scholar]
- Fornell, C.; Larcker, D.F. Evaluating structural equation models with unobservable variables and measurement error. J. Mark. Res. 1981, 18, 39–50. [Google Scholar] [CrossRef]
- Yin, R.K. Case Study Research and Applications: Design and Methods, 6th ed.; Sage Publications: Thousand Oaks, CA, USA, 2018. [Google Scholar]
Disclaimer/Publisher’s Note: The statements, opinions and data contained in all publications are solely those of the individual author(s) and contributor(s) and not of MDPI and/or the editor(s). MDPI and/or the editor(s) disclaim responsibility for any injury to people or property resulting from any ideas, methods, instructions or products referred to in the content. |
© 2025 by the authors. Licensee MDPI, Basel, Switzerland. This article is an open access article distributed under the terms and conditions of the Creative Commons Attribution (CC BY) license (https://creativecommons.org/licenses/by/4.0/).