Abstract
(1) Background: Millions of U.S. households experience energy insecurity, defined as the inability to adequately meet household energy needs. (2) Objectives: Examine the relationship between different dimensions of energy insecurity and adverse mental health (anxiety and depression) and assess whether these associations vary by household income. (3) Methods: This study investigates the relationship between energy insecurity, income, and mental health (anxiety and depression) using 2022 and 2023 data from the U.S. Census Bureau’s Household Pulse Survey. (4) Results: Adverse mental health is more closely related to behavioral responses to energy insecurity rather than the economic burden of energy insecurity and are on par with food insecurity. Adverse mental health associations with keeping the home at an unhealthy temperature and giving up basic necessities to pay an energy bill are particularly large compared to being unable to pay an energy bill in full. For those without energy insecurity, the probability of adverse mental health outcomes decreases as income increases. For those with energy insecurity, the probability of adverse mental health outcomes is high across all income groups. This study underscores the need to consider economic and behavioral dimensions of energy insecurity in discussions about mental health.
1. Introduction
Energy insecurity, or the inability to meet household energy needs, affects approximately 37 million households in the U.S. [1]. As conceptualized by Hernández (2016) [2], energy insecurity includes three dimensions—economic, physical, and coping—that often intersect. Examples of economic energy insecurity include financial hardship from unaffordable energy bills or debt owed to energy providers. Physical energy insecurity arises from inefficient housing structures that are drafty or in disrepair. The coping dimension of energy insecurity includes adaptive strategies in response to physical and economic hardships such as conserving energy to reduce monthly costs or using the stove or oven for heat.
In recent years, researchers have identified mental health associations with energy insecurity. In a variety of interconnected ways, unmet energy needs have been associated with stress, depression, and anxiety. In one of the first studies of energy insecurity and mental health, Hernández, Philips, and Siegel (2016) [3] documented the multifaceted nature of stress experienced by energy-insecure households in New York City’s South Bronx neighborhood. The findings revealed that physical deficiencies in housing, compounded by economic hardships and health issues, contribute to chronic stress among residents. That stress arises from concerns about the affordability and availability of energy, as well as the coping strategies employed to manage poor housing conditions, such as using supplemental heating sources (e.g., space heaters). Similarly, a 2024 study by Siegel et al. found a higher incidence of mental health hardships among those who suffered multiple forms of energy insecurity [4]. In their focus group study of energy-insecure households in Connecticut, Mashke et al. (2022) [5] found that uncomfortable indoor winter temperatures were associated with elevated stress levels among the elderly, those with medical conditions, and households with children.
In addition to stress, energy insecurity has also been associated with depression and anxiety. Using data from a 2015 cross-sectional survey conducted in the Washington Heights neighborhood of New York City, Hernández and Siegel (2019) [6] found that the odds of depressive disorder are 1.8 times greater among respondents who have gone without heat because of inability to pay, used a cooking stove for heat, or experienced a shut-off. Fernández et al. (2018) [7] found that when combined with food insecurity, energy insecurity—defined in this study as living in a household that could not pay utility bills in full or one that experienced a shut-off—significantly elevated the risk of depression and anxiety among children. Depression has also been linked to physical indicators of energy insecurity, including dampness and mold [8]. Consistent with the research on U.S. households, studies in Australia, Canada, China, Ireland, New Zealand, and the United Kingdom have also reported sizable effects of energy insecurity on mental health [9,10,11,12,13,14].
Recent studies continue to demonstrate the mental health consequences of energy insecurity across diverse contexts. For example, Han (2024) [15] finds that higher household energy burden in U.S. urban areas is associated with greater odds of depression and psychological distress, while Sen (2024) shows that energy poverty is directly linked to elevated risks of anxiety and depression [16]. A recent global scoping review further confirms consistent evidence that fuel and energy poverty undermine mental health, underscoring its importance as a determinant of health beyond national boundaries [17].
The association between energy insecurity and mental health has far-reaching social, economic, and public health implications. As studies [1] have shown, energy insecurity is inversely related to household income. Additionally, scholars have also found that having a low income is associated with mental health conditions [18]. The added burden of energy insecurity can compound and further exacerbate mental health problems, leading to a cycle of poverty and poor health outcomes [7].
Adverse mental health outcomes associated with energy insecurity can also have long-term economic and social implications. Poor mental health can lead to social isolation [1]. The mental health of parents, for example, may impact children, which could continue to condition them into adulthood [19,20]. Anxiety and depression can also affect one’s ability to work. A 2010 study by Lerner et al. [21] revealed that symptoms of depression in adults are linked to both absenteeism and reduced work performance. These symptoms are not only felt by the worker themselves, but also by their employer and the broader economy. As various authors have shown [22,23], adverse mental health imposes economic burdens on households, such as the costs associated with accessing therapy and medication, especially for those with limited access to healthcare.
This study extends the existing literature on energy insecurity and mental health by examining how the association between energy insecurity and mental health varies by income. The empirical approach is centered around three measures of energy insecurity: keeping the home at an unhealthy temperature, forgoing basic necessities such as food or medicine to pay an energy bill, and being unable to pay a bill in full. Using the theoretical framework developed by Hernández [1], this paper classifies the first measure as reflecting both physical and coping insecurity, the second as coping, and the third as economic insecurity. By analyzing these dimensions together in a large, nationally representative sample, the study evaluates whether adverse mental health outcomes are more closely tied to economic burden or to the physical and behavioral responses to energy insecurity and the extent to which these associations vary by income [4]. The study also compares these associations against food insecurity to gauge their relative effects.
Accordingly, three hypotheses are tested. First, coping-related manifestations of energy insecurity, maintaining unsafe indoor temperatures, and forgoing basic necessities are more strongly associated with depression and anxiety than the economic dimension of inability to pay in full. Inability to pay a bill in full, while often serious, may not be associated with adverse mental health outcomes until it is accompanied by behavioral responses. Hashmi et al. (2025) [24] find that behavioral adjustments are more proximal to mental health than broader economic measures. Second, adjusting for sociodemographic and household factors, forgoing basic necessities to pay energy bills should be associated with adverse mental health to a degree comparable to or greater than food insecurity. While food insecurity has well-documented relationships with mental health (Reeder et al., 2022) [25], energy-related tradeoffs can exacerbate psychological distress in distinct ways. Thermal discomfort reduces sleep, a well-established risk factor for mental health disorders (Scott et al., 2021 [26]; Siegel et al., 2024 [4]). Food insecurity often involves periodic episodes (e.g., skipped meals), whereas energy needs are continuous. Third, these associations should differ by household income, with lower-income households showing larger associations between energy insecurity and adverse mental health. Higher-income households should have more resources to draw from when presented with energy insecurity.
This study contributes to the literature in several ways. First, whereas much prior research has focused on qualitative case studies or single dimensions of energy insecurity, this paper uses a large, nationally representative dataset to quantitatively examine how multiple dimensions of energy insecurity (economic, physical, and coping) are associated with mental health. Second, by simultaneously modeling three distinct measures of energy insecurity, the study assesses whether adverse mental health outcomes are more strongly tied to the economic burden of unpaid bills or the physical and behavioral responses. Third, the paper situates energy insecurity alongside food insecurity, a widely studied social determinant of mental health. In doing so, the paper provides new evidence that underscores the multifaceted role of energy insecurity in shaping psychological well-being and highlights the need for policies that address not only financial burdens but also the lived experience of coping with inadequate energy access. Fourth, by examining the interaction between income and energy insecurity, this paper demonstrates how financial resources condition the relationship between energy insecurity and mental health.
2. Materials and Methods
The data for this study are based on the Census Bureau’s Household Pulse Survey (HPS). Initially developed to collect social and economic information from households during the COVID-19 pandemic, the 20-min online survey was first administered in April of 2020 [27]. Four HPS waves were used in this study: Week 50 (5–17 October 2022), Week 54 (1–13 February 2023), Week 57 (26 April–8 May 2023), and Week 61(23 August–4 September 2023). The total sample size is 180,957 (roughly 1% of observations were excluded due to missingness. Excluded cases are older, less married, more unemployed, have lower incomes, and are less educated, with somewhat higher energy insecurity. The groups are otherwise similar in terms of gender, Hispanic origin, insurance, and household composition. This pattern suggests that any bias is likely to run conservative). Because energy insecurity is seasonal (i.e., most extreme during the warmest and coldest months), the most recent waves that cover all four seasons were selected. STATA 19 (StataCorp LLC, College Station, TX, USA) was used to carry out the analysis.
The dependent variables in this paper are created based on commonly used mental health indices. The depressed variable is made up of the “interest” and “down” variables in the HPS. The “interest” variable consists of the following question and answer options: “Over the last 2 weeks, how often have you been bothered by having little interest or pleasure in doing things? Select only one answer: (1) Not at all, (2) Several days, (3) More than half the days, (4) Nearly every day. The “down” variable consists of the following question and answer options: “Over the last 2 weeks, how often have you been bothered by feeling down, depressed, or hopeless? Select only one answer: (1) Not at all, (2) Several days, (3) More than half the days, (4) Nearly every day. Following the convention established by Gilbody et al. [28], the responses for each question associated with the two variables are summed. If the score is equal to four or more, the individual is considered to have a depressive disorder.
For anxiety, the paper follows Kroenke’s Generalized Anxiety Disorder [29] scale. A person is defined as anxious if their summed score of the HPS “anxious” and “worry” variables is equal to four or more. The “anxious” variable consists of the following question and answer options: “Over the last 2 weeks, how often have you been bothered by feeling nervous, anxious, or on edge? Select only one answer. (1) Not at all (2) Several days (3) More than half the days (4) Nearly every day. The “worry” variable consists of the following question and answer options: “Over the last 2 weeks, how often have you been bothered by not being able to stop or control worrying? Select only one answer: (1) Not at all, (2) Several days, (3) More than half the days, (4) Nearly every day. The conventions used to measure anxiety (also known as GAD-2) and depression (also known as PHQ-2) in this paper are widely used in mental health research. Though the common threshold is a score of three or more for both GAD-2 and PHQ-2, it is important to note that the common scale on these measures is from 0 to 3. The scale in the Household Pulse Survey (HPS) for these measures is from 1 to 4. Thus, the GAD-2 and the PHQ-2 threshold in HPS that is used in this paper is four or more.
Our independent variables are generated from three energy insecurity questions from the HPS. Survey respondents were asked how often they gave up basic necessities to pay their energy bill, how often they were unable to pay their energy bill, and how often they kept their house at unsafe temperatures. Respondents had four choices with the corresponding values: (1) Almost every month, (2) Some months, (3) 1 or 2 months, (4) Never. Dummy variables were created from these three questions. If respondents answered “never” to an energy insecurity question, they were assigned a 0 to the corresponding dummy variable. In all other cases, they were assigned a 1. From here, three energy insecurity dummy variables were created: Gave up Basic Necessities to Pay Energy Bill (from the question regarding trouble paying energy bill), Unable to Pay Energy Bill in Full (from the question regarding inability to pay energy bill), and Kept Home at an Unhealthy Temperature (from the question asking how often respondents kept their homes at unsafe temperatures).
Studies have shown that energy insecurity is linked to many socioeconomic and demographic variables, such as race, income [1], family composition [30], and education level [31]. These types of variables were included as controls in this study’s model in order to capture the complex interplay between demographic and socioeconomic factors, energy insecurity, and mental well-being. In this study’s models, these include age, gender, marital status, race, household income, education, employment status, and family composition. A dummy variable “not employed” was created, which equals 1 if any member of the household was not employed during the 4 weeks prior to the survey. The HPS has eight income categories ranging from less than USD 25,000 to USD 200,000 and above. In order to facilitate the interpretation and communication of the paper’s results, this variable was broken down from eight to four categories. Thus, the income variable is constructed based on the following thresholds: households making less than USD 25,000 annually were deemed “low income”, those earning between USD 25,000 and USD 49,999 were classified as “middle low income”, households earning from USD 50,000 to USD 99,999 were considered “high middle income”, finally households that made USD 100,000 and above were labeled “high income”. Income is used as a four-category factor in all models and serves as the interacting variable in the heterogeneity analyses described below.
Another control variable in the study was food insecurity, which is associated with both anxiety and depression [32]. The food insecurity variable was created based on similar measures used in prior research [33]. HPS respondents were asked, “In the last 7 days, which of these statements best describes the food eaten in your household?”. The response options were: (1) have enough of the types of food wanted; (2) have enough food, but not always the types wanted; (3) sometimes do not have enough to eat; or (4) often do not have enough to eat. Respondents who said that they “sometimes” or “often” did not have enough to eat were classified as food insecure.
Health insurance is also included in the models. Previous scholars have shown how access to health insurance can have positive associations with mental health, such as lowering depression rates [34], reducing undiagnosed and untreated depression [35], lowering suicide rates [36], and improving access to mental health-related medication [37]. Finally, the region is included as a control variable. Regions of the country vary with respect to energy infrastructure and climate.
To analyze the effects of energy insecurity on mental health net of the controls, the study estimates logistic regression models as specified by the following equation:
in which the probability that a household experiences a mental health condition (Y) is modeled as a function of a series of covariates, including keeping the home at an unhealthy temperature (X1), giving up basic necessities like food or medicine to pay an energy bill (X2), being unable to pay an energy bill in full (X3), and a series of control variables (age, age-squared, gender, marital status, race, income, education, employment status, family composition, food insecurity, health insurance, and region of the country). The study estimates separate models for depression and anxiety.
Logit(P(Y = 1)) = β0 + β1 X1 + β2 X2 + β3 X3 +… βk Xk
To assess whether associations differ by income, separate interaction models are estimated in which each energy-insecurity indicator is interacted with income (three models: temperature × income, forgoing necessities × income, inability to pay × income). When one indicator is the focal term, the other two indicators are included as covariates. All interaction models retain the full control set (age and age-squared, gender, marital status, Hispanic ethnicity, race, education, employment status, children in household, food insecurity, health insurance, region, and survey-wave fixed effects), apply HPS person weights, and use state-clustered standard errors.
3. Results
3.1. Descriptive Statistics
The study first examines the bivariate relationship between the independent and dependent variables in the paper. Table 1 shows the weighted percentages of depression and anxiety for each of the predictor variables. For example, 64.08% of those who kept their homes at unhealthy temperatures were classified as depressed. Elevated rates of depression are observed among those in the sample who experienced energy insecurity. Anxiety rates are even higher across each of the three energy insecurity indicators. In comparison to the rest of the energy insecurity variables, the highest percentage of both depression and anxiety was found among the households that were unable to pay an energy bill or unable to pay the full bill amount.

Table 1.
Demographic characteristics of the HPS sample by depression and anxiety.
Households that were classified as “any other race” had the highest rates of both depression and anxiety in comparison to other racial groups, at 50.03% and 59.42%, respectively. A total of 42.25% of Black households were classified as having depression, the second highest among other racial groups. In terms of anxiety, White households had the second-highest rates, at 49.8%. This finding is consistent with previous literature, which finds that White Americans are more likely to be diagnosed with anxiety disorders than African Americans, Hispanic Americans, and Asian Americans [38]. In total, 46.01% of Hispanic households were classified as depressed, and 53.02% percent had experienced anxiety. This is higher than in non-Hispanic households, whose levels of depression and anxiety were 41.15% and 49.27%, respectively.
In terms of income, the results also coincide with what other scholars have found [18]: those in the sample belonging to the lowest income group had the highest rates of depression and anxiety (57.78% and 62.04%, respectively), as income increased, depression and anxiety decreased. 30.16% of those in the highest income group were classified as depressed, and 40.05% classified as anxious. In terms of education level, and in line with previous findings [39,40], those in the study’s sample who had achieved less than a high school education had the highest rates of depression and anxiety. As education levels increased, the prevalence of depression and anxiety decreased. In total, 42.12% of the non-employed in the sample were classified as depressed, while 47.29% experienced anxiety. Of those who had jobs, 41.78% had depression, and 51.43% had anxiety. This confirms what other authors have found regarding mental health and employment [41]. A total of 42.93% of households in the West region of the country were classified as depressed, which was the highest rate of the other three regions. The highest rates of anxiety were also found in the West region, at 51.14%.
Studies have found a positive association between health insurance coverage and more adequate care for mental illnesses [42]. The findings of this paper complement these studies: higher percentages of the non-insured were classified as depressed or anxious (57.03% and 61.28%, respectively) compared to those who had insurance (40.62% and 48.88%, respectively). Researchers have observed that mental health can be strongly predicted by one’s marital status [43] and gender [44]. The results of this paper are in line with these findings, as Table 1 shows, females had higher rates of depression and anxiety than males, and those who were unmarried had higher rates of depression and anxiety than those who were married. Like Le et al. [45], this analysis finds that having a larger family is associated with poorer mental health outcomes. In the sample, households with three or more children had the highest rates of depression (44.44%) and anxiety (54.82%), compared to households with zero, one, or two children.
In the sample, those experiencing food insecurity had high rates of depression and anxiety, similar to what other researchers have found [32]. In total, 74.31% and 79.66% of those experiencing food insecurity were classified as depressed and anxious, respectively.
These preliminary insights only convey bivariate relationships and do not take into account confounders. Next, the results of regression analyses are presented, which include the control variables, and the paper examines whether adverse mental health is more closely related to the economic burden of energy insecurity, the behavioral, or the physical responses to energy insecurity.
3.2. Regression Results
Results from the study’s logistic regression show that the three indicators to measure energy insecurity have a significant association with anxiety and depression, even after controlling for other factors associated with adverse mental health. Below, the coefficient plots from both the Depression and Anxiety models are presented. Results from the Depression model (Figure 1) and the Anxiety model (Figure 2) both show that energy insecurity has a statistically significant effect on depression and anxiety, even after controlling for food insecurity and other demographic factors associated with depression. Model discrimination was acceptable (AUC = 0.732 for depression; AUC = 0.740 for anxiety). Tables for these models can be found in Appendix A. Consistent with prior research [25,32], the analysis shows a significant association between mental health and food insecurity. The results suggest that compared to those who are not food insecure, those who suffer from food insecurity have significantly higher odds of experiencing anxiety and depression.
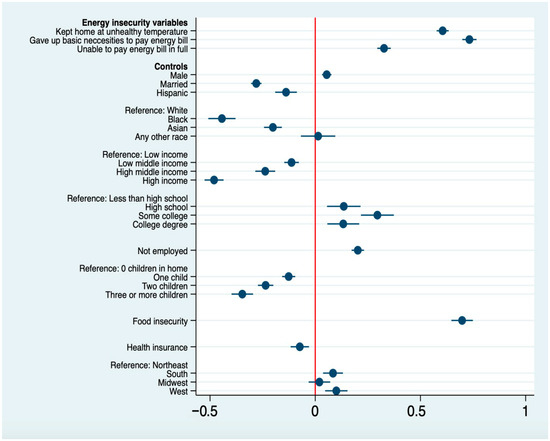
Figure 1.
Logit coefficients from the logistic regression model predicting depression. Note: Model also includes controls for age and HPS week. Red line indicates zero; circles and lines show coefficients with 95% confidence intervals.
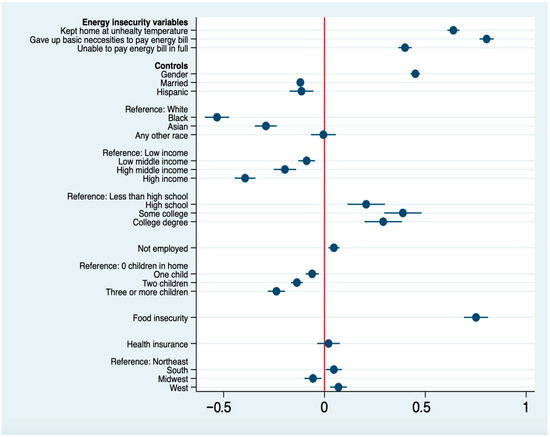
Figure 2.
Logit coefficients from the logistic regression model predicting anxiety. Note: Model also includes controls for age and HPS week. Red line indicates zero; circles and lines show coefficients with 95% confidence intervals.
The effects of the control variables are consistent with prior research, with the exception of health insurance coverage. The effect of insurance coverage is significantly attenuated by adding age to the model. This is not surprising given that most people over 65 are eligible for free health insurance through Medicare.
Both models show that those who gave up basic necessities to pay energy bills had the highest log odds of experiencing mental health hardships, compared to the other two energy insecurity variables captured by the HPS. The analysis also shows that of the three energy insecurity variables, those who were unable to pay their energy bill in full experienced the lowest log odds of experiencing mental health hardships. The adverse mental health effects of keeping the home at an unhealthy temperature and giving up basic necessities to pay an energy bill are particularly large compared to being unable to pay an energy bill in full. This suggests that the physical and coping dimension of energy insecurity is more closely tied to depression and anxiety than the economic dimension. (As a sensitivity check for how much unobserved confounding would be needed to overturn the observed associations between energy insecurity and mental health, Oster’s [46] psacalc function in STATA was applied to linear probability models. Across all six specifications (three energy-insecurity measures × two outcomes), the estimated δ values exceeded 1, indicating that selection on unobservables would need to be at least as strong as selection on observables to eliminate the associations).
Predicted probabilities from the interaction models, shown in Figure 3, Figure 4, Figure 5, Figure 6, Figure 7 and Figure 8, indicate that the association between energy insecurity and mental health varies by income. Predicted probabilities of depression/anxiety are highest at the lowest income levels. For those without energy insecurity, the decrease in the predicted probability of adverse mental health outcomes as income increases is less steep than for those with energy insecurity. Higher income levels are associated with lower levels of depression and anxiety, but these associations are attenuated when the household is experiencing energy insecurity. These results suggest that although higher-income households exhibit lower baseline rates of anxiety and depression, income does not insulate against the mental health associations with energy hardship. When hardship occurs, the associated increase in risk is substantial across all income groups. Coefficient plots in Figure 9, Figure 10, Figure 11, Figure 12, Figure 13 and Figure 14 corroborate this pattern, with the interaction terms indicating meaningful income differences in the energy–mental health associations.
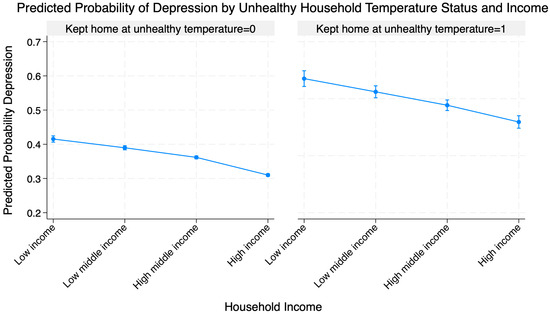
Figure 3.
Predicted probability of depression by unhealthy household temperature status and income.
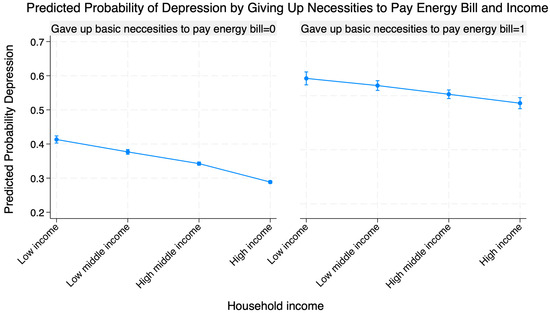
Figure 4.
Predicted probability of depression by giving up necessities to pay energy bill and income.
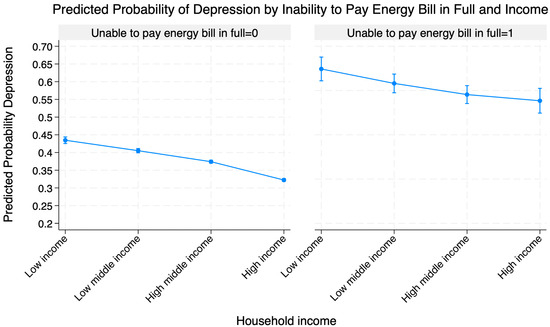
Figure 5.
Predicted probability of depression by inability to pay energy bill in full and income.
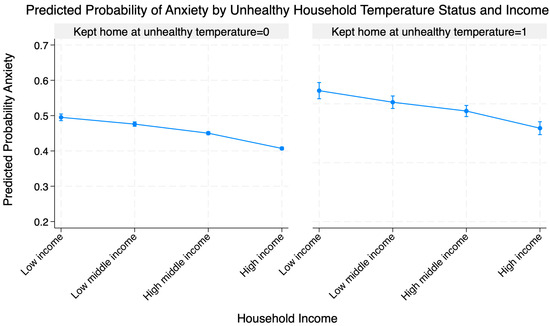
Figure 6.
Predicted probability of anxiety by unhealthy household temperature status and income.
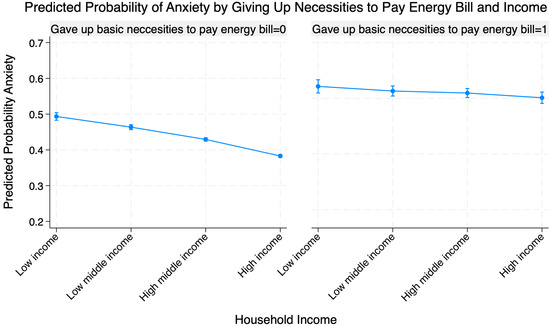
Figure 7.
Predicted probability of anxiety by giving up necessities to pay energy bill and income.
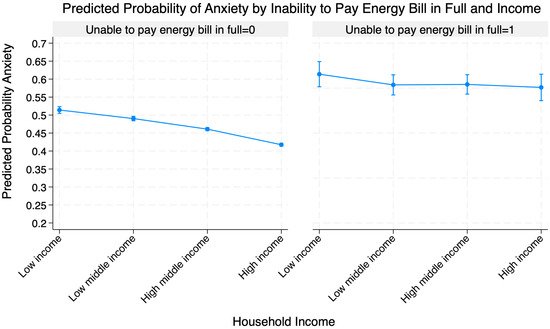
Figure 8.
Predicted probability of anxiety by inability to pay energy bill in full and income.
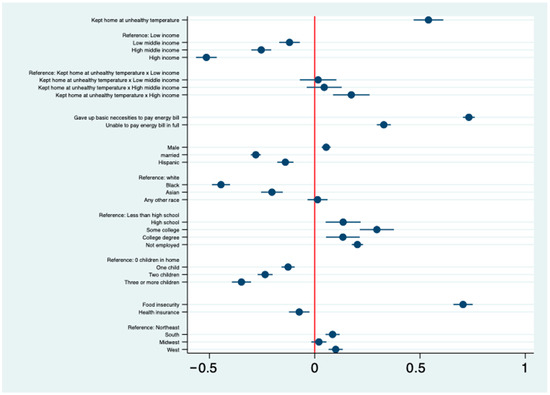
Figure 9.
Logit coefficients for depression: income × unsafe indoor temperature. Note: Model also includes controls for age and HPS week. Red line indicates zero; circles and lines show coefficients with 95% confidence intervals.
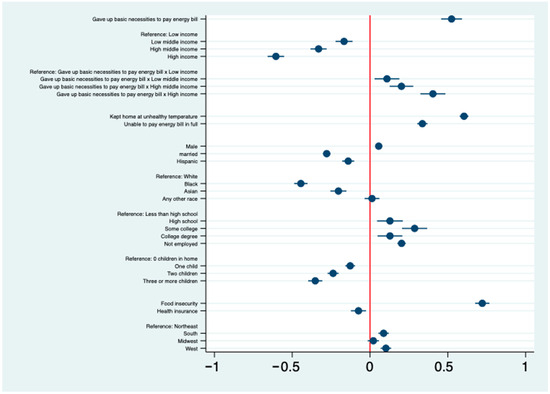
Figure 10.
Logit coefficients for depression: income × forgoing basic necessities to pay energy bills. Note: Model also includes controls for age and HPS week. Red line indicates zero; circles and lines show coefficients with 95% confidence intervals.
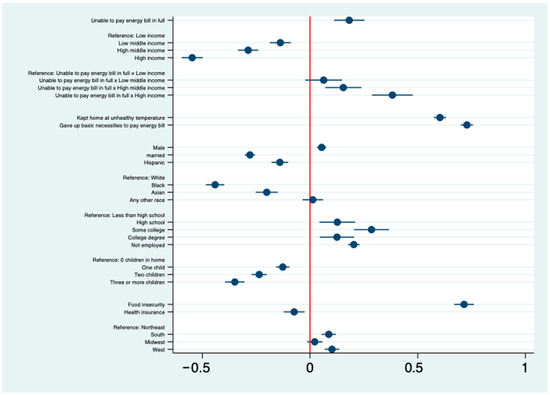
Figure 11.
Logit coefficients for depression: income × inability to pay energy bill in full. Note: As above, interaction between income and inability to pay. Note: Model also includes controls for age and HPS week. Red line indicates zero; circles and lines show coefficients with 95% confidence intervals.
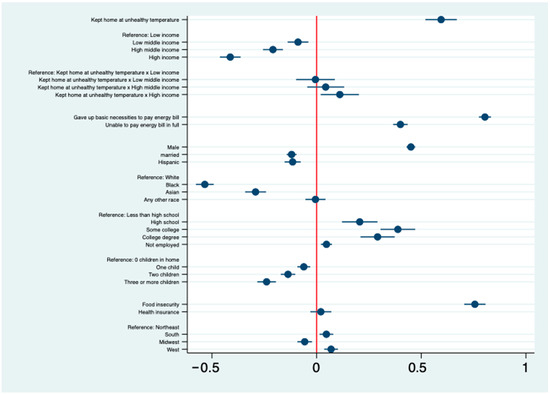
Figure 12.
Logit coefficients for anxiety: income × unsafe indoor temperature. Note: Model also includes controls for age and HPS week. Red line indicates zero; circles and lines show coefficients with 95% confidence intervals.
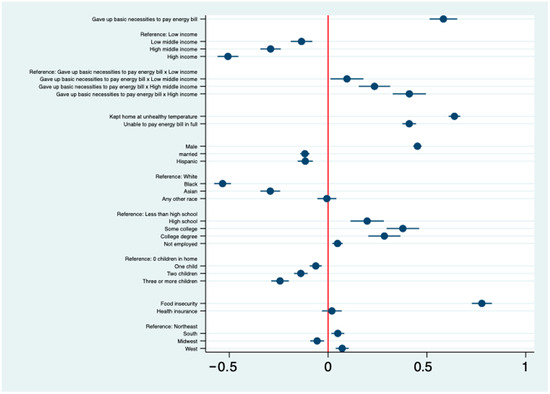
Figure 13.
Logit coefficients for anxiety: income × forgoing basic necessities to pay energy bills. Note: Model also includes controls for age and HPS week. Red line indicates zero; circles and lines show coefficients with 95% confidence intervals.
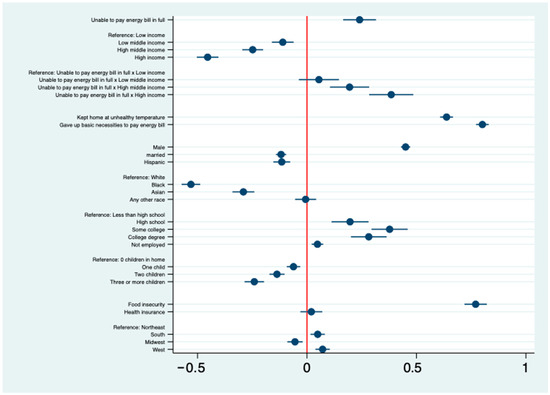
Figure 14.
Logit coefficients for anxiety: income × inability to pay energy bill in full. Note: Model also includes controls for age and HPS week. Red line indicates zero; circles and lines show coefficients with 95% confidence intervals.
Another important finding from this analysis is the significant relationship between food insecurity and mental health outcomes. Individuals grappling with food insecurity experienced higher odds of having anxiety and depression compared to those facing two of the energy insecurity indicators: unhealthy home temperatures and paying energy bills in full. Despite the considerable influence of food insecurity on mental well-being, this analysis reveals that the association between mental health and giving up basic necessities to pay energy bills surpasses that of food insecurity alone. This finding underscores the critical importance of addressing the multifaceted dimensions of energy insecurity, particularly the distressing reality of forgoing fundamental needs, including food, in efforts aimed at mitigating the profound mental health implications experienced by vulnerable populations.
4. Discussion
Results from the paper show that energy insecurity, particularly when it presents in the form of coping, has a significant and meaningful effect on depression and anxiety. Keeping the home at an unhealthy temperature and forgoing basic necessities such as food or medicine to pay a utility bill were associated with significantly higher odds of experiencing depression and anxiety than being unable to pay an energy bill. Interaction models further indicate that when energy insecurity is present, the negative association between income and anxiety and depression is attenuated.
Our findings provide suggestive evidence that reducing energy insecurity will also reduce anxiety and depression. At the federal level, the two main programs designed to reduce energy insecurity are the Low-Income Home Energy Assistance Program (LIHEAP) and the Weatherization Assistance Program (WAP). LIHEAP provides states with federally funded assistance to support families below 150% of the federal poverty line (FPL). LIHEAP funds can be used to reduce the costs associated with home energy bills, energy crises, weatherization, and minor energy-related home repairs [47]. By stabilizing bills during peak heat and cold through bill payment and crisis assistance, LIHEAP may reduce self-rationing that leads households to maintain unsafe temperatures and to forgo food or medicine to keep services on. Despite receiving various rounds of funding at the federal level since the pandemic, scholars have criticized the program as underfunded and only assisting a portion of the income-eligible population each year [48,49]. Given the interaction results, raising eligibility thresholds might improve targeting by reaching near-poor households, for whom bill-payment problems are associated with larger increases in anxiety and depression.
To adequately address energy insecurity, Congress should not only provide additional funding for LIHEAP but also expand eligibility to those families below 200% of the FPL, so the program can reach more people [49]. This expansion in funding and eligibility will allow more households to receive government aid to combat energy insecurity, not only preventing them from experiencing disconnections but also from facing the dangerous trade-offs that many energy-insecure households face when deciding whether to pay a bill or address another immediate necessity.
The Weatherization Assistance Program (WAP) reduces energy costs for low-income households by increasing the energy efficiency of their homes. This program provides grants to U.S. states, which then provide grants to local agencies to weatherize income-eligible low-income homes [50]. Increasing the current eligibility threshold (200% of FPL) and overall funding to the program could be effective in combating energy insecurity and thus mental health outcomes. Prioritizing HVAC repair/replacement and other health and safety measures (like CO/smoke detectors, and moisture/mold remediation, among others) within WAP ensures safe indoor temperatures and reduces reliance on risky coping strategies such as underheating or using unsafe heat sources. By lowering monthly consumption through building weatherization upgrades, WAP also lowers the likelihood that households must sacrifice basic necessities to pay utility bills. Because the temperature-related association is present across income levels, prioritizing these measures is relevant across the income distribution.
Individuals often give up basic necessities to pay energy bills or keep their homes at lower temperatures to deal with the economic burden of their bills. Expanding safety net policies, such as the Earned Income and Child Tax Credit, the Supplemental Nutrition Assistance Program, or Temporary Assistance for Needy Families, would provide more families with valuable income support that could be used to combat energy insecurity.
As it relates to sustainability, the passage of the Inflation Reduction Act (IRA) in 2022 represented an enormous effort in reducing carbon emissions in the US. The policy included various tax credits aimed at lowering home energy costs and making them more energy efficient, thereby providing an opportunity to combat energy insecurity while addressing the climate crisis. The IRA, which included measures such as tax credits of up to USD 2000 to install electric pumps for heating and cooling their homes, were set to save hundreds of dollars per year on energy bills. This legislation also provided the opportunity to save up to 30% of the cost of installation of rooftop solar, geothermal, or battery storage, which could save USD 400 per year on their energy bills. Furthermore, the IRA was set to invest USD 8.8 billion in home energy improvement programs focused on low- and middle-income families to buy and install cost-saving electric appliances [51]. While the federal policy landscape towards climate mitigation and the social safety has since shifted, states and municipalities may still find ways of continuing to support these housing decarbonization efforts that simultaneously offer relief from energy insecurity.
There is additional potential to mitigate energy insecurity at the state level. In March 2020, due to the onset of the COVID-19 pandemic, many states ordered a moratorium on utility disconnections. According to the National Association of Regulatory Utility Commissioners [52], at the height of the pandemic, over half of the states had established a disconnection moratorium for users in their jurisdiction. Since then, nearly all of these moratoria have expired. These policies granted vital relief to families who could not pay their gas and electric bills. In the long term, it may not be feasible for states to prohibit disconnections as many did at the height of the pandemic. However, there are other state-funded energy assistance programs that could be expanded or replicated. One such example is a longstanding, pre-pandemic state-level policy: the California Alternate Rates for Energy and the Family Electric Rate Assistance Program (CARE/FERA). This policy is carried out by the California Public Utilities Commission and provides low-income families with discounts on their utilities. The lowest-income families receive CARE, which provides up to a 30–35% discount on their electric bill and a 20% discount on their natural gas bill. Families of slightly higher income (200% FPL) are eligible for FERA, which provides an 18% discount on electricity bills [53]. Extending such discounts modestly above current cutoffs would align with the finding that bill-payment problems are linked to larger risk increases at higher incomes.
An important policy reform to combat energy insecurity would be to expand CARE/FERA nationwide. Instead of making families apply to receive the benefit, state governments could use tax information to automatically grant low-income families this benefit. Depending on the state, LIHEAP and WAP can be hard to access, especially if budget cuts to these essential programs are enacted. Even if a household is eligible, signing up to become a beneficiary can be a long, arduous process with burdensome documentation requirements [54,55]. Eliminating these administrative burdens can be crucial to a program’s success. Automatically subsidizing energy for families at the lower end of the income scale would be a straightforward way to provide widespread financial relief. With utility rates projected to rise sharply due to data center expansion and climate resilence investments, bill-assistance and rate reform may become increasingly necessary to protect energy access and corresponding mental and physical health benefits for low- and moderate-income households.
5. Limitations
This analysis is not without limitations. The principal limitation in this study is the non-response bias found in the Household Pulse Survey. Even though weights were included to achieve nationally representative samples, response rates were low. Of the four HPS weeks used in this sample, the highest response rate was Week 54 with a 7% response rate. In addition, there are several demographic groups that have disproportionately high response rates, including older respondents and white non-Hispanic respondents [56], groups that are less likely to experience energy insecurity [1]. Given this variation in response rates, it is possible that this data underestimates the prevalence of energy insecurity.
A second limitation is that cross-sectional data causal inferences cannot be made. Energy insecurity can be both a cause and a consequence of anxiety and depression. More longitudinal research and data collection are needed to understand exactly how and whether energy insecurity triggers or exacerbates mental health problems. A third limitation is the likelihood of omitted variable bias. The determinants of mental health are complex. Even with all of the controls in the study’s models, there are many factors (e.g., genetics, life experiences, social supports) not included in the HPS that are associated with mental health. Sensitivity analyses using Oster’s coefficient-stability approach (OLS analogs) suggest robustness to moderate unobserved confounding, but they do not eliminate the possibility of bias (see Appendix A).
6. Conclusions
Energy insecurity is strongly associated with anxiety and depression in the United States. Coping-related manifestations, forgoing basic necessities, and maintaining unhealthy indoor temperatures show a stronger association to adverse mental health than the inability to pay bills alone. While food insecurity remains an important determinant of mental health, this paper’s results indicate that severe energy-related trade-offs may be just as consequential. These findings underscore the need for policies that address not only the financial burden of energy costs but also the psychological toll of coping with inadequate energy access, including sustainable interventions such as energy-efficient improvements to housing and affordable and equitable rate designs. Income interaction results provide support for the claim that targeting should extend above current eligibility thresholds.
Author Contributions
Conceptualization, M.C., J.L., and D.H.; methodology, M.C. and J.L.; software, J.L.; validation, M.C., J.L., and D.H.; formal analysis, M.C. and J.L.; investigation, M.C., J.L., and D.H.; resources, D.H.; data curation, M.C. and J.L.; writing—original draft preparation, M.C.; writing—review and editing, M.C., J.L., and D.H.; visualization, M.C. and J.L.; supervision, D.H.; project administration, D.H.; funding acquisition, D.H. All authors have read and agreed to the published version of the manuscript.
Funding
The authors declare that financial support was received for the research, authorship, and/or publication of this article. Support for Mateo Cello’s effort on this project was furnished by the New York State Energy Research and Development Authority’s Climate Justice Fellows Program via Kinetic Communities Consulting Corporation (KC3). Support for Dr. Diana Hernández and the Energy Equity, Housing and Health (E2H2) Program at the Mailman School of Public Health includes funding from the JPB Foundation, the Robert Wood Johnson Foundation, the National Science Foundation, and the Alfred P. Sloan Foundation, which also supported Dr. Jennifer Laird’s efforts. Additional support for Dr. Hernández’s effort was furnished by the NIEHS Center for Environmental Health and Justice in Northern Manhattan (P30 ES009089) as well as the Center on Global Energy Policy via a gift from the bedari collective.
Institutional Review Board Statement
Not applicable.
Informed Consent Statement
Not applicable.
Data Availability Statement
HPS data is publicly available and can be accessed here: https://www.census.gov/data/experimental-data-products/household-pulse-survey.html (accessed on 5 April 2023).
Conflicts of Interest
The authors declare that they have no known competing financial interests or personal relationships that could have appeared to influence the work reported in this article.
Abbreviation
The following abbreviation is used in this manuscript:
| HPS | Household Pulse Survey |
Appendix A
Table A1.
Depression Logit Table.
Table A1.
Depression Logit Table.
| Variable | Coef | p-Value | Sig. |
|---|---|---|---|
| Kept home at unhealthy temperature (yes = 1) | 0.606 | 0.000 | *** |
| Forgo basic necessities to pay energy bill (yes = 1) | 0.733 | 0.000 | *** |
| Unable to pay energy bill in full (yes = 1) | 0.327 | 0.000 | *** |
| Age (years) | 0.005 | 0.030 | * |
| Age squared | 0.000 | 0.000 | *** |
| Male | 0.055 | 0.000 | *** |
| Married (yes = 1) | −0.280 | 0.000 | *** |
| Hispanic (yes = 1) | −0.139 | 0.000 | *** |
| Race: Black (ref: White) | −0.444 | 0.000 | *** |
| Race: Asian (ref: White) | −0.201 | 0.000 | *** |
| Race: Any other (ref: White) | 0.014 | 0.743 | |
| Income: USD 25–49 k (ref: <USD 25 k) | −0.113 | 0.000 | *** |
| Income: USD 50–99 k (ref: <USD 25 k) | −0.238 | 0.000 | *** |
| Income: ≥USD 100 k (ref: <USD 25 k) | −0.481 | 0.000 | *** |
| Education: High school (ref: <HS) | 0.136 | 0.001 | ** |
| Education: Some college (ref: <HS) | 0.295 | 0.000 | *** |
| Education: College degree (ref: <HS) | 0.133 | 0.001 | ** |
| Not employed | 0.202 | 0.000 | *** |
| Children in house: 1 (ref: 0) | −0.126 | 0.000 | *** |
| Children in house: 2 (ref: 0) | −0.236 | 0.000 | *** |
| Children in house: ≥3 (ref: 0) | −0.347 | 0.000 | *** |
| Food insecure (yes = 1) | 0.698 | 0.000 | *** |
| Health insurance | −0.073 | 0.001 | ** |
| Region: South (ref: Northeast) | 0.084 | 0.000 | *** |
| Region: Midwest (ref: Northeast) | 0.020 | 0.451 | |
| Region: West (ref: Northeast) | 0.100 | 0.000 | *** |
| Week 50 (ref: Week 61) | 0.363 | 0.000 | *** |
| Week 54 (ref: Week 61) | 0.257 | 0.000 | *** |
| Week 57 (ref: Week 61) | 0.206 | 0.000 | *** |
| Constant | −0.126 | 0.127 |
Note: p < 0.10, * p < 0.05, ** p < 0.01, *** p < 0.001.
Table A2.
Anxiety logit table.
Table A2.
Anxiety logit table.
| Variable | Coef | p | Sig. |
|---|---|---|---|
| Kept home at unhealthy temperature (yes = 1) | 0.639 | 0.000 | *** |
| Forgo basic necessities to pay energy bill (yes = 1) | 0.804 | 0.000 | *** |
| Unable to pay energy bill in full (yes = 1) | 0.399 | 0.000 | *** |
| Age (years) | −0.006 | 0.025 | * |
| Age squared | −0.000 | 0.000 | *** |
| Gender (female = 1) | 0.451 | 0.000 | *** |
| Married (yes = 1) | −0.120 | 0.000 | *** |
| Hispanic (yes = 1) | −0.114 | 0.000 | *** |
| Race: Black (ref: White) | −0.533 | 0.000 | *** |
| Race: Asian (ref: White) | −0.290 | 0.000 | *** |
| Race: Any other (ref: White) | −0.005 | 0.867 | |
| Income: USD 25–49 k (ref: <USD 25 k) | −0.088 | 0.000 | *** |
| Income: USD 50–99 k (ref: <USD 25 k) | −0.196 | 0.000 | *** |
| Income: ≥USD 100 k (ref: <USD 25 k) | −0.393 | 0.000 | *** |
| Education: High school (ref: <HS) | 0.207 | 0.000 | *** |
| Education: Some college (ref: <HS) | 0.389 | 0.000 | *** |
| Education: College degree (ref: <HS) | 0.291 | 0.000 | *** |
| Any household member not employed (yes = 1) | 0.047 | 0.001 | ** |
| Children in house: 1 | −0.061 | 0.000 | *** |
| Children in house: 2 | −0.137 | 0.000 | *** |
| Children in house: ≥3 | −0.238 | 0.000 | *** |
| Food insecure (yes = 1) | 0.751 | 0.000 | *** |
| Insured (yes = 1) | 0.020 | 0.482 | |
| Region: South (ref: Northeast) | 0.047 | 0.022 | * |
| Region: Midwest (ref: Northeast) | −0.057 | 0.008 | ** |
| Region: West (ref: Northeast) | 0.069 | 0.001 | ** |
| Week 50 (ref: Week 61) | 0.485 | 0.000 | *** |
| Week 54 (ref: Week 61) | 0.307 | 0.000 | *** |
| Week 57 (ref: Week 61) | 0.228 | 0.000 | *** |
| Constant | −0.373 | 0.000 | *** |
Note: p < 0.10, * p < 0.05, ** p < 0.01, *** p < 0.001.
Table A3.
Logit coefficients for depression: income × unsafe indoor temperature.
Table A3.
Logit coefficients for depression: income × unsafe indoor temperature.
| Variable | Coef | p-Value | Sig. |
|---|---|---|---|
| Kept home at unhealthy temperature | 0.540 | 0.000 | *** |
| Low middle income (ref: Low income) | −0.120 | 0.000 | *** |
| High middle income (ref: Low income) | −0.254 | 0.000 | *** |
| High income (ref: Low income) | −0.514 | 0.000 | *** |
| Kept home at unhealthy temperature × low middle income (ref: Kept home at unhealthy temperature × low income) | 0.016 | 0.716 | |
| Kept home at unhealthy temperature × High middle income (ref: Kept home at unhealthy temperature × low income) | 0.045 | 0.287 | |
| Kept home at unhealthy temperature × High middle income (ref: Kept home at unhealthy temperature × low income) | 0.174 | 0.000 | *** |
| Gave up basic necessities to pay energy bill | 0.732 | 0.000 | *** |
| Unable to pay energy bill in full | 0.328 | 0.000 | *** |
| Age (years) | 0.005 | 0.037 | * |
| Age squared | 0.000 | 0.000 | *** |
| Male | 0.055 | 0.000 | *** |
| Married | −0.280 | 0.000 | *** |
| Hispanic | −0.139 | 0.000 | *** |
| Race: Black (ref: White) | −0.445 | 0.000 | *** |
| Race: Asian (ref: White) | −0.203 | 0.000 | *** |
| Race: Any other (ref: White) | 0.013 | 0.579 | |
| Education: High school (ref: <HS) | 0.135 | 0.001 | ** |
| Education: Some college (ref: <HS) | 0.295 | 0.000 | *** |
| Education: College degree (ref: <HS) | 0.134 | 0.001 | ** |
| Not employed | 0.203 | 0.000 | *** |
| Children in house: 1 (ref: 0) | −0.126 | 0.000 | *** |
| Children in house: 2 (ref: 0) | −0.236 | 0.000 | *** |
| Children in house: ≥3 (ref: 0) | −0.348 | 0.000 | *** |
| Food insecurity | 0.704 | 0.000 | *** |
| Health insurance | −0.073 | 0.003 | ** |
| Region: South (ref: Northeast) | 0.085 | 0.000 | *** |
| Region: Midwest (ref: Northeast) | 0.020 | 0.279 | |
| Region: West (ref: Northeast) | 0.100 | 0.000 | *** |
| Week 50 (ref: Week 61) | 0.363 | 0.000 | *** |
| Week 54 (ref: Week 61) | 0.257 | 0.000 | *** |
| Week 57 (ref: Week 61) | 0.206 | 0.000 | *** |
| Constant | −0.111 | 0.181 |
Note: p < 0.10, * p < 0.05, ** p < 0.01, *** p < 0.001.
Table A4.
Logit coefficients for depression: income × forgoing basic necessities to pay energy bills.
Table A4.
Logit coefficients for depression: income × forgoing basic necessities to pay energy bills.
| Variable | Coef | p-Value | Sig. |
|---|---|---|---|
| Gave up basic necessities to pay energy bill | 0.524 | 0.000 | *** |
| Low middle income (ref: Low income) | −0.167 | 0.000 | *** |
| High middle income (ref: Low income) | −0.330 | 0.000 | *** |
| High income (ref: Low income) | −0.605 | 0.000 | *** |
| Gave up basic necessities to pay energy bill × Low middle income (ref: Gave up basic necessities to pay energy bill × Low income) | 0.109 | 0.008 | ** |
| Gave up basic necessities to pay energy bill × High middle income (ref: Gave up basic necessities to pay energy bill × Low income) | 0.202 | 0.000 | *** |
| Gave up basic necessities to pay energy bill × High income (ref: Gave up basic necessities to pay energy bill × Low income) | 0.404 | 0.000 | *** |
| Kept home at unsafe temperature | 0.604 | 0.000 | *** |
| Unable to pay energy bill in full | 0.337 | 0.000 | *** |
| Age (years) | 0.005 | 0.026 | * |
| Age squared | 0.000 | 0.000 | *** |
| Male | 0.056 | 0.000 | *** |
| Married | −0.278 | 0.000 | *** |
| Hispanic | −0.140 | 0.000 | *** |
| Race: Black (ref: White) | −0.444 | 0.000 | *** |
| Race: Asian (ref: White) | −0.203 | 0.000 | *** |
| Race: Any other (ref: White) | 0.013 | 0.596 | |
| Education: High school (ref: <HS) | 0.128 | 0.002 | ** |
| Education: Some college (ref: <HS) | 0.287 | 0.000 | *** |
| Education: College degree (ref: <HS) | 0.128 | 0.002 | ** |
| Not employed | 0.203 | 0.000 | *** |
| Children in house: 1 (ref: 0) | −0.127 | 0.000 | *** |
| Children in house: 2 (ref: 0) | −0.237 | 0.000 | *** |
| Children in house: ≥3 (ref: 0) | −0.352 | 0.000 | *** |
| Food insecurity | 0.722 | 0.000 | *** |
| Health insurance | −0.074 | 0.003 | ** |
| Region: South (ref: Northeast) | 0.087 | 0.000 | *** |
| Region: Midwest (ref: Northeast) | 0.021 | 0.248 | |
| Region: West (ref: Northeast) | 0.102 | 0.000 | *** |
| Week 50 (ref: Week 61) | 0.364 | 0.000 | *** |
| Week 54 (ref: Week 61) | 0.257 | 0.000 | *** |
| Week 57 (ref: Week 61) | 0.206 | 0.000 | *** |
| Constant | −0.042 | 0.615 |
Note: p < 0.10, * p < 0.05, ** p < 0.01, *** p < 0.001.
Table A5.
Logit coefficients for depression: income × inability to pay energy bill in full.
Table A5.
Logit coefficients for depression: income × inability to pay energy bill in full.
| Variable | Coef | p-Value | Sig. |
|---|---|---|---|
| Unable to pay energy bill in full | 0.182 | 0.000 | *** |
| Low middle income (ref: Low income) | −0.138 | 0.000 | *** |
| High middle income (ref: Low income) | −0.287 | 0.000 | *** |
| High income (ref: Low income) | −0.547 | 0.000 | *** |
| Unable to pay energy bill in full × Low middle income (ref: Unable to pay energy bill in full × Low income) | 0.063 | 0.148 | |
| Unable to pay energy bill in full × High middle income (ref: Unable to pay energy bill in full × Low income) | 0.155 | 0.000 | *** |
| Unable to pay energy bill in full × High income (ref: Unable to pay energy bill in full × Low income) | 0.383 | 0.000 | *** |
| Kept home at unsafe temperature | 0.603 | 0.000 | *** |
| Gave up basic necessities to pay energy bill | 0.728 | 0.000 | *** |
| Age (years) | 0.005 | 0.026 | * |
| Age squared | 0.000 | 0.000 | *** |
| Male | 0.054 | 0.000 | *** |
| Married | −0.279 | 0.000 | *** |
| Hispanic | −0.140 | 0.000 | *** |
| Race: Black (ref: White) | −0.441 | 0.000 | *** |
| Race: Asian (ref: White) | −0.201 | 0.000 | *** |
| Race: Any other (ref: White) | 0.013 | 0.599 | |
| Education: High school (ref: <HS) | 0.127 | 0.003 | ** |
| Education: Some college (ref: <HS) | 0.285 | 0.000 | *** |
| Education: College degree (ref: <HS) | 0.125 | 0.002 | ** |
| Not employed | 0.203 | 0.000 | *** |
| Children in house: 1 (ref: 0) | −0.127 | 0.000 | *** |
| Children in house: 2 (ref: 0) | −0.236 | 0.000 | *** |
| Children in house: ≥3 (ref: 0) | −0.349 | 0.000 | *** |
| Food insecurity | 0.715 | 0.000 | *** |
| Health insurance | −0.074 | 0.003 | ** |
| Region: South (ref: Northeast) | 0.087 | 0.000 | *** |
| Region: Midwest (ref: Northeast) | 0.022 | 0.234 | |
| Region: West (ref: Northeast) | 0.102 | 0.000 | *** |
| Week 50 (ref: Week 61) | 0.365 | 0.000 | *** |
| Week 54 (ref: Week 61) | 0.258 | 0.000 | *** |
| Week 57 (ref: Week 61) | 0.207 | 0.000 | *** |
| Constant | −0.081 | 0.330 |
Note: p < 0.10, * p < 0.05, ** p < 0.01, *** p < 0.001.
Table A6.
Logit coefficients for anxiety: income × unsafe indoor temperature.
Table A6.
Logit coefficients for anxiety: income × unsafe indoor temperature.
| Variable | Coef | p-Value | Sig. |
|---|---|---|---|
| Kept home at unhealthy temperature | 0.595 | 0.000 | *** |
| Low middle income (ref: Low income) | −0.089 | 0.000 | *** |
| High middle income (ref: Low income) | −0.208 | 0.000 | *** |
| High income (ref: Low income) | −0.413 | 0.000 | *** |
| Kept home at unhealthy temperature × low middle income (ref: Kept home at unhealthy temperature × low income) | −0.005 | 0.908 | |
| Kept home at unhealthy temperature × High middle income (ref: Kept home at unhealthy temperature × low income) | 0.043 | 0.336 | |
| Kept home at unhealthy temperature × High middle income (ref: Kept home at unhealthy temperature × low income) | 0.111 | 0.017 | * |
| Gave up basic necessities to pay energy bill | 0.804 | 0.000 | *** |
| Unable to pay energy bill in full | 0.400 | 0.000 | *** |
| Age (years) | −0.006 | 0.012 | * |
| Age squared | 0.000 | 0.000 | *** |
| Male | 0.451 | 0.000 | *** |
| Married | −0.119 | 0.000 | *** |
| Hispanic | −0.114 | 0.000 | *** |
| Race: Black (ref: White) | −0.534 | 0.000 | *** |
| Race: Asian (ref: White) | −0.292 | 0.000 | *** |
| Race: Any other (ref: White) | −0.005 | 0.825 | |
| Education: High school (ref: <HS) | 0.206 | 0.000 | *** |
| Education: Some college (ref: <HS) | 0.388 | 0.000 | *** |
| Education: College degree (ref: <HS) | 0.291 | 0.000 | *** |
| Not employed | 0.047 | 0.000 | *** |
| Children in house: 1 (ref: 0) | −0.061 | 0.000 | *** |
| Children in house: 2 (ref: 0) | −0.136 | 0.000 | *** |
| Children in house: ≥3 (ref: 0) | −0.239 | 0.000 | *** |
| Food insecurity | 0.756 | 0.000 | *** |
| Health insurance | 0.020 | 0.430 | |
| Region: South (ref: Northeast) | 0.047 | 0.005 | ** |
| Region: Midwest (ref: Northeast) | −0.057 | 0.001 | ** |
| Region: West (ref: Northeast) | 0.069 | 0.000 | *** |
| Week 50 (ref: Week 61) | 0.485 | 0.000 | *** |
| Week 54 (ref: Week 61) | 0.307 | 0.000 | *** |
| Week 57 (ref: Week 61) | 0.228 | 0.000 | *** |
| Constant | −0.363 | 0.000 | *** |
Note: p < 0.10, * p < 0.05, ** p < 0.01, *** p < 0.001.
Table A7.
Logit coefficients for anxiety: income × forgoing basic necessities to pay energy bills.
Table A7.
Logit coefficients for anxiety: income × forgoing basic necessities to pay energy bills.
| Variable | Coef | p-Value | Sig. |
|---|---|---|---|
| Gave up basic necessities to pay energy bill | 0.584 | 0.000 | *** |
| Low middle income (ref: Low income) | −0.134 | 0.000 | *** |
| High middle income (ref: Low income) | −0.291 | 0.000 | *** |
| High income (ref: Low income) | −0.507 | 0.000 | |
| Gave up basic necessities to pay energy bill × Low middle income (ref: Gave up basic necessities to pay energy bill × Low income) | 0.095 | 0.025 | ** |
| Gave up basic necessities to pay energy bill × High middle income (ref: Gave up basic necessities to pay energy bill × Low income) | 0.235 | 0.000 | ** |
| Gave up basic necessities to pay energy bill × High income (ref: Gave up basic necessities to pay energy bill × Low income) | 0.411 | 0.000 | *** |
| Kept home at unsafe temperature | 0.639 | 0.000 | *** |
| Unable to pay energy bill in full | 0.410 | 0.000 | *** |
| Age (years) | −0.006 | 0.018 | *** |
| Age squared | 0.000 | 0.000 | *** |
| Male | 0.452 | 0.000 | *** |
| Married | −0.118 | 0.000 | *** |
| Hispanic | −0.115 | 0.000 | *** |
| Race: Black (ref: White) | −0.534 | 0.000 | *** |
| Race: Asian (ref: White) | −0.293 | 0.000 | *** |
| Race: Any other (ref: White) | −0.006 | 0.801 | *** |
| Education: High school (ref: <HS) | 0.198 | 0.000 | *** |
| Education: Some college (ref: <HS) | 0.378 | 0.000 | *** |
| Education: College degree (ref: <HS) | 0.285 | 0.000 | *** |
| Not employed | 0.048 | 0.000 | *** |
| Children in house: 1 (ref: 0) | −0.062 | 0.000 | *** |
| Children in house: 2 (ref: 0) | −0.138 | 0.000 | *** |
| Children in house: ≥3 (ref: 0) | −0.243 | 0.000 | *** |
| Food insecurity | 0.778 | 0.000 | *** |
| Health insurance | 0.019 | 0.455 | *** |
| Region: South (ref: Northeast) | 0.049 | 0.003 | *** |
| Region: Midwest (ref: Northeast) | −0.055 | 0.002 | *** |
| Region: West (ref: Northeast) | 0.071 | 0.000 | *** |
| Week 50 (ref: Week 61) | 0.487 | 0.000 | *** |
| Week 54 (ref: Week 61) | 0.308 | 0.000 | *** |
| Week 57 (ref: Week 61) | 0.228 | 0.000 | *** |
| Constant | −0.290 | 0.001 | *** |
Note: p < 0.10, ** p < 0.01, *** p < 0.001.
Table A8.
Logit coefficients for anxiety: income × inability to pay energy bill in full.
Table A8.
Logit coefficients for anxiety: income × inability to pay energy bill in full.
| Variable | Coef | p-Value | Sig. |
|---|---|---|---|
| Unable to pay energy bill in full | 0.240 | 0.000 | *** |
| Low middle income (ref: Low income) | −0.111 | 0.000 | *** |
| High middle income (ref: Low income) | −0.248 | 0.000 | *** |
| High income (ref: Low income) | −0.454 | 0.000 | |
| Unable to pay energy bill in full × Low middle income (ref: Unable to pay energy bill in full × Low income) | 0.055 | 0.244 | ** |
| Unable to pay energy bill in full × High middle income (ref: Unable to pay energy bill in full × Low income) | 0.194 | 0.000 | ** |
| Unable to pay energy bill in full × High income (ref: Unable to pay energy bill in full × Low income) | 0.385 | 0.000 | *** |
| Kept home at unsafe temperature | 0.638 | 0.000 | *** |
| Gave up basic necessities to pay energy bill | 0.801 | 0.000 | *** |
| Age (years) | −0.006 | 0.018 | *** |
| Age squared | 0.000 | 0.000 | *** |
| Male | 0.450 | 0.000 | *** |
| Married | −0.118 | 0.000 | *** |
| Hispanic | −0.115 | 0.000 | *** |
| Race: Black (ref: White) | −0.530 | 0.000 | *** |
| Race: Asian (ref: White) | −0.291 | 0.000 | *** |
| Race: Any other (ref: White) | −0.006 | 0.802 | *** |
| Education: High school (ref: <HS) | 0.197 | 0.000 | *** |
| Education: Some college (ref: <HS) | 0.377 | 0.000 | *** |
| Education: College degree (ref: <HS) | 0.282 | 0.000 | *** |
| Not employed | 0.048 | 0.000 | *** |
| Children in house: 1 (ref: 0) | −0.062 | 0.000 | *** |
| Children in house: 2 (ref: 0) | −0.137 | 0.000 | *** |
| Children in house: ≥3 (ref: 0) | −0.241 | 0.000 | *** |
| Food insecurity | 0.770 | 0.000 | *** |
| Health insurance | 0.020 | 0.440 | *** |
| Region: South (ref: Northeast) | 0.049 | 0.004 | *** |
| Region: Midwest (ref: Northeast) | −0.055 | 0.002 | *** |
| Region: West (ref: Northeast) | 0.071 | 0.000 | *** |
| Week 50 (ref: Week 61) | 0.487 | 0.000 | *** |
| Week 54 (ref: Week 61) | 0.308 | 0.000 | *** |
| Week 57 (ref: Week 61) | 0.228 | 0.000 | *** |
| Constant | −0.326 | 0.000 | *** |
Note: ** p < 0.01, *** p < 0.001.
Table A9.
Comparison of included (estimation sample) and excluded cases.
Table A9.
Comparison of included (estimation sample) and excluded cases.
| Excluded (Missing on Energy Insecurity/Mental Health Controls | Included (Depression and Anxiety Model Sample) | |
|---|---|---|
| Age | 58.889 | 49.362 |
| Female | 0.501 | 0.518 |
| Married | 0.446 | 0.568 |
| Health insurance | 0.894 | 0.921 |
| Not employed | 0.634 | 0.378 |
| Food insecurity | 0.169 | 0.111 |
| Hispanic | 0.825 | 0.843 |
| White | 0.699 | 0.775 |
| Black | 0.186 | 0.109 |
| Asian | 0.050 | 0.055 |
| Any other race | 0.065 | 0.061 |
| Low income | 0.274 | 0.128 |
| Low-middle-income | 0.283 | 0.233 |
| High-middle-income | 0.249 | 0.308 |
| High income | 0.193 | 0.331 |
| Less than HS | 0.195 | 0.061 |
| High school | 0.364 | 0.284 |
| Some college | 0.171 | 0.205 |
| College degree | 0.270 | 0.450 |
| Zero children in the house | 0.621 | 0.642 |
| One child | 0.206 | 0.167 |
| Two children | 0.094 | 0.118 |
| Three or more children | 0.079 | 0.073 |
| Northeast | 0.197 | 0.167 |
| South | 0.374 | 0.382 |
| Midwest | 0.154 | 0.209 |
| West | 0.275 | 0.241 |
Table A10.
Oster robustness (δ) for the association between energy insecurity and mental health.
Table A10.
Oster robustness (δ) for the association between energy insecurity and mental health.
| Outcome | Exposure | β (Restricted) | R2 (Restricted) | β (Full) | R2 (Full) | Rmax | δ to β = 0 |
|---|---|---|---|---|---|---|---|
| Depression | Kept home at unhealthy temperature | 0.293 | 0.057 | 0.204 | 0.138 | 0.179 | 2.782 |
| Depression | Gave up basic necessities to pay energy bills | 0.312 | 0.058 | 0.189 | 0.13 | 0.169 | 1.818 |
| Depression | Unable to pay energy bill in full | 0.329 | 0.091 | 0.234 | 0.149 | 0.194 | 1.775 |
| Anxiety | Kept home at unhealthy temperature | 0.29 | 0.053 | 0.212 | 0.147 | 0.191 | 3.283 |
| Anxiety | Gave up basic necessities to pay energy bills | 0.325 | 0.06 | 0.203 | 0.14 | 0.182 | 1.914 |
| Anxiety | Unable to pay energy bill in full | 0.34 | 0.092 | 0.252 | 0.161 | 0.21 | 1.922 |
References
- Hernández, D.; Laird, J. Powerless: The People’s Struggle for Energy; Russell Sage Foundation: New York, NY, USA, 2025. [Google Scholar]
- Hernández, D. Understanding ‘energy insecurity’ and why it matters to health. Soc. Sci. Med. 2016, 167, 1–10. [Google Scholar] [CrossRef]
- Hernández, D.; Phillips, D.; Siegel, E.L. Exploring the Housing and Household Energy Pathways to Stress: A Mixed Methods Study. Int. J. Environ. Res. Public Health 2016, 13, 916. [Google Scholar] [CrossRef]
- Siegel, E.L.; Lane, K.; Yuan, A.; Smalls-Mantey, L.A.; Laird, J.; Olson, C.; Hernández, D. Energy Insecurity Indicators Associated with Increased Odds Of Respiratory, Mental Health, and Cardiovascular Conditions. Health Aff. 2024, 43, 260–268. [Google Scholar] [CrossRef] [PubMed]
- Mashke, K.; St Pierre, O.; Vigrass, J.; Gledhill, S.; Ekille, E.; Kim, E.A.; Bozzi, L. Energy Justice and Health In a Changing Climate; Yale School of Public Health: New Haven, CT, USA, 2022. [Google Scholar]
- Hernández, D.; Siegel, E. Energy insecurity and its ill health effects: A community perspective on the energy-health nexus in New York City. Energy Res. Soc. Sci. 2019, 47, 78–83. [Google Scholar] [CrossRef]
- Fernandez, C.; Yomogida, M.; Aratani, Y.; Hernandez, D. Dual Food and Energy Hardship and Associated Child Behavior Problems. Acad. Pediatr. 2018, 18, 889–896. [Google Scholar] [CrossRef]
- Shenassa, E.D.; Daskalakis, C.; Liebhaber, A.; Braubach, M.; Brown, M. Dampness and mold in the home and depression: An examination of mold-related illness and perceived control of one’s home as possible depression pathways. Am. J. Public Health 2007, 97, 1893–1899. [Google Scholar] [CrossRef]
- Bentley, R.; Daniel, L.; Li, Y.; Baker, E.; Li, A. The effect of energy poverty on mental health, cardiovascular disease and respiratory health: A longitudinal analysis. Lancet Reg. Health West. Pac. 2023, 35, 100734. [Google Scholar] [CrossRef]
- Liddell, C.; Morris, C. Fuel poverty and human health: A review of recent evidence. Energy Policy 2010, 38, 2987–2997. [Google Scholar] [CrossRef]
- Mohan, G. The impact of household energy poverty on the mental health of parents of young children. J. Public Health 2022, 44, 121–128. [Google Scholar] [CrossRef] [PubMed]
- Riva, M.; Makasi, S.K.; O’Sullivan, K.C.; Das, R.R.; Dufresne, P.; Kaiser, D.; Breau, S. Energy poverty: An overlooked determinant of health and climate resilience in Canada. Can. J. Public Health 2023, 114, 422–431. [Google Scholar] [CrossRef]
- Xu, W.; Xie, B.; Lou, B.; Wang, W.; Wang, Y. Assessing the effect of energy poverty on the mental and physical health in China—Evidence from China family panel studies. Front. Energy Res. 2022, 10, 944415. [Google Scholar] [CrossRef]
- Zhang, J.; He, Y.; Zhang, J. Energy Poverty and Depression in Rural China: Evidence from the Quantile Regression Approach. Int. J. Environ. Res. Public Health 2022, 19, 1006. [Google Scholar] [CrossRef]
- Han, S.; Hu, M.; Gao, X.; Huang, Y.; Guo, F.; Shen, G.C.; Wang, D.; Lin, S.; Zhang, K. Energy burden and mental health: A national study in the United States. Sci. Total Environ. 2024, 955, 176796. [Google Scholar] [CrossRef]
- Sen, K.K.; Singha, B.; Karmaker, S.C.; Hosan, S.; Chapman, A.J.; Saha, B.B. Unveiling the effects of energy poverty on mental health of children in energy-poor countries. Energy Res. Soc. Sci. 2024, 117, 103729. [Google Scholar] [CrossRef]
- Khavandi, S.; McColl, L.; Leavey, C.; McGowan, V.J.; Bennett, N.C. The Mental Health Impacts of Fuel Poverty: A Global Scoping Review. Int. J. Public Health 2024, 69, 1607459. [Google Scholar] [CrossRef] [PubMed]
- Sareen, J.; Afifi, T.O.; McMillan, K.A.; Asmundson, G.J.G. Relationship Between Household Income and Mental Disorders: Findings From a Population- Based Longitudinal Study. Arch Gen Psychiatry 2011, 68, 419–427. [Google Scholar] [CrossRef] [PubMed]
- Leis, J.A.; Heron, J.; Stuart, E.A.; Mendelson, T. Associations Between Maternal Mental Health and Child Emotional and Behavioral Problems: Does Prenatal Mental Health Matter? J. Abnorm. Child Psychol. 2014, 42, 161–171. [Google Scholar] [CrossRef]
- Mulraney, M.; Coghill, D.; Bishop, C.; Mehmed, Y.; Sciberras, E.; Sawyer, M.; Efron, D.; Hiscock, H. A systematic review of the persistence of childhood mental health problems into adulthood. Neurosci. Biobehav. Rev. 2021, 129, 182–205. [Google Scholar] [CrossRef]
- Lerner, D.; Adler, D.A.; Rogers, W.H.; Chang, H.; Lapitsky, L.; McLaughlin, T.; Reed, J. Work performance of employees with depression: The impact of work stressors. Am. J. Health Promot. 2010, 24, 205–213. [Google Scholar] [CrossRef]
- Kim, K.L.; Jacobs, P.; Ohinmaa, A.; Schopflocher, D.; Dewa, C.S. A new population-based measure of the economic burden of mental illness in Canada. Chronic Dis. Can. 2008, 28, 3. [Google Scholar] [CrossRef]
- Lund, C.; Docrat, S.; Abdulmalik, J.; Alem, A.; Fekadu, A.; Gureje, O.; Gurung, D.; Hailemariam, D.; Hailemichael, Y.; Hanlon, C.; et al. Household economic costs associated with mental, neurological and substance use disorders: A cross-sectional survey in six low- and middle-income countries. BJPsych Open. 2019, 5, e34. [Google Scholar] [CrossRef]
- Hashmi, R.; Clair, A.; Baker, E. Unpacking the mental health effects of energy poverty: Implications of energy poverty metric choice for research and policy. Energy Res. Soc. Sci. 2025, 125, 104115. [Google Scholar] [CrossRef]
- Reeder, N.; Tolar-Peterson, T.; Bailey, R.H.; Cheng, W.-H.; Evans, M.W., Jr. Food Insecurity and Depression among US Adults: NHANES 2005–2016. Nutrients 2022, 14, 3081. [Google Scholar] [CrossRef]
- Scott, A.J.; Webb, T.L.; James, M.M.-S.; Rowse, G.; Weich, S. Improving sleep quality leads to better mental health: A meta-analysis of randomised controlled trials. Sleep Med. Rev. 2021, 60, 101556. [Google Scholar] [CrossRef]
- Census Bureau Household Pulse Survey. 2023. Available online: https://www.census.gov/data/experimental-data-products/household-pulse-survey.html (accessed on 2 January 2023).
- Gilbody, S.; Richards, D.; Brealey, S.; Hewitt, C. Screening for depression in medical settings with the Patient Health Questionnaire (PHQ): A diagnostic meta-analysis. J. Gen. Intern. 2007, 22, 1596–1602. [Google Scholar] [CrossRef] [PubMed]
- Kroenke, K.; Spitzer, R.L.; Williams, J.B.W.; Monahan, P.O.; Lowe, B. Anxiety disorders in primary care: Prevalence, impairment, comorbidity, and detection. Ann. Intern. Med. 2007, 146, 5. [Google Scholar] [CrossRef] [PubMed]
- Hernández, D.; Aratani, Y.; Jiang, Y. Energy Insecurity Among Families with Children. National Center for Children in Poverty. 2014. Available online: https://www.nccp.org/publication/energy-insecurity-among-families-with-children/ (accessed on 10 October 2022).
- Hernandez, D.; Jiang, Y.; Carrión, D.; Phillips, D.; Aratani, Y. Housing hardship and energy insecurity among native-born and immigrant low-income families with children in the United States. J. Child Poverty. 2016, 22, 77–92. [Google Scholar] [CrossRef] [PubMed]
- Fang, D.; Thomsen, M.R.; Nayga, R.M. The association between food insecurity and mental health during the COVID-19 pandemic. BMC Public Health 2021, 21, 607. [Google Scholar] [CrossRef]
- Karpur, A.; Vasudevan, V.; Frazier, T.W.; Shih, A.J. Food insecurity in households of children with ASD in COVID-19 pandemic: A comparative analysis with the Household Pulse Survey data using stabilized inverse probability treatment weights. Disabil Health J. 2022, 15, 101323. [Google Scholar] [CrossRef]
- Fry, C.E.; Sommers, B.D. Effect of Medicaid Expansion on Health Insurance Coverage and Access to Care Among Adults With Depression. Psychiatr. Serv. 2018, 69, 1121–1194. [Google Scholar] [CrossRef]
- Baicker, K.; Allen, H.L.; Wright, B.J.; Taubman, S.L.; Finkelstein, A.N. The Effect of Medicaid on Management of Depression: Evidence From the Oregon Health Insurance Experiment. Milbank Q. 2018, 96, 29–56. [Google Scholar] [CrossRef]
- Lang, M. The Impact of Mental Health Insurance Laws on State Suicide Rates. Health Econ. 2013, 22, 73–88. [Google Scholar] [CrossRef]
- Mulvale, G.; Hurley, J. Insurance Coverage and the Treatment of Mental Illness: Effect on Medication and Provider use. J. Ment. Health Policy Econ. 2008, 11, 177–199. [Google Scholar]
- Asnaani, A.; Richey, J.A.; Dimaite, R.; Hinton, D.E.; Hofmann, S.G. A cross-ethnic comparison of lifetime prevalence rates of anxiety disorders. J. Nerv. Ment. Dis. 2010, 198, 551–555. [Google Scholar] [CrossRef] [PubMed]
- Cohen, A.K.; Nussbaum, J.; Weintraub, M.L.R.; Nichols, C.R.; Yen, I.H. Association of Adult Depression With Educational Attainment, Aspirations, and Expectations. Prev. Chronic Dis. 2020, 17, 200098. [Google Scholar] [CrossRef] [PubMed]
- Bjelland, I.; Krokstad, S.; Mykletun, A.; Dahl, A.A.; Tell, G.S.; Tambs, K. Does a higher educational level protect against anxiety and depression? The HUNT study. Soc. Sci. Med. 2008, 66, 1334–1345. [Google Scholar] [CrossRef] [PubMed]
- van der Noordt, M.; IJzelenberg, H.; Droomers, M.; Proper, K.I. Health effects of employment: A systematic review of prospective studies. Occup. Environ. Med. 2014, 71, 730–736. [Google Scholar] [CrossRef]
- Institute of Medicine (US) Committee on the Consequences of Uninsurance. Care Without Coverage: Too Little, Too Late; Effects of Health Insurance on Health; National Academies Press (US): Washington, DC, USA, 2002; Volume 3. Available online: https://www.ncbi.nlm.nih.gov/books/NBK220636/ (accessed on 5 November 2022).
- Horwitz, A.V.; White, H.R.; Howell-White, S. Becoming Married and Mental Health: A Longitudinal Study of a Cohort of Young Adults. J. Marriage Fam. 1996, 58, 895–907. [Google Scholar] [CrossRef]
- Albert, P.R. Why is depression more prevalent in women? J. Psychiatry Neurosci. 2015, 40, 219–221. [Google Scholar] [CrossRef]
- Le, H.T.; Lai, A.J.X.; Sun, J.; Hoang, M.T.; Vu, L.G.; Pham, H.Q.; Nguyen, T.H.; Tran, B.X.; Latkin, C.A.; Le, X.T.T.; et al. Anxiety and depression among people under the nationwide partial lockdown in Vietnam. Front. Public Health 2020, 8, 656. [Google Scholar] [CrossRef]
- Oster, E. Unobservable Selection and Coefficient Stability: Theory and Evidence. J. Bus. Econ. Stat. 2017, 37, 187–204. [Google Scholar] [CrossRef]
- Low Income Home Energy Assistance Program (LIHEAP). Available online: https://www.acf.hhs.gov/ocs/fact-sheet/liheap-fact-sheet (accessed on 5 April 2023).
- Nishi, A.; Hernandez, D.; Gerrard, M.B. Energy Insecurity Mitigation: The Low Income Home Energy Assistance Program and Other Low-Income Relief Programs; Columbia University Center on Global Energy Policy: New York, NY, USA, 2023; Available online: https://www.energypolicy.columbia.edu/wp-content/uploads/2023/11/LIHEAP-CGEP_Infoguide_111523-1.pdf (accessed on 5 April 2023).
- Carrión, D.; Hernández, D. Heatwaves and hardship: Shortcomings and solutions for enhancing the low income home energy assistance program to mitigate extreme heat and energy insecurity. Electr. J. 2024, 37, 107440. [Google Scholar] [CrossRef] [PubMed]
- Tonn, B.; Rose, E.; Hawkins, B. Evaluation of the U.S. Department of Energy’s Weatherization Assistance Program: Impact Results; Energy Policy: Oxford, UK, 2018; Volume 118, pp. 279–290. [Google Scholar] [CrossRef]
- Shumway, E.; Hernández, D.; Krasniqi, Q.; Shastry, V.; Austin, A.; Gerrard, M.B. Addressing Energy Insecurity Upstream: Electric Utility Ratemaking and Rate Design as Levers for Change. Energy LJ 2024, 45, 361. [Google Scholar]
- National Association of Regulatory Utility Commissioners. Map of Disconnection Moratoria; National Association of Regulatory Utility Commissioners: Washington, DC, USA, 2021. [Google Scholar]
- California Alternate Rates for Energy (CARE). Available online: https://www.cpuc.ca.gov/consumer-support/financial-assistance-savings-and-discounts/california-alternate-rates-for-energy (accessed on 5 April 2023).
- Herd, P.; Moynihan, D. How Administrative Burdens Can Harm Health. Health Affairs. October 2020. Available online: https://www.healthaffairs.org/do/10.1377/hpb20200904.405159/ (accessed on 7 April 2023).
- Simes, M.; Rahman, T.; Hernández, D. Vigilant conservation: How energy insecure households navigate cumulative and administrative burdens. Energy Res. Soc. Sci. 2023, 101, 103092. [Google Scholar] [CrossRef] [PubMed]
- United States Census Bureau. Nonresponse Bias Report for the 2020 Household Pulse Survey; Demographic Statistical Methods Division Sample Design and Estimation; United States Census Bureau: Suitland, MD, USA, 2020.


Disclaimer/Publisher’s Note: The statements, opinions and data contained in all publications are solely those of the individual author(s) and contributor(s) and not of MDPI and/or the editor(s). MDPI and/or the editor(s) disclaim responsibility for any injury to people or property resulting from any ideas, methods, instructions or products referred to in the content. |
© 2025 by the authors. Licensee MDPI, Basel, Switzerland. This article is an open access article distributed under the terms and conditions of the Creative Commons Attribution (CC BY) license (https://creativecommons.org/licenses/by/4.0/).