Abstract
Urban wetlands provide cultural ecosystem services (CES) that are essential to human well-being. However, their study remains limited in Colombia and across Latin America, particularly in terms of quantitative assessments of CES in urban ecosystems. This research examines the perception and valuation of CES among visitors to three urban wetlands designated as Ramsar sites in Bogotá, Colombia—Santa María del Lago, Juan Amarillo, and Córdoba. We assessed how sociodemographic profiles influence the appreciation and valuation of CES employing a mixed-methods approach that combined structured surveys, hierarchical cluster analysis (HCA), and principal component analysis (PCA). Results revealed notable differences among the wetlands: Santa María del Lago attracts younger visitors and is characterized by strong appreciation for landscape aesthetics and spirituality; Juan Amarillo exhibits a mixed visitor profile with lower appreciation for spirituality; and Córdoba receives older visitors with higher education levels, who prioritize recreation and tourism. HCA and PCA identified distinct visitor segments: “passive visitors,” oriented toward contemplation and learning, and “active visitors,” focused on recreation and tourism. Across all sites, the most valued services were aesthetic appreciation of the landscape and knowledge of nature. This study provides empirical evidence to support the integration of CES into decision-making and environmental policy for urban planning, recommending differentiated governance strategies, targeted environmental education programs, and low-impact tourism initiatives aligned with Ramsar principles and nature-based solutions.
1. Introduction
Ecosystem services are the multiple benefits that ecosystems provide to human societies and are commonly classified into four main categories: provisioning, regulating, supporting, and cultural. Among these, cultural ecosystem services (CES) refer to the intangible benefits people derive from nature, including spiritual and religious values, opportunities for recreation and tourism, aesthetic enjoyment, artistic inspiration, educational benefits, place identity, and the preservation of cultural heritage [1]. The Common International Classification of Ecosystem Services (CICES) framework complements these typologies by incorporating the physical, experiential, intellectual, and symbolic dimensions of the human–nature relationship, thereby enriching CES assessment without replacing previous methodological approaches [2,3].
Due to their intangible and subjective nature, CES are essential for human well-being, but their valuation and measurement pose significant challenges [4]. These challenges have contributed to their underrepresentation in policy formulation and environmental management processes [5]. To address these limitations, several studies recommend integrating CES into land-use planning, allocating resources for natural capital conservation, and fostering community engagement through participatory monitoring [6,7]. Such strategies not only make their socio-ecological value more visible but also enhance urban management and strengthen evidence-based environmental decision-making.
In the urban context, CES are particularly important because they are associated with recreation, mental health, environmental education, and social cohesion [8]. Their availability depends on factors such as the protection of green spaces, accessibility, and community participation in urban design [9,10]. Due to their proximity to residential areas, urban wetlands are ecosystems that stand out for their high cultural and recreational value and can be evaluated using environmental psychology through perception surveys [11]. Integrating CES into urban planning fosters ecological conservation, promotes educational and recreational opportunities, and strengthens the connection between communities and their territories [12].
It is important to note that sociodemographic profiles systematically shape the perception and valuation of CES in urban green and blue spaces [13,14,15]. Incorporating this heterogeneity into the analysis enables prediction of which benefits are perceived and prioritized, thereby informing decisions to promote equity in access to and enjoyment of these services. Along these lines, participatory mapping and community-scale quantification of CES provide a robust methodological framework for linking social preferences with planning [16].
In urban wetlands, perceptions are shaped by landscape configuration and its spatiotemporal dynamics [17], as well as by contrasts between green–blue components that influence self-reported well-being [18]. Neighborhood typology and ecosystem accessibility also produce socio-spatial segmentation: areas closer to and better connected with wetlands tend to display greater diversity and higher valuation of CES, whereas distance and lower levels of access dampen their recognition [19]. Moreover, recent literature indicates that urban residents typically assign high importance to CES, yet evidence on visitors’ valuations remains limited—justifying a focused analysis in Bogotá, Colombia [13,14].
Wetlands are ecosystems in which water is the primary driver of ecological processes, encompassing marshes, swamps, rivers, lagoons, and floodplains [20]. These ecosystems are critical for freshwater provision, biodiversity conservation, and climate change mitigation through atmospheric carbon sequestration [21,22]. However, worldwide, wetland loss and degradation are accelerating due to urban expansion, pollution, and land-use change [23]. Colombia, recognized as one of the most megadiverse countries on the planet, hosts wetlands that perform essential ecological and cultural functions, offering opportunities for birdwatching, ecotourism, hiking, and contemplation [24,25]. Ensuring their protection requires robust governance frameworks and active citizen participation [26].
In this context, this study focuses on three urban wetlands in Bogotá, Colombia (Santa María del Lago, Juan Amarillo, and Córdoba), selected for their size, strategic location, and ecological importance. These ecosystems were designated as Ramsar sites on 3 August 2018, which strengthens Colombia’s commitment to the Ramsar Convention—of which it has been a Party since 1998—through their conservation and sustainable use [27]. These are located within the Salitre sub-basin [28]. The relationships between CES and visitors’ sociodemographic characteristics were examined. This is undertaken in a context where no previous studies have applied a quantitative approach to CES in urban wetlands in Colombia. To this end, structured surveys were administered, and statistical analyses were performed—including Spearman correlation, hierarchical cluster analysis, and principal component analysis—to identify patterns of preference and perception among wetland visitors.
In summary, a gap remains regarding the role of sociodemographic factors in the valuation of CES in urban wetlands and the potential existence of distinct visitor segments. To address this gap, this study aims to identify and assess the CES perceived in three urban wetlands of Bogotá and to examine their relationship with visitors’ sociodemographic attributes. We pose the following research questions: (RQ1) Which CES are perceived and valued by visitors in each of the three urban wetlands of Bogotá? (RQ2) To what extent do sociodemographic variables (e.g., age, gender, education and income) predict visitors’ valuation and preference across CES categories? (RQ3) Do distinct segments of visitors exhibit differentiated patterns of CES perception, and how are these segments related to their sociodemographic characteristics? This study contributes a replicable quantitative approach for Latin American contexts and policy-relevant evidence for urban planning and sustainable tourism management.
2. Materials and Methods
2.1. Study Area
This study was conducted in three urban wetlands located in Bogotá, the capital of Colombia: Santa María del Lago (4°41′59″ N, 74°05′56″ W), Juan Amarillo (4°43′51″ N, 74°05′15″ W), and Córdoba (4°42′39″ N, 74°04′36″ W). These ecosystems lie within the Salitre River sub-basin, a tributary of the Bogotá River, and have been designated as District Wetland Reserves under the Capital District Protected Areas System [27,29] (Figure 1).
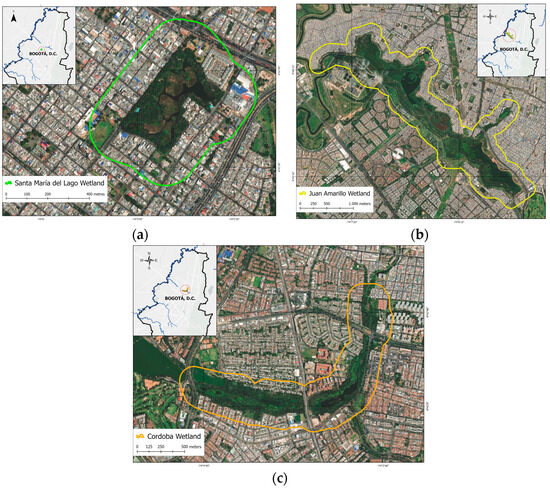
Figure 1.
Location of the three urban wetlands under study in the city of Bogotá: (a) Santa María del Lago Wetland (green outline), (b) Juan Amarillo Wetland (yellow outline), and (c) Córdoba Wetland (orange outline). Each map depicts the official wetland boundary, water bodies represented by blue lines, and the surrounding urban environment. Insets show their position within the Salitre River sub-basin and the urban area of Bogotá. Source: Google Earth Pro, Version 7.3.6 (Google LLC, Mountain View, CA, USA). Satellite imagery (2023), WGS 84 projection, scale 1:5000; north oriented at the top.
The Santa María del Lago Wetland, located in the Engativá locality, covers approximately 10.86 ha (open water ≈ 5.64 ha) and is managed as a Ramsar-listed district ecological park. Aquatic macrophytes typical of Andean wetlands—reeds/bulrush (Typha spp.), rushes, duckweed (Lemna), water fern (Azolla), and water hyacinth (Eichhornia)—shape habitat structure and vistas used for environmental education and birdwatching along signed trails and an observation point. Local inventories report ~80 vertebrate species, including native and migratory birds, underscoring its value for awareness and low-impact recreation within a dense urban matrix [30] (Figure 2).
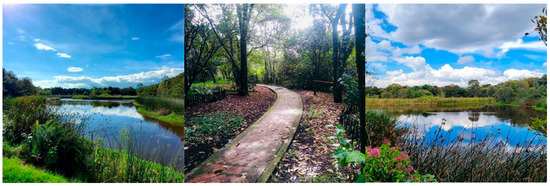
Figure 2.
Views of the Santa María del Lago Wetland, showing its water surface, riparian vegetation, and ecological trails that contribute to its role as an area for conservation and recreation.
The Juan Amarillo (Tibabuyes) Wetland—the largest in Bogotá at ~222.76 ha—extends across Suba and Engativá and is organized into upper, middle, and lower sectors, hydrologically linked to the Salitre sub-basin and the Bogotá River. Recent restoration and management have emphasized emergent and floating macrophytes (Schoenoplectus californicus, Typha spp., Lemna spp., Limnobium laevigatum, Azolla sp.), enhancing habitat and nutrient removal, and monitoring lists resident and migratory birds and notes species of conservation concern such as the Bogotá rail (Rallus semiplumbeus). Like many urban wetlands, Tibabuyes faces pressures that matter for CES perceptions—polluted inflows, invasive flora, solid waste, and safety issues—which are documented in its management file [31,32] (Figure 3).
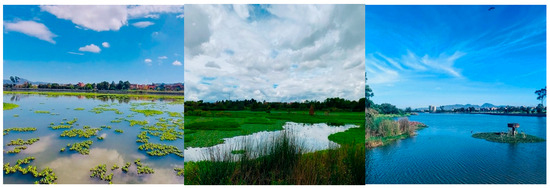
Figure 3.
Photographs of the Juan Amarillo Wetland (Tibabuyes) showing its water bodies, aquatic vegetation, and surrounding areas, which together form one of the most extensive and biodiverse ecosystems in Bogotá.
The Córdoba Wetland (≈40.5 ha) forms part of Bogotá’s Main Ecological Structure and is hydrologically connected via the Córdoba and Molinos canals to adjacent lakes and the Juan Amarillo system, creating a blue–green corridor in the city’s northwest. It is frequently cited as Bogotá’s bird-richest wetland (≈140–150+ species, including migratory taxa), with regular records of great egret (Ardea alba), bare-faced ibis (Phimosus infuscatus), and purple gallinule (Porphyrio martinicus), alongside aquatic macrophytes such as bulrush (Typha), rushes (Juncus), and papyrus (Cyperus). Its three sections (upper, middle, and lower) are embedded in a highly urbanized matrix bordered by major arterials (Avenida Suba, Avenida Córdoba, and Avenida Boyacá), conditions that shape perceived accessibility, aesthetics, and safety along its trails and viewpoints [29,33] (Figure 4).
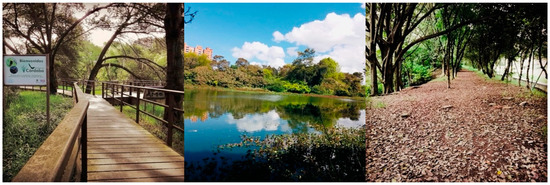
Figure 4.
Photographs of the Córdoba Wetland, showing its ecological trails, water mirror, and surrounding vegetation, which together form this urban ecosystem.
2.2. Sample Calculation
The administrative records of the three wetlands documented daily visitor entries of individuals over 18 years of age during 2018 and 2019, prior to the COVID-19 pandemic. Based on this information, the sample size was estimated. The calculation followed Cochran’s (1977) [34] formula for finite populations, represented by Equation (1):
N represents the size of the visitor population for each wetland. The average daily number of visitors over 18 years of age (N) was: Santa María del Lago Wetland, 134; Juan Amarillo Wetland, 154; and Córdoba Wetland, 133. The sample size was estimated using a margin of error (e) of 5% and a confidence level (p) of 95%. The value of z corresponds to the standard score for the selected confidence level (z-score for 95% = 1.96) [35]. Based on these parameters, the recommended sample sizes were Santa María del Lago Wetland, 100 visitors; Juan Amarillo Wetland, 111 visitors; and Córdoba Wetland, 100 visitors.
2.3. Application of the Instruments
A questionnaire was designed using the Google Forms (Google LLC, Mountain View, CA, USA) platform to collect information on visitors’ perceptions of the wetlands. The survey gathered both sociodemographic data and visitors’ valuation of CES [36]. The questionnaire comprised 13 closed-ended items and was administered to adults (≥18 years) between August and October 2022. Fieldwork was conducted on both weekdays and weekends within the 09:00–17:00 interval to capture variation associated with the temporal availability of the target population. The instrument’s design was grounded in methodological frameworks previously described in the specialized literature and was adapted to the study context [37,38,39].
For the age variable, six categories were defined (18–24, 25–30, 31–37, 38–44, 45–51, and >51 years), following previous sociodemographic studies [40,41]. For economic income, the Legal Minimum Wage in Colombia (HMLWF) was used as the unit of measurement, with responses classified into five ranges (<1, 1–2, 2–3, 3–4, and >4 HMLWF) [39]. Educational level was categorized into primary, secondary, technical, and university education, as commonly used in educational segmentation studies [42].
For the occupation variable, the categories were housewife, student, employee, self-employed, unemployed, and retiree. Additionally, a question on gender was included. Both items were adapted from the Colombian National Quality of Life Survey [43]. Finally, the frequency of wetland visits was assessed with the following options: daily, weekly, monthly, and yearly [44].
The CES were identified and assessed in the three wetlands—Santa María del Lago, Juan Amarillo, and Córdoba—using a Likert scale [45]. Each visitor evaluated five specific CES: (1) Tourism, (2) Knowledge of nature, (3) Recreation and sports, (4) Appreciation of the landscape, and (5) Religion and spirituality. Ratings were assigned on a scale from 1 to 5, where 5 indicated the highest degree of preference for each activity within the ecosystem [39].
2.4. Statistical Analysis
A statistical model was developed beginning with a correlation analysis using Spearman’s correlation coefficient, a nonparametric measure that evaluates the strength and direction of the monotonic relationship between variables based on ranked data [46]. This coefficient ranges from −1 to +1 and is suitable for ordinal variables [47]. Positive values indicate a direct relationship between variables, while negative values reflect an inverse correlation. This analysis was applied to examine the relationship between visitors’ sociodemographic characteristics and the five CES, providing insights into how these characteristics may influence CES perception in each wetland.
In the second stage of the statistical model, two clustering methods were applied. First, Hierarchical Cluster Analysis (HCA) was used to group wetland visitors according to their interests and perceptions of the five CES. This analysis employed Euclidean distance and a 95% confidence level [48], ensuring homogeneity within each cluster [49]. Ward’s method was selected, as it minimizes total within-cluster variance and facilitates exploration of associations between sociodemographic characteristics and CES preferences [50]. Combining clustering methods enables cross-validation, pattern identification, and more robust interpretation of visitor segmentation based on CES preferences [51].
Finally, a Principal Component Analysis (PCA) was conducted to reduce data dimensionality and improve model accuracy [52]. The analysis was applied to the clusters obtained in the previous step, focusing on visitors’ interest in CES across the three wetlands [53]. PCA was implemented uniformly across all sites to ensure methodological consistency and comparability of results. However, given the relatively low KMO value for Córdoba, the findings from this wetland were interpreted with caution, acknowledging their statistical limitations.
Component retention was determined using the Kaiser criterion (eigenvalues λ > 1) and inspection of the scree plot, also considering the accumulated explained variance. To assess dataset suitability for PCA, the Kaiser–Meyer–Olkin (KMO) test and Bartlett’s test of sphericity were conducted, determining whether the data were sufficiently correlated for factor extraction and evaluating variable predictability [54].
These tests guided the selection of principal components that explained the greatest proportion of variance, indicating the extent to which each component best described CES in the wetlands. All analyses were conducted using IBM SPSS Statistics, version 2.
3. Results
3.1. Socio-Demographic Analysis
Santa María del Lago (n = 100). The sample shows near gender parity and is dominated by young adults (18–37). Tertiary education is common (about half), followed by secondary schooling. Self-employment and student status are the leading occupations. Most respondents report incomes below two HMLWF, and visits are typically weekly (Table 1).

Table 1.
Sociodemographic Characteristics of Wetland Visitors.
Juan Amarillo (n = 111). Sex distribution is also balanced, with a youthful age profile (≈70% aged 18–37). Educational attainment centers on secondary and technological levels. Employees and the self-employed are the main occupational groups. Incomes are largely below two HMLWF, and visits are more often annual than at the other sites (Table 1).
Córdoba (n = 100). Men are over-represented and the age structure is older (a slight majority > 37 years). University graduates predominate. Salaried employment is the most common occupation, with a notable retired segment. Most respondents report incomes up to four HMLWF, and visits are typically weekly (≈two–thirds) (Table 1).
3.2. Categories of Cultural Ecosystem Services (CES) for Wetlands
Based on the classification of CES proposed in the Millennium Ecosystem Assessment (MEA, 2005) and the CICES, and considering that the latter complements previous methodologies to enhance clarity and facilitate CES measurement and analysis, five categories were adopted and adapted for this study. These categories were used to identify and assess the CES present in the three urban wetlands of Bogotá, Colombia (Table 2).
Table 2.
Categories and equivalences of Cultural Ecosystem Services (CES) for wetlands.
3.3. Global Valuation of Cultural Ecosystem Services (CES)
Based on the survey data and using the Likert scale (1 = Strongly disagree, 2 = Disagree, 3 = Indifferent, 4 = Agree, 5 = Strongly agree), the valuation of the five cultural ecosystem services was determined: CES 1—Tourism; CES 2—Knowledge of nature; CES 3—Recreation and sports; CES 4—Appreciation of the landscape; and CES 5—Religion and spirituality, for the three wetlands.
The highest scores corresponded to the same CES across the three wetlands. In the Santa María del Lago Wetland, CES 4 (Appreciation of the landscape) obtained 76%, and CES 2 (Knowledge of nature) reached 69%. In the Juan Amarillo Wetland, these services reached 58% and 53%, respectively. Finally, in the Córdoba Wetland, CES 4 reached 84%, while CES 2 obtained 74% (Table 3).
Table 3.
Valuation of Cultural Ecosystem Services (CES) in wetlands.
When analyzing the two highest categories of the Likert scale (4 = Agree and 5 = Strongly agree), CES 4 (Appreciation of the landscape) and CES 2 (Knowledge of nature) emerge as the most highly valued across the three wetlands. In addition, CES 3 (Recreation and sports) and CES 1 (Tourism) also show notable relevance, with the following results: in the Santa María del Lago Wetland, CES 1 reached 94% and CES 3 reached 66%; in the Juan Amarillo Wetland, CES 1 obtained 72% and CES 3 obtained 62%; and in the Córdoba Wetland, CES 1 reached 97% and CES 3 reached 80% (Figure 5).
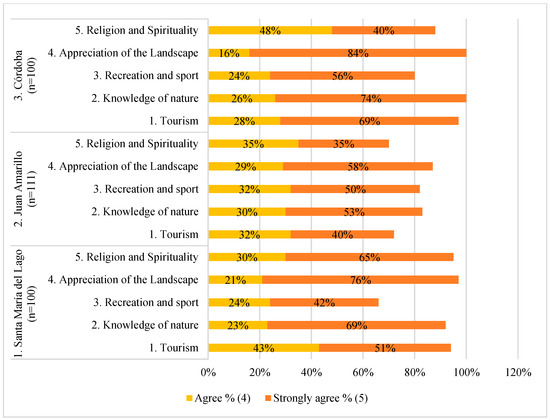
Figure 5.
High Cultural Ecosystem Services (CES) assessments in wetlands.
3.4. Valuation of Cultural Ecosystem Services (CES) According to Visitor Gender
Based on survey data for visitor gender (women and men) in the three wetlands, and considering the two highest categories of the Likert scale (4 = Agree and 5 = Strongly agree), the CES with the highest values were identified as follows: In the Santa María del Lago Wetland, both women and men assigned the highest valuation to CES 4 (Appreciation of the landscape), with 96% and 98%, respectively. In the Juan Amarillo Wetland, women gave the highest rating to CES 3 (Recreation and sports) at 64%, whereas men assigned the highest rating to CES 4 (Appreciation of the landscape) at 100%. In the Córdoba Wetland, both women and men rated CES 4 (Appreciation of the landscape) and CES 2 (Knowledge of nature) equally high, with 100% in both cases (Figure 6).
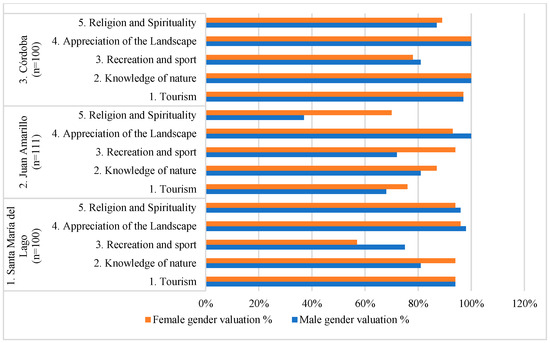
Figure 6.
Valuation of Cultural Ecosystem Services (CES) according to visitor gender.
3.5. Spearman Correlation Coefficient
The Spearman correlation coefficient was applied with a high two-tailed significance level (p < 0.01) to evaluate the relationships between visitors’ sociodemographic characteristics and the CES of each wetland. The results revealed both positive and negative correlations, ranging from negligible to perfect, classified as negligible, weak, moderate to strong, strong, and perfect, according to Ortega et al. (2009) [47]. For the Santa María del Lago Wetland, seven correlations showed “strong to perfect” positive significance (0.76–1.00) between the following variables: CES 2 and CES 5 (ρ = 0.918, p < 0.01); CES 1 and CES 3 (ρ = 0.891, p < 0.01); CES 1 and CES 5 (ρ = 0.785, p < 0.01); CES 2 and CES 3 (ρ = 0.834, p < 0.01); CES 2 and CES 4 (ρ = 0.859, p < 0.01); CES 5 and CES 3 (ρ = 0.874, p < 0.01); and CES 4 and CES 5 (ρ = 0.790, p < 0.01). Negative correlations were classified as negligible (Figure 7).
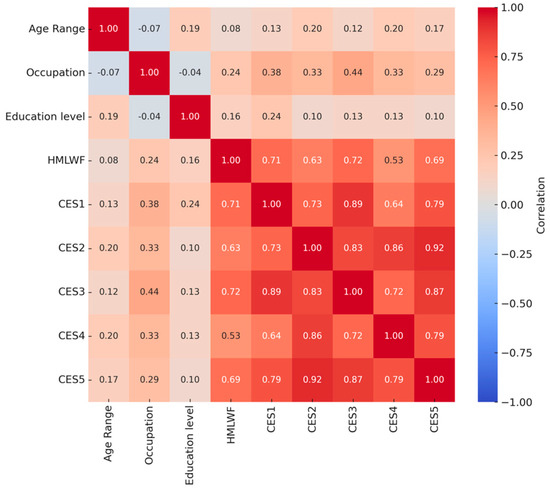
Figure 7.
Spearman’s correlation matrix for sociodemographic variables and Cultural Ecosystem Services (CES) valuation in the Santa María del Lago wetland.
In the case of the Juan Amarillo Wetland, a “moderate to strong” positive correlation (0.51–0.75) was found between CES 3 and CES 4. In addition, 13 “weak” positive correlations (0.26–0.50) were identified, with the highest in this category being: educational level and economic income (ρ = 0.416, p < 0.01); CES 1 and CES 4 (ρ = 0.465, p < 0.01); CES 1 and CES 5 (ρ = 0.412, p < 0.01); and CES 2 and CES 4 (ρ = 0.428, p < 0.01) (Figure 8). Negative correlations were classified as negligible for the Juan Amarillo Wetland.
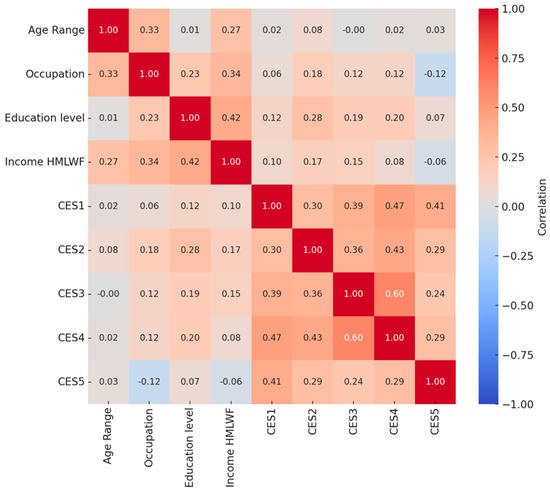
Figure 8.
Spearman’s correlation matrix for sociodemographic variables and Cultural Ecosystem Services (CES) valuation in the Juan Amarillo wetland.
For the Córdoba Wetland, a “moderate to strong” positive correlation (0.51–0.75) was found between age range and occupation (ρ = 0.583, p < 0.01). Additionally, four “weak” positive correlations (0.26–0.50) and four negative correlations were identified. The weak positive correlations were occupation and economic income (ρ = 0.394, p < 0.01); CES 1 and CES 2 (ρ = 0.318, p < 0.01); CES 1 and CES 5 (ρ = 0.273, p < 0.01); and CES 4 and CES 2 (ρ = 0.301, p < 0.01). The negative correlations were age range and education level (ρ = −0.261, p < 0.01); age range and CES 3 (ρ = −0.377, p < 0.01); and CES 3 and CES 4 (ρ = −0.264, p < 0.01) (Figure 9).
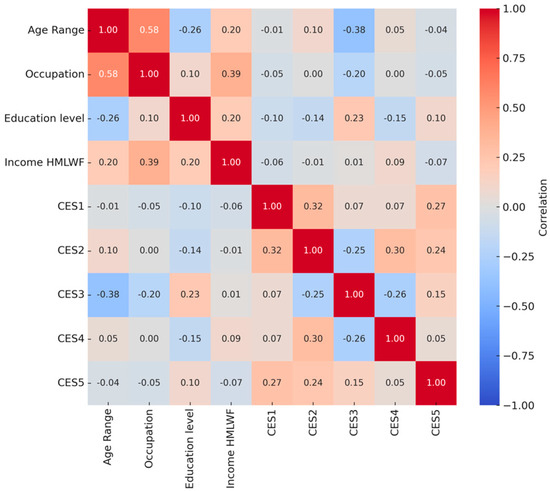
Figure 9.
Spearman’s correlation matrix for sociodemographic variables and Cultural Ecosystem Services (CES) valuation in the Córdoba wetland.
3.6. Clustering Methods
3.6.1. Hierarchical Cluster Analysis (HCA)
An HCA was performed using the Euclidean distance metric to group wetland visitors according to their CES preferences. A reference distance between >0.5 and <2.0 was used to identify clusters in the three dendrograms corresponding to each ecosystem (all supporting materials are available in the Zenodo repository at https://doi.org/10.5281/zenodo.16809740.
For the Santa María del Lago Wetland, two clusters were identified. The first cluster comprised visitors who assigned the highest rating to CES 4 (Appreciation of the landscape) and the lowest rating to CES 3 (Recreation and sports). The second cluster included visitors who rated CES 2 (Knowledge of nature), CES 4 (Appreciation of the landscape), and CES 5 (Religion and spirituality) as the most important.
In the Juan Amarillo Wetland, three clusters were identified. The first comprised visitors who gave the highest ratings to CES 3 (Recreation and sports) and CES 4 (Appreciation of the landscape). The second cluster included visitors who prioritized CES 2 (Knowledge of nature) and CES 4 (Appreciation of the landscape). The third cluster represented visitors who assigned low ratings to all CES, indicating that they did not perceive any of them as particularly important.
In the Córdoba Wetland, three clusters were also identified. The first comprised visitors who rated CES 2 (Knowledge of nature) highly and CES 3 (Recreation and sports) low. The second cluster included visitors who gave the highest ratings to CES 4 (Appreciation of the landscape). The third cluster comprised visitors who assigned low ratings to all CES.
3.6.2. Cluster Analysis
The CES with the highest value in each cluster was identified using the mean scores for each wetland. Ward’s method was applied, as it minimizes the total variance within each cluster. Dispersion diagrams were created for each wetland to validate the results obtained from the hierarchical cluster analysis (dendrograms) and to examine the distribution of the data, considering the factor and mean scores for each axis.
For the Santa María del Lago Wetland, two clusters were identified. The first cluster was more dispersed and comprised visitors who rated CES 4 (Appreciation of the landscape) the highest. The second cluster was less dispersed and included visitors who assigned the highest ratings to CES 2 (Knowledge of nature), CES 4 (Appreciation of the landscape), and CES 5 (Religion and spirituality) (Figure 10a).
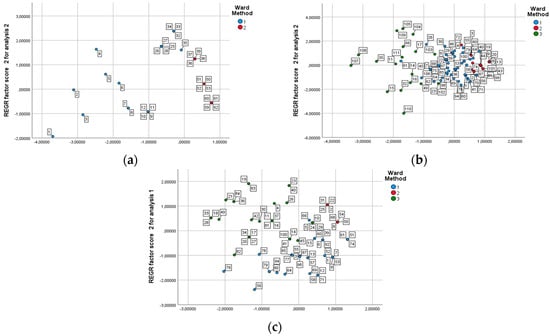
Figure 10.
Scatter plots from Ward’s hierarchical clustering method for wetlands: (a) Santa María del Lago, (b) Juan Amarillo, and (c) Córdoba, Bogotá, Colombia.
In the Juan Amarillo Wetland, three clusters were identified. The first cluster comprised visitors who considered CES 3 (Recreation and sports) the most important. The second cluster included visitors who assigned the highest ratings to CES 2 (Knowledge of nature). In contrast, the third cluster represented visitors who gave low ratings to all CES, indicating that they did not perceive any of them as particularly important (Figure 10b).
Three clusters were also identified in the Córdoba Wetland. The first comprised visitors who considered CES 2 (Knowledge of nature) the most important. The second cluster included visitors who assigned the highest ratings to CES 4 (Appreciation of the landscape), while in the third cluster, CES 3 (Recreation and sports) was the most prominent (Figure 10c).
3.7. Principal Component Analysis (PCA)
This technique reduces data dimensionality by selecting the principal components that explain the greatest proportion of variance, indicating the extent to which each principal component best describes the CES of each wetland. The KMO test and Bartlett’s test of sphericity were applied to assess data adequacy (Table 4). For all three wetlands, the KMO value was greater than 0.50, indicating low or negligible relationships between variables, and Bartlett’s test of sphericity was less than 0.05. Therefore, the null hypothesis that all variables have zero correlation was rejected, confirming that the covariance matrix was adequate to perform PCA on the datasets from the three wetlands.
Table 4.
Kaiser–Meyer–Olkin (KMO) and Bartlett test.
According to the KMO test (Table 4), Santa María del Lago exhibited high sample adequacy (KMO = 0.867), Juan Amarillo showed acceptable adequacy (KMO = 0.745), and Córdoba showed limited adequacy (KMO = 0.570), suggesting a more fragmented perception in the latter. The communalities (Table 5) reinforce this pattern: in Santa María del Lago, all variables showed high explained variance (>0.87), indicating a coherent perceptual structure. In Juan Amarillo and Córdoba, the values were lower and more heterogeneous, reflecting less consistency in the assessments.
Table 5.
Communalities.
In the Santa María del Lago Wetland, the two retained components explained 91.96% of the total variance. Component 1 (PC1), accounting for 86.56%, showed high positive loadings across all categories of CES, with particularly strong values for Religion and spirituality (CES5), Knowledge of nature (CES2), and Recreation and sports (CES3) (Table 6). This pattern indicates that visitors’ assessments integrate spiritual, educational, and recreational dimensions in a balanced manner. Component 2 (PC2), explaining 5.40% of the variance, was most strongly associated with Landscape appreciation (CES4), revealing a perceptual axis centered on visual and scenic experience (Table 6, Figure 11a). These results suggest that the wetland experience combines a comprehensive appreciation encompassing spiritual, learning, and aesthetic enjoyment components.
Table 6.
Component scoring coefficient matrix.
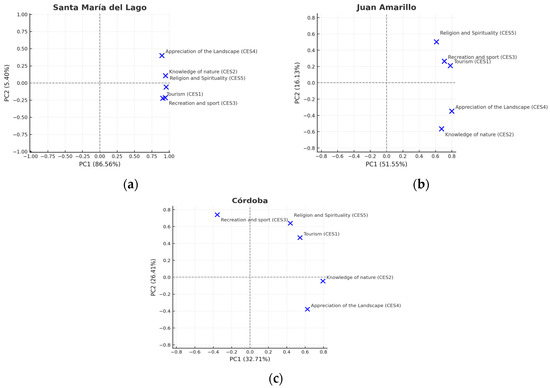
Figure 11.
Principal Component Analysis (PCA) of wetlands: (a) Santa María del Lago, (b) Juan Amarillo, and (c) Córdoba.
In the Juan Amarillo Wetland, the two retained components explained 67.67% of the total variance. Component 1 (PC1), representing 51.55%, was strongly associated with Tourism (CES1), Landscape appreciation (CES4), and Recreation and sports (CES3), reflecting a predominant orientation toward recreational and scenic uses linked to place identity and enjoyment (Table 6, Figure 11b). Component 2 (PC2), explaining 16.13% of the variance, had its highest positive loading for Religion and spirituality (CES5) and, to a lesser extent, Recreation and sports (CES3), indicating a complementary axis related to spiritual values and social interaction. Overall, the perception of ecosystem services in Juan Amarillo is mainly structured around recreational and tourist activities, with a secondary presence of symbolic and spiritual values.
In the Córdoba Wetland, the two retained components explained 59.13% of the total variance—the lowest among the three wetlands. Component 1 (PC1), accounting for 32.71%, was mainly determined by Knowledge of nature (CES2), followed by Landscape appreciation (CES4) and Tourism (CES1). Component 2 (PC2), explaining 26.41%, showed its highest positive loadings for Recreation and sports (CES3) and Religion and spirituality (CES5) (Table 6, Figure 11c). Unlike Santa María del Lago and Juan Amarillo, Córdoba showed no marked dominance of a single cultural ecosystem service, suggesting a more balanced yet more dispersed perception, without clearly defined perceptual axes.
4. Discussion
This research focused exclusively on visitors to the three wetlands, without including the perceptions of other stakeholders such as residents of the surrounding areas. The focus on visitors aligned with the objective of evaluating CES from the perspective of those who directly experience and benefit from them. In addition, a sociodemographic analysis was conducted to better understand visitors’ characteristics and to inform decision-making in policy formulation and public management, aligning these actions with visitor preferences for the conservation of Ramsar-designated wetlands.
4.1. Sociodemographic Characteristics of Visitors by Wetland
In the Santa María del Lago Wetland, there is greater gender equity among visitors, with a balanced distribution between men and women. This pattern may be associated with a perception of greater safety in the area, as well as the presence of educational and community activities organized by local actors [55]. In addition, there is a high proportion of young people between 18 and 37 years of age (Table 1), which could be explained by the wetland’s proximity to low- and middle-income residential areas and educational institutions [56]. This profile suggests recreational and contemplative use of the space by a young population with diverse interests, who perceive the wetland as an accessible and safe environment for leisure and learning.
In the Juan Amarillo Wetland, the 18–37 age group also predominates, although with a slight majority of men (51%) (Table 1). The presence of young visitors may be linked to the wetland’s location in a densely populated area with complex social dynamics. However, perceived insecurity and the presence of social challenges, such as informal settlements or street dwellers, could influence lower female participation and their limited engagement with the space [57,58].
In contrast, the Córdoba Wetland presents a different profile, with a clear majority of visitors over 37 years of age (51%) and a high proportion of men (62%) (Table 1). This pattern may be explained by the wetland’s emphasis on birdwatching and passive recreation, activities generally associated with an older audience with contemplative interests and greater availability of free time [59]. Furthermore, Córdoba is located in a medium–high socioeconomic area (strata 5 and 6), which is reflected in a visitor profile with high educational attainment (89% with university degrees) and higher incomes (84% reporting more than four HMLWF) (Table 1) [60].
4.2. Valuation of CES by Wetland
In the Santa María del Lago Wetland, there is a high level of consensus regarding Tourism—CES 1: 94% of visitors agreed or strongly agreed (Likert scale values 4–5) that the wetland provides this service. This positive perception is supported by sustainable tourism proposals that strengthen local economic development and conservation [61] and aligns with comparative urban evidence, indicating that cultural and regulating services are the most salient to stakeholders [13]. Recreation and sports—CES 3 also received a high rating (92%), with a broad preference for hiking and the use of public plazas. However, Knowledge of nature—CES 2 received a more moderate rating (66%), a pattern consistent with studies reporting heterogeneous recognition of educational values across education levels and age cohorts [13].
Appreciation of the Landscape—CES 4 reached 97% acceptance, in line with global syntheses that identify aesthetics, recreation, and learning as recurrent wetland CES worldwide [15]. Finally, Religion and spirituality—CES 5 was supported by 95% of respondents, with frequent practices such as meditation and quiet contemplation (Table 3).
In the Juan Amarillo Wetland, CES were also rated positively, although less intensely than in Santa María del Lago. For Tourism—CES 1, 72% expressed agreement, reflecting its tourism potential despite limitations in infrastructure and governance [62]. This divergence is consistent with analyses of urban wetlands grounded in the social-ecological systems (SES) approach, in which site governance, collective action, and land-use context shape perceived ES supply and social outcomes [63]. Recreation and sports—CES 3 was rated positively by 83% of visitors, consistent with its inclusion in local public policy as a suitable space for sports and passive activities [64].
Knowledge of nature—CES 2 reached 82%, underscoring the ecosystem’s educational role. Appreciation of the Landscape—CES 4 was also high (87%), though lower than in Santa María del Lago. Religion and spirituality—CES 5 showed greater variability, with only 70% agreement and 17% indifferent, possibly reflecting a loss of cultural memory of the territory, historically inhabited by Muisca communities [65] (Table 3).
In the Córdoba Wetland, appreciation levels were the highest among the three wetlands. Tourism—CES 1 was recognized by 97% of visitors, especially for birdwatching, given the presence of endemic and migratory bird species [59]. Recreation and sports—CES 3 received 100% acceptance, validating its intensive use for artistic, sporting, and contemplative activities [59]. Knowledge of nature—CES 2 garnered 80% support, consistent with the availability of educational trails and interpretive signage. Appreciation of the Landscape—CES 4 achieved the highest score in the study (100%), evidencing a strong aesthetic connection, again in line with global reviews of wetland CES that emphasize aesthetics and recreation [15].
Moreover, studies in urban wetland parks show that blue-space experiences (waterfronts/lagoon edges) are associated with stronger positive affect and can be monetized to inform planning, reinforcing Córdoba’s tourism and recreation profile [18]. Religion and spirituality—CES 5 was also evaluated positively (88%), demonstrating recognition of the site’s symbolic and spiritual value (Table 3).
Comparatively, Appreciation of the Landscape—CES 4 and Knowledge of nature—CES 2 were the most highly valued across the three wetlands, consistent with findings from other urban and rural ecosystems in which these dimensions are linked to the scarcity of green areas, interest in biodiversity, and the role of landscape as a source of identity [39,66,67]. Cross-city studies likewise report the prominence of cultural and regulating services in perception data and highlight education and age as key discriminants—while gender often shows weaker effects—suggesting useful stratification variables for outreach and management [13].
Global syntheses for wetlands further underscore aesthetics, recreation, and learning as core CES that motivate stewardship and restoration [15]. Although Religion and spirituality—CES 5 received positive ratings, its recognition was comparatively lower, possibly due to the limited presence of tangible cultural markers; nevertheless, spirituality can be highly salient when linked to water symbolism and landscape identity, as shown in other wetland contexts [39,67,68].
The designation of Bogotá’s wetlands as Ramsar sites in 2018 entails compliance with the principle of wise use, which prohibits activities that could compromise their ecological integrity, such as intensive sports or the construction of recreational infrastructure within ecological core zones [25]. Santa María del Lago, Juan Amarillo, and Córdoba have prioritized low-impact recreational activities—such as interpretive walks, environmental tours, and birdwatching—in line with their status as protected areas under international regulations [27]. Embedding stakeholder perceptions within a social-ecological systems approach can help calibrate these low-impact uses, strengthen collective governance, and align site-level decisions with urban climate-adaptation goals [13,63].
4.3. Valuation of Cultural Ecosystem Services (CES) by Gender of Visitors
Gender-based valuation of CES shows a consistent emphasis on Landscape Appreciation (CES 4) across sites; at Santa María del Lago, consensus approaches 98% (Figure 6), reinforcing the central role of scenic attributes in urban-nature experiences [69,70].
At Juan Amarillo, divergences emerge: women rate Recreation and Sport (CES 3, 64%) higher, whereas men prioritize Landscape (CES 4, 100%) (Figure 6). These gaps align with evidence on gendered mobility, leisure-time patterns, and safety perceptions in cities, as well as findings that women more often emphasize heritage and collective memory within CES [35,71].
At Córdoba, valuations converge: both genders rate Knowledge of Nature (CES 2) and Landscape (CES 4) at 100%, a parity plausibly linked to infrastructure and accessibility that enable inclusive and safe use. The site has been cited as a case of equitable space appropriation supported by community participation [63,72].
Policy implication: gender-differentiated assessments should guide environmental management and education; planning frameworks that integrate this perspective more accurately reflect how women and men experience and value CES and foster their willingness to engage in conservation [73,74].
4.4. Sociocultural Factors in CES Valuation
In Santa María del Lago, whose population corresponds mainly to middle socioeconomic strata with relatively high educational levels, the most prominent cultural ecosystem services are knowledge of nature (CES2: 69%) and landscape appreciation (CES4: 76%). These values reflect an aesthetic and educational appropriation strengthened by territorial attachment and by small-scale sustainable tourism initiatives [71]. The high level of school participation is also associated with positive perceptions of spirituality (CES5: 65%) and with the use of the wetland as a living classroom for environmental education. However, issues related to localized water pollution and the presence of invasive species [30] may constrain the consolidation of recreational and sports practices (CES3), which obtained lower consensus.
In Juan Amarillo, the largest wetland in Bogotá and surrounded by communities from lower-middle strata (2 and 3) with a marked informal economy [62], the valuation of cultural ecosystem services is concentrated in knowledge of nature (CES2: 53%) and recreation (CES3: 50%). In contrast, landscape appreciation (CES4: 58%), spirituality (CES5: 35%), and tourism (CES1: 40%) were perceived more weakly, constrained by environmental degradation, insecurity, waste accumulation, and the loss of cultural references linked to Muisca heritage, as well as by governance tensions [75,76].
By contrast, Córdoba-Niza, located in a middle-to-high socioeconomic context, recorded the highest scores in landscape appreciation (CES4: 84%), tourism (CES1: 69%), and knowledge of nature (CES2: 74%). These results reflect a population with greater educational and cultural capital that values the wetland as a space for contemplation, citizen science, and leisure. The strong valuation of tourism and recreation is linked to the presence of emblematic species and equitable community appropriation processes, although tensions persist due to water pollution and the presence of homeless populations [33]. Taken together, these differences demonstrate that, even under similar ecological conditions, CES valuations are mediated by cultural memory, territorial history, and processes of social appropriation of urban wetlands [77,78,79].
4.5. Spearman’s Correlation Coefficient Analysis
In the Santa María del Lago Wetland, the results showed moderate and significant positive correlations between Recreation and sports (CES 3) and Religion and spirituality (CES 5), as well as between Knowledge of nature (CES 2) and Landscape appreciation (CES 4) (Figure 7). This indicates that some visitors integrate multiple cultural dimensions during their wetland experience. Such a pattern suggests a symbolic and educational relationship with the landscape, consistent with previous studies in which visitors strongly associate landscape contemplation with spirituality and learning [16,80].
In the Juan Amarillo Wetland, significant correlations were identified between educational level and the valuation of services such as CES 2 (Knowledge of nature) and CES 4 (Landscape appreciation), indicating that visitors with higher education tend to place greater value on these services. Similarly, income showed positive associations with educational and aesthetic CES (Figure 8). These correlations suggest that the socioeconomic profile influences the interpretation and cultural appropriation of the wetland.
In the Córdoba Wetland, the most notable correlations were negative between age and the valuation of CES, such as Recreation and sports (CES 3) and Landscape appreciation (CES 4), indicating that older visitors tend to value these dimensions less. An inverse correlation was also observed between age and educational level, which may explain perceptual differences between age groups (Figure 9). This finding is consistent with research identifying tensions between active and contemplative uses of the landscape, depending on age and individual motivations [16].
Overall, Spearman’s analysis showed that CES valuations are not homogeneous but are closely linked to the sociodemographic characteristics of visitors. These results highlight the importance of incorporating differentiated approaches into the planning and management of urban wetlands, taking into account the diversity of user profiles and their distinct ways of interacting with the natural environment.
4.6. Findings from Hierarchical Cluster Analysis (HCA)
HCA (Ward’s method) delineated distinct visitor profiles of Cultural Ecosystem Service (CES) valuation across the three wetlands (Figure 10a–c), evidencing heterogeneous motivations, perceptions, and modes of interaction with urban nature.
Santa María del Lago. Two clusters emerged: one centered on Landscape Appreciation (CES 4), consistent with contemplative/aesthetic experiences, and another jointly valuing Knowledge of Nature (CES 2) and Religion & Spirituality (CES 5), indicative of a deeper, education and well-being oriented relationship with the environment. This pattern aligns with typologies that distinguish contemplative/symbolic from more engaged (educational/spiritual) users [81,82].
Juan Amarillo. Three clusters were identified: a recreation-oriented group (Recreation & Sports, CES 3), an education-oriented group (Knowledge of Nature, CES 2), and a third with uniformly low CES valuations. The latter may reflect localized environmental degradation, infrastructure deficits, or limited recognition of the wetland’s cultural values, as noted elsewhere for this site [5,32]. The coexistence of these profiles underscores both the educational potential of the wetland and persistent challenges for public engagement.
Córdoba. Clusters were distributed among Landscape Appreciation (CES 4), Knowledge of Nature (CES 2), and Recreation & Sports (CES 3), with a comparatively stronger emphasis on recreation and social activities consistent with its multifunctional, high-intensity urban use [62]. Higher educational attainment and more frequent visitation at this site are congruent with a larger share of engaged users and stewardship practices reported in participatory management assessments [83].
Across sites, Ward’s method corroborated the group structure and differentiated wetlands with a predominantly contemplative profile (Santa María del Lago) from those that are more recreation-oriented (Córdoba), while Juan Amarillo exhibited the greatest heterogeneity. This segmentation is operationally relevant for tailoring management, education, and communication strategies to visitor profiles, in line with PMA guidelines for Bogotá’s Ramsar wetlands [29]. More broadly, recent studies show that cluster analysis reliably identifies cultural/educational/recreational user groups and supports targeted planning of urban green spaces and nature-based recreation [71,81,84,85,86].
4.7. Interpretation of Principal Component Analysis (PCA)
PCA identified distinct patterns in CES valuation across the three urban wetlands analyzed. In Santa María del Lago, the first two components explain 91.96% of the total variance, with a dominant PC1 (86.59%) strongly grouping Religion and Spirituality (CES 5) and Knowledge of Nature (CES 2) (Figure 11a). This pattern suggests a profile of passive visitors, focused on contemplative, educational, and symbolic connections with nature, consistent with findings from similar contexts [84,86].
In Juan Amarillo, PC1 explains 51.54% of the variance (67.67% cumulative), showing strong associations with Landscape Appreciation (CES 4) and Tourism (CES 1) (Figure 10b). This indicates the presence of passive visitors, albeit with a broader range of interests. In contrast, in Córdoba, the first two components explain only 59.12% of the variance, with PC1 capturing 32.70% and showing a strong relationship with Knowledge of Nature (CES 2), while PC2 is primarily associated with Recreation and Sports (CES 3) (Figure 10c).
These results indicate that the CES provision in wetlands is not homogeneous but instead responds to specific sociocultural contexts [7,67]. Furthermore, recent studies highlight PCA as a useful tool for profiling urban ecosystem experiences and guiding differentiated management, communication, and environmental education strategies [84,85].
4.8. Contributions of Cultural Ecosystem Services (CES) to Public Policy
The results from Bogotá’s urban wetlands underscore the urgent need to explicitly incorporate CES into environmental planning instruments and protected area management plans. The identification of distinct visitor clusters—such as “active visitors” in Córdoba and “recreational” or “passive” visitors in Santa María del Lago and Juan Amarillo—demonstrates that the uses, perceptions, and appropriation of space are not homogeneous but are shaped by sociodemographic, historical, and territorial variables [37,63].
The high valuation of CES related to Knowledge of Nature (CES 2) and Landscape Appreciation (CES 4), observed in both descriptive analyses and PCA results, highlights the potential of these ecosystems as living classrooms for environmental education, spaces for contemplative recreation, and refuges for mental health and urban social cohesion. This aligns with the international guidelines of the Ramsar Convention, which promote an integrated vision linking nature, human well-being, and culture [79,87].
Accordingly, public policies should design sustainable tourism and educational ecotourism programs that integrate interpretive trails, citizen science initiatives, and content tailored to different user profiles [62,77]. Policies should also implement ecological restoration and landscape enhancement strategies aimed at improving perceptions of safety, strengthening territorial identity, and fostering symbolic appropriation of space—particularly in wetlands with a high perception of ecosystem disservices [85,88,89].
Incorporating CES indicators, as proposed by the CICES, into urban planning and environmental impact assessments would help emphasize the intangible and symbolic value of urban ecosystems [3,73]. Likewise, the governance and participatory monitoring experience in the Córdoba wetland stands out as a good practice that could be replicated in other urban ecosystems. Its community-based approach has fostered long-term relationships, strengthened local capacities, and ensured the sustainable cultural use of the wetland, in line with the principles of the Kunming–Montreal Global Biodiversity Framework and Nature-Based Solutions (NbS) [87,90].
Ultimately, integrating CES into public policies not only supports the conservation of urban wetlands but also advances environmental justice by providing equitable services in vulnerable contexts and promoting active citizen participation in land-use planning [75,81].
4.9. Limitations and Future Research
This study focuses on wetland visitors’ experiences and self-reported perception data. This approach captures, in detail, the sociocultural dimensions of use and valuation; at the same time, future extensions could incorporate perspectives from other stakeholders (e.g., nearby residents, community organizations, and public managers) and be complemented with objective environmental-quality metrics to refine calibration between perceived and observed conditions.
Future research should validate and calibrate perception-based findings against objective indicators—such as standardized avifaunal point counts, NDVI/EVI-derived vegetation greenness indices, and systematic litter audits—by synchronizing surveys with rapid ecological assessments at commensurate spatial and temporal scales under comparable sampling protocols. This would enable estimation of measurement bias, quantification of perception–condition concordance, and stronger internal and external validity.
We recommend integrating biophysical and social indicators within an adaptive socioecological analysis guided by visitation patterns to inform conservation decisions and strengthen ecotourism through the incorporation of cultural dimensions and social perception [91,92]. These measurement-integrated analyses provide a foundation for broader policy and research advances.
Building on this foundation, we further recommend integrating economic valuation methods for CES to quantify socioeconomic contributions (following approaches in [1]); explicitly incorporating ecosystem disservices (e.g., insecurity, environmental degradation) for a more holistic assessment of well-being and ill-being [39]; and conducting comparative cross-city studies across Latin America to identify shared cultural patterns and management best practices in urban wetland governance.
5. Conclusions
Across the three wetlands, Appreciation of the Landscape—CES 4 and Knowledge of nature—CES 2 are the highest-rated components. Santa María del Lago also stands out in Tourism—CES 1 and Recreation and sports—CES 3; Juan Amarillo shows positive but more heterogeneous evaluations, with lower Religion and spirituality—CES 5; and Córdoba reaches the highest overall levels. These differences reflect local conditions of use, accessibility, and landscape configuration that should be factored into environmental planning.
Variations in CES valuation are related to visitors’ sociodemographic profiles: Santa María del Lago and Juan Amarillo attract younger, lower-income publics, whereas Córdoba draws older visitors with higher educational attainment, higher incomes, and more frequent visitation. Education, income, and age—although generally modest in association—are linked to Tourism—CES 1, Appreciation of the Landscape—CES 4, and Religion and spirituality—CES 5, indicating some sociocultural stratification of the experience.
Segmentation (HCA/Ward) identifies differentiated profiles: contemplative/scenic (CES 4), educational/interpretive (CES 2 ± CES 5), and recreational/sport-oriented (CES 3). This finding supports the need for flexible, differentiated management plans that address diverse expectations without compromising conservation, and provides new evidence on CES in Colombia’s urban wetlands and Ramsar sites.
Author Contributions
Conceptualization, V.F.F.A. and D.C.D.G.; methodology, V.F.F.A.; software, V.F.F.A.; validation, V.F.F.A. and J.S.C.S.; formal analysis, V.F.F.A.; investigation, V.F.F.A.; writing—original draft preparation, V.F.F.A. and S.D.F.; writing—review and editing, V.F.F.A. and D.C.D.G.; visualization, S.D.F.; supervision, V.F.F.A.; funding acquisition, J.S.C.S. All authors have read and agreed to the published version of the manuscript.
Funding
This research was carried out with the author’s own resources for fieldwork and data collection. The Universidad Nacional Abierta y a Distancia (UNAD) provided institutional support by granting dedicated research time to the author for the development of the study and will cover the article processing charge (APC) for publication in Sustainability.
Institutional Review Board Statement
The study was conducted in accordance with the Declaration of Helsinki (1975, revised in 2013) and the protocol was approved on 20 September 2025 by the Ethics Committee of CEII of the Universidad Nacional Abierta y a Distancia–UNAD (Project identification code: 101.1-169).
Informed Consent Statement
Informed consent was obtained from all subjects involved in the study. The survey was voluntary and anonymous, and no personally identifiable information was collected.
Data Availability Statement
All non-sensitive materials—including the survey questionnaire, aggregated results, dendrograms, principal component analysis results, and other derived statistical calculations—are available in the Zenodo repository at https://doi.org/10.5281/zenodo.16809740.
Conflicts of Interest
The authors declare that they do not have any conflicts of interest.
References
- Romanazzi, G.R.; Koto, R.; De Boni, A.; Palmisano, G.O.; Cioffi, M.; Roma, R. Cultural ecosystem services: A review of methods and tools for economic evaluation. Environ. Sustain. Indic. 2023, 20, 100304. [Google Scholar] [CrossRef]
- Chaudhary, S.; Tshering, D.; Phuntsho, T.; Uddin, K.; Shakya, B.; Chettri, N. Impact of land cover change on a mountain ecosystem and its services: Case study from the Phobjikha valley, Bhutan. Ecosyst. Health Sustain. 2017, 3, 1393314. [Google Scholar] [CrossRef]
- Haines-Young, R.; Potschin-Young, M. Revision of the Common International Classification for Ecosystem Services (CICES V5.1): A Policy Brief. One Ecosyst. 2018, 3, e27108. [Google Scholar] [CrossRef]
- McElwee, P.; He, J.; Hsu, M. Challenges to understanding and managing cultural ecosystem services in the global South. Ecol. Soc. 2022, 27, 1–9. [Google Scholar] [CrossRef]
- Chan, K.M.A.; Satterfield, T.; Goldstein, J. Rethinking ecosystem services to better address and navigate cultural values. Ecol. Econ. 2012, 74, 8–18. [Google Scholar] [CrossRef]
- Ricci, L. Integrated Approaches to Ecosystem Services: Linking Culture, Circular Economy and Environment through the Re-Use of Open Spaces and Buildings in Europe. Land 2022, 11, 1161. [Google Scholar] [CrossRef]
- Yu, G.U.O.; Min, Z. Prospects for integrating cultural ecosystem services assessment into territorial planning. J. Nat. Resour. 2024, 39, 319–335. [Google Scholar] [CrossRef]
- Russell, R.; Guerry, A.D.; Balvanera, P.; Gould, R.K.; Basurto, X.; Chan, K.M.A.; Klain, S.; Levine, J.; Tam, J. Humans and Nature: How Knowing and Experiencing Nature Affect Well-Being. Annu. Rev. Environ. Resour. 2013, 38, 473–502. [Google Scholar] [CrossRef]
- La Rosa, D.; Spyra, M.; Inostroza, L. Indicators of Cultural Ecosystem Services for urban planning: A review. Ecol. Indic. 2016, 61, 74–89. [Google Scholar] [CrossRef]
- Qiu, L.; Dong, Y.; Liu, H. Integrating Ecosystem Services into Planning Practice: Situation, Challenges and Inspirations. Land 2022, 11, 545. [Google Scholar] [CrossRef]
- Pedersen, E.; Weisner, S.E.B.; Johansson, M. Wetland areas’ direct contributions to residents’ well-being entitle them to high cultural ecosystem values. Sci. Total Environ. 2019, 646, 1315–1326. [Google Scholar] [CrossRef]
- Gómez-Baggethun, E.; de Groot, R.; Lomas, P.L.; Montes, C. The history of ecosystem services in economic theory and practice: From early notions to markets and payment schemes. Ecol. Econ. 2010, 69, 1209–1218. [Google Scholar] [CrossRef]
- Atchadé, A.J.; Kanda, M.; Folega, F.; Atela, J.; Dourma, M.; Wala, K.; Akpagana, K. Urban Ecosystem Services and Determinants of Stakeholders’ Perception for Sustainable Cities Planning in Cotonou (Benin). Sustainability 2023, 15, 9424. [Google Scholar] [CrossRef]
- Basu, S.; Nagendra, H.; Verburg, P.; Plieninger, T. Perceptions of ecosystem services and knowledge of sustainable development goals around community and private wetlands users in a rapidly growing city. Landsc. Urban Plan. 2024, 244, 104989. [Google Scholar] [CrossRef]
- Wood, K.A.; Jupe, L.L.; Aguiar, F.C.; Collins, A.M.; Davidson, S.J.; Freeman, W.; Kirkpatrick, L.; Magalhães, T.L.-D.; McKinley, E.; Nuno, A.; et al. A global systematic review of the cultural ecosystem services provided by wetlands. Ecosyst. Serv. 2024, 70, 101673. [Google Scholar] [CrossRef]
- Plieninger, T.; Dijks, S.; Oteros-Rozas, E.; Bieling, C. Assessing, mapping, and quantifying cultural ecosystem services at community level. Land. Use Policy 2013, 33, 118–129. [Google Scholar] [CrossRef]
- Guo, R.-Z.; Lin, L.; Xu, J.-F.; Dai, W.-H.; Song, Y.-B.; Dong, M. Spatio-temporal characteristics of cultural ecosystem services and their relations to landscape factors in Hangzhou Xixi National Wetland Park, China. Ecol. Indic. 2023, 154, 110910. [Google Scholar] [CrossRef]
- Zheng, Y.; Zhu, J.; Wang, S.; Guo, P. Perceived Economic Values of Cultural Ecosystem Services in Green and Blue Spaces of 98 Urban Wetland Parks in Jiangxi, China. Forests 2023, 14, 273. [Google Scholar] [CrossRef]
- Villagra, P.; Rojas, C.; Rojas, O.; Alves, S. Spatial interactions between perceived biophilic values and neighborhood typologies in urban wetlands. City Built Environ. 2024, 2, 3. [Google Scholar] [CrossRef]
- Correa-Araneda, F.; Urrutia, J.; Figueroa, R. Estado del conocimiento y principales amenazas de los humedales boscosos de agua dulce de Chile. Rev. Chil. Hist. Nat. 2011, 84, 325–340. [Google Scholar] [CrossRef]
- Brink, P.T.; Daniela, R.; Andrew, F.; Tomas, B.; David, C.; Johannes, F.; Ritesh, K.; Nick, D. The Economics of Ecosystems and Biodiversity for Water and Wetlands: Executive Summary; Institute for European Environmental Policy (IEEP): Brussels, Belgium, 2013; Available online: https://portals.iucn.org/library/node/10349 (accessed on 5 August 2025).
- Mitsch, W.J.; Gosselink, J.G. Wetlands, 5th ed.; John Wiley & Sons Inc: Hoboken, NJ, USA, 2015. [Google Scholar]
- Hu, S.; Niu, Z.; Chen, Y.; Li, L.; Zhang, H. Global wetlands: Potential distribution, wetland loss, and status. Sci. Total Environ. 2017, 586, 319–327. [Google Scholar] [CrossRef]
- Angel, A.M.L. Strategy for the Use of the Parques Ecológicos Distritales de Humedal of the City of Bogotá, Colombia Through the Implementation of Boat Navigation Activities. June 2022. Available online: https://repository.javeriana.edu.co/items/6ed98e42-0e68-4fa4-a50a-2898f8746b5d (accessed on 28 August 2024).
- Secretariat of the Ramsar Convention Ramsar Convention Handbook: Guide to the Convention on Wetlands (Ramsar, Iran, 1971), 4a ed.; Secretaría de la Convención de Ramsar: Gland, Switzerland, 2006. Available online: https://www.ramsar.org/sites/default/files/documents/pdf/lib/lib_manual2006s.pdf (accessed on 26 June 2025).
- Ceballos, A.M.M. Bogota’s Wetlands—A Challenge for Public Management. 2013. Available online: http://hdl.handle.net/1992/12187 (accessed on 28 August 2024).
- Ramsar Urban Wetlands Complex of the Capital District of Bogotá|Ramsar Sites Information Service. Ramsar Sites Information Service. Available online: https://rsis.ramsar.org/es/ris/2404 (accessed on 26 June 2025).
- Ordoñez, L.; González, R. Connectivity between the Santa María del Lago, Córdoba, and Juan Amarillo Wetlands and the Other Elements of the Main Ecological Structure in the Urban Basin of the Salitre River, Bogotá D.C. Rev. Topogr. AZIMUT 2016, 7, 1–8. Available online: https://revistas.udistrital.edu.co/index.php/azimut/article/view/11450/12217 (accessed on 30 August 2025).
- SDA Environmental Management Plan PMA Ramsar Site Urban Wetlands Complex of the Capital District of Bogotá. Secretaría Distrital de Ambiente. Available online: https://www.ambientebogota.gov.co/plan-de-manejo-ambiental-pma-sitio-ramsar-complejo-de-humedales-urbanos-del-distrito-capital-de-bogota (accessed on 17 July 2025).
- SDA Santa María del Lago Wetland. District Secretariat of Environment of Bogotá. Available online: https://www.ambientebogota.gov.co/humedal-santa-maria-del-lago (accessed on 5 July 2025).
- Bogotá Aqueduct and Conservation International Environmental Management Plan for the Juan Amarillo Wetland. Available online: https://oab.ambientebogota.gov.co/?post_type=dlm_download&p=15062 (accessed on 29 August 2024).
- Corredor, V.; Santiago, H. Impact of urban growth in the town of Suba on the Juan Amarillo Wetland. Novum Ambiens 2024, 2, 1–9. [Google Scholar] [CrossRef]
- UNAL Environmental Management Plan for the Cordoba Wetland. Available online: https://oab.ambientebogota.gov.co/?post_type=dlm_download&p=15038 (accessed on 28 August 2024).
- Cochran, W.G. Sampling Techniques., 3rd ed.; John Wiley & Sons: New York, NY, USA, 1977. [Google Scholar]
- Zhong, Z.; Fang, X.; Zhang, Y.; Shu, X.; Guo, D. Mapping Ecosystem Service Supply–Demand Bundles for an Integrated Analysis of Tradeoffs in an Urban Agglomeration of China. Land 2022, 11, 1558. [Google Scholar] [CrossRef]
- Dou, Y.; Zhen, L.; De Groot, R.; Du, B.; Yu, X. Assessing the importance of cultural ecosystem services in urban areas of Beijing municipality. Ecosyst. Serv. 2017, 24, 79–90. [Google Scholar] [CrossRef]
- Asatryan, V.; Keryan, T.; Radinger-Peer, V.; Dallakyan, M. Assessment of Cultural Ecosystem Services Potential in River Catchments in the Caucasus: Evidence From Dilijan National Park, Armenia. Mt. Res. Dev. 2024, 44, R1–R13. [Google Scholar] [CrossRef]
- Juntti, M.; Lundy, L. A mixed methods approach to urban ecosystem services: Experienced environmental quality and its role in ecosystem assessment within an inner-city estate. Landsc. Urban Plan. 2017, 161, 10–21. [Google Scholar] [CrossRef]
- Montes-Pulido, C.; Forero, V.F. Cultural ecosystem services and disservices in an urban park in Bogota, Colombia. Ambiente Soc. 2021, 24, e00453. [Google Scholar] [CrossRef]
- Chan, K.K.; Neighbors, C.; Gilson, M.; Larimer, M.E.; Marlatt, G.A. Epidemiological trends in drinking by age and gender: Providing normative feedback to adults. Addict. Behav. 2007, 32, 967–976. [Google Scholar] [CrossRef]
- Silinskas, G.; Ranta, M.; Wilska, T.-A. Financial Behaviour Under Economic Strain in Different Age Groups: Predictors and Change Across 20 Years. J. Consum. Policy 2021, 44, 235–257. [Google Scholar] [CrossRef]
- Corti, A.M.; Godino, C.M.B.; Motiveros, M.L. Educational diversification and social segmentation: Signs of an era of new inequalities. Colomb. J. Educ. 2016, 287–304. Available online: http://www.scielo.org.co/scielo.php?script=sci_arttext&pid=S0120-39162016000100013&lng=en&nrm=iso&tlng=es (accessed on 6 March 2025).
- DANE DANE—National Quality of Life Survey (ECV) 2023. Available online: https://www.dane.gov.co/index.php/estadisticas-por-tema/salud/calidad-de-vida-ecv/encuesta-nacional-de-calidad-de-vida-ecv-2023 (accessed on 6 March 2025).
- Tu, X.; Huang, G.; Wu, J.; Guo, X. How do travel distance and park size influence urban park visits? Urban For. Urban Green. 2020, 52, 126689. [Google Scholar] [CrossRef]
- Likert, R. A technique for the measurement of attitudes. Arch. Psychol. 1932, 140, 1–55. [Google Scholar]
- Franzese, M.; Iuliano, A. Correlation Analysis. In Encyclopedia of Bioinformatics and Computational Biology; Elsevier: Amsterdam, The Netherlands, 2019; pp. 706–721. [Google Scholar] [CrossRef]
- Ortega, R.M.M.; Pendás, L.C.T.; Ortega, M.M.; Abreu, A.P.; Cánovas, A.M. Spearman’s rank correlation coefficient characterization. Havana J. Med. Sci. 2009, 8, 1–9. [Google Scholar]
- Gowda, K.C.; Diday, E. Symbolic clustering using a new dissimilarity measure. Pattern Recognit. 1991, 24, 567–578. [Google Scholar] [CrossRef]
- Pardo, M.R.; Vargas, J.B.; Mejía, C.A.Z. Methodological trends for the implementation of agroforestry systems in the framework of sustainable development: A review. Madera Bosques 2022, 28, e2812279. [Google Scholar]
- Triana-D, A.; Sánchez, J.; Avella-M, A.; González-Melo, A.; Torres-R, F. Functional analysis of carbon sequestration in an inter-Andean tropical dry forest. Caldasia 2019, 41, 179–193. [Google Scholar] [CrossRef]
- Everitt, B.S.; Landau, S.; Leese, M.; Stahl, D. Hierarchical Clustering. In Cluster Analysis; John Wiley & Sons, Ltd.: Hoboken, NJ, USA, 2011; pp. 71–110. [Google Scholar] [CrossRef]
- Jolliffe, I.T. (Ed.) Principal Components as a Small Number of Interpretable Variables: Some Examples. In Principal Component Analysis; Springer: New York, NY, USA, 2002; pp. 63–77. [Google Scholar] [CrossRef]
- Conti, G.; Enrico, L.; Jaureguiberry, P.; Cuchietti, A.; Lipoma, M.L.; Cabrol, D. The role of functional diversity in the provision of multiple ecosystem services: An empirical analysis in the dry Chaco of Córdoba, central Argentina. Ecosistemas 2018, 27, 60–74. Available online: https://www.revistaecosistemas.net/index.php/ecosistemas/article/view/1491/1148 (accessed on 6 March 2025).
- Shrestha, N. Factor Analysis as a Tool for Survey Analysis. Am. J. Appl. Math. Stat. 2021, 9, 4–11. [Google Scholar] [CrossRef]
- Godoy, K.A.S. Impact of Citizen Science on Environmental Management of the Córdoba Wetland, Bogotá, Colombia. October 2017. Available online: https://ridum.umanizales.edu.co/handle/20.500.12746/3228 (accessed on 6 August 2025).
- Hernández, A.M.S. Juan Amarillo Wetland Towards a Permeable Environment. 2017. Available online: http://hdl.handle.net/11396/3706 (accessed on 6 August 2025).
- Rodriguez, D.J.L. Importance and Preservation of the Juan Amarillo wetland. January 2020. Available online: http://hdl.handle.net/11371/2256 (accessed on 7 August 2025).
- López, O.L.M.; Guevara, A.K.C. Environmental Diagnosis of the Córdoba Wetland in Suba, Bogotá. June 2023. Available online: https://repository.udistrital.edu.co/items/2ab840de-9d0f-44a2-a6e8-e19a2458fd1e (accessed on 7 August 2025).
- Rosso, N.M.; Bautista, D.R.M. Tourism and Conservation of Wetlands in the Town of Suba. Universidad Colegio Mayor de Cundinamarca, 13 December 2019. Available online: https://repositorio.universidadmayor.edu.co/handle/unicolmayor/56 (accessed on 7 August 2025).
- Yunda, J.G. Densification and social stratification in Bogotá: Skewed distribution of private investment. EURE Santiago 2019, 45, 237–257. [Google Scholar] [CrossRef]
- Moreno-Baron, E.; Penagos-Campos, K. Design of an Ecotourism Product in the Santa María del Lago Wetland District Ecological Park Aimed at Hotel and Tourism Students from Uniagustiniana University. February 2020. Available online: https://bibliotecadigital.oducal.com/Record/ir-123456789-1179 (accessed on 7 August 2025).
- Beltran, L.F.G.; León, L.M.T. The Juan Amarillo-Tibabuyes Wetland’s Vocation to Implement Ecotourism Activities as a Contribution to Its Conservation. June 2021. Available online: https://repositorio.universidadmayor.edu.co/handle/unicolmayor/2855 (accessed on 7 August 2025).
- Díaz-Pinzón, L.; Sierra, L.; Trillas, F.; Verd, J.M. The Social-Ecological System Framework of Urban Wetlands: The Role of Collective Management at Local Level. Int. J. Commons 2024, 18, 649–669. [Google Scholar] [CrossRef]
- Rojas, K.V.R. Juan Amarillo Wetland: Between Political and Environmental Will; InstnameUniversity Bogotá Jorge Tadeo Lozano: Bogotá, Colombia, 2021; Available online: http://hdl.handle.net/20.500.12010/17606 (accessed on 7 August 2025).
- Triana, L.M.M. Santa María del Lago Wetland as an Educational Place for Situated Learning: A Perspective from Urban and Environmental Pedagogy. 2017. Available online: http://hdl.handle.net/20.500.12209/9593 (accessed on 7 August 2025).
- Montenegro, S.C.; Pachón, J.C.; Pardo, J.R. Approaches to the Spatio-Temporal Transformations of the Juan Amarillo Wetland in the City of Bogotá. Geogr. J. Cent. Am. 2011, 2, 1–16. [Google Scholar]
- Báez, A.; Alexandra, J. Cultural Ecosystem Services of the Indigenous Territory of Corregimiento La Pedrera, Amazonas-Colombia. 2016. Available online: http://hdl.handle.net/11349/3735 (accessed on 10 February 2022).
- Zhou, L.; Guan, D.; Huang, X.; Yuan, X.; Zhang, M. Evaluation of the cultural ecosystem services of wetland park. Ecol. Indic. 2020, 114, 106286. [Google Scholar] [CrossRef]
- Wang, Y.; Fu, B.T.; Lyu, Y.P.; Yang, K.; Che, Y. Assessment of the social values of ecosystem services based on SolVES model: A case study of Wusong Paotaiwan Wetland Forest Park, Shanghai, China. Ying Yong Sheng Tai Xue Bao J. Appl. Ecol. 2016, 27, 1767–1774. [Google Scholar] [CrossRef]
- Zoderer, B.M.; Tasser, E.; Erb, K.-H.; Stanghellini, P.S.L.; Tappeiner, U. Identifying and mapping the tourists⿿ perception of cultural ecosystem services: A case study from an Alpine region. Land Use Policy 2016, 56, 251–261. [Google Scholar] [CrossRef]
- Baykalı, B.; Şen, G. Determining Urban and Rural Perceptions of Forest Ecosystem Services. Bartın Orman Fakültesi Derg. 2024, 26, 177–195. [Google Scholar] [CrossRef]
- Bogota City Hall. 2023 Management Report: Córdoba and Nice District Wetland Reserve; Bartın University: Bartın, Turkey, 2023. [Google Scholar]
- Bennett, E.M.; Cramer, W.; Begossi, A.; Cundill, G.; Díaz, S.; Egoh, B.N.; Geijzendorffer, I.R.; Krug, C.B.; Lavorel, S.; Lazos, E.; et al. Linking biodiversity, ecosystem services, and human well-being: Three challenges for designing research for sustainability. Curr. Opin. Environ. Sustain. 2015, 14, 76–85. [Google Scholar] [CrossRef]
- Shackleton, C.M.; Ruwanza, S.; Sanni, G.K.S.; Bennett, S.; De Lacy, P.; Modipa, R.; Mtati, N.; Sachikonye, M.; Thondhlana, G. Unpacking Pandora’s Box: Understanding and Categorising Ecosystem Disservices for Environmental Management and Human Wellbeing. Ecosystems 2016, 19, 587–600. [Google Scholar] [CrossRef]
- Larson, K.L.; Corley, E.A.; Andrade, R.; Hall, S.J.; York, A.M.; Meerow, S.; Coseo, P.; Childers, D.L.; Hondula, D.M. Subjective evaluations of ecosystem services and disservices: An approach to creating and analyzing robust survey scales. Ecol. Soc. 2019, 24, 10. [Google Scholar] [CrossRef]
- Rodgman, M.K.; Anguelovski, I.; Pérez-Del-Pulgar, C.; Shokry, G.; Garcia-Lamarca, M.; Connolly, J.J.; Baró, F.; Triguero-Mas, M. Perceived urban ecosystem services and disservices in gentrifying neighborhoods: Contrasting views between community members and state informants. Ecosyst. Serv. 2024, 65, 101571. [Google Scholar] [CrossRef]
- Shah, A.M.; Liu, G.; Chen, Y.; Yang, Q.; Yan, N.; Agostinho, F.; Almeida, C.M.V.B.; Giannetti, B.F. Urban constructed wetlands: Assessing ecosystem services and disservices for safe, resilient, and sustainable cities. Front. Eng. Manag. 2023, 10, 582–596. [Google Scholar] [CrossRef]
- Ioja, C.; Qureshi, S. Urban Wildland—Forests, Waters and Wetlands. In Making Green Cities: Concepts, Challenges and Practice; Breuste, J., Artmann, M., Ioja, C., Qureshi, S., Eds.; Springer International Publishing: Cham, Switzerland, 2023; pp. 193–196. [Google Scholar] [CrossRef]
- Alikhani, S.; Nummi, P.; Ojala, A. Urban Wetlands: A Review on Ecological and Cultural Values. Water 2021, 13, 3301. [Google Scholar] [CrossRef]
- Thiemann, M.; Riebl, R.; Haensel, M.; Schmitt, T.M.; Steinbauer, M.J.; Landwehr, T.; Fricke, U.; Redlich, S.; Koellner, T. Perceptions of ecosystem services: Comparing socio-cultural and environmental influences. PLoS ONE 2022, 17, e0276432. [Google Scholar] [CrossRef]
- Brown, J.A.; Larson, K.L.; Lerman, S.B.; Childers, D.L.; Andrade, R.; Bateman, H.L.; Hall, S.J.; Warren, P.S.; York, A.M. Influences of Environmental and Social Factors on Perceived Bio-Cultural Services and Disservices. Front. Ecol. Evol. 2020, 8, 569730. [Google Scholar] [CrossRef]
- Margaryan, L.; Prince, S.; Ioannides, D.; Röslmaier, M. Dancing with cranes: A humanist perspective on cultural ecosystem services of wetlands. Tour. Geogr. 2022, 24, 501–522. [Google Scholar] [CrossRef]
- SDA Córdoba Wetland. District Secretariat of Environment of Bogotá. Available online: https://www.ambientebogota.gov.co/humedal-cordoba (accessed on 5 July 2025).
- Wang, Y.; Niemelä, J.; Kotze, D.J. The delivery of Cultural Ecosystem Services in urban forests of different landscape features and land use contexts. People Nat. 2022, 4, 1369–1386. [Google Scholar] [CrossRef]
- Drew-Smythe, J.J.; Davila, Y.C.; McLean, C.M.; Hingee, M.C.; Murray, M.L.; Webb, J.K.; Krix, D.W.; Murray, B.R. Community perceptions of ecosystem services and disservices linked to urban tree plantings. Urban For. Urban Green. 2023, 82, 127870. [Google Scholar] [CrossRef]
- Miranda, J.R.L.; Vasquez, D.J.U.; Lazo, C.A. Narrative exploration of cultural ecosystem services in the ravines of Moyobamba. Front. Built Environ. 2025, 11, 1524483. [Google Scholar] [CrossRef]
- Convention on Wetlands Scaling up Wetland Conservation and Restoration to Deliver the Kunming-Montreal Global Biodiversity Framework: Guidance on Including Wetlands in NBSAPs|The Convention on Wetlands, the Convention on Wetlands. Available online: https://www.ramsar.org/document/scaling-wetland-conservation-restoration-deliver-kunming-montreal-global-biodiversity (accessed on 7 August 2025).
- Clarke, B.; Thet, A.K.; Sandhu, H.; Dittmann, S. Integrating Cultural Ecosystem Services valuation into coastal wetlands restoration: A case study from South Australia. Environ. Sci. Policy 2021, 116, 220–229. [Google Scholar] [CrossRef]
- Palta, M.; Bray, M.V.D.; Stotts, R.; Wolf, A.; Wutich, A. Ecosystem Services and Disservices for a Vulnerable Population: Findings from Urban Waterways and Wetlands in an American Desert City. Hum. Ecol. 2016, 44, 463–478. [Google Scholar] [CrossRef]
- Díaz, S.; Demissew, S.; Carabias, J.; Joly, C.; Lonsdale, M.; Ash, N.; Larigauderie, A.; Adhikari, J.R.; Arico, S.; Báldi, A.; et al. The IPBES Conceptual Framework—Connecting nature and people. Curr. Opin. Environ. Sustain. 2015, 14, 1–16. [Google Scholar] [CrossRef]
- Zaimes, G.N.; Iakovoglou, V. Assessing Riparian Areas of Greece—An Overview. Sustainability 2021, 13, 309. [Google Scholar] [CrossRef]
- Schismenos, S.; Zaimes, G.N.; Iakovoglou, V.; Emmanouloudis, D. Environmental sustainability and ecotourism of riparian and deltaic ecosystems: Opportunities for rural Eastern Macedonia and Thrace, Greece. Int. J. Environ. Stud. 2019, 76, 675–688. [Google Scholar] [CrossRef]
Disclaimer/Publisher’s Note: The statements, opinions and data contained in all publications are solely those of the individual author(s) and contributor(s) and not of MDPI and/or the editor(s). MDPI and/or the editor(s) disclaim responsibility for any injury to people or property resulting from any ideas, methods, instructions or products referred to in the content. |
© 2025 by the authors. Licensee MDPI, Basel, Switzerland. This article is an open access article distributed under the terms and conditions of the Creative Commons Attribution (CC BY) license (https://creativecommons.org/licenses/by/4.0/).