Abstract
Urban expansion intensifies economic–environmental conflicts, making human settlement quality increasingly critical for sustainable development. This study applies ecological niche theory to evaluate the evolution of human settlement quality in the Wuhan Metropolitan Area (WMA) from 2014 to 2022 using 21 economic, social, and ecological indicators. The results reveal: (1) significant variations in niche-fitness values across subsystems, with Wuhan maintaining superiority (>0.820) despite a gradual decline, while peripheral cities—notably Huangshi, Tianmen, and Ezhou—consistently ranked lower (<0.610) throughout the study period; (2) three evolutionary trajectories emerged, characterized by continuous decline, inverted U-shaped development, and sustained growth, reflecting nonlinear dynamics and path dependence in the region’s development patterns. These findings underscore persistent core-periphery disparities within the metropolitan area, yet improved regional coordination is evident as inter-city evaluation gaps narrowed from 0.329 to 0.231 between 2014 and 2022. Based on these insights, tailored policy recommendations are proposed to address the identified disparities and promote balanced development. This study offers valuable theoretical and practical contributions toward achieving coordinated and sustainable development in metropolitan regions.
1. Introduction
Global urbanization poses critical sustainability challenges, with 55% of the world’s population residing in urban areas—a proportion projected to reach 70% by 2050 [1]. This rapid growth intensifies tensions between economic development and environmental constraints, manifesting as environmental degradation, resource scarcity, infrastructural stress, and social inequalities [2]. In response, the international community adopted the 2030 Agenda for Sustainable Development to promote integrated environmental, economic, and social progress [3]. China’s urbanization, having reached 67% in 2024 [4], exemplifies these challenges, exerting substantial ecological pressures that affect public health and quality of life. This has spurred national initiatives such as the Beautiful China initiative (2023), which aims to build ecologically livable cities. Urban settlement quality is closely linked to developmental stages, shaped by demographic shifts, climate adaptation strategies, and sustainability targets [5]. Urban agglomerations, representing advanced spatial configurations centered around core cities with interconnected transport and economic systems, have evolved from early garden city concepts into crucial drivers of regional growth and ecological innovation [6]. In China, 19 major urban clusters, covering 25% of the national territory, account for 88% of GDP and house 83% of the population, forming the cornerstone of the country’s development strategy [7]. The WMA represents a prominent example, utilizing its geographic advantages and transportation infrastructure since its designation as a pilot zone for sustainable development in 2007. Research on urban agglomeration-scale settlement quality assessment could enhance the theoretical understanding of urbanization-environment dynamics and supply an empirical support for evidence-based policies aimed at promoting reginal sustainability.
1.1. Theoretical Foundations and Research Progress in Human Settlement Studies
Human settlements represent the physical outcomes of humanity-nature interaction, characterized by the dynamic relationship between built environments and their ecological settings to form sustainable living spaces [8]. The field has evolved into a vital interdisciplinary domain, originating from Doxiadis’ human settlement theory [9], which established an integrative framework analyzing settlements across spatial scales—from villages to metropolitan regions—while emphasizing their geographical interconnectedness. Wu Liangyong [10] advanced this into a holistic system comprising five subsystems spanning natural, human, social, residential, and infrastructure components, governed by principles of ecological sustainability, economic feasibility, technical applicability, social equity, and cultural value. The discipline continues to progress through integration with emerging areas such as urban resilience [11], climate vulnerability assessment [12], new urbanization metrics [13], Sustainable Development Goals (SDGs) frameworks [14], and rural revitalization strategies [15,16]. These advancements have significantly enhanced the theoretical framework’s practical applicability.
Research in human settlements includes comprehensive evaluation systems emphasizing quality assessment, livability analysis, economic coordination, and construction adaptability. Quality evaluation serves as a critical link between theoretical frameworks and practical implementation, extending beyond basic material conditions to include health, comfort, safety, wellbeing, convenience, and esthetic experience. Current studies adopt varied spatial scales, including individual cities [17], provincial regions [18], and rural areas [19]. Most employ multidimensional analytical frameworks that assess natural endowments using atmospheric and vegetative indicators, social infrastructure through demographic and service-related metrics, economic vitality with labor market indicators, and subjective wellbeing via quality-of-life assessments. For example, Bao et al. (2020) identified four dimensions based on human needs: basic living requirements, public safety, social connectedness and belonging, and self-actualization [20]. Similarly, Liang et al. (2021) focused on economic conditions, social dynamics, and environmental factors [21]. Zhong et al. (2022) expanded this to natural environment, economic performance, social equity, and personal life quality [22].
Current evaluation systems exhibit three prominent evolutionary trends: increased interdisciplinary integration of social and natural sciences, a shift toward comprehensive quantitative modeling, and continuous technological innovation. Despite remarkable progress, critical challenges remain, particularly in developing evaluation systems for cross-regional urban agglomerations, advancing longitudinal studies to reveal dynamic settlement patterns, and improving understanding of macro-scale ecological interactions. Addressing these gaps presents valuable opportunities for future research aimed at enhancing both theoretical frameworks and practical applications in human settlement studies.
1.2. Methodological Evolution and the Application of Niche-Fitness Theory in Human Settlement Research
Methodologically, research on human settlements has advanced from qualitative evaluations to sophisticated quantitative approaches. Current techniques include questionnaire surveys [23], entropy method [24], analytic hierarchy process (AHP) [25], cluster analysis [26], Technique for Order Preference by Similarity to Ideal Solution (TOPSIS) model [27], Driving forces-Pressures-States-Impacts-Responses (DPSIR) framework [28], and geographical detectors [29]. These tools support critical functions such as indicator weighting, regional classification, policy optimization, driving factor identification, and spatial pattern recognition. Furthermore, advancements in geographical science, big data analytics, and artificial intelligence have enhanced integrated evaluation methods using remote sensing [2], Geographic Information Systems (GIS) [30,31], multi-source data fusion [32,33], and machine learning [34]. Despite these methodological advances, most approaches have underemphasized ecological dimensions.
This study introduces an innovative application of niche fitness theory—an ecologically grounded framework that emphasizes human adaptability within specific ecological contexts while prioritizing human needs. Rooted in Grinnell’s (1917) spatial niche hypothesis and Elton’s (1927) functional niche framework, this theory originally investigated relationships between species’ spatial distributions and resource utilization patterns. Subsequent developments by scholars including Li Zizhen established niche fitness as a fundamental ecological concept quantifying the alignment between a species’ realized habitat conditions and its optimal resource state [35,36]. The mathematical formulation employs weighted Euclidean distance or fuzzy membership functions to operationalize ecosystem matching through a reality-ideal proximity paradigm, addressing limitations of traditional assessment methodologies. This approach not only provides an innovative quantitative tool but also transcends conventional evaluation constraints. The theory’s application has expanded from natural ecosystems to socioeconomic domains, providing valuable for land resource assessment [37], urban spatial planning [38], and innovative ecosystems [39,40].
In urban contexts, niche theory integrates natural ecosystem services with human social demands by analyzing cities as complex artificial ecosystems. This integration establishes a multidimensional analytical framework for sustainable development research, encompassing resource supply, environmental carrying capacity, and social response. Urban human settlements form dynamically coupled networks of social, economic, and ecological subsystems [41], where synergistic interactions through material cycling, energy flow, and information exchange directly affect residential suitability. At the regional scale, urban niche reflects a city’s functional positioning within regional ecosystems [42], shaped by resource endowment, policy orientation, and technological innovation. Empirical studies demonstrate that the niche fitness model offers a novel perspective for urban planning, construction, and management, with substantial practical applicability. These applications have proven valuable in multiple domains, including: analyzing spatiotemporal dynamics of urban niche evolution [42], conducting multidimensional assessments across ecological, economic, and social dimensions [43], optimizing spatial planning and infrastructure design [44,45], and enhancing low-carbon urban configurations [38,46]. This niche fitness approach provides quantitative measures of urban livability and carrying capacity while supporting ecosystem optimization during urbanization, offering valuable guidance for sustainable urban development and planning practices.
2. Materials and Methods
2.1. Research Framework and Process
This research develops a niche fitness theory-based framework to assess urban human settlement quality (Figure 1). The process begins with data preparation, involving site selection and data collection from official publications. The methodological core consists of three sequential steps: first, establishing an evaluation index system and determining indicator weights using the entropy weight method; second, calculating subsystem niche-fitness values by integrating optimal niche values with predetermined weights; and third, deriving comprehensive city-level scores through a weighted aggregation of subsystem values, with the weights determined by a second application of the entropy weight method. Ultimately, this approach enables a multidimensional assessment: the subsystem values reflect quality in specific settlement aspects, while the comprehensive scores quantify the overall urban settlement quality for each city.
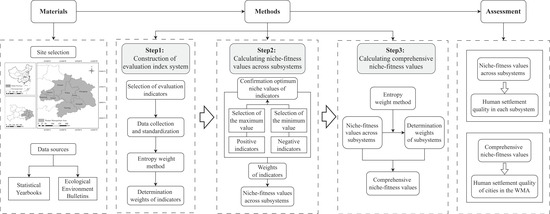
Figure 1.
Research framework and process.
2.2. Site Selection and Data Sources
2.2.1. Site Selection
The Wuhan Metropolitan Area (WMA), as a reginal urban cluster, comprises Wuhan and eight neighboring cities within its 100 km radius: Huangshi, Ezhou, Xiaogan, Huanggang, Xianning, Xiantao, Tianmen and Qianjiang (Figure 2). As Hubei Province’s primary hub for industry and resources, the WMA occupies 33% of the province’s territory yet hosts 51.6% of its population and generates 60.45% of its GDP, achieving 3.37 trillion yuan in 2023. Characterized by high urban density, a robust economic base, and favorable environmental conditions, the WMA is focused on building integrated one-hour commuting and daily living circles to strengthen connectivity in transportation, economy, and social development. The WMA’s strategic importance has been consistently reinforced through national planning. In 2014, it was designated as a “national demonstration zone for building a resource-efficient and environmentally friendly society” and a “national pilot zone for independent innovation.” By 2022, its development plan was officially approved by the National Development and Reform Commission, marking it the seventh national-level metropolitan area in China. During this period, the region experienced sustained economic growth, with GDP exceeding RMB 3.2 trillion in 2022—an increase of RMB 1.5 trillion since 2014—accounting for over 59% of Hubei Province’s total economic output. Leveraging its central location and advanced transportation network, the WMA enhances synergy across the region and reinforces its role as the core driver of Hubei’s economy and a strategic anchor for central China’s development.
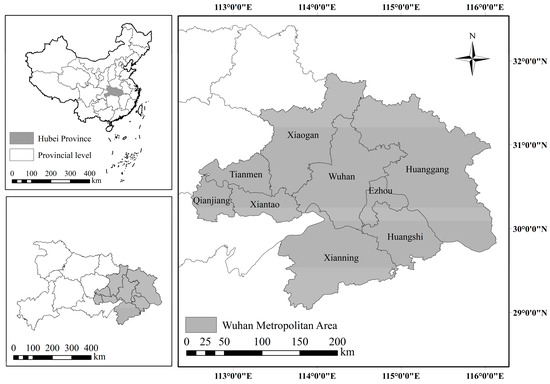
Figure 2.
Location of the WMA.
2.2.2. Data Sources
This paper develops a comprehensive evaluation framework encompassing economic, social and ecological dimensions to assess human settlement quality in the WMA. The analysis incorporates 21 key indicators spanning infrastructure development, environmental governance performance, and green space provision. Data were rigorously collected from authoritative sources including Hubei Statistical Yearbooks, provincial Ecological Environment Bulletins, and municipal statistical reports. Missing values were addressed through mean imputation using annual averages to maintain dataset completeness.
2.3. Construction of an Evaluation Index System for Urban Human Settlement Quality
2.3.1. Selection of Evaluation Indicators
Human settlements emerge from sustained human-environment interactions, forming integrated systems that combine physical living spaces with interconnected socioeconomic, demographic, and ecological dimensions [47]. Quality assessment of these settlements employs both quantitative and qualitative methods to evaluate environmental conditions across specific geographical settings, serving dual purposes of advancing environmental understanding and guiding sustainable development [48]. A scientifically rigorous evaluation system enables comprehensive analysis of settlement conditions, supporting data-based urban planning and quality-of-life improvement. Based on aforementioned theoretical foundations, this paper develops an assessment framework assessing economic, social, and ecological subsystems to systematically measure settlement quality.
The economic environment serves as a critical pillar supporting urban human settlements, manifested through four core aspects including living standards, income levels, expenditure patterns, and consumption capacity. These economic elements drive infrastructure development and facilitate access to essential goods and services [49]. Robust economic performance stimulates urban expansion while generating employment opportunities and enhancing household incomes, ultimately improving living standards. Our assessment framework incorporates seven key indicators (ES1–ES7) to quantify these economic dynamics, measuring urban development status, resident income levels, and municipal fiscal strength.
The social environment constitutes a fundamental component of urban human settlements, primarily encompassing education, healthcare, transportation, and communication infrastructures that directly determine residents’ living convenience. Specifically, educational resources indicate spatial equity in learning opportunities, while medical resources demonstrated regional healthcare service capacity and influence population health outcomes. Transportation infrastructure governs daily commuting efficiency, and communication networks facilitate external connectivity. This study employs seven key indicators (SH1–SH7) to quantitatively assess these four critical elements of social development.
The ecological environment forms the foundational basis for human settlement development by providing essential land, water, biological, and mineral resources. China’s longstanding urban greening policies recognize that robust ecological conditions constitute prerequisite for sustainable urban growth while enhancing resident wellbeing. This study evaluates ecological environmental quality through seven key indicators (EH1–EH7) assessing vegetation coverage, air quality, green space availability, and noise pollution levels.
In sum, the human settlement system comprises three interdependent components—economic, social and ecological environments—that interact to form a complex organic whole. Their synergistic relationship is fundamental for achieving sustainable urban development. To objectively evaluate human settlement quality while capturing its multidimensional characteristics, we developed an assessment framework following principles of objectivity, scientific rigor, comprehensiveness and practicality [50], with emphasis on human-centered design, regional specificity, and operational feasibility. Building on existing research, we selected 21 representative indicators across economic, social and ecological dimensions to measure development levels, living standards and environmental quality. This systematic evaluation system was applied to assess human settlement conditions across nine cities in the WMA, as detailed in Table 1.

Table 1.
Evaluation index system of human settlement quality in WMA.
2.3.2. Data Standardization
To ensure comparability across indicator with varying measurement scales, this study applies Min-Max normalization to standardize all input variables and eliminate dimensional influences. Following standard practice for multi-criteria evaluation systems, indicators are classified into two categories based on their performance orientation: positive indicators where larger values indicate better performance and negative indicators where smaller values indicate better performance. Equation (1) implements the normalizations for positive indicators, while Equation (2) handles negative indicators, with both transformations mapping values to a standardized range for cross-dimensional comparison.
where xij′ is the standardized value for indicator j in region i; xij is the raw data of indicator j in region i; max xij and min xij represent the maximum and minimum values of the j-th indicator, respectively.
2.3.3. Determination of Weights
The methods for determining indicator weights are primarily categorized into subjective and objective approaches. Subjective method rely on experts or decision-makers to assign weights based on experience and the perceived importance of factors. These methods, such as the analytic hierarchy process (AHP) and expert scoring, have the advantage of directly reflecting decision objectives and value orientations. In contrast, objective methods derive weights solely through statistical analysis of the characteristics of the raw evaluation data. By eliminating subjective bias, these approaches yield more data-driven, objective, and scientifically robust results. Common examples include the entropy weight method and the Criteria Importance Through Intercriteria Correlation (CRITIC) method. Given that this study uses data from statistical yearbooks as its core analytical foundation, the entropy weight method was selected to determine indicator weights [51]. This choice aims to minimize biases from subjective judgment while fully utilizing the intrinsic information characteristics of the data.
Originally derived from thermodynamics in physics, entropy quantifies the degree of disorder within a system and has since been applied across numerous research fields [52,53]. The entropy weight method is an objective multi-criteria decision-making method (MCDM) that determines criterion weights based on the dispersion degree—or information content—of the data itself. This method effectively uncovers implicit distinguishing information in the dataset, thereby enhancing the fairness and scientific rigor of the evaluation process [54]. The magnitude of an indicator’s weight reflects the extent of variation in its data across different samples. A higher weight indicates greater fluctuation among research units, implying that the data are more disordered and dispersed, and thus contain more information and have stronger discriminative power. Conversely, a lower weight suggests less variability, meaning the data are more orderly and concentrated, and contribute less to distinguishing between units [55]. Applying Equations (3)–(6), weight coefficients βj were calculated for each indicator within its respective subsystem. These weights objectively reflect each indicator’s relative importance in influencing niche fitness, as demonstrated in Table 1.
where fij is the weighting of the indicator value of the i-th evaluated object under the j-th indicator of matrix X; xij’ is the same meaning as above; ej is the entropy value of the indicator j; βj is the weighting of indicators; n represent the number of representative ecological factors.
2.4. Evaluation Model for Urban Human Settlement Quality
2.4.1. Confirmation of Optimum Niche-Values
The niche-fitness model operates by assessing the quality of human settlements through quantifying the alignment between actual environmental conditions and the ideal requirements for human habitation. This model conceptualizes cities as ecosystems and residents as the core species within these systems. By evaluating how closely ecological, social, and economic systems correspond to residents’ needs and wellbeing, it offers a scientific basis for urban planning and targeted improvement of human settlement environment. Among them, the determination of optimum niche-fitness values constitutes the core link connecting the quantitative results of the niche-fitness model with practical applications.
The optimum niche-fitness value represents the most favorable condition for each indicator to support high-quality human settlements, reflecting its ideal contribution to livability and environmental quality. This benchmark serves as a reference standard to assess current urban settlement conditions and identify improvement gaps. Based on data from 9 cities in WMA, we determine each indicator’s optimal value xaj through systematic analysis. For negative indicators like population density and average annual concentration of air SO2, lower values indicate better settlement quality, so we select the minimum standardized value. Conversely, for positive indicators including GDP per capita, coverage rate of telephones, and park green area per capita, higher values denote greater contributions, warranting selection of the maximum standardized value. These optimal values are detailed in Table 1.
2.4.2. Calculating Niche-Fitness Values for Human Settlement Quality Subsystems
Based on prior analysis and incorporating Li Zizhen’s research framework, this study employs Equation (7) to calculate the niche fitness across three subsystems. The urban human settlement niche fitness measures the proximity between actual conditions and optimal benchmarks for economic, social, and ecological indicators. This metric reflects how effectively cities provide quality economic development, social living conditions, and ecological environments for residents. These calculated niche fitness values demonstrate each subsystem’s performance relative to ideal standards.
where Fi is ecological niche fitness values for subsystem of urban settlements quality for the i-th city; ε is a constant, where ε ∈ [0, 1], and we chose it as 0.5 here for convenience; βj represents the weight of indicators; xaj′ represents the optimum value of indicators; xij′ is the same meaning as above.
2.4.3. Evaluating Human Settlement Quality Through Comprehensive Niche-Fitness Values
The calculated niche-fitness values of the three subsystems individually reflect specific aspects of urban human settlements quality. However, relying solely on single-system evaluations provides incomplete assessments. To enable a comprehensive evaluation, this study integrated all subsystems through weighted aggregation. Differential weights were assigned to each subsystem according to their niche-fitness values using the entropy weight method (as summarized in Table 1). By employing Equation (8), comprehensive niche-fitness values were generated to holistically represent the overall quality of urban human settlements. This integrated approach supports a balanced and multidimensional assessment of settlement environments across all studied cities.
where Si represent comprehensive value of ecological niche fitness for urban human settlement quality; βk represent weighting values for the k-th subsystem’s ecological niche fitness; Fi represents ecological niche fitness, an indicator of the quality of the i-th urban settlements; n′ is the number of indicator ecological niche fitness.
3. Results
3.1. Niche-Fitness Values and Evolutionary Trajectories of Cities Across Subsystems
The niche-fitness values across economic, social, and ecological subsystems for nine cities in the WMA during 2014–2022 were calculated following Equation (7), and the results were summarized in Table 2. In the economic dimension, Wuhan consistently achieved the highest performance, though its dominance gradually diminished over time. In 2014, all other cities fell below the regional average of 0.690, a trend that continued in 2018 and 2022, with averages of 0.770 and 0.653, respectively. Social conditions similarly reflected Wuhan’s leading position, with subsystem averages of 0.700 in 2014, 0.710 in 2018, and 0.679 in 2022. Ecological quality exhibited greater volatility: Tianmen led in 2014, Xiaogan in 2018, and Huangshi in 2022, with corresponding subsystem averages of 0.653, 0.591, and 0.598. Cities such as Xiantao and Qianjiang consistently ranked at the bottom across multiple years, with values roughly half of those of the top performers. Throughout the study period, the WMA displayed pronounced spatial and temporal variations across all subsystems. While economic disparities showed signs of convergence over time, social conditions revealed the most marked inequality, and ecological performance exhibited both high volatility and persistent gaps among cities. These findings underscore the enduring multidimensional development imbalances within the metropolitan area.
Table 2.
Niche fitness values for human settlement quality across subsystems in the WMA.
Based on the data presented in Table 2, Figure 3 groups the nine WMA cities into three clusters: (a) Wuhan, Huangshi, and Ezhou; (b) Xiaogan, Huanggang and Xianning; and (c) Xiantao, Tianmen, and Qianjiang. This grouping enables comparative analysis and visual representation of subsystem quality evolution from 2014 to 2022. In the economic dimension, Wuhan sustained its dominance with consistently high niche-fitness values, whereas other cities generally followed an initial growth-decline trajectory. Notably, Ezhou experienced the most pronounced economic decrease, dropping from 0.686 to 0.539 (∆ = −0.147). Social environment quality revealed three evolutionary trends: Wuhan, Xiaogan, Xiantao, and Tianmen exhibited continuous declines, with Tianmen showing the sharpest decrease of 0.269; Ezhou, Huanggang, Xianning, and Qianjiang displayed inverted U-shaped trajectories; while Huangshi demonstrated steady improvement, rising from 0.465 to 0.675 (∆ = +0.210). Ecological quality displayed greater variability: Huangshi and Xiantao showed consistent improvement, with Huangshi increasing from 0.619 to 0.750 (∆ = +0.131). Most cities experienced fluctuations—Wuhan, Huangshi, Ezhou, Huanggang, and Tianmen declined initially but recovered, while Xiaogan and Xianning rose then fell. Qianjiang displayed continuous deterioration, dropping from 0.710 to 0.511 (∆ = −0.199), representing the most substantial decrease observed. These findings highlight the heterogeneous and path-dependent nature of urban development trajectories across the WMA, with significant implications for targeted regional policy interventions.
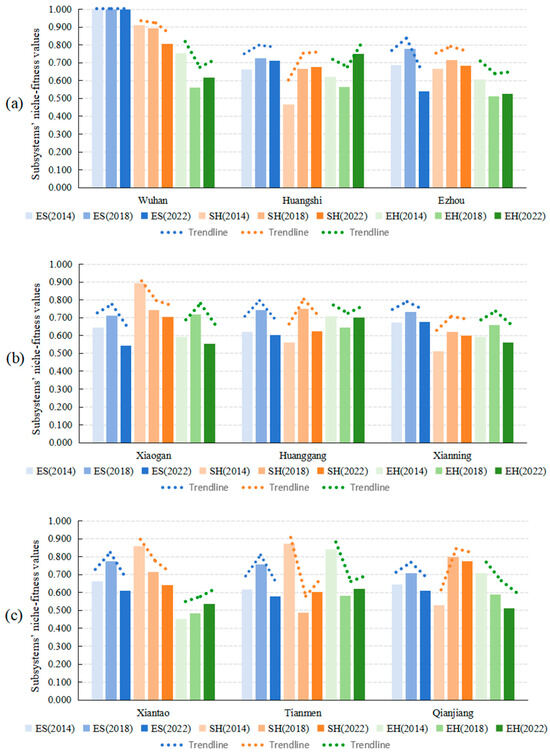
Figure 3.
Temporal variation of niche-fitness values across WMA subsystems (2014–2022): (a) Wuhan, Huangshi and Ezhou; (b) Xiaogan, Huanggang and Xianning; (c) Xiantao, Tianmen and Qianjiang.
3.2. Comprehensive Human Settlement Quality of Cities
Comprehensive human settlement quality metrics for each city were calculated using Equation (8) to aggregate weighted niche-fitness values across subsystems (Figure 3). The analysis revealed distinct spatial stratification and temporal evolution among the nine cities during 2014–2022. Specifically, in 2014, clear stratification emerged among the nine cities. Wuhan led with a niche-fitness value of 0.901, exceeding the lowest-performing city of Huangshi by 1.5 times. Five cities including Ezhou, Huanggang, Qianjiang, Xianning, and Huangshi fell below the regional average of 0.683, revealing significant development disparities. By 2018, Wuhan maintained leadership with a human settlement quality score of 0.844, exceeding last-ranked Tianmen by 1.4 times. Five cities including Ezhou, Xiantao, Xianning, Huangshi, and Tianmen fell below the regional average of 0.700, demonstrating persistent quality disparities. The 2022 assessment showed Wuhan maintaining its leading position with a score of 0.824, with Huangshi rising to second position. Six cities including Huanggang, Xianning, Xiaogan, Xiantao, Tianmen, and Ezhou fell below the regional average of 0.649, maintaining a 1.4-times gap between highest and lowest performers. Longitudinal analysis reveals two key trends: the regional average declined by 0.034, indicating overall quality deterioration, while the disparity ratio between highest- and lowest-performing cities narrowed from 1.5 to 1.4, suggesting gradual convergence despite the general downward trend. These patterns highlight both persistent challenges and evolving dynamics in the WMA’s human settlement development.
Furthermore, Figure 4 incorporated trend lines to visually track each city’s human settlement quality changes from 2014 to 2022. The analysis reveals three distinct temporal patterns: sustained declines, inverted U-shaped trajectories (initial improvement followed by deterioration), and consistent improvements. These differentiated pathways highlight varying urban development dynamics across the metropolitan region during the study period. First, four cities showed sustained declines. Wuhan experienced an 8.55% reduction, while decreases of 12.08%, 16.53%, and 22.91% were observed in Xiantao, Xiaogan, and Tianmen, respectively, revealing significant deterioration across these urban centers. Second, an inverted U-shaped trajectory characterized four cities—Ezhou, Huanggang, Xianning, and Qianjiang—which peaked in 2018 with values of 0.685, 0.721, 0.669, and 0.713, respectively, followed by subsequent declines, reflecting unsustained medium-term improvements. Third, Huangshi demonstrated consistent improvement with a notable 23.6% increase over the study period, representing the only positive trajectory observed. These differentiated pathways highlight the heterogeneous development dynamics across the metropolitan region, underscoring the need for targeted policy interventions adapted to local contextual factors.
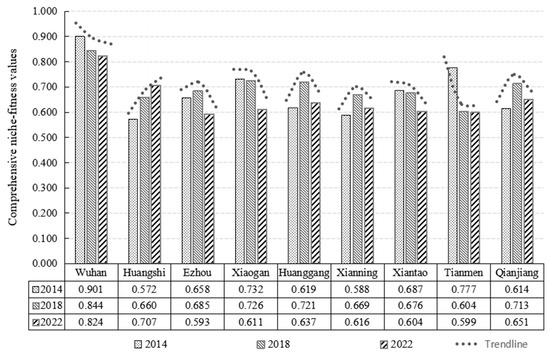
Figure 4.
Comprehensive niche-fitness values of human settlement quality across the WMA cities.
4. Discussion
4.1. Integrated Analysis of Subsystem Dynamics and Comprehensive Settlement Quality
The comprehensive evaluation of human settlement quality through niche-fitness values reveals distinct developmental pathways across both subsystem dimensions and integrated assessments in the WMA.
Analysis of economic, social, and ecological subsystems reveals significant intra-regional disparities characterized by divergent trajectories among cities and across dimensions. Economically, Wuhan maintained consistent superiority, while other cities exhibited rise-then-fall patterns—initially benefiting from policy dividends but subsequently declining due to unsustainable growth models and delayed industrial upgrading. This trend signals weakened economic competitiveness in most cities and insufficient endogenous capacity to withstand economic fluctuations and low-carbon transition pressures. Social development displayed three trajectories: declining trends in Wuhan, Xiaogan, Xiantao, and Tianmen indicated growing institutional or resource constraints; rise-then-fall patterns in Ezhou, Huanggang, Xianning, and Qianjiang suggested early gains were undermined by subsequent socio-environmental changes; while Huangshi’s continuous improvement demonstrated effective adaptive governances. Ecologically, Huangshi and Xiantao achieved sustained progress through improved environmental management; Wuhan, Ezhou, Huanggang, and Tianmen rebounded after initial declines; while Xiaogan, Xianning, and Qianjiang exhibited persistent deterioration due to structural resource challenges. Based on multidimensional performance, cities form three categories: Wuhan exemplifies coordinated development despite slightly lagging eco-environmental metrics; Huanggang and Xianning maintain balanced progress across development aspects; while the remaining cities show significant subsystem disparities, particularly ecological deficiencies, revealing unbalanced development patterns. These heterogeneous trajectories underscore the need for context-specific governance tailored to local conditions. The prevalence of rise-then-fall patterns highlights the importance of sustaining early gains through long-term planning and institutional capacity building. The persistent ecological challenges in most cities indicate the need for green transition that balance developmental and environmental objectives. These findings emphasize that effective metropolitan governance requires differentiated policies that address specific developmental constraints and opportunities across the urban hierarchy.
Assessment of human settlement quality across the WMA reveals dynamic yet volatile development trajectories between 2014 and 2022, characterized by significant temporal fluctuations and divergent pathways among cities. The initial 2014 assessment established a clear three-tier hierarchy: Wuhan as the sole high-quality settlement (>0.800), four medium-quality cities including Tianmen, Xiaogan, Xiantao, and Ezhou scoring 0.650–0.800, and the remaining cities in the low-quality category (<0.650). By 2018, significant improvement emerged as seven cities attained medium-quality status—including newly elevated Huangshi, Huanggang, Qianjiang, and Xianning alongside sustained performers Xiaogan, Xiantao, and Ezhou—while Tianmen remained the sole low-quality city. However, this progress proved transient as the 2022 assessment showed regression: only Wuhan maintained high-quality status, Huangshi and Qianjiang preserved medium-quality standing, while six cities declined to low-quality levels. Notably, Huangshi demonstrated the study’s sole sustained positive trajectory through integrated ecological planning, industrial restructuring, and pollution control measures, successfully balancing developmental and environmental objectives. In contrast, other cities exhibited either continuous deterioration or inverted U-shaped patterns due to rapid urbanization, industrial pollution, insufficient ecological investment, and uneven resource allocation. Even regional leader Wuhan experienced an 8.55% quality reduction, indicting systemic challenges across the metropolitan area. These divergent pathways—where most cities failed to maintain earlier gains—highlight the inadequacy of conventional growth-oriented approaches. The findings underscore the need for coordinated, context-sensitive strategies that leverage integrated models like Huangshi’s to promote sustainable human settlement development across the metropolitan region.
4.2. Spatiotemporal Patterns of Human Settlement Quality in the WMA Using GIS
This study employs Geographic Information System (GIS) spatial analysis to visualize and assess the spatiotemporal patterns of human settlement quality across the WMA based on comprehensive niche-fitness values. The spatial visualization enables effective identification of distinct spatial differentiation characteristic through detailed classifications, revealing inter-city settlement disparities and tracking evolutionary trajectories across different development phases. Figure 5 presents the results of the spatiotemporal analysis, demonstrating distinct patterns from 2014 to 2022. Specifically, Figure 5a illustrates the 2014 spatial distribution, presenting a clear west–east gradient with higher values in western areas and a pronounced north–south differential, establishing a distinct core-periphery structure centered on Wuhan. Figure 5b displays the 2018 distribution, indicating improved overall conditions with a persistent north–south gradient, though regional disparities showed some reduction. Figure 5c reveals the 2022 distribution, demonstrating a concerning regional decline and regression in settlement conditions across the metropolitan area. Comprehensively, a clear core-periphery diffusion pattern of overall human settlement quality emerged, characterized by Wuhan’s consistent superior performance as the regional center while quality progressively diminishes in outward radiating gradients. Although the hierarchical core-periphery structure persisted throughout the entire study period, the inter-city disparities measured by the range between maximum and minimum values exhibited a gradual narrowing trend over time, indicating a converge of spatial differences. These patterns demonstrate both reduced inequality across the metropolitan area and concerning settlement deterioration in multiple cities, highlighting the need for differentiated regional development strategies. The GIS-based spatial analysis not only provides intuitive comparative visualization but also offers robust data support for regional coordination planning. This methodology effectively identifies spatial imbalances and optimization opportunities throughout the urban agglomeration, contributing to evidence-based policy formulation for sustainable regional development.
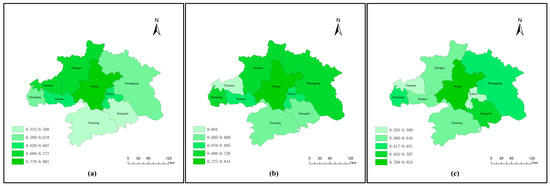
Figure 5.
Spatial distribution of comprehensive niche-fitness values for human settlement quality in the WMA: (a) in 2014; (b) in 2018; (c) in 2022.
4.3. Policy Implication
Based on the evaluation results above, we propose the following policy recommendations for optimizing urban human settlements in WMA.
First, it is necessary to promote coordinated urban development across WMA. Coordinated urban development serves as a fundamental prerequisite for high-quality regional growth by enabling the identification of development constraints, addressing resource allocation imbalances, and establishing conditions for sustainable progress [56]. The observed spatial-temporal patterns and evolving disparities—evidenced by the narrowing yet persistent development gap between highest and lowest performing cities decreasing from 0.329 in 2014 to 0.240 in 2018 and 0.231 in 2022—necessitate a comprehensive approach to regional coordination. Key strategies should focus on establishing cross-jurisdictional cooperation mechanisms for joint ecological management to address pollution and enhance settlement quality, while strengthening economic collaboration through innovation investment and resource sharing to boost industrial competitiveness. Additionally, targeted interventions are required to accelerate human settlement construction in lagging cities. These integrated approaches will promote efficient production systems via economic integration, create livable communities by reducing disparities, and maintain healthy ecosystems through coordinated environmental governance—collectively advancing sustainable regional development.
Second, the radiative and catalytic effects of major cities should be fully harnessed. Despite declining overall quality, Wuhan’s sustained top performance positions it to lead reginal coordinated and effective development. Wuhan’s regional influence can be maximized through three strategic priorities. Economically, it is necessary to industrial transformation—upgrading traditional sectors while cultivating emerging industries and competitive manufacturing clusters. Socially, Wuhan’s consistent leadership (0.910 in 2014, 0.893 in 2018, and 0.807 in 2022) should guide regional integration of high-quality education, healthcare, and cultural infrastructure. Environmentally, cities should emulate Tianmen’s exemplary performance (0.621 in 2022) through collaborative ecological conservation and green network development. This multidimensional approach leverages each city’s comparative advantages while addressing Wuhan’s declining trends through mutually reinforcing regional development.
Third, to promote coordinated regional development, tailored strategies should be implemented based on each city’s comparative advantages. Economically, while Wuhan maintained stable performance, Ezhou (0.148 decline) require targeted interventions—Ezhou should captitalize on its transportation hub to develop logistics and production services. Additionally, Tianmen should leverage its agricultural and textile strengths. Qianjiang could integrate its chemical, clothing and agricultural sectors to drive rural incomes. Huangshi and Xiaogan could upgrade traditional industries through smart and green technologies. Huanggang could optimize its agricultural supply chain, while Xianning could develop healthcare tourism using its ecological and cultural assets. Xiantao could focus on building an integrated textile industry cluster. These customized approaches address specific local conditions while contributing to balanced regional growth. Socially, Huangshi showed notable improvement (0.210 increase) and Ezhou modest gains (0.018), indicating effective social policies, while most cities declined—particularly Tianmen (0.269 decrease). To address these inequalities, all cities should strengthen social security systems, ensuring comprehensive coverage for pensions, healthcare, and unemployment. Simultaneously, enhanced legal frameworks and enforcement mechanisms should be implemented to promote social equity, thereby raising overall living standards across the region. Environmentally, Huangshi (0.131 increase) and Xiantao (0.085 increase) performed notable improvements in ecological niche fitness. However, most cities experienced declines, particularly Tianmen with a substantial 0.221 decrease. These trends highlight the need for cities to emulate Huangshi and Xiantao’s successful environmental strategies while adapting proven approaches to local contexts through tailored conservation policies and targeted ecological protection measures.
4.4. Limitations and Research Prospects
This study has several limitations that warrant acknowledgement. First, while the evaluation incorporated 21 indicators across economic, social and ecological dimensions, the complexity of urban settlement systems suggests that additional ecological factors—such as water resource availability, soil quality, and waste management efficiency—could enhance assessment comprehensiveness. Second, reliance on provincial statistical yearbooks and environmental bulletins may introduce constraints related to data timeliness and accuracy. Third, although entropy weighting was employed to minimize subjectivity, certain subjective elements persist in indicator selection and weight allocation. Future research should pursue the following directions for methodological enhancement: (1) indicator system optimization through incorporating supplementary ecological metrics, including water resources, soil conditions, waste management, and microclimatic variables such as temperature and humidity, to improve evaluation comprehensiveness; (2) data collection innovation by integrating advanced technologies such as remote sensing and IoT-based real-time monitoring systems to enhance data accuracy and temporal resolution; and (3) analytical method advancement employing GIS-based spatial distribution mapping complemented by spatial autocorrelation and hotspot analysis to identify aggregation patterns and core-periphery structures, thereby expanding analytical depth and multidimensional insight. These improvements will contribute to more robust and nuanced assessments of human settlement quality, supporting informed decision-making for sustainable urban development.
5. Conclusions
Urban human settlement represents a fundamental component of sustainable urbanization, directly influencing resource efficiency, socioeconomic progress, and resident wellbeing. Based on ecological niche fitness theory, this study develops a comprehensive evaluation system consisting of 21 core indicators across economic, social, and ecological dimensions to assess human settlement quality in nine cities within the WMA from 2014 to 2022. Findings indicate that Huangshi alone achieved an upward trend in settlement quality, while other cities exhibited either declining trends—as observed in Wuhan, Xiaogan, Xiantao and Tianmen—or inverted U-shaped trends, as seen in Ezhou, Huanggang, Xianning and Qianjiang. Spatial analysis revealed a distinct core-periphery structure, with settlement quality concentrically decreasing outward from Wuhan’s urban core. Although inter-city disparities have gradually narrowed, suggesting a trend toward spatial convergence, Wuhan itself experienced a measurable decline in quality, indicating a gradual erosion of its core regional advantages. This study provides actionable policy recommendations to advance sustainable urbanization by identifying and addressing resource scarcity and pollution challenges. By developing an empirical basis for enhancing ecological security and quality of life, it offers evidence-supported planning strategies to foster balanced and resilient regional development.
Author Contributions
W.P. performed the conceptualization, methodology, validation, review and editing. C.J. performed the investigation, formal analysis, data curation, and original draft preparation. X.C. supervised the research. X.W. collected data and made data curation. All authors have read and agreed to the published version of the manuscript.
Funding
This research was funded by the Fundamental Research Funds for the Provincial Department of Education in Hubei (23Q106) and the Innovation Demonstration Base of Ecological Environment Geotechnical and Ecological Restoration of Rivers and Lakes (2020EJB004).
Data Availability Statement
The data associated with this research may be accessed by contacting the corresponding author under reasonable conditions.
Acknowledgments
We would like to thank the editors and reviewers for their valuable comments.
Conflicts of Interest
The authors declare no conflicts of interest.
References
- Limmatola, A.; Botte, M. An Overview of Tools and Methods for the Research Field of Urban Sustainable Development. In International Symposium: New Metropolitan Perspectives; Springer Nature: Cham, Switzerland, 2024; pp. 29–37. [Google Scholar]
- Luo, X.; Luan, W.; Yang, J.; Shi, Z.; Lin, Q.; Liu, Z.; Cao, G. Spatial heterogeneity of human settlements suitability from multidimensional perspectives in 31 provincial capital cities of China. Humanit. Soc. Sci. Commun. 2024, 11, 1562. [Google Scholar] [CrossRef]
- Gao, X.X.; Zhang, X.T.; He, Z. The evolution and practice of urban and human settlements issues: The background and implementation progress of SDG11. Chin. J. Popul. Resour. Environ. 2021, 31, 144–154. (In Chinese) [Google Scholar]
- Jia, P. Transformation of urban park green space management and operation from the perspective of public goods and fiscal sustainability. Landsc. Archit. 2025, 32, 14. (In Chinese) [Google Scholar] [CrossRef]
- Tian, S.; Zhang, Y.; Li, X.; Yang, J.; Li, H.; Cong, X.; Sun, H. Theory and practice, integration and development of human settlements geography. Dili Xuebao/Acta Geogr. Sin. 2024, 79, 2115–2140. [Google Scholar]
- Xu, Z.; Luo, J. Sustainable Urbanization: Unpacking the Link Between Urban Clusters and Environmental Protection. Sustainability 2025, 17, 873. [Google Scholar] [CrossRef]
- Zhao, X. Grasping the practical path of promoting coordinated regional development in the new era. Zhongzhou Acad. J. 2024, 08, 22–30. (In Chinese) [Google Scholar]
- Wang, Y.T.; Wang, X.R.; Dou, Z. Application exploration of urban living environment quality evaluation index system: A practice based on urban physical examination pilot. J. West. China Habitat Stud. 2021, 36, 50–56. (In Chinese) [Google Scholar]
- Doxiadis, C.A. Action for human settlements. Ekistics 1975, 40, 405–448. [Google Scholar]
- Wu, L.Y. Introduction to the Science of Human Settlements; China Architecture & Building Press: Beijing, China, 2001. (In Chinese) [Google Scholar]
- Qu, S.; Jiang, Y.; Gao, J.; Wang, L.; Chen, Q.; Zhang, Y.; Huang, F. Revealing the Coupling Coordination of Social–Ecological System Resilience: Insights From the Southwest Karst Rural Area, China. Land Degrad. Dev. 2025, 36, 1255–1268. [Google Scholar] [CrossRef]
- Chen, J. Temporal-spatial assessment of the vulnerability of human settlements in urban agglomerations in China. Environ. Sci. Pollut. Res. 2023, 30, 3726–3742. [Google Scholar] [CrossRef]
- Lei, Y.; Xiao, Y.; Wang, F.; Wang, R.; Huang, H. Investigation on the complex relationship between urbanization and eco-efficiency in urban agglomeration of China: The case study of Chengdu-Chongqing urban agglomeration. Ecol. Indic. 2024, 159, 111704. [Google Scholar] [CrossRef]
- Cong, X.; Li, X.; Li, S.; Gong, Y. Research on Sustainable Development Ability and Spatial-Temporal Differentiation of Urban Human Settlements in China and Japan Based on SDGs, Taking Dalian and Kobe as Examples. Complexity 2021, 2021, 8876021. [Google Scholar] [CrossRef]
- Zhang, T.; Hu, Q.; Zhou, D.; Gao, W.; Fukuda, H. Ecological carrying capacity evaluation for villages’ spatial planning in rural revitalization strategy in gully regions of the Loess Plateau (China). J. Asian Archit. Build. Eng. 2023, 22, 1746–1762. [Google Scholar] [CrossRef]
- Jin, S.; Zhao, D.; Bao, B. Dynamic evaluation and obstacle factor diagnosis of rural human settlements quality in the Dabie mountains old revolutionary Base area under the background of rural revitalization. Habitat Int. 2025, 156, 103256. [Google Scholar] [CrossRef]
- Li, Y.; Mao, Z.Y.; Ke, W.L. Comprehensive evaluation of the living environment quality in Fuzhou City. J. Huazhong Norm. Univ. (Nat. Sci. Ed.) 2024, 58, 433–442. (In Chinese) [Google Scholar]
- Guo, Y.; Chen, P.; Zhu, Y.; Zhang, H. Study on comprehensive evaluation of human settlements quality in Qinghai Province, China. Ecol. Indic. 2023, 154, 110603. [Google Scholar] [CrossRef]
- Fan, Y.M.; Luo, T.Y.; Li, K.M. Evaluation of rural living environment quality and its spatiotemporal differentiation characteristics in Guangxi counties. Chin. J. Agric. Resour. Reg. Plan. 2023, 44, 167–178. (In Chinese) [Google Scholar]
- Bao, J.; Zhang, Y.; Li, X.; Guo, Q. From survival to self-actualization: Evaluation of urban human settlement quality from the perspective of Maslow’s hierarchy of needs—A case study of Anhui Province. Urban Dev. Stud. 2020, 27, 88–95+140. (In Chinese) [Google Scholar]
- Liang, C.; Li, J.P.; Li, J.J. Evaluation and optimization of the coordination degree between rural living environment quality and economic development in China based on the “three lives” functions. Chin. J. Agric. Resour. Reg. Plan. 2021, 42, 19–30. (In Chinese) [Google Scholar]
- Zhong, Y.; Zha, H.Y.; Wu, Z.P. Evaluation of living environment quality and its spatial differentiation in the Chang-Zhu-Tan city cluster. Res. Soil Water Conserv. 2024, 31, 365–375. (In Chinese) [Google Scholar]
- Bielecka, K. Assessment of quality of living environment based on interdisciplinary research methods—Selected examples. In IOP Conference Series: Materials Science and Engineering; IOP Publishing Ltd.: Bristol, UK, 2019; Volume 471, p. 072035. [Google Scholar]
- Li, X.; Gao, M.; Li, H.; Hou, X.; Tian, S.; Yang, J.; Zhang, X. Spatio-temporal evolution and obstacle diagnosis of human settlements based on the “production-living-ecological” functions. Sci. Rep. 2024, 14, 31022. [Google Scholar] [CrossRef]
- Feng, W.; Lu, H.; Xiang, M. Evaluation of the natural suitability of human settlements in the Western Sichuan Plateau region of China. Sci. Rep. 2025, 15, 1552. [Google Scholar] [CrossRef]
- Xue, Q.-R.; Yang, X.-H. Evaluation of the suitability of human settlement environment in Shanghai city based on fuzzy cluster analysis. Therm. Sci. 2020, 24, 2297–2314. [Google Scholar] [CrossRef]
- Liu, H.; Yang, Q.; Chen, B.; Zhou, L.; Wang, W. Spatial and temporal evolution and influencing factors of human settlement environment quality in Xinjiang, China. Sci. Rep. 2025, 15, 16543. [Google Scholar] [CrossRef]
- Zou, Y.; Rao, Y.; Luo, F.; Yi, C.; Du, P.; Liu, H.; Zhou, Y. Evolution of rural settlements and its influencing mechanism in the farming-pastoral ecotone of Inner Mongolia from a production-living-ecology perspective. Habitat Int. 2024, 151, 103137. [Google Scholar] [CrossRef]
- Sun, Y.; Zhan, H.; Gao, C.; Li, H.; Guo, X. Spatial Syntactic Analysis and Revitalization Strategies for Rural Settlements in Ethnic Minority Areas: A Case Study of Shuanglang Town, China. Buildings 2024, 14, 2531. [Google Scholar] [CrossRef]
- Song, F.; Yang, X.; Wu, F. Suitable pattern of the natural environment of human settlements in the lower reaches of the Yangtze river. Atmosphere 2019, 10, 200. [Google Scholar] [CrossRef]
- Wu, P.; Li, Y.; Guan, C.; Xiao, C. Measurement and spatio-temporal differentiation of human settlement quality in the Chengdu–Chongqing urban agglomeration based on ESDA-GIS. China Soft Sci. 2018, 10, 93–108. (In Chinese) [Google Scholar]
- Li, J.; Gong, J.; Guldmann, J.-M.; Yang, J. Assessment of urban ecological quality and spatial heterogeneity based on remote sensing: A case study of the rapid urbanization of Wuhan City. Remote Sens. 2021, 13, 4440. [Google Scholar] [CrossRef]
- Shen, S.; Ma, Y.; Hu, T. Evaluation of urban human settlement quality based on multi-source data. J. Hum. Settl. West China 2022, 37, 48. (In Chinese) [Google Scholar]
- Zhou, H.; Na, X.; Li, L.; Ning, X.; Bai, Y.; Wu, X.; Zang, S. Suitability evaluation of the rural settlements in a farming-pastoral ecotone area based on machine learning maximum entropy. Ecol. Indic. 2023, 154, 110794. [Google Scholar] [CrossRef]
- Takola, E.; Schielzeth, H. Hutchinson’s ecological niche for individuals. Biol. Philos. 2022, 37, 25. [Google Scholar] [CrossRef]
- Carroll, I.T.; Cardinale, B.J.; Nisbet, R.M. Niche and fitness differences relate the maintenance of diversity to ecosystem function. Ecology 2011, 92, 1157–1165. [Google Scholar] [CrossRef]
- Liu, C.Y.; Zhang, J.F. Land suitability evaluation using niche model for rural settlements in typical county in the upper reaches of Minjiang River. Trans. Chin. Soc. Agric. Eng 2021, 37, 266–273. [Google Scholar]
- Hou, L.; Cui, M. A new insight to investigate the developmental resilience of Chengdu-Chongqing twin-city economic circle based on ecological niche theory. J. Asian Archit. Build. Eng. 2024, 24, 4213–4225. [Google Scholar]
- Xie, X.; Liu, X.; Blanco, C. Evaluating and forecasting the niche fitness of regional innovation ecosystems: A comparative evaluation of different optimized grey models. Technol. Forecast. Soc. Chang. 2023, 191, 122473. [Google Scholar] [CrossRef]
- Ma, Y.; Fang, Y.; Liu, J. Research on the Impact of Digital Innovation Ecosystem Niche Suitability for High-Quality Economic Development. Systems 2025, 13, 352. [Google Scholar] [CrossRef]
- Shi, P.; Lu, Z.; Zhou, M.; Wang, N.; Wu, Y. Niche Suitability Evaluation and Path Selection for the High-Quality Development of Cities in the Yellow River Basin. Int. J. Environ. Res. Public Health 2023, 20, 3727. [Google Scholar] [CrossRef] [PubMed]
- Wang, L.L. Comparative analysis of urban ecological niche suitability—Taking 13 cities in Jiangsu Province as an example. Mod. Urban Res. 2007, 22, 73–80. (In Chinese) [Google Scholar]
- Xu, D.; Sun, T. Research on comprehensive evaluation on effects of synergistic governance on urban environmental pollution based on the evaluation model of niche suitability. Int. J. Environ. Pollut. 2023, 72, 40–55. [Google Scholar] [CrossRef]
- Xiao, J.; Liao, Y.; Hou, R.; Peng, W.; Dan, H. Evaluation and prediction of regional innovation ecosystem from the perspective of ecological niche: Nine cities in Hubei Province, China as the cases. Sustainability 2024, 16, 4489. [Google Scholar] [CrossRef]
- Luo, Y.; Sun, F.; Yan, X.; Sun, T. Research on comprehensive assessment of effect on environmental pollution collaborative treatment: Taking China’s Yangtze River Delta Urban Agglomeration as an example. Pol. J. Environ. Stud. 2022, 31, 5151–5162. [Google Scholar] [CrossRef]
- Yao, Z. Coordinated development practice of urban architectural design and urban and rural planning based on ecological niche theory. Eng. Prog. 2023, 3, 89–92. [Google Scholar] [CrossRef]
- Feng, Y.; Zhen, J. Comprehensive suitability evaluation and spatial optimization of human settlements environment in Inner Mongolia. J. Geo-Inf. Sci 2022, 24, 1204–1217. [Google Scholar]
- Tan, M.J.; Yan, L.J.; Li, H.B. Quantitative evaluation model of urban human settlement quality based on ecological niche suitability and its application. Bull. Sci. Technol. 2007, 23, 439–445. (In Chinese) [Google Scholar]
- Zhao, H.B.; Gu, T.S.; Sun, D.Q.; Miao, C.H. Dynamic evolution and mechanism of human settlement environment in Yellow River Basin cities from the perspective of “San Sheng” functions. Acta Geogr. Sin. 2023, 78, 2973–2999. (In Chinese) [Google Scholar]
- Zhang, Z.; Wei, Z.Q. Research and application of the urban human settlement evaluation system. Ecol. Environ. 2006, 15, 198–201. (In Chinese) [Google Scholar]
- Li, S.; Wei, H.; Ni, X.; Gu, Y.; Li, C. Evaluation of urban human settlement quality in Ningxia based on AHP and the entropy method. Chin. J. Appl. Ecol. 2014, 25, 2700–2708. [Google Scholar]
- Shannon, C.E. A mathematical theory of communication. Bell Syst. Tech. J. 1948, 27, 379–423. [Google Scholar] [CrossRef]
- Qiao, J.J. Application of improved entropy method in Henan sustainable development evaluation. Resour. Sci. 2004, 26, 113–119. (In Chinese) [Google Scholar]
- Sun, X.; Chu, D.; Li, Q.; Shi, Y.; Lu, L.; Bi, A. Dynamic successive assessment of Rural Human Settlements Environment in China. Ecol. Indic. 2023, 157, 111177. [Google Scholar] [CrossRef]
- Lin, S.; Hou, L. SDGs-oriented evaluation of the sustainability of rural human settlement environment in Zhejiang, China. Heliyon 2023, 9, e13492. [Google Scholar] [CrossRef] [PubMed]
- Yin, H.; Zhang, Z.; Wan, Y.; Gao, Z.; Guo, Y.; Xiao, R. Sustainable network analysis and coordinated development simulation of urban agglomerations from multiple perspectives. J. Clean. Prod. 2023, 413, 137378. [Google Scholar] [CrossRef]


Disclaimer/Publisher’s Note: The statements, opinions and data contained in all publications are solely those of the individual author(s) and contributor(s) and not of MDPI and/or the editor(s). MDPI and/or the editor(s) disclaim responsibility for any injury to people or property resulting from any ideas, methods, instructions or products referred to in the content. |
© 2025 by the authors. Licensee MDPI, Basel, Switzerland. This article is an open access article distributed under the terms and conditions of the Creative Commons Attribution (CC BY) license (https://creativecommons.org/licenses/by/4.0/).